
Abstract
Subcortical stroke may cause widespread structural changes to the cerebral cortex in multiple domains; however, the details of this process remain unclear. In this prospective observational study, we acquired two datasets to investigate the effect of lesion location on cortical structure. One was cross-sectional, comprising 269 patients with chronic stroke, either capsular stroke (CS) or pontine stroke (PS), and the other was longitudinal, comprising 119 patients with CS or PS. In the chronic-stage data, both CS and PS exhibited reduced cortical thickness in the precentral gyrus and increased cortical thickness and area in the frontal, temporal, occipital and insular cortices. Cortical thicknesses were correlated with motor outcomes in the precentral and lingual gyri, and early impairment of the corticospinal tract was associated with cortical thickness in the middle frontal gyrus. In the longitudinal dataset, CS showed gradually decreasing cortical thickness in the precentral gyrus, and both CS and PS showed gradually increasing cortical thickness and area in regions with significant structural reorganization. Subcortical stroke can therefore cause complex cortical structural changes in multi-domain regions involved in motor, primary and higher cognitive areas and have different evolution patterns depending on the subcortical level of the lesion affecting the motor pathways.
Introduction
Neuroimaging studies indicate that subcortical stroke can not only cause structural damage in distant cortical areas,1,2 but can also cause these areas to reorganize themselves to facilitate motor recovery.3,4 Capsular stroke (CS) and pontine stroke (PS) are the most frequent types of subcortical stroke. They both involve the subcortical motor pathway but impair different adjacent structures. In recent decades, morphometric studies based on structural MRI have focused on exploring changes in gray-matter volume 5 and/or structural connectivity 6 in CS versus PS patients. Gray-matter volume is a composite indicator affected by both cortical thickness and surface area, and since the independent measures cortical thickness and surface area can provide more information, 7 the separate measures should be used in combination to characterize cortical structural changes. 8 In patients with subcortical stroke, previous studies have demonstrated cortical structural damage in the ipsilesional sensorimotor cortex 9 and cortical structural reorganization in the contralesional superior frontal and insular regions. 10 These findings suggest that subcortical stroke may cause cortical structural changes in multiple domains across the whole brain. Nevertheless, it remains unclear whether the patterns of cortical structural damage, reorganization and prognostic characteristics are identical or distinct in patients with CS versus PS. Many studies have associated cortical structural changes with neurological 11 or motor 12 outcomes in patients with subcortical stroke. These studies focus on the correlation between cortical structural changes and motor outcomes in stable, chronic (>6 months) patients with subcortical stroke to explore the possible role of cortical structural reorganization in motor recovery. This information may be helpful in understanding the mechanisms of neurological recovery after CS or PS. However, it remains unknown whether there are common rehabilitation target areas in all patients with subcortical stroke that can be pivotal for understanding neural recovery mechanisms and designing common rehabilitative strategies for subcortical stroke.
The integrity of the corticospinal tract (CST) is an important factor in the variation of structural damage and reorganization observed in the chronic stage, because different levels and degrees of CST damage may result in different cortical structural changes. 13 Nevertheless, we know little of the exact relationship between early impairment of the CST and chronic cortical structural changes in patients with CS or PS. Identifying these correlations will be helpful in exploring the neural mechanisms of long-term motor impairment in these patients.
Another unknown is the evolutionary pattern of cortical structural damage and reorganization in patients with CS or PS. A dynamic cortical structural reorganization occurs in the frontal, temporal and occipital regions in patients with complete recovery, 14 and progressive gray-matter atrophy occurs in PS patients. 15 We hypothesized that the evolutionary trajectories of cortical structural changes differ between patients with CS versus PS, but that some commonalities may exist. To verify this hypothesis and support the development of effective rehabilitation strategies for subcortical stroke, we aimed to: (a) identify cortical structural alterations in chronic patients with CS or PS and to compare these patient groups to uncover the similarities and differences in these alterations; (b) uncover the correspondences of chronic cortical structural changes with motor recovery and early CST impairment in these patients; and (c) explore the evolutionary patterns of cortical structural changes in patients with CS and PS.
Material and methods
Participants
The experimental protocol was approved by the Medical Research Ethics Committee of Tianjin Medical University General Hospital, ethical guidelines according to Tianjin Medical University General Hospital were followed, and written informed consent was obtained from each participant before the study. This study used two datasets recorded from patients with subcortical ischemic stroke recruited from four hospitals. Dataset 1 comprised patients with CS, patients with PS, and healthy controls and was used to identify chronic cortical structural changes occurring after subcortical stroke, their differences between patients with CS and those with PS, and their relationship with motor recovery and early impairment of the CST. Diffusion-weighted imaging (DWI) data in the acute stage (≤7 days) were available as a result of clinical care, and 3 D T1-weighted images (3 D-T1WI) in the chronic stage (>6 months) were prospectively acquired for this study. Dataset 2 comprised patients with CS, patients with PS, and healthy controls, and followed a longitudinal design with four time points: ≤7 days, one month, three months and >6 months. Dataset 2 was used to explore the differences in the evolution patterns of cortical structural changes between patients with CS and those with PS.
The inclusion criteria were as follows: (a) a first-onset acute ischemic stroke; (b) a single lesion involving the CST at the level of the internal capsule (CS) or at the level of the pons (PS); and (c) right-handed before stroke onset. 16 The exclusion criteria were as follows: (a) recurrent stroke as defined by clinical history and MRI evaluation, (b) any other brain abnormalities on MR images, (c) a modified Fazekas score for white-matter hyperintensities greater than 1, 17 or (d) a history of any other neurological or psychiatric disorder.
G* Power software (version 3.1, Heinrich-Heine-Universität Düsseldorf, Düsseldorf, Germany) was used for sample size estimation. The parameters of the estimation were as follows: effect size, d = 0.8; error probability, α = 0.05; power = 0.8; number of groups = 3; number of covariates = 4; and number of measurements = 4. The total calculated sample size of dataset 1 was 20, and that of dataset 2 was 12. In the collection of dataset 1, we reviewed the MRI images and clinical data of inpatients admitted within the previous five years, and the acute DWI data were used to confirm stroke location. Patients meeting the inclusion criteria were prospectively recruited at the chronic stage (>6 months after stroke onset). Using social media advertising, healthy controls for datasets 1 and 2 were enrolled from the population sample with the following criteria: (a) aged 40–70 years and right-handed; 16 (b) no history of neuropsychiatric or severe somatic disorder; (c) no visible brain abnormalities on previous MRI examinations; and (d) no contraindications for MRI.
MRI data acquisition
The MRI data of the participants were acquired using five 3.0-Tesla MR scanners from four hospitals, including two Discovery MR750 scanners (General Electric, Milwaukee, WI, USA), two Magnetom Trio Tim MR scanners (Siemens, Erlangen, Germany) and a Signa Excite HDx MR scanner (General Electric, Milwaukee, WI, USA). DWI, T1- and T2-weighted images (T1WI and T2WI, respectively), and T2 fluid-attenuated inversion recovery (T2-FLAIR) images were acquired to identify stroke lesions, recurrent stroke, white-matter hyperintensity and other brain abnormalities. Sagittal 3 D-T1WI images were acquired to calculate cortical structural measures. The DWI parameters were: repetition time (TR)/echo time (TE)/matrix/field of view (FOV)/slices/slice thickness =3000 ms/61 ms/160 × 160/240 mm × 240 mm/20/6 mm, respectively, for the MR 750 scanner; 6000 ms/95 ms/128 × 128/256 mm × 256 mm/20/4 mm for the Trio Tim scanner; and 10,000 ms/106 ms/128 × 128/240 mm ×240 mm/20/6 mm for the Signa Excite HDx scanner. All DWI scans had the same b-value (1000 s/mm2). The T2-FLAIR parameters were: TR/TE/matrix/slices/slice thickness = 8500 ms/158 ms/256 × 256/20/5 mm for the MR 750; 10,500 ms/104 ms/128 × 128/20/6 mm for the Trio Tim, and 9000 ms/110 ms/128 × 128/20/5 mm for the Signa Excite HDx. Sagittal 3 D-T1WI were acquired by brain volume sequences (MR750 and Signa Excite HDx) and magnetization prepared rapid acquisition gradient echo sequences (Trio Tim) with the following imaging parameters: TR/TE/flip angle/matrix/slices = 8.2 ms/3.2 ms/11°/256 × 256/188 for the MR 750; 2000 ms/2.3 ms/9°/256 × 232/192 for the Trio Tim; and 8.1 ms/3.1 ms/13°/256 × 256/176 for the Signa Excite HDx. All scans used the same FOV (256 × 256 mm), slice thickness (1 mm, no gap) and voxel size (1 mm × 1 mm × 1 mm). T1WI and T2WI were acquired using clinically standard sequences, with voxel size = 0.5 mm × 0.5 mm × 6 mm.
Neurological assessments
The National Institutes of Health Stroke Scale (NIHSS) was used to assess global neurological deficits, and the Fugl–Meyer Assessment of the whole extremity (WE_FM, i.e. the total score of the upper- and lower-extremity motor assessment) was used to evaluate motor deficits in the patients. These assessments were performed in the chronic stage (>6 months) for patients in dataset 1 and at four time points (≤7 days, one month, three months and >6 months) for patients in dataset 2.
Calculation of cerebral cortical measures
All structural images (3 D-T1WI) were visually inspected by two radiologists for apparent artifacts due to subject motion or instrument malfunction. To improve statistical power, we flipped the imaging data left-right along the midsagittal line for patients with lesions in the right hemisphere. For all patients, the left side then corresponded to the ipsilesional hemisphere and the right side corresponded to the contralesional hemisphere.
FreeSurfer V.6.0.018 (http://surfer.nmr.mgh.harvard.edu/) was used to preprocess brain structural images and to calculate maps of cortical thickness and surface area for each participant. The preprocessing procedures were performed using an automated surface-based pipeline with default parameters, which mainly included segmentation, surface reconstruction, and surface-based spatial registration. Specifically, structural images were registered in the Talairach atlas, and the intensity variation in the white matter was removed by intensity normalization. The skull was stripped using a deformable template model, 19 and the white matter was segmented based on intensity and neighbor constraints. The automated analysis pipeline can fail in the presence of the severe structural abnormalities that are common in stroke; 18 to satisfy our predetermined criteria, quality control was performed using Freeview (a visualization tool packaged with FS) for visual inspection of the segmentation processes by two radiologists with more than 10 years of experience. We then manually corrected the inaccurate segmentations to improve the segmentation results of the FS preprocessor. The gray-matter/white-matter boundary surface was obtained by tessellating the gray-white boundary followed by topology correction, and the pial surface was generated by nudging the gray-white surface along the T1 intensity gradients to reach the boundary between the gray matter and the cerebrospinal fluid. Both surfaces were represented by vertices. At each vertex, the distance between the gray- and white-matter surface and the corresponding pial surface was defined as cortical thickness. 20 The cortical thickness and surface area of each vertex were then obtained for each participant. The resulting maps of the cortical measures of each participant were transformed into an average surface space using the fsaverage template provided in the FS package and a spherical registration method, 21 and then a 10-mm full-width-at-half-maximum Gaussian spatial smoothing kernel was applied to improve the signal-to-noise ratio of the surface. The resulting maps were used for vertex-based comparisons of cerebral cortical measures among patients with CS, PS and healthy controls.
Cortical structural changes in chronic CS and PS patients
Dataset 1 was used to identify cortical structural changes in patients with chronic CS and PS. For each pair of groups, a general linear model was used to perform vertex-based comparisons of cortical thickness and surface area within a cortical mask across all participants. Age, sex, scanner variables, mean cortical thickness (for cortical thickness analysis) and total surface area (for surface area analysis) were used as nuisance covariates. Multiple comparisons were corrected using the false discovery rate (FDR) method (P < 0.05, FDR corrected). Vertices with significant intergroup differences in cortical measures were extracted as regions of interest (ROIs).
Correlations between cortical structural changes and motor outcomes
In Dataset 1, we investigated the structural changes in cerebral cortical regions that were correlated with motor deficits. Specifically, we performed a partial correlation analysis between the cortical structural measures (cortical thickness and surface area) of each ROI and the WE_FM scores, while controlling for age, sex and scanner variables. We performed a total of six correlation analyses between cortical structural changes and motor outcomes. To reduce possible false-positive findings and maintain the consistency of the correction methods, we corrected for multiple comparisons using the conservative Benjamini-Hochberg-Yekutieli (BY) FDR method 22 (P < 0.05, BY-FDR corrected). The raw P-values were BY-FDR corrected using MATLAB (R2016b, MathWorks Inc., Natick, MA, USA).
Correlations between cortical structural changes and early CST impairment
We performed correlation analyses between early impairment of the CST and chronic cortical structural changes in patients with CS versus PS (dataset 1). DWI has good sensitivity for acute cerebral ischemia and can accurately describe the location, morphology and size of the stroke lesions. Therefore, the stroke lesions were manually delineated on the normalized DWI acquired during the acute stage. First, individual DWI data were spatially normalized to the EPI template in the Montreal Neurological Institute (MNI) space and resampled into 1-mm3 voxels. Stroke lesions were independently outlined on normalized DWI using the MRIcron tool (https://www.nitrc.org/projects/mricron) by three radiologists with more than nine years of experience. The intraclass correlation coefficient for lesion volume was 0.98, and the result of the most senior radiologist was selected as the final lesion contour. We then compared the white-matter lesion load between chronic patients with CS and PS.
We extracted the CST impairment percentage on the ipsilesional side within the lesion area only, aiming to accurately estimate the white matter integrity within the lesions. The boundaries of the acute stroke lesions and a published map of the CST fibers 23 were used to calculate the percentage of CST impairment for each patient in the acute stage. For each axial slice with an overlap between the stroke lesion and a given CST fiber, the impairment percentage of the CST in that slice was defined as the ratio of the area of the overlap region to the area of the CST. The largest percentage of all slices was defined as the CST percent impairment in this patient. We then investigated the correlations between early impairment of the CST and cortical structural changes in the chronic stage while controlling for age, sex, scanner variables and white-matter lesion load. We performed a total of six correlation analyses between cortical structural changes and early CST impairment. To reduce possible false-positive findings, we corrected for multiple comparisons using the BY-FDR method (P < 0.05, BY-FDR corrected).
Evolution patterns of cortical structural changes after CS and PS
For each ROI with significant cortical structural changes in the chronic stage, we used a linear mixed-effects 24 model to investigate the evolution patterns of the cortical structural changes in CS, PS and healthy control groups in an independent longitudinal dataset (dataset 2; 119 patients and 10 healthy controls). The random-intercept term in the model accounts for the correlation due to repeated measurements within a single patient. 25 This model allowed us to make the best use of all available data for each patient, even if some time points were missing. All patients were assumed to have a common slope (fixed effect), and only the intercepts were allowed to vary (random effect). The model parameters were estimated using the restricted maximum likelihood method and considered significant if the P-values were less than 0.05. In healthy controls, we characterized the trajectories of these cortical structural changes to establish references for identifying stroke-induced changes. In each patient group, we identified significant longitudinal cortical structural changes by assessing the significance of the slopes (P < 0.05, BY-FDR corrected). For each ROI with chronic cortical structural changes, we investigated the differences in the evolution patterns by comparing slopes between the members of every possible pair of groups (P < 0.05, BY-FDR corrected).
Statistical analyses
The FreeSurfer V.6.0.0 software (http://surfer.nmr.mgh.harvard.edu/) and SPSS 22.0 (IBM Corp., Armonk, NY, USA) were used for statistical analysis. The Kolmogorov–Smirnov statistic was first used to test for normality. A general linear model was used to perform vertex-based comparisons of cortical thickness and surface area across all participants in dataset 1. Partial correlation analysis was used to test the correlations among motor outcomes, early CST impairment, and cortical structural changes in all stroke patients in this dataset. In dataset 2, longitudinal cortical structural alterations were explored across all participants using a linear mixed-effects model. All statistical analyses were corrected for multiple comparisons using the BY-FDR method. Differences were considered significant if the corrected P-value was less than 0.05.
Data availability
The data supporting the findings of this study are available upon request from the corresponding author.
Results
Demographic and clinical information
See Table 1. A total of 280 patients who satisfied the inclusion criteria agreed to participate in the study. Eleven patients were excluded for recurrent stroke (n = 4), severe white-matter hyperintensity (n = 4), or a history of traumatic brain injury (n = 3). Finally, 269 patients with subcortical stroke (181 with CS and 88 with PS) were included in the study (Figure S1). In dataset 2, 135 patients with subcortical stroke were initially recruited for this study. Sixteen were excluded due to loss to follow-up after inclusion (n = 10), recurrent stroke (n = 4), or other brain abnormalities (n = 2). Finally, 119 longitudinal patients with subcortical stroke (81 with CS and 38 with PS) were included in this study (Figure S1). Of the 81 patients with CS, 52 had data for four time points, 17 had data for three time points, and 12 had data for two time points. Of the 38 patients with PS, 29 had data for four time points, seven had data for three time points and two had data for two time points. After applying exclusions, 175 cross-sectional healthy controls (dataset 1) and 10 longitudinal healthy controls with data for all four time points (dataset 2), were included in this study.
Demographic and clinical information of participants.
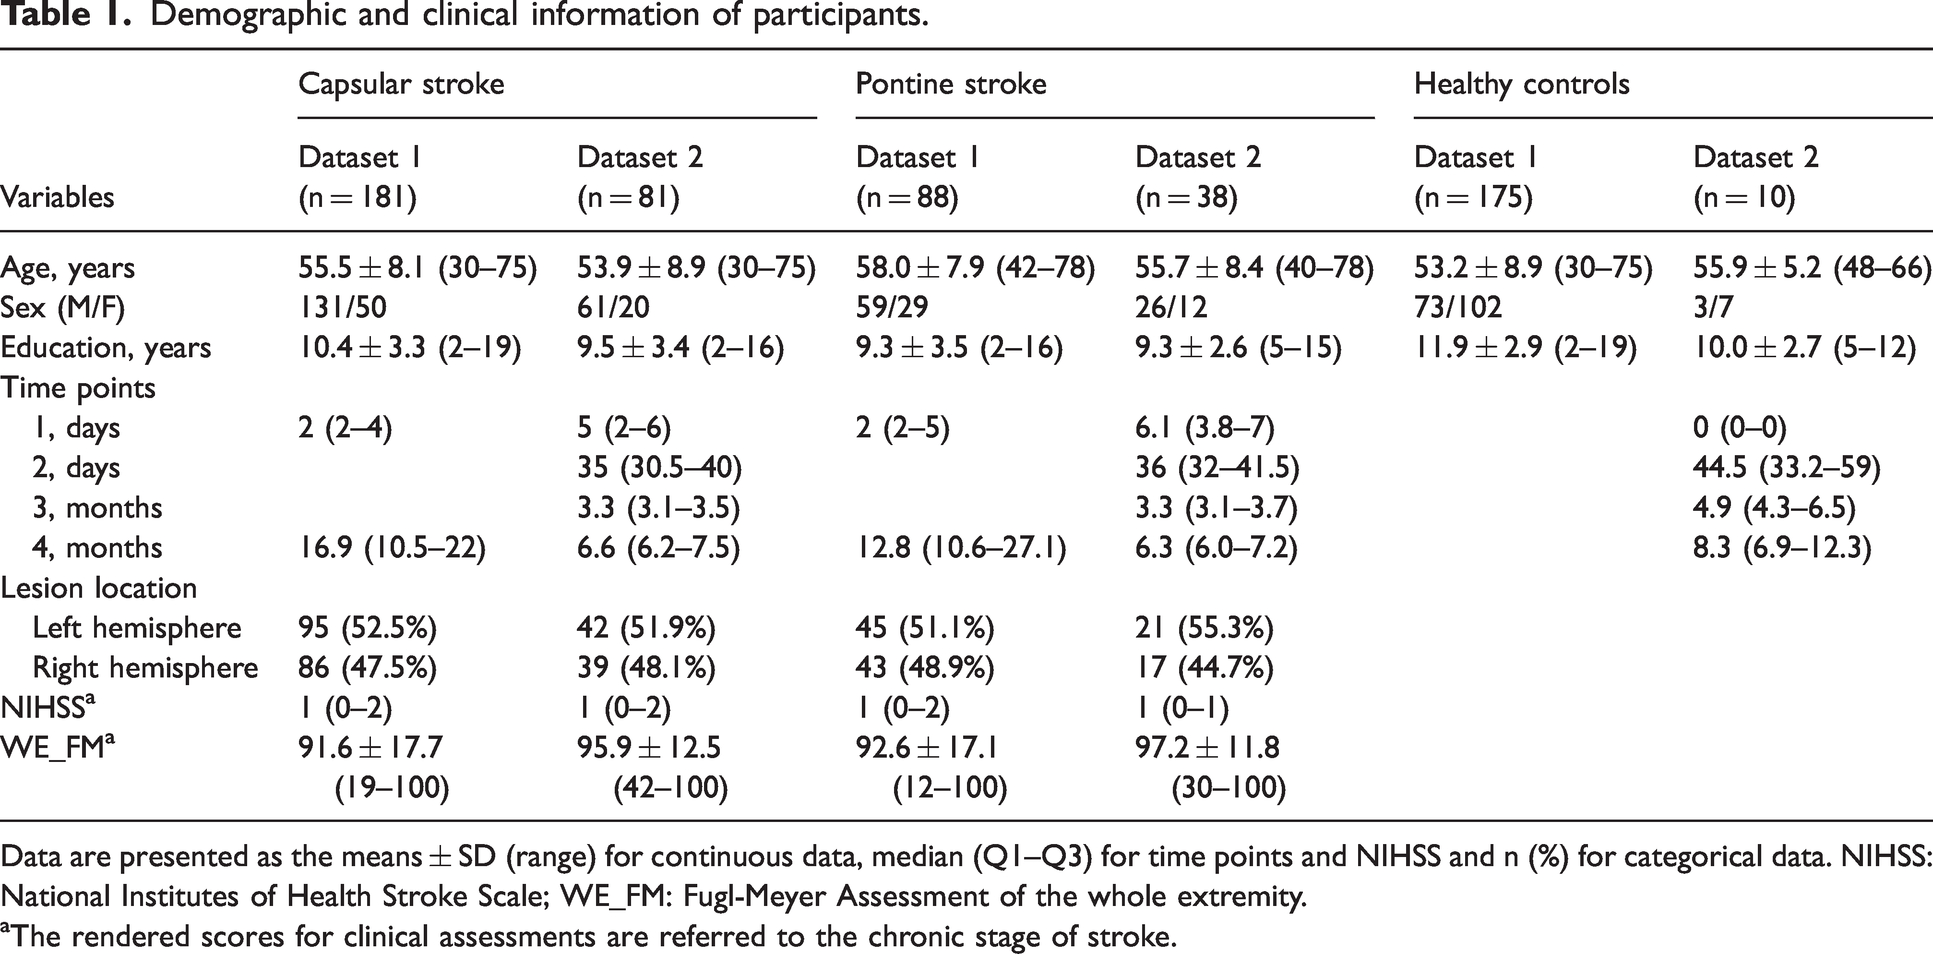
Data are presented as the means ± SD (range) for continuous data, median (Q1–Q3) for time points and NIHSS and n (%) for categorical data. NIHSS: National Institutes of Health Stroke Scale; WE_FM: Fugl-Meyer Assessment of the whole extremity.
aThe rendered scores for clinical assessments are referred to the chronic stage of stroke.
Dataset 1 included 181 patients with CS (131 men; mean age, 55.5 ± 8.1 years), 88 patients with PS (59 men; mean age, 58.0 ± 7.9 years) and 175 healthy controls (73 men; mean age, 53.2 ± 8.9 years). We collected DWI and conventional MRI data in the acute stage, as well as 3 D-T1WI and WE_FM data in the chronic stage for these patients. Dataset 2 was longitudinal, including 81 patients with CS (61 men; mean age, 53.9 ± 8.9 years), 38 patients with PS (26 men; mean age, 55.7 ± 8.4 years) and 10 healthy controls (3 men; mean age, 55.9 ± 5.2 years). We collected DWI, 3 D-T1WI and WE_FM data from the acute to the chronic stage. In patients with CS, stroke lesions involved the internal capsule and surrounding structures, including the internal capsule, thalamus, basal ganglia and corona radiata (Figure 1(a), dataset 1; Figure 1(b), dataset 2). In patients with PS, stroke lesions involved the CST at the level of the pons (Figure 1(c), dataset 1; Figure 1(d), dataset 2). Patients with CS exhibited a greater white-matter lesion load than did patients with PS (P = 2.23 × 10⁻¹⁵). In dataset 1, 140 patients had stroke lesions in the left hemisphere and 129 in the right hemisphere. In dataset 2, 63 patients had stroke lesions in the left hemisphere and 56 in the right hemisphere.
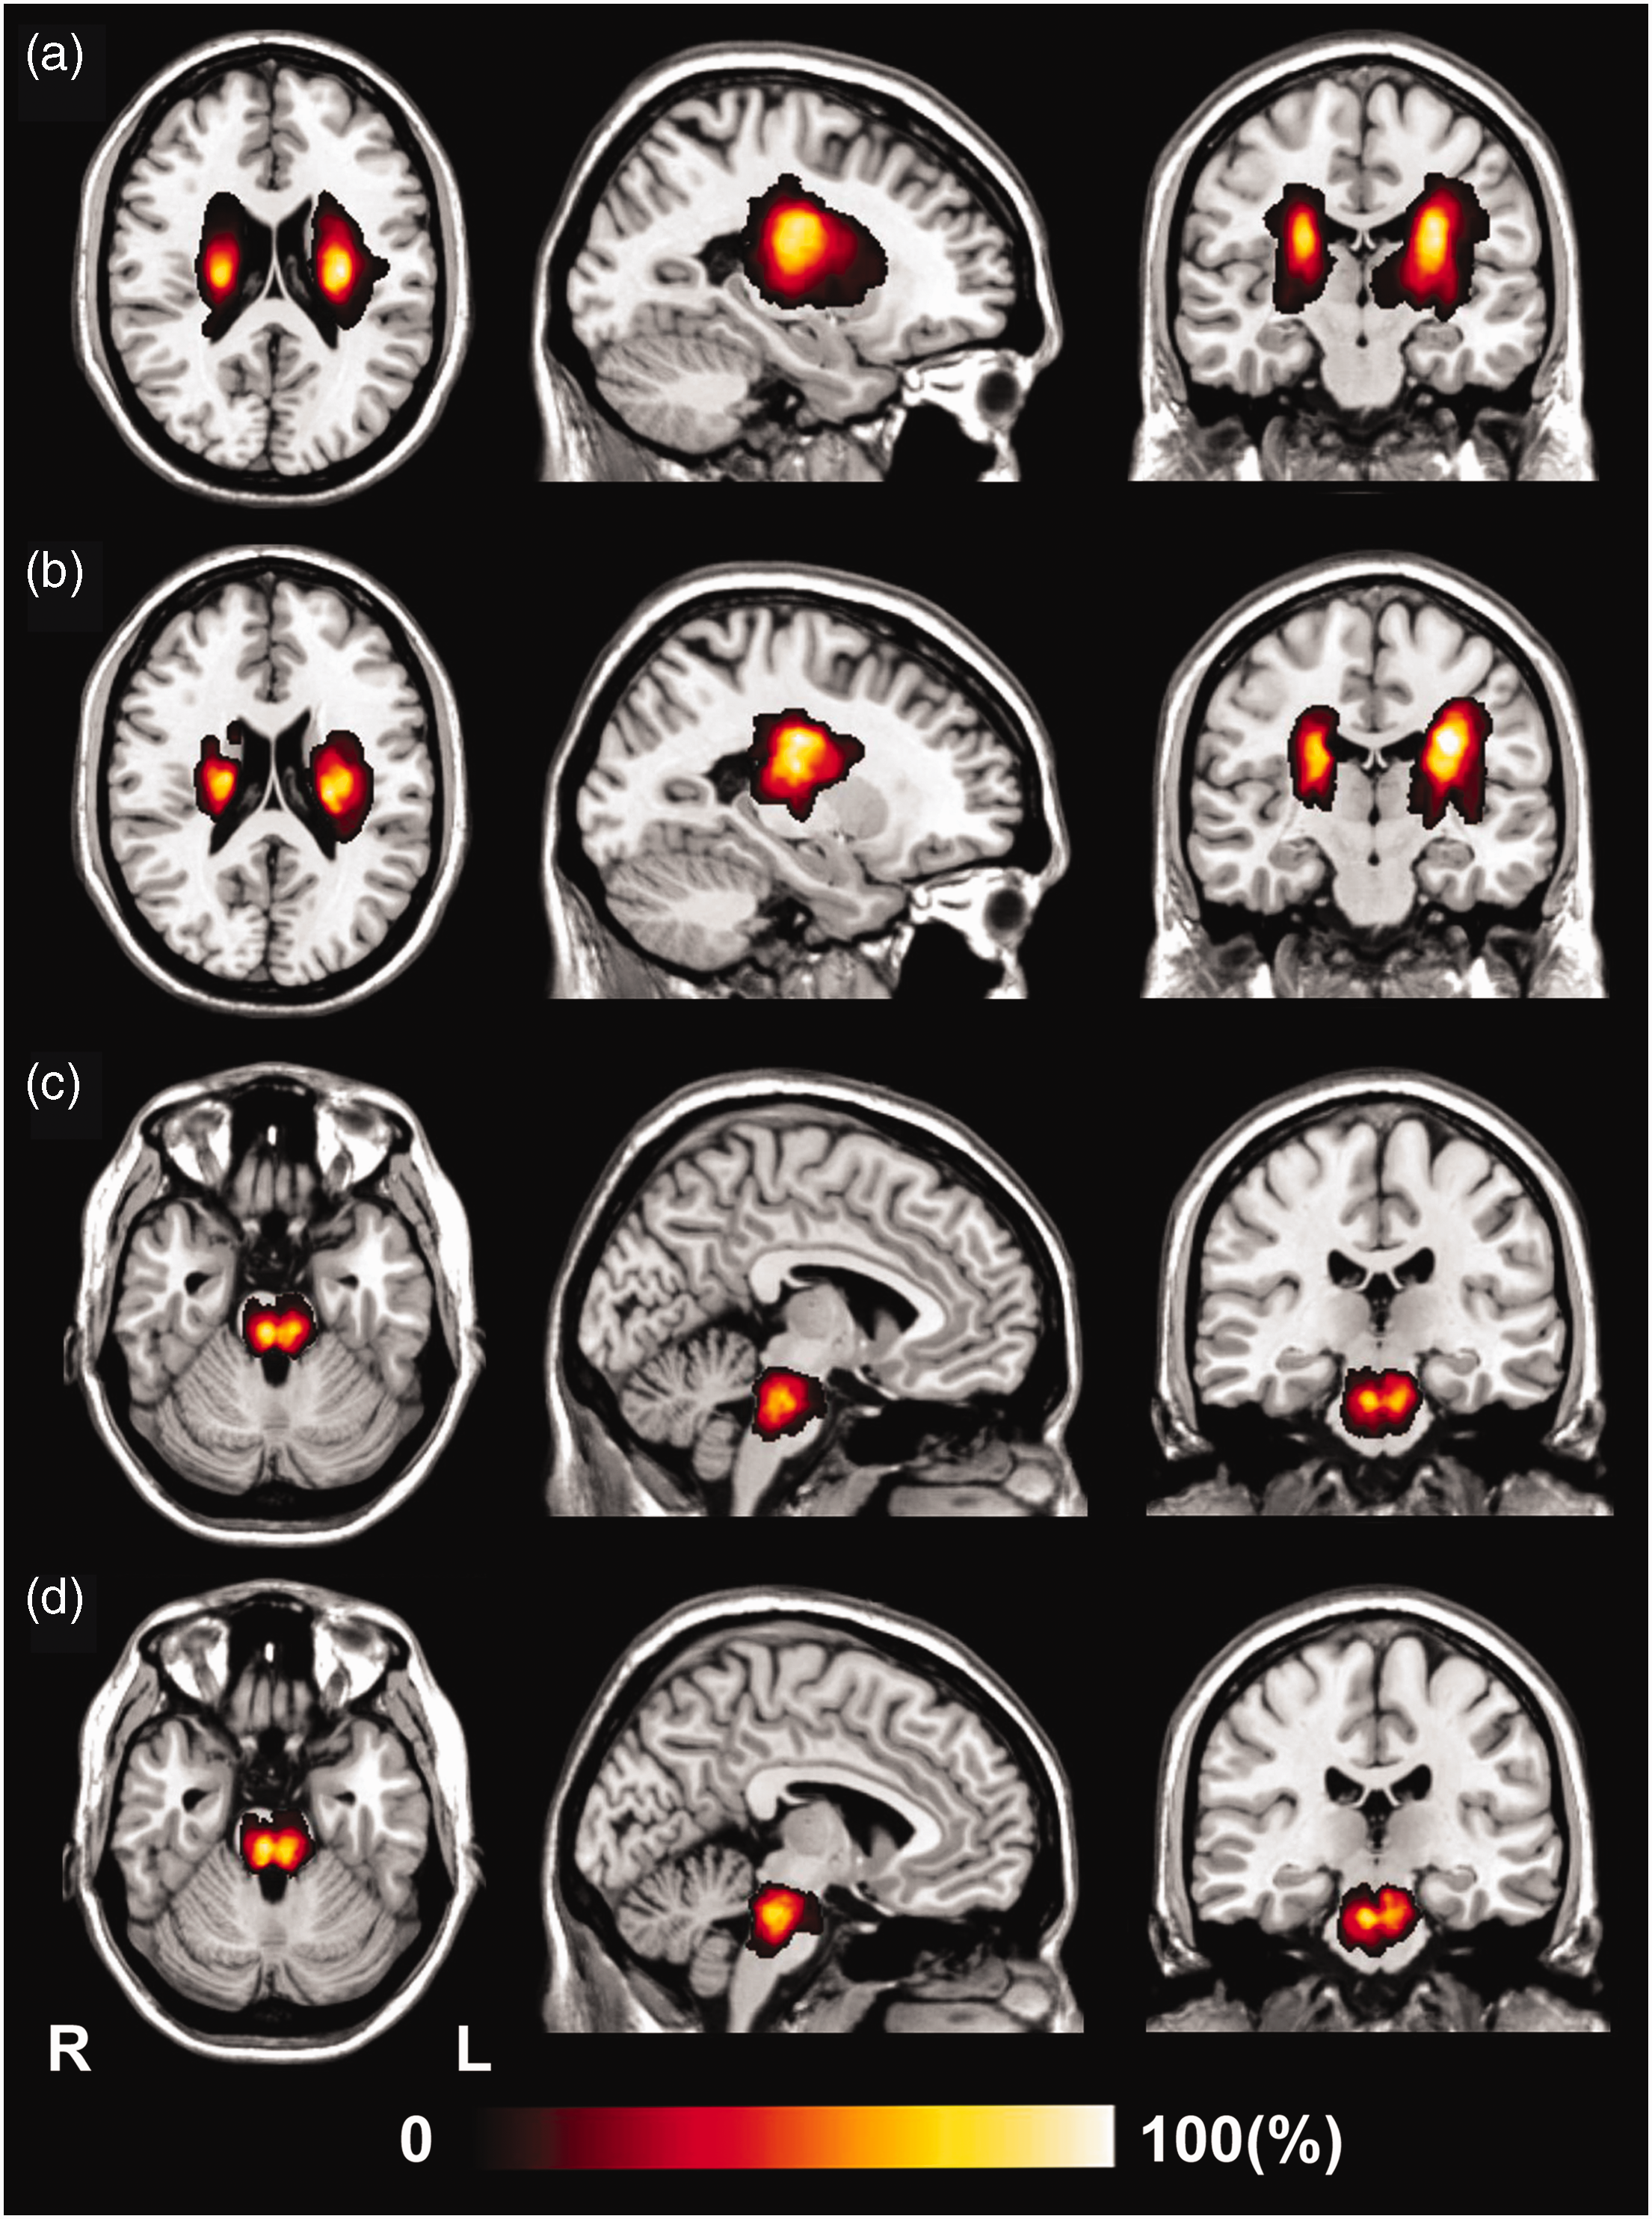
Lesion incidence map for patients with stroke. Shown are the results for: (a) 181 chronic patients with capsular stroke (dataset 1); (b) 81 longitudinal patients with capsular stroke (dataset 2); (c) 88 chronic patients with pontine stroke (dataset 1); and (d) 38 longitudinal patients with pontine stroke (dataset 2). L: left; R: right.
Cortical structural changes in chronic CS and PS patients
In dataset 1, we found six cortical regions (three in cortical thickness and three in surface area) with significant cortical structural differences among patients with chronic CS, PS and healthy controls (red color in Figure 2; Table 2). We also compared groups on the identified ROI-specific cortical measures (bar charts in Figure 2).
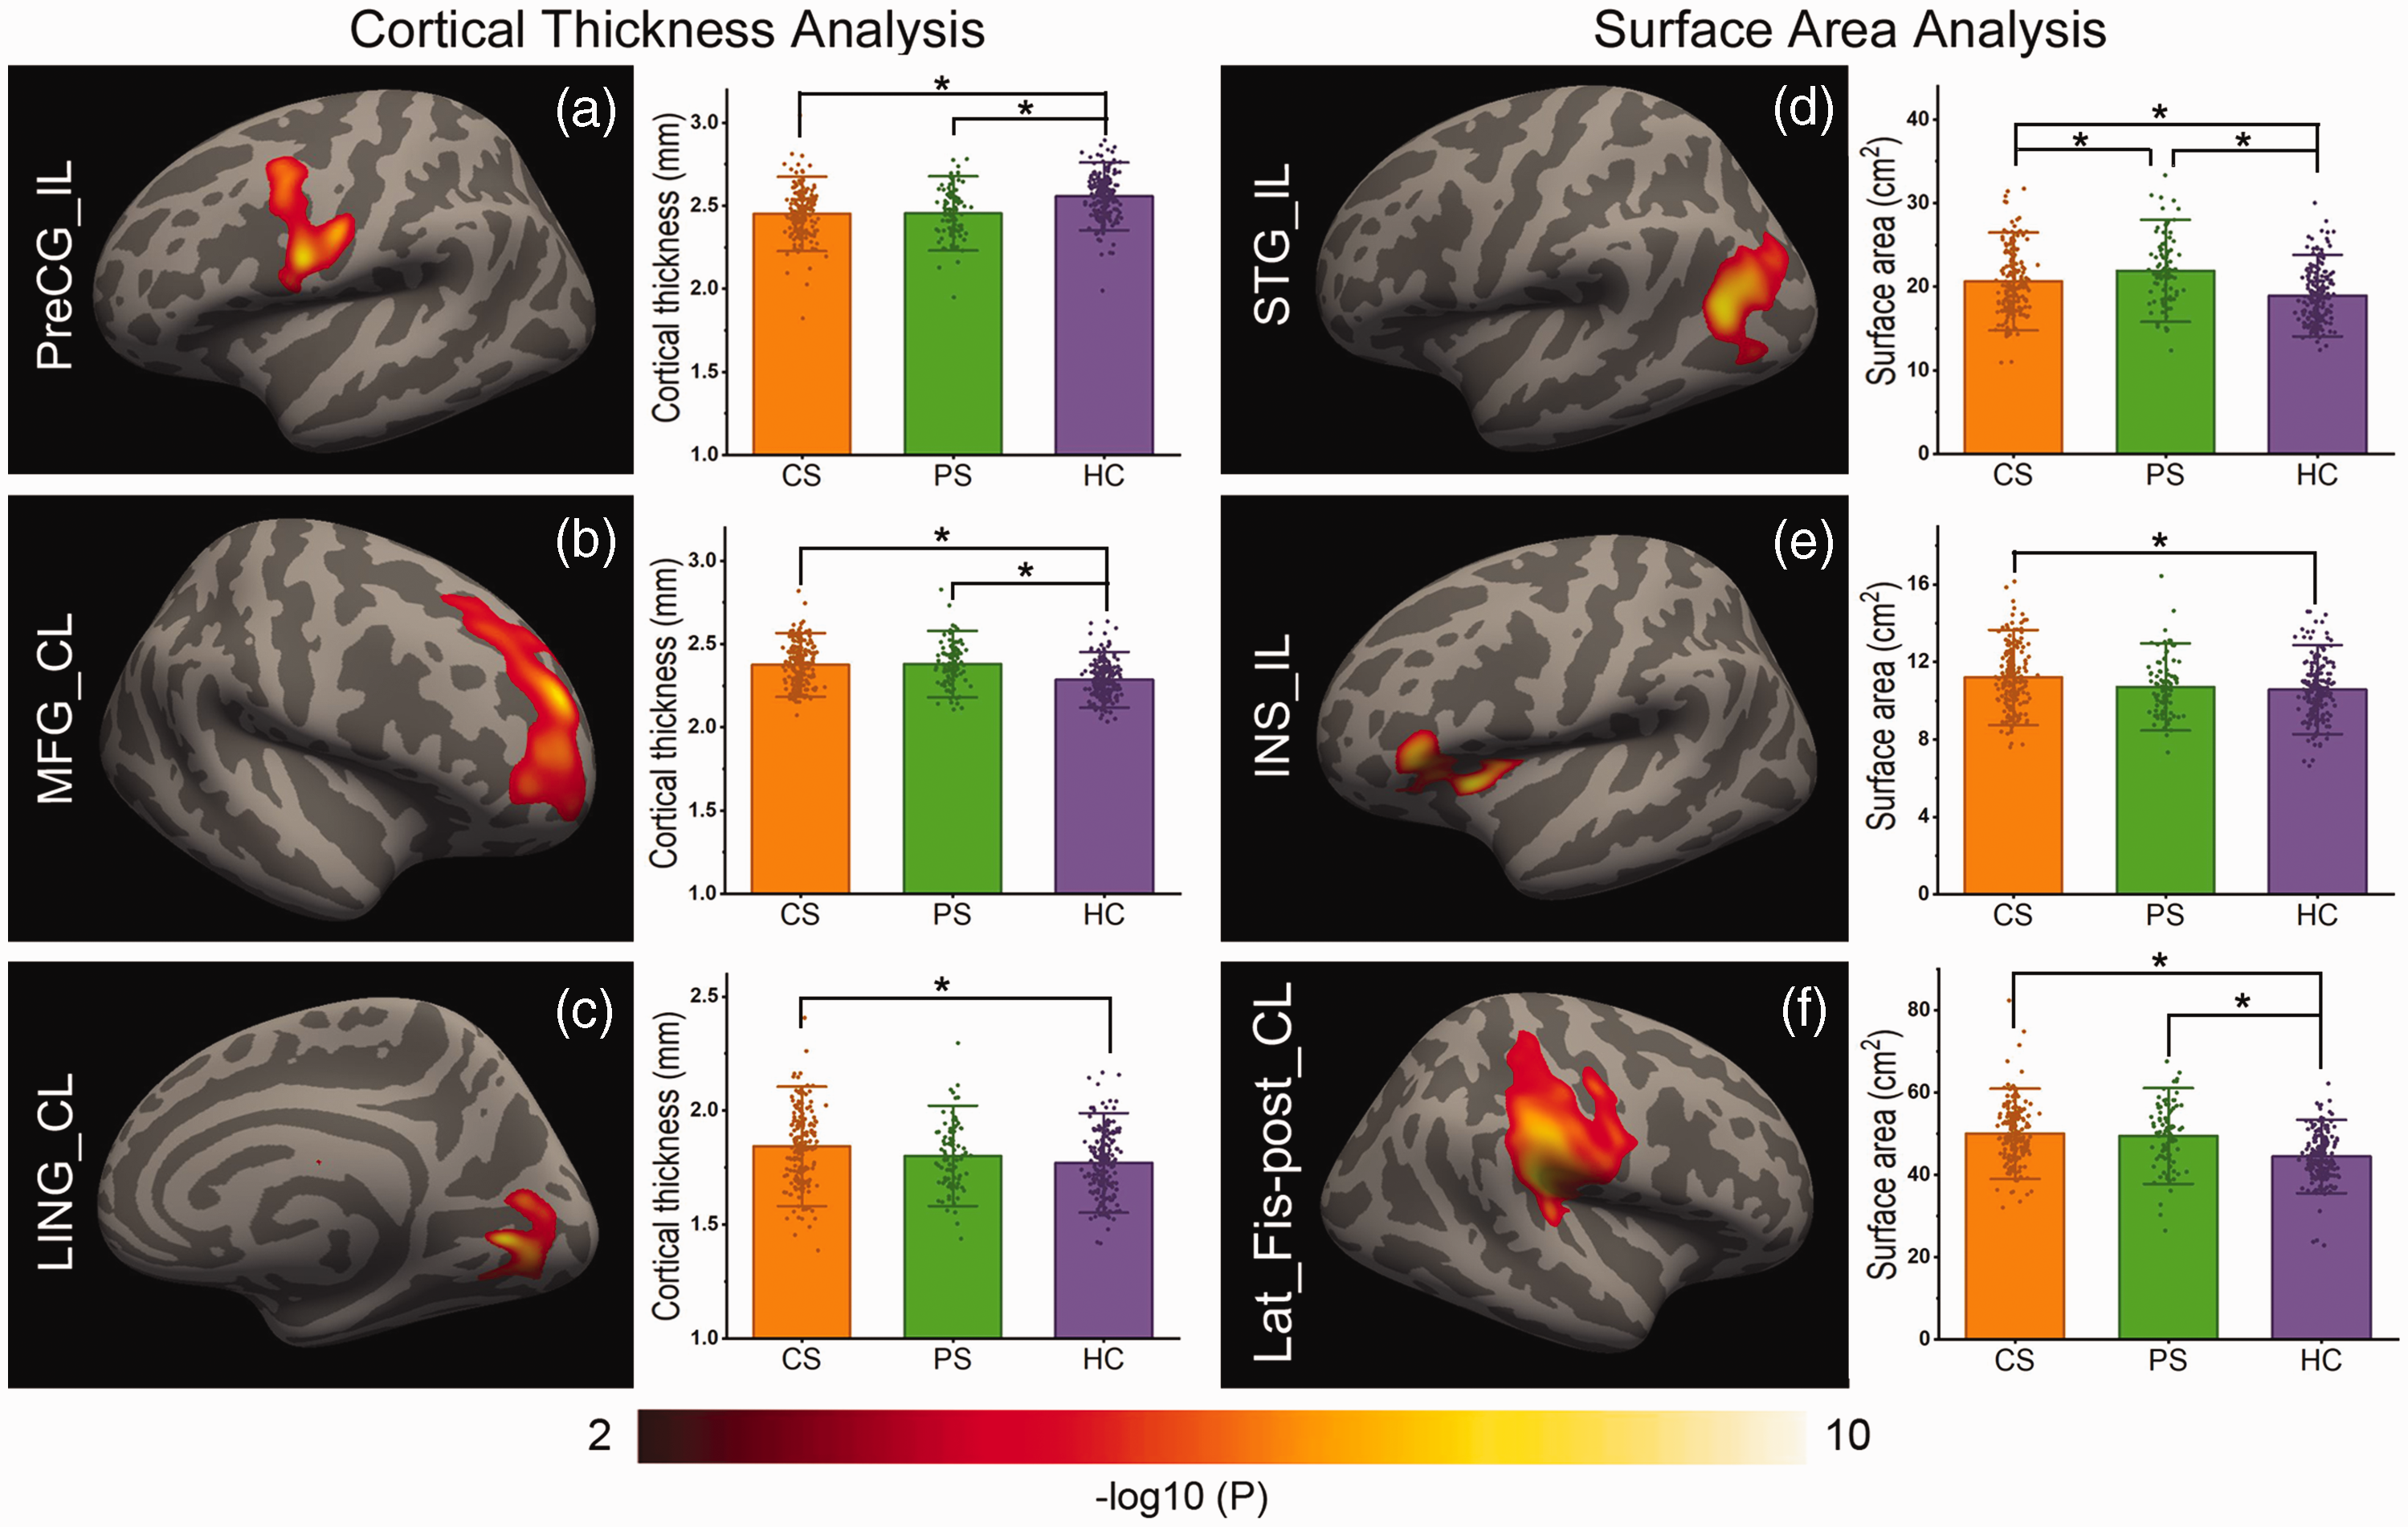
Chronic cortical structural differences among CS, PS, and control groups. (a) to (c) show the significant cortical thickness differences, and (d) to (f) show the significant surface area differences among the CS, PS, and control groups. Left, cortical regions found to have significant cortical structural differences in pairwise comparisons among the three groups. Right, cortical structural differences in each region between each groupwise pair from CS (red), PS (green) and HC (blue). CL: contralesional; CS: capsular stroke; HC: healthy control; IL: ipsilesional; INS: insula; Lat_Fis-post: posterior ramus of the lateral fissure; LING: lingual gyrus; MFG: middle frontal gyrus; PreCG: precentral gyrus; PS: pontine stroke; STG: superior temporal gyrus.
Chronic cortical structural alterations in CS and PS patients (dataset 1).
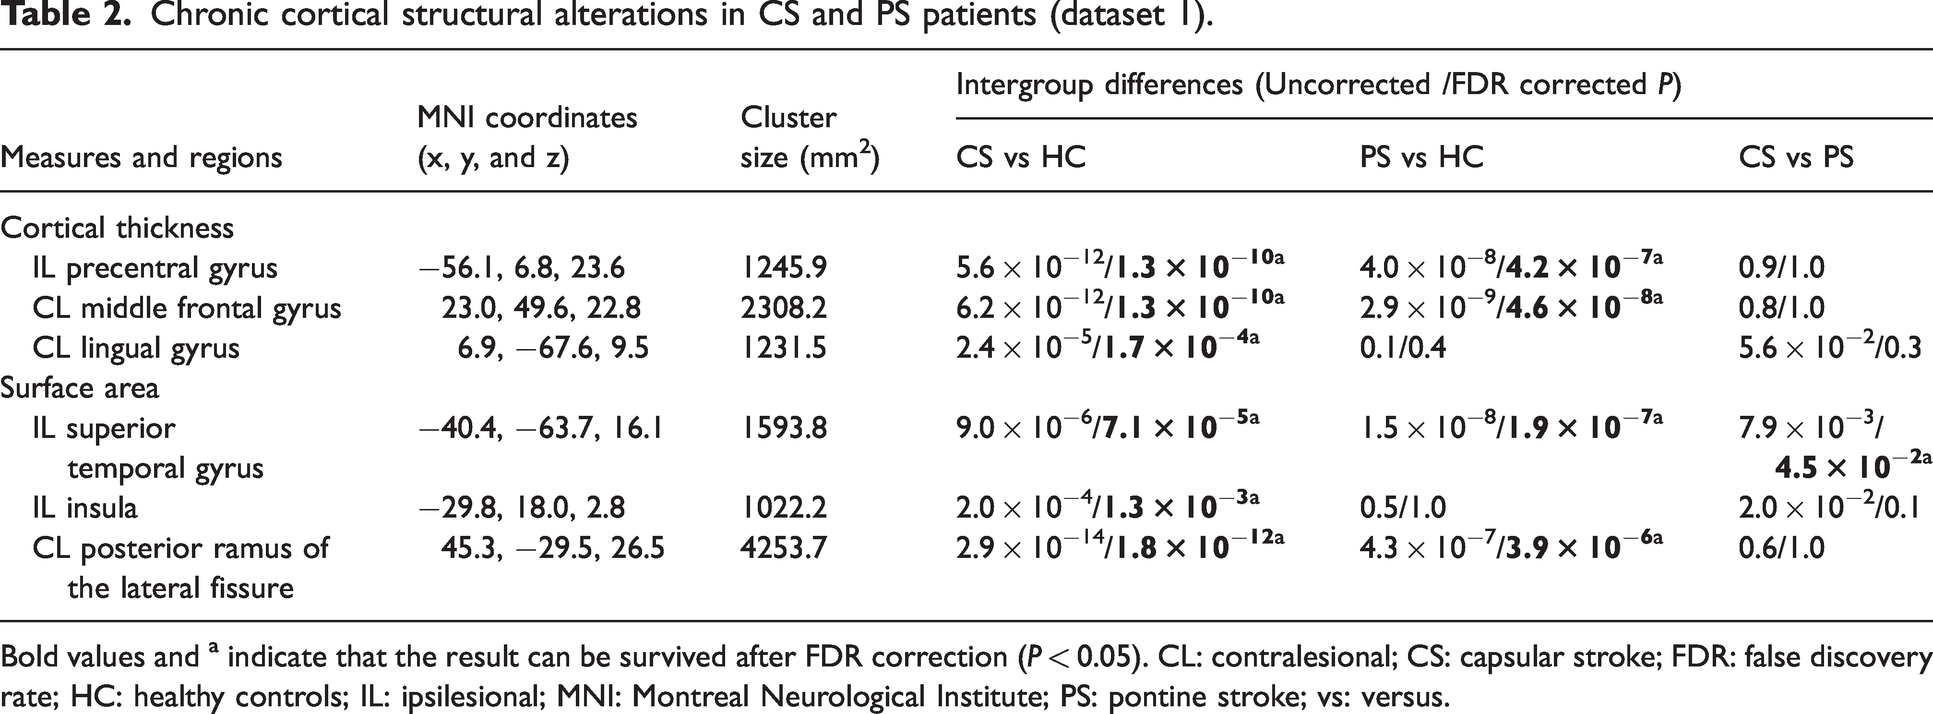
Bold values and a indicate that the result can be survived after FDR correction (P < 0.05). CL: contralesional; CS: capsular stroke; FDR: false discovery rate; HC: healthy controls; IL: ipsilesional; MNI: Montreal Neurological Institute; PS: pontine stroke; vs: versus.
In chronic patients with subcortical stroke, both patients with CS (P = 1.3 × 10⁻¹⁰) and patients with PS (P = 4.2 × 10⁻⁷) had cortical thickness reductions in the ipsilesional precentral gyrus compared to healthy controls (peak MNI coordinates = −56.1, 6.8, 23.6; cluster size = 1245.9 mm2; Figure 2(a)). Both CS (P = 1.3 × 10⁻¹⁰) and PS groups (P = 4.6 × 10⁻⁸) had increased cortical thickness in the contralesional middle frontal gyrus compared to healthy controls (peak MNI coordinate = 23.0, 49.6, 22.8; cluster size = 2308.2 mm2; Figure 2(b); and patients with CS exhibited increased cortical thickness (P = 1.7 × 10⁻⁴) in the contralesional lingual gyrus compared to healthy controls (peak MNI coordinate = 6.9, −67.6, 9.5; cluster size = 1231.5 mm2; Figure 2(c)). In the ipsilesional superior temporal gyrus (peak MNI coordinate =−40.4, −63.7, 16.1; cluster size = 1593.8 mm2), both the CS and PS groups showed increased surface area compared to healthy controls (P = 7.1 × 10⁻⁵ and P = 1.9 × 10⁻⁷, respectively; Figure 2(d)), and patients with PS had greater surface area than did patients with CS (P = 4.5 × 10⁻²; Figure 2(d)). Patients with CS showed increased surface area in the ipsilesional insular cortex (peak MNI coordinate = −29.8, 18.0, 2.8; cluster size = 1022.2 mm2) compared to healthy controls (P = 1.3 × 10⁻³; Figure 2(e)), and both patients with CS (P = 1.8 × 10⁻¹²) and patients with PS (P = 3.9 × 10⁻⁶) had increased surface area in the contralesional posterior ramus of the lateral fissure compared to healthy controls (peak MNI coordinate = 45.3, −29.5, 26.5; cluster size = 4253.7 mm2; Figure 2(f)).
Correlations between cortical structural changes and motor outcomes
In 269 chronic patients with CS or PS (dataset 1), the correlation results comparing motor outcomes and cortical structural measures in the ROIs with significant changes in the chronic stage are provided in Table S1. The WE_FM scores were positively correlated with the cortical thickness of the ipsilesional precentral gyrus (partial correlation coefficient (pr) = 0.24, P =2.42 × 10⁻³; Figure 3(a)) and the contralesional lingual gyrus (pr = 0.23, P = 1.87 × 10⁻²; Figure 3(b)).
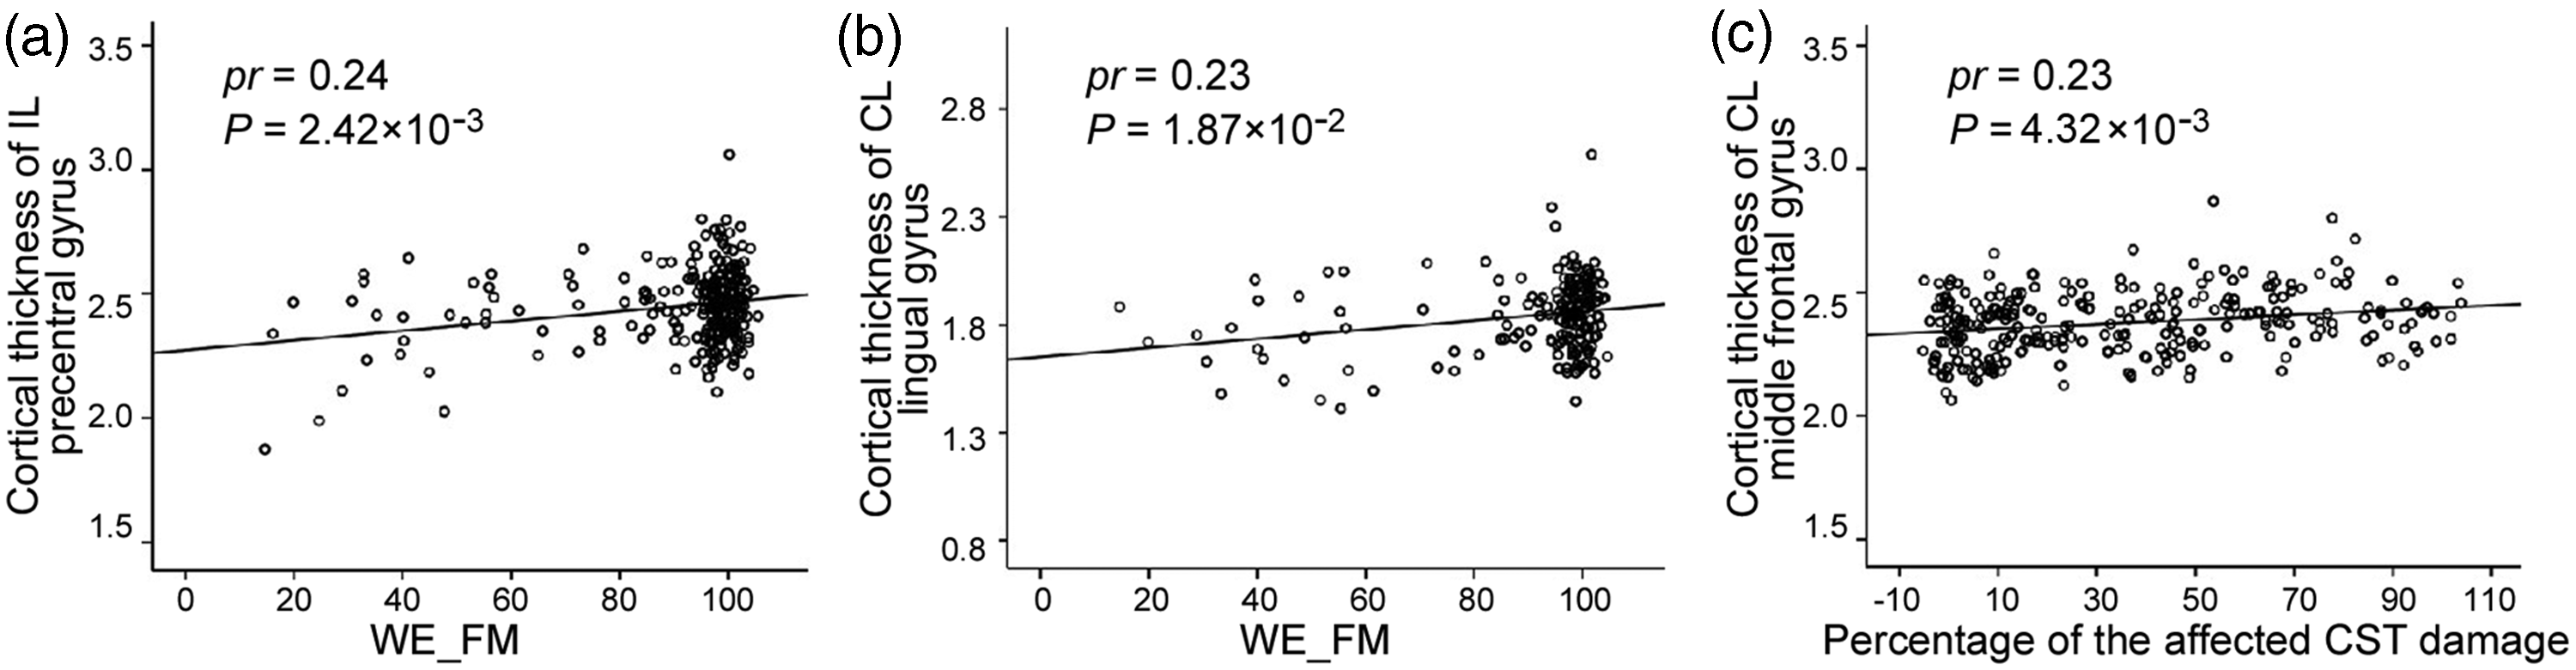
Associations among chronic cortical structural changes, motor deficits and early CST impairments in patients with subcortical stroke. In chronic patients with stroke, WE_FM scores positively correlate with cortical thickness (a) in the IL precentral gyrus and (b) in the CL lingual gyrus. (c) The percent damage of the affected CST positively correlates with cortical thickness in the CL middle frontal gyrus in the chronic stage. CL: contralesional; CST: corticospinal tract; IL: ipsilesional; WE_FM: Fugl–Meyer assessment of the whole extremity.
Correlations between cortical structural changes and early CST impairment
The coefficients of correlation between cortical structural changes in the chronic stage and the impairment percentage of the CST fibers in the acute stage are provided in Table S1. The cortical thickness of the contralesional middle frontal gyrus in the chronic stage was positively correlated with the impairment percentage of the affected CST in the acute stage (pr = 0.23, P = 4.32 × 10⁻³; Figure 3(c)).
Evolution patterns of cortical structural changes after CS and PS
In 119 longitudinal patients with CS or PS (dataset 2), we observed the evolution patterns of cortical structural changes in the six ROIs that had shown significant cortical structural differences among chronic patients with CS, PS and healthy controls in dataset 1. The trajectories of cortical structural changes in these ROIs are shown in Figure 4. The horizontal axis represents the actual acquisition time, which fluctuated around four planned time points. The statistical significance of the longitudinal cortical structural changes in each ROI in the CS, PS and control groups and the slope differences in these changes among the three groups are provided in Table 3.
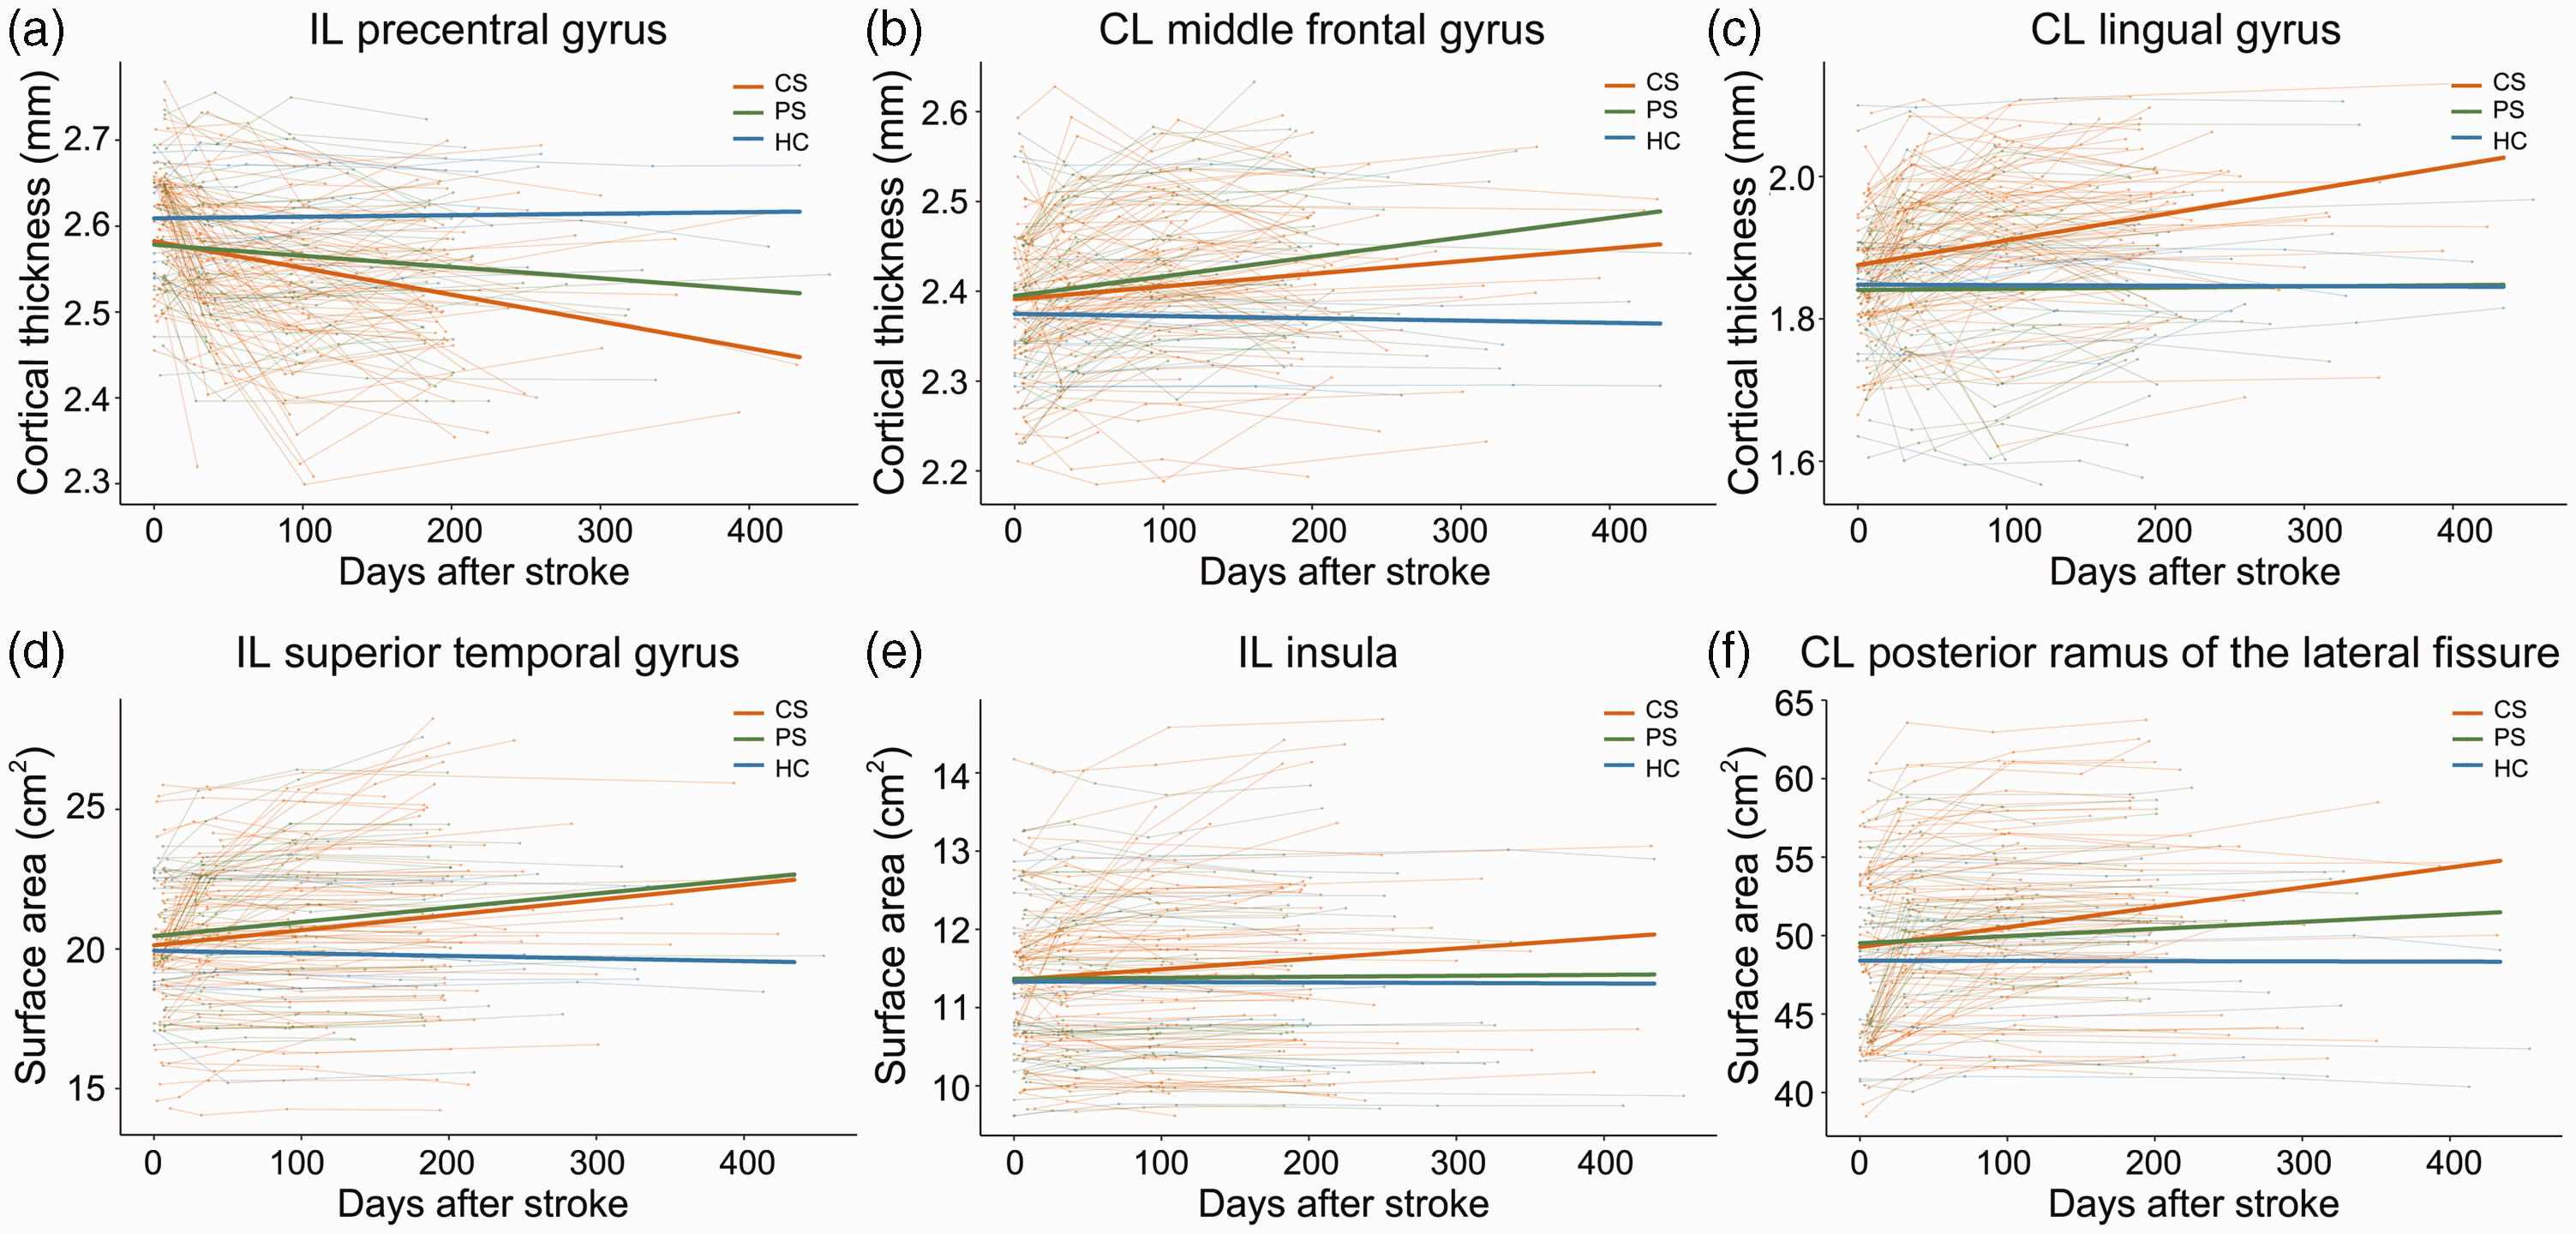
The trajectories of cortical structural changes in patients with CS or PS. Shown are the longitudinal evolutionary trajectories of (a) to (c), cortical thickness and (d) to (f), cortical surface area in cortical regions with significant chronic structural changes. The thin red (CS), green (PS) and blue (HC) lines represent individual cortical structural changes over actual acquisition timepoints. The thick red, green and blue lines indicate the estimated average cortical structural changes in the three groups. CL: contralesional; CS: capsular stroke; HC: healthy controls; IL: ipsilesional; PS: pontine stroke.
Longitudinal evolution patterns of cortical structural changes after CS and PS (dataset 2).
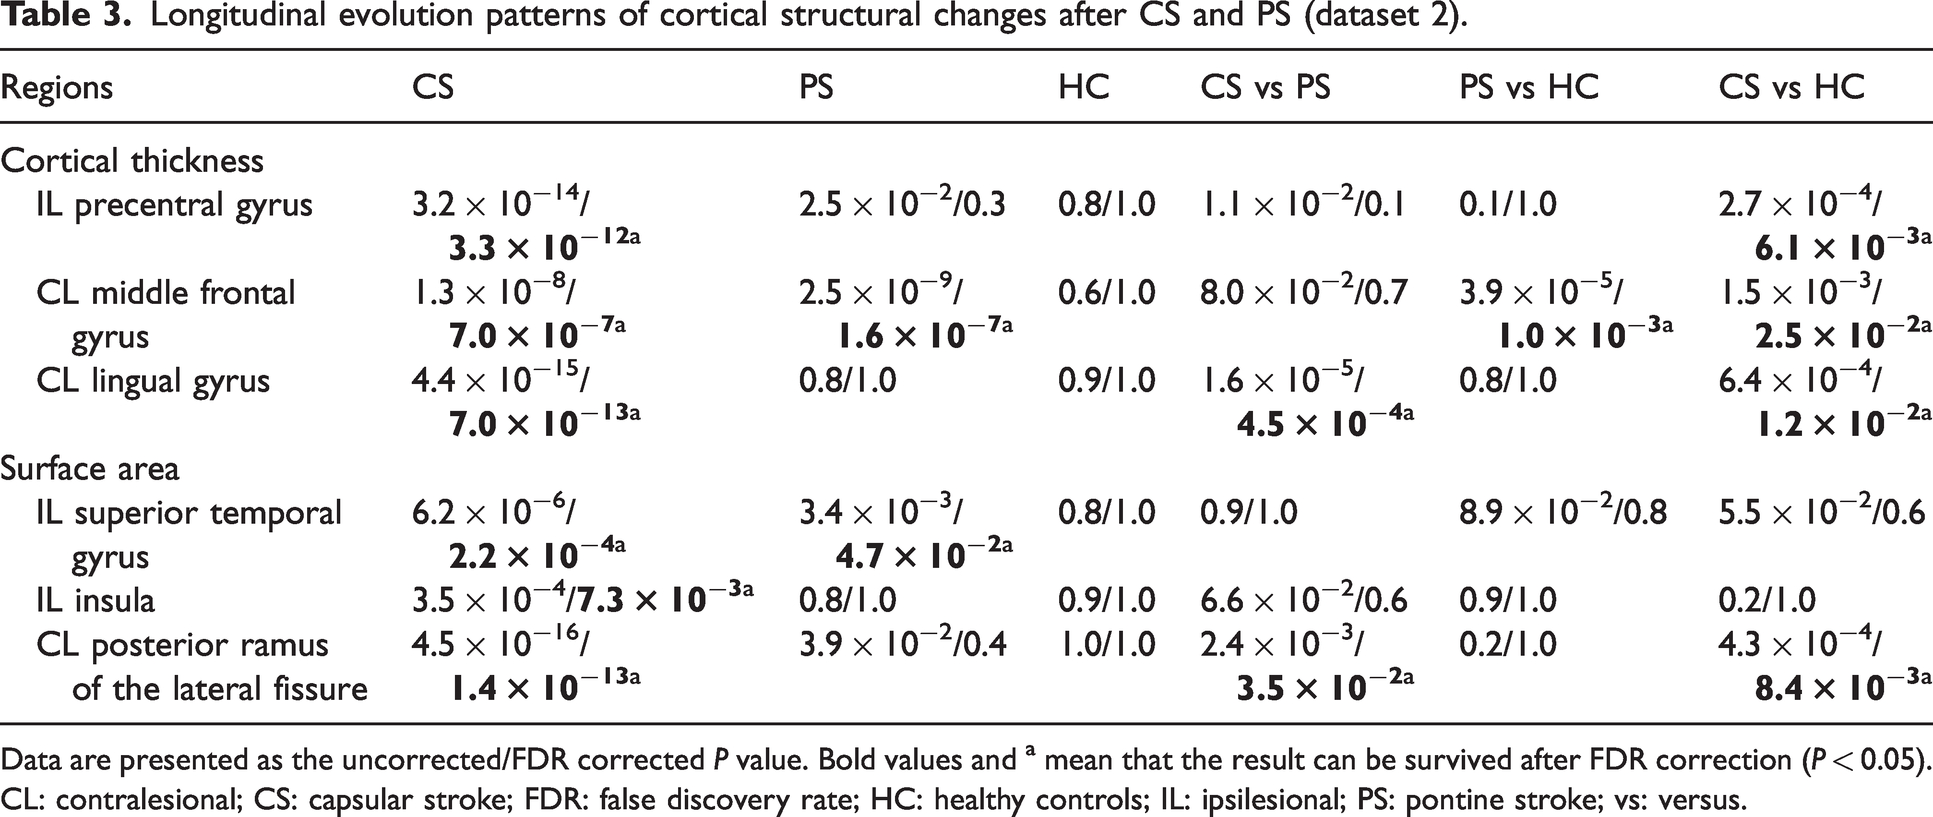
Data are presented as the uncorrected/FDR corrected P value. Bold values and a mean that the result can be survived after FDR correction (P < 0.05). CL: contralesional; CS: capsular stroke; FDR: false discovery rate; HC: healthy controls; IL: ipsilesional; PS: pontine stroke; vs: versus.
In the cortical thickness of the ipsilesional precentral gyrus (Figure 4(a)), only the CS group showed significant longitudinal change (decrease, P = 3.3 × 10⁻¹²) and had a steeper slope (P = 6.1 × 10⁻³) than did the control group. In the cortical thickness of the contralesional middle frontal gyrus (Figure 4(b)), both the CS and PS groups showed significant longitudinal change (increase, P = 7.0 × 10⁻⁷ for CS, P = 1.6 × 10⁻⁷ for PS) and had steeper slopes (CS, P = 2.5 × 10⁻²; PS, P = 1.0 × 10⁻³) than did the control group. In the cortical thickness of the contralesional lingual gyrus (Figure 4(c)), only the CS group showed significant longitudinal change (increase, P = 7.0 × 10⁻¹³) and had a steeper slope than did the PS or control groups (P = 4.5 × 10⁻⁴ and P = 1.2 × 10⁻², respectively). In the surface area of the ipsilesional superior temporal gyrus (Figure 4(d)), both the CS and PS groups showed significant longitudinal changes (increase, P = 2.2 × 10⁻⁴ for CS, P = 4.7 × 10⁻² for PS), but the slopes did not differ between the groups (P > 0.05). In the surface area of the ipsilesional insular cortex (Figure 4(e)), only the CS group showed significant longitudinal change (increase, P = 7.3 × 10⁻³), but no significant slope differences were found (P > 0.05). In the surface area of the contralesional posterior ramus of the lateral fissure (Figure 4(f)), only the CS group showed significant longitudinal change (increase, P = 1.4 × 10⁻¹³) and its slope was significantly different from that of either the PS or the control group (P = 3.5 × 10⁻² and P = 8.4 × 10⁻³, respectively).
Discussion
In this study, we found that subcortical stroke can lead to complex structural changes in multi-domain regions of the cerebral cortex, and we link some chronic cortical structural changes to motor recovery and early damage of the CST. We also discovered that the evolutionary patterns of this structural change differ between patients with CS and PS. These findings indicate that subcortical stroke patients with different lesion levels have specific types of cortical structural damage and reorganization, which highlights the importance of lesion level-specific studies of patients with subcortical stroke.
Chronic cortical structural damage in the motor area
In agreement with previous studies,9,26 patients with chronic subcortical stroke demonstrated structural damage in the cortex. The most consistent cortical structural damage in patients with subcortical stroke is damage to the sensorimotor cortex in the ipsilesional hemisphere. 9 In this study, we also found cortical thinning in the ipsilesional precentral gyrus of patients with CS and PS. Structural damage in the ipsilesional sensorimotor cortex may be explained by anterograde and/or retrograde axonal degeneration 27 because stroke lesions at the level of the internal capsule or pons can directly impair the output or input fibers of the sensorimotor cortex 28 or impair brain regions connected to the sensorimotor cortex.29,30 Furthermore, cortical thinning of the ipsilesional precentral gyrus was significantly positively correlated with motor outcomes in patients with CS and PS. Therefore, the cortical thickness of the ipsilesional precentral gyrus might be a potential biomarker for motor recovery in patients with subcortical stroke. In terms of rehabilitation, both patients with CS and those with PS may benefit from strategies aimed at restoring the function of the sensorimotor cortex, which has been confirmed by previous studies of patients with CS. 9
Chronic cortical structural reorganization in cognitive areas
In this study, we discovered that structural reorganization was scattered through cortical regions away from the cortical areas of the stroke lesions and primarily involved the frontal, occipital, temporal and insular cortices, which are associated with primary and higher cognitive areas. These widespread structural changes are consistent with previous functional 31 and morphometric 5 studies that reported interruption of whole-brain network connections in patients with subcortical stroke.
We found increased cortical thickness in the frontal cortex, which belongs to the frontoparietal network and is involved in cognitive control. 32 Furthermore, the CST damage-cortical structural change association study showed that early impairment of the affected CST was positively correlated with increased cortical thickness in the middle frontal gyrus. This may represent structural reorganization in cognitive areas in response to impairment of the somatosensory system. In line with prior studies, 33 we found structural reorganization in the occipital cortex. Specifically, we found an increased cortical thickness in the lingual gyrus, and this structural reorganization was significantly correlated with motor outcomes in patients with CS. Consequently, the lingual gyrus may be a potential target for rehabilitative treatment in patients with CS. We also found increased surface area in the temporal cortex, which is a component of the default-mode network and is also involved in cognitive processing. 34 This may indicate that cognitive strategies play a beneficial role in motor recovery. 35 Moreover, structural reorganization of the superior temporal gyrus was found in both patients with CS and those with PS, which may indicate a potential common rehabilitation target area in all patients with subcortical stroke.
Different cortical structural evolution patterns in patients with CS versus PS
Most previous studies have reported cortical structural changes in cross-sectional patients with subcortical stroke. 9 Here, we investigated cortical structural evolution patterns in patients with CS or PS and found that their evolutionary trajectories differed. Compared with patients with PS, patients with CS showed more significant cortical structural damage (ipsilesional precentral gyrus) and reorganization (contralesional lingual gyrus and posterior ramus of the lateral fissure). These findings indicate that stroke lesion location can result in different types of secondary cortical structural alteration. In the six cortical regions with chronic structural changes, we observed three types of evolutionary pattern: 1) decreased with different slopes; 2) increased with different slopes; and 3) increased only in patients with CS. Pattern 1 was observed in the ipsilesional precentral gyrus, which represents a general feature of cortical structural damage. Pattern 2 was observed in the middle frontal gyrus and superior temporal gyrus, representing a general feature of cortical structural reorganization. Pattern 3 was observed in the lingual gyrus, insular cortex and posterior ramus of the lateral fissure, which represents cortical structural reorganization occurring only in patients with CS.
The present study had several limitations. First, the lesion locations in our samples were restricted to capsular and pontine regions. Whether our findings can be extended to the general population with stroke requires further investigation. Second, to determine whether the normal CST regions also contribute to the correlations between early impairment of the CST and cortical structural changes, future studies should measure the fractional anisotropy values in the normal CST regions. Third, for stroke patients in the chronic stage, the scanning timepoint varied greatly because of difficulties with long-term follow-up. Some patients were scanned 6 months after stroke, but other patients were scanned >1 year later. Despite the large time interval, these patients were in a stable chronic stage, with little change in motor function. In our study, these data points (≥200 days after stroke) were included in the linear mixed-effects model. Because the small number of data points after 200 days might have affected our slope determinations, future studies should recruit time points at shorter intervals.
We conclude that subcortical stroke can lead to complex cortical structural changes in multi-domain regions. For example, we observed cortical thickness damage in the motor area and cortical thickness and surface area reorganization in the primary and higher cognitive areas in both CS and PS patients. We also established a positive correlation between cortical thickness reorganization in the lingual gyrus and motor outcomes, suggesting that cognitive rehabilitative strategies may be helpful for motor recovery in patients with subcortical stroke.
Supplemental Material
sj-pdf-1-jcb-10.1177_0271678X231159954 - Supplemental material for Dynamic reorganization of cortical structure in multi-domain regions after capsular and pontine stroke
Supplemental material, sj-pdf-1-jcb-10.1177_0271678X231159954 for Dynamic reorganization of cortical structure in multi-domain regions after capsular and pontine stroke by Jingchun Liu, Caihong Wang, Wen Qin, Jun Guo, Tong Han, Jingliang Cheng and Chunshui Yu in Journal of Cerebral Blood Flow & Metabolism
Footnotes
Funding
The author(s) disclosed receipt of the following financial support for the research, authorship, and/or publication of this article: This study was supported by the National Key Research and Development Program of China (2018YFC1314300), the Natural Science Foundation of China (82030053, 82271974), the Tianjin Key Medical Discipline (Specialty) Construction Project (TJYXZDXK-001A), and the Young Talents Promotion Program of Henan Province (2021HYTP012).
Acknowledgements
We thank Yujing Li, Jing Pan and the Neurology team at the General Hospital for patient recruitments and collection of clinical data.
Declaration of conflicting interests
The author(s) declared no potential conflicts of interest with respect to the research, authorship, and/or publication of this article.
Authors’ contributions
J.L., C.Y. and J.C contributed to conception and design of the study. J.L. and W.Q. performed the experiments and analyzed the data. J.G. and T.H. were involved in the clinical assessment. J.L. and C.W. wrote the first draft. All authors contributed to manuscript revision, and approved the submitted version.
Supplementary material
Supplemental material for this article is available online.
References
Supplementary Material
Please find the following supplemental material available below.
For Open Access articles published under a Creative Commons License, all supplemental material carries the same license as the article it is associated with.
For non-Open Access articles published, all supplemental material carries a non-exclusive license, and permission requests for re-use of supplemental material or any part of supplemental material shall be sent directly to the copyright owner as specified in the copyright notice associated with the article.