
Abstract
Hyperoxia during T2∗-weighted magnetic resonance imaging (oxygen challenge imaging (OCI)) causes T2∗-weighted signal change that is dependent on cerebral blood volume (CBV) and oxygen extraction fraction (OEF). Crossed cerebellar diaschisis (CCD), where CBV is reduced but OEF is maintained, may be used to understand the relative contributions of OEF and CBV to OCI results. In subjects with large hemispheric strokes, OCI showed reduced signal change in the contralesional cerebellum (
INTRODUCTION
Crossed cerebellar diaschisis (CCD) describes hypometabolism in a cerebellar hemisphere secondary to a lesion in the contralateral cerebral hemisphere, and is thought to be because of the destruction or inactivation of the cortico-ponto-cerebellar tract. It was first described by Baron
We recently reported preliminary results of a technique that may be able to detect penumbral tissue by using transient hyperoxia during T2*-weighted imaging (oxygen challenge imaging (OCI)). In rodents with acute stroke, we found diminished T2* signal increases with hyperoxia in putative infarct core, intermediate increases in signal in ‘healthy’ tissue, and exaggerated increases in regions of the penumbra.7–9 However, in the clinical study there was only a suggestion that there may be exaggerated increases in regions of ‘likely penumbra’. 10 In addition to field strength, T2*-weighted signal changes are dependent on the concentration of vascular deoxyhemoglobin concentration. This in turn is dependent on CBV and OEF. 11 In previous studies, we were not able to determine the relative contribution of baseline CBV and OEF to overall signal change. Although PET would be the gold standard technique to do this, we postulated that CCD could be used as a model to help determine this using MR, since CBV, but not OEF, is diminished in CCD. If present, then we would expect differences in cerebellar hemispheres in OCI, to be because of differences in CBV and not in OEF. Therefore, future studies could use CCD to determine the OCI response expected for a given CBV which in turn could allow assessment of OEF in ischemic regions.
In this study, we aimed to determine if OCI could detect CCD, and if so, whether CBV contributed to signal changes from OCI.
MATERIALS AND METHODS
SUBJECTS
We performed retrospective analysis of a previously prospectively collected data set, which investigated OCI in acute stroke. 10 This single-center study was approved by the Multi-Centre Research Ethics Committee for Scotland A (reference 05/MRE00/37) and was performed in accordance with the Declaration of Helsinki. Subjects with clinically defined cortical ischemic stroke consented within 24 hours of onset were included in the original study. From these, we identified those with lesions on diffusion-weighted imaging of ≥50 mL, to target a population likely to have CCD, and excluded those with cerebellar strokes.
Imaging
All imaging was performed on a 3.0-T magnetic resonance scanner (Signa Excite, General Electric, Fairfield, CT, USA). In addition to OCI, we acquired diffusion-weighted imaging and MRP at baseline, 10 but did not acquire fluid attenuated inversion recovery (FLAIR) images owing to time constraints.
Oxygen Challenge Imaging
A continuous gradient echo T2*-weighted sequence was acquired in three blocks: air (3 minutes)—15 L/min oxygen (5 minutes)—air (3 minutes). Acquisition parameters were as follows: duration = 11 minutes; repetition time = 3,000 ms; echo time = 30 ms; flip angle = 90°; slice thickness = 4 mm; interslice gap = 1 mm; matrix size = 128 × 128. 10 The medical gases were administered through a standard face mask attached to an oxygen point in the scanner room using 6 m of tubing.
Magnetic Resonance Perfusion Imaging
Acquisition of MRP has previously been detailed. 10 ‘Stroketool’ (Digital Image Solutions, University of Dusseldorf) was used to generate images for CBF and relative CBV (rCBV) using the standard singular-value decomposition deconvolution method. 12 An arterial input function was generated by manually selecting ≥5 voxels from the M1 segment of the contralateral middle cerebral artery. Maps of CBF and rCBV were chosen for analysis, since CCD causes reduction of both CBF and CBV (with constant OEF), and therefore changes would not be expected to be seen on time-based perfusion maps. Relative CBV maps were generated automatically by the software, and then smoothed using a 3 × 3 mm Gaussian kernel. These maps were first coregistered to the T2*-weighted data by using a transformation matrix derived from coregistered raw MRP data to the raw T2*-weighted data, which was generated using ‘windowed sinc’ interpolation and additional manual adjustments.
Post Processing
Using the software package Analyze (Version 8.0, Mayo Clinic, Rochester, MT, USA), regions of interest (ROIs) spanning multiple slices were manually delineated in the ipsilateral and contralateral cerebellar hemisphere on the raw OCI images, avoiding areas of susceptibility artifact. Different anatomic regions of the cerebellar hemisphere were not distinguished, but we aimed to include gray matter. Regions from each hemisphere were drawn separately, but were drawn to match the ROI from the other hemisphere as closely as possible. Values for the T2*-weighted percentage signal change (PSC) and the area the under curve (AUC) of the T2*-weighted signal intensity time series data in the positive direction were derived from the defined ROIs, as previously described. 10 We used AUC in addition to PSC data since they reflect the data acquired from the entire period of hyperoxia, rather than simply recording the maximum signal at a single time point, as is the case with PSC. Both AUC and PSC data were shown to be attenuated in the diffusion-weighted imaging lesion in our previous study. 10 The ROIs for the ipsilesional and contralesional cerebellar hemispheres were then applied to the transformed rCBV and CBF maps and the respective data derived. The PSC maps were generated for illustrative purposes as previously described.
Statistical Analysis
StatsDirect version 2.7.8 (http://www.statsdirect.com) was used for statistical analyses. A Kendall rank correlation was performed to evaluate the relationship between both rCBV ratio and CBF ratio with AUC ratio and PSC ratio. Values for CBF, rCBV, PSC, and AUC were compared between cerebellar hemispheres using the Wilcoxon Signed Ranks Test and were expressed as ‘value, interquartile range (IQR)’. Additional analysis was performed after removal of outliers, which were defined as values that were 1.5 times the IQR above the third or below the first quartile of the PSC ratio data. Owing to the small sample size, and our hypothesis that CCD should be present, statistical significance was attributed at
RESULTS
SUBJECTS
Of 12 subjects, 5 (42%) were female, median age was 67 years (range: 55 to 85 years), median time to imaging was 18.25 hours (range 4.5 to 25.5 hours), and 9 (75%) received intravenous alteplase before OCI. Median score on the National Institutes of Health Stroke Scale was 17 (range 5 to 21) and median lesion volume on diffusion-weighted imaging was 104 mL (IQR 50 to 280 mL). All strokes were in the territory of the middle cerebral artery, with 6 (50%) in the left hemisphere. No patient had suffered a stroke previously.
OCI Data
The median percentage signal change in the ipsilesional cerebellar hemisphere (4.5%, IQR 2.4% to 6.6%) was significantly greater (
T2∗-weighted percentage signal change on oxygen challenge imaging (OCI) in each cerebellar hemisphere
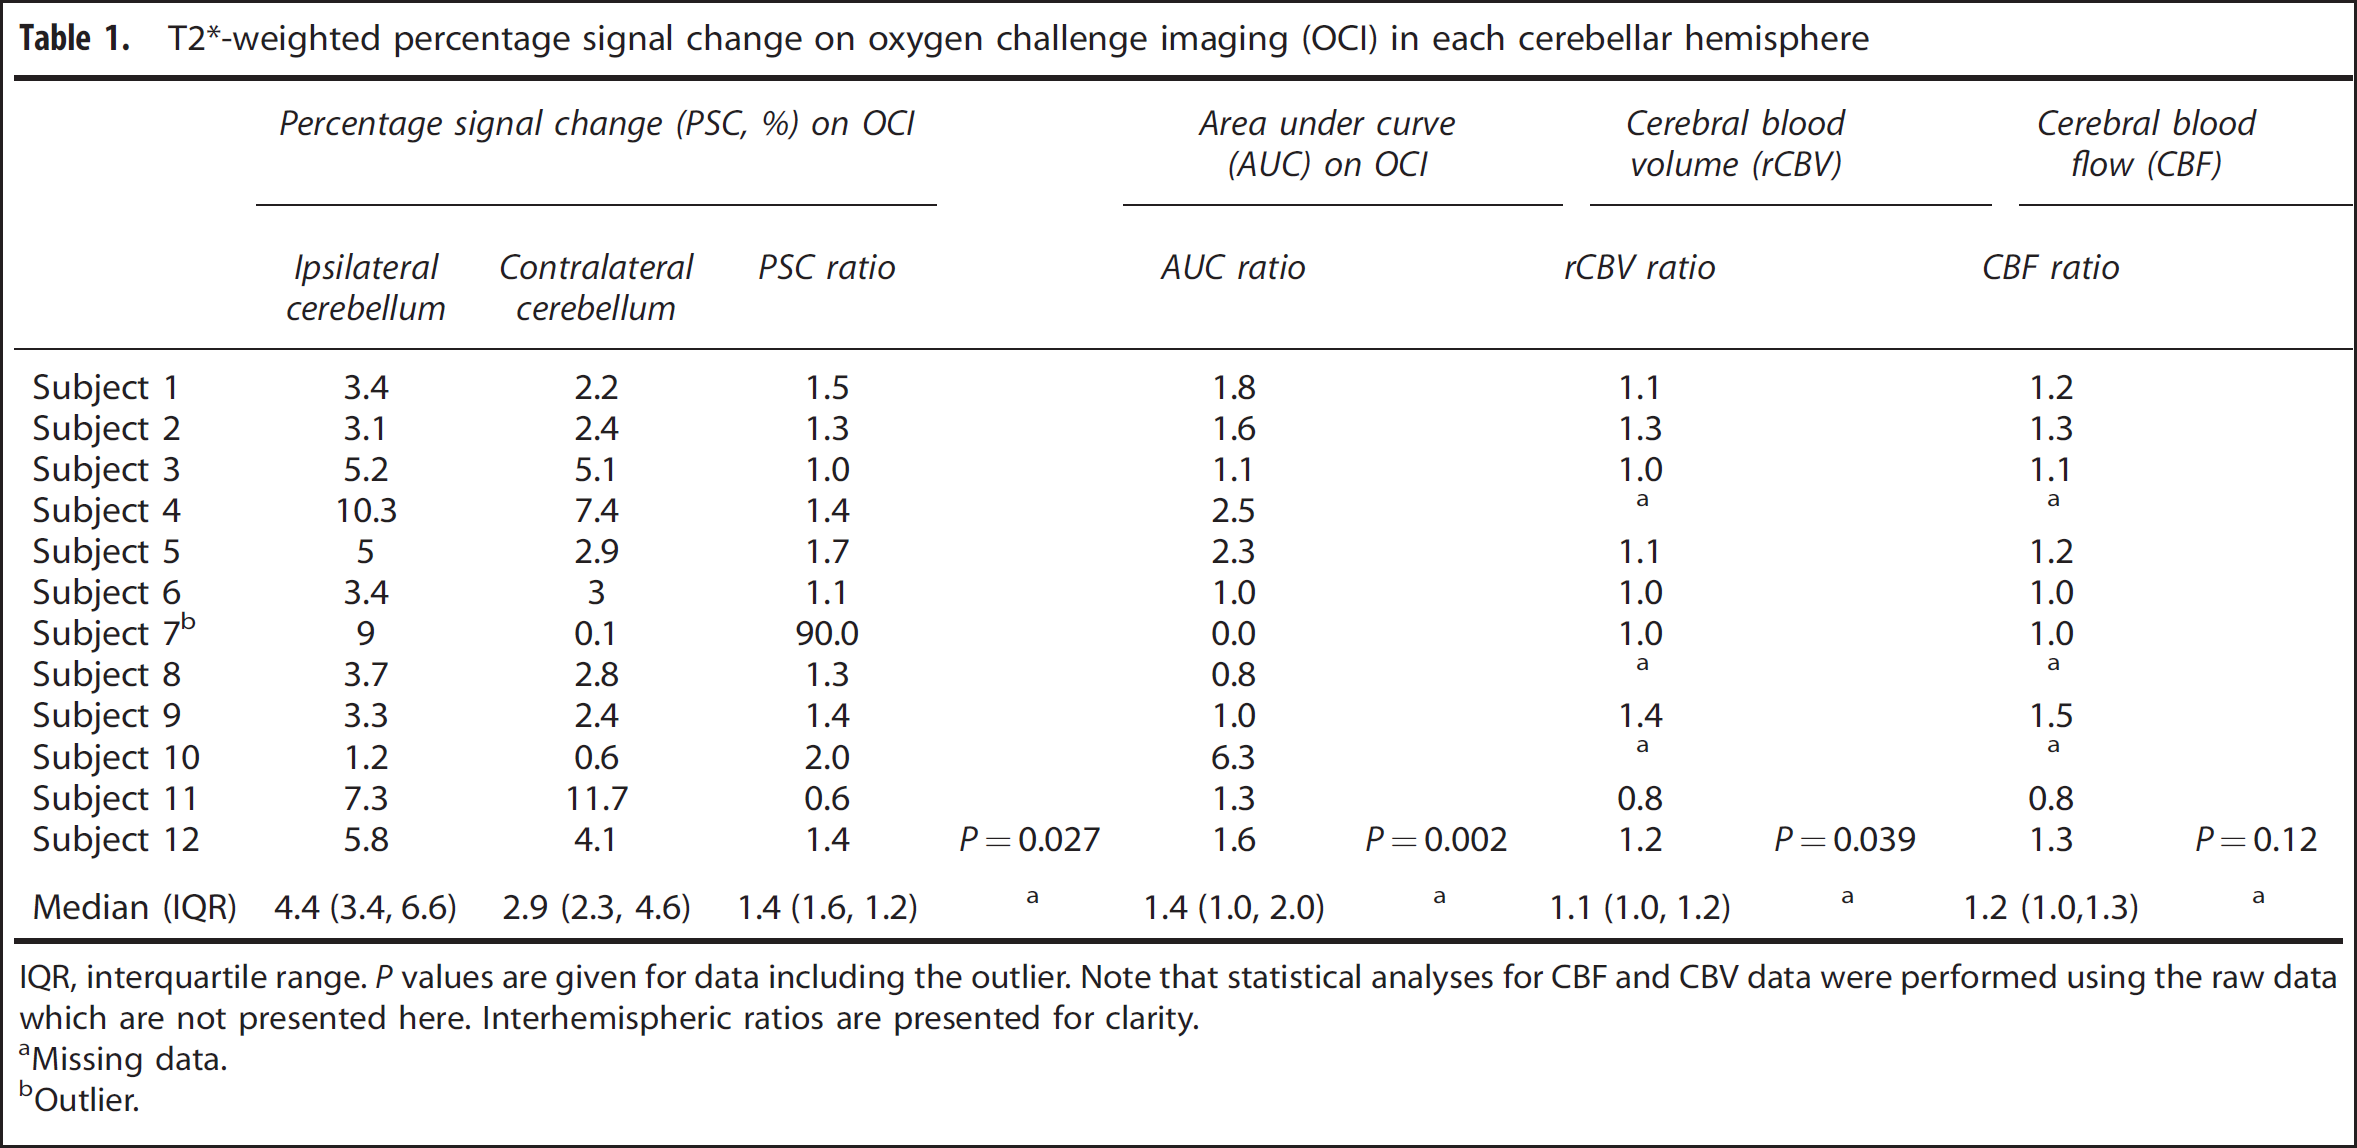
IQR, interquartile range.
Missing data.
Outlier.
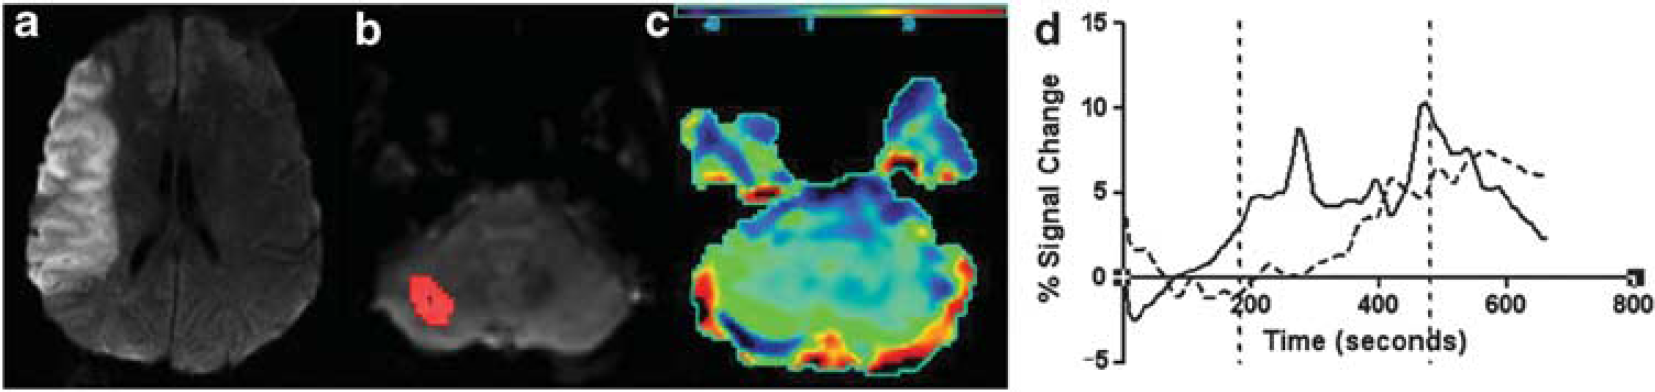
Graphical representation of crossed cerebellar diaschisis (CCD). (
Perfusion Data
The MRP was available in nine subjects: rCBV was higher in the ipsilesional cerebellar hemisphere compared with the contralesional hemisphere (median ratio = 1.1,
DISCUSSION
Using OCI data, we found that the magnitude of T2*-weighted signal intensity response to oxygen challenge was diminished in the contralesional cerebellar hemisphere compared with the ipsilesional hemisphere. This was reflected by cerebellar asymmetries on rCBV and CBF maps.
To our knowledge, this study is only the fourth MR study to report cerebellar asymmetry after stroke, and the first to do so using a procedure other than gadolinium enhanced MRP. Yamada
We showed cerebellar asymmetry on OCI, consistent with CCD. The reduced T2*-weighted signal increases after hyperoxia were associated with a lesser rCBV and CBF in the contralesional cerebellar hemisphere. These findings are consistent with previous studies that have reported metabolic changes of CCD, which also reported hemodynamic changes.4–6 However, we cannot exclude an influence of hyperoxia-induced change in CBF and CBV, on the OCI results, since hyperoxia precipitates a decrease in CBF and CBV in healthy tissue, which may reduce T2*-weighted signal intensity. However, any influence of hemodynamic changes after respiratory challenge on the T2*-weighted signal has been shown to be relatively small, if present. 15 The lack of correlation between CBV/CBF and PSC ratio may simply reflect the noise inherent with the OCI methodology used in this study.
A number of limitations should be acknowledged. The OCI measurements from the cerebellar hemispheres were potentially vulnerable to susceptibility artifacts from the paranasal sinuses and mastoid air cells. Second, hyperoxia-induced changes in blood flow cannot be accounted for. Next, there is no measure available to guide how much interhemispheric variation may be expected in the cerebellum and we used the assumption that the OCI response in both cerebellar hemispheres was the same. A study of Oxygen Challenge in healthy volunteers could answer this question. In addition, we focused on the population mostly likely to have CCD, by selecting subjects with large volume hemispheric stroke. However, this limited the number of subjects included. Finally, we did not compare OCI results with a ‘gold standard’—ideally a further study could be performed using steady-state 15 O-labeled PET, which may provide the definitive diagnosis of CCD, and back-to-back Oxygen Challenge MR imaging.
What are the implications of this study? First, the study of CCD using OCI may allow for the refinement of the OCI technique and the determination of the relative contributions of CBV and OEF to the hyperoxia-induced T2*-weighted signal changes, since, unlike CBV and the cerebral metabolic rate for oxygen, OEF is unaffected in CCD. Second, the OCI technique offers the chance, for the first time, to study CCD in a completely noninvasive manner, without the need for administration of intravenous contrast.
In conclusion, results from OCI are consistent with the changes which would be expected in CCD. These changes reflect a diminished CBV, which is independent of the cerebellar OEF. Therefore, signal from OCI is dependent on CBV, and not on OEF alone. Therefore, CCD could be used to model changes from OCI to distinguish the relative contributions of CBV and OEF to the overall signal change.
DISCLOSURE/CONFLICT OF INTEREST
The authors declare no conflict of interest.
Footnotes
ACKNOWLEDGEMENTS
Professor I Mhairi Macrae contributed scientific advice and commented on the manuscript.