
Abstract
Diffusion- and perfusion-weighted magnetic resonance imaging (MRI) was used to study the putative effects of apolipoprotein E (ApoE) polymorphism in stroke. Thirty-one patients with acute stroke, comparative for age and gender were scanned, nine of whom were ApoE allele ***ε4 carriers. Initially, less than 24 hours from the onset of stroke, the ε4 carriers had significantly smaller volumes of hypoperfusion on relative cerebral blood volume map (P = 0.001), and smaller infarct volumes (P = 0.008) compared with the noncarriers. By day 8, this difference in the infarct volumes had disappeared, suggesting relatively enhanced infarct growth. On average, the total infarct volume increased 145% of the initial infarct volume in the ε4 carriers, and 84% in the noncarriers. There were strong correlations between the imaging findings and clinical status initially and with the outcome 3 months after the stroke in the ε4 noncarriers, but, with a single exception at acute phase, a lack thereof in the ε4 carriers. These patterns were virtually similar in a subgroup of patients with middle cerebral artery stroke. These data support the hypothesis of increased general vulnerability of the brain in the e4 carriers. Thus, the effects of ApoE polymorphism should be accounted for when interpreting diffusion- and perfusion-weighted MRI studies, particularly if predicting lesion growth.
Apolipoprotein E (ApoE) is a plasma glycoprotein associated with transport of cholesterol and other lipids. Apolipoprotein E is involved in the growth, maintenance, and regeneration of both peripheral and central nervous tissues both during development and after an injury (Mahley and Rall, 2000). Persons who carry ApoE allele ε4 are at increased risk for various dementias (Helisalmi et al., 1996) and are also more likely to have impaired recovery of a less specific brain insult after, for instance, closed head injury (Teasdale et al., 1997) or intracerebral hemorrhage (Alberts et al., 1995). In addition, experimental studies on stroke in ApoE knockout (Laskowitz et al., 1997; Horsburgh et al., 1999) and transgenic (Sheng et al., 1998) mice have proposed larger infarcts and worse outcome from ischemic insults compared with wild-type control mice. Interestingly enough, while this would seem to indicate that the ApoE allele ε4 is generally related with genetic predisposition for adverse outcome after an insult to the brain, including stroke, a recent study suggested that functional outcome after stroke in humans was independent of ApoE genotype (McCarron et al., 2000).
There do not appear to be imaging studies on the putative relation of stroke and ApoE polymorphism in humans, although ApoE genotype has frequently been reported to influence not only the outcome after an insult, but also influence the neuroimaging findings on various conditions with a variety of imaging modalities (Lehtovirta et al., 2000). Given the existing discrepancy between human and experimental studies in relation to the ApoE genotype and stroke, and the absence of imaging studies having examined this discrepancy, we used diffusion-weighted (DWI) and perfusion-weighted (PWI) magnetic resonance imaging (MRI) to study the relation between the ApoE genotype and stroke in the acute phase (less than 24 hours from the onset) and at 1 week after stroke. It was hypothesized that the ApoE ε4 carriers would have a larger infarct or lesion growth during the follow-up. In addition, the relation between imaging results and clinical findings initially and 3 months after the stroke were studied. Finally, the analyses were conducted in a subsample of subjects with middle cerebral artery (MCA) stroke to confirm whether or not the findings sustain in a more homogeneous stroke.
MATERIALS AND METHODS
Patients
A total of 57 consecutive patients with symptoms indicative of acute (<24 hours) supratentorial stroke between May 1997 and August 1999 were originally enrolled. Patients with previous strokes were excluded from the study. The patients were initially scanned with computed tomography, and the scans were negative for hemorrhage and other nonischemic causes of symptoms. Patients were treated with aspirin or dipyridamole or both, or anticoagulation, and all received standard supportive therapy for ischemic stroke, such as oxygen, clonidine if the patients was hypertensive, paracetamol if the patient had pyrexia, and insulin or oral preparations if the patient was diabetic, and other standard medication if necessary. None of the patients received thrombolytic or experimental neuroprotective agents. Blood for ApoE genotyping was not initially collected. We contacted the subjects retrospectively, and thus the number of patients in this study is restricted to a subsample of 31 individuals, who were alive, consenting to the blood sampling, and from whom there was adequate MRI data available. Apolipoprotein E genotype was determined from blood leukocytes. DNA was extracted by a standard phenol-chloroform extraction, and ApoE genotypes were analyzed by polymerase chain reaction, HhaI digestion, and polyacrylamide gel electrophoresis (Hixson and Vernier, 1990). The clinical data on these individuals is reported in Table 1.
Clinical characteristics and imaging findings on the study groups
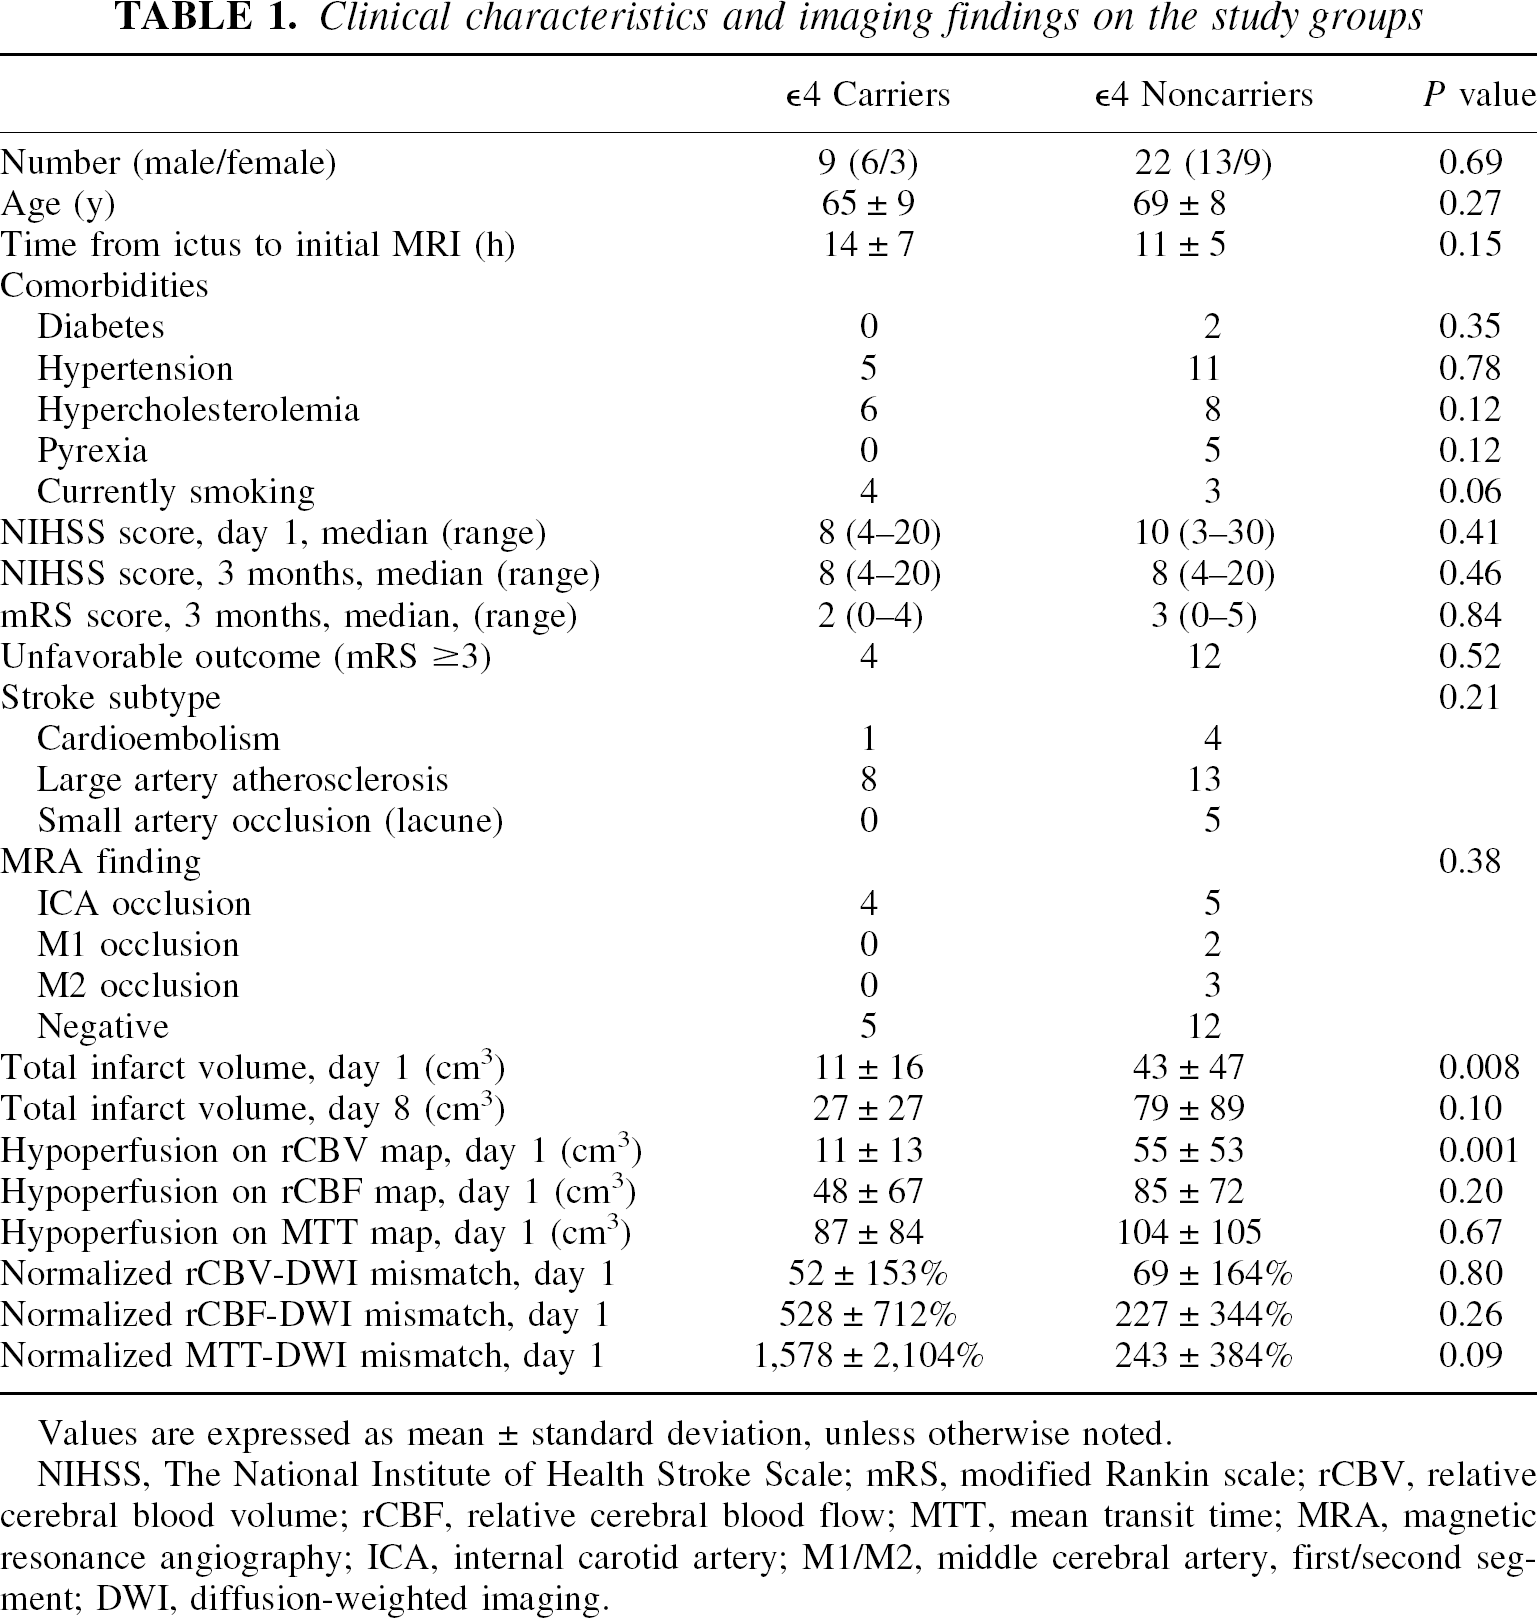
Values are expressed as mean ± standard deviation, unless otherwise noted.
NIHSS, The National Institute of Health Stroke Scale; mRS, modified Rankin scale; rCBV, relative cerebral blood volume; rCBF, relative cerebral blood flow; MTT, mean transit time; MRA, magnetic resonance angiography; ICA, internal carotid artery; M1/M2, middle cerebral artery, first/second segment; DWI, diffusion-weighted imaging.
Informed consent was obtained from the patient or the patient's relative. The study design was approved by the local ethics committee.
Assessment of neurologic and functional status and outcome
The National Institute of Health Stroke Scale (NIHSS) (Brott et al., 1989) was used to evaluate neurologic and functional status on day 1 and 3 months after stroke. In addition, the patients' ability to perform daily activities was assessed according to the modified Rankin scale (mRS) 3 months after stroke (van Swieten et al., 1988). The NIHSS score was missing from one subject on day 1, and the NIHSS and mRS scores were missing from two subjects at 3 months, all from ε4 noncarriers. All clinical analyses and ratings were made blind to the patients' genotype.
Magnetic resonance imaging
All patients underwent MRI within 24 hours of stroke onset. In order to evaluate the final infarct volume, all the patients were scanned at 1 week (day 8) after the onset of symptoms.
All MRI studies were performed with a 1.5-T Siemens Vision (Siemens, Erlangen, Germany) scanner, capable of echo-planar imaging and using a standard head coil. The patient's head was fixed with standard restraints used in routine clinical MRI. Each MRI examination consisted of DWI, PWI, two-dimensional phase-contrast MR angiography (2D-PC-MRA) of the circle of Willis, T2- and proton density-weighted axial fast spin-echo imaging, and pre- and postcontrast T1-weighted axial spin-echo imaging.
DWI was performed with a single-shot echo planar spin-echo sequence (repetition time [TR] 4,000 milliseconds, echo time [TE], 103 milliseconds, slice thickness 5 mm, interslice gap 1.5 mm, field of view (FOV) 260 mm, matrix size 96 × 128, interpolated to 256 × 256, with a total acquisition time of 20 seconds). Nineteen axial slices parallel to the orbitomeatal line were scanned. Four images per slice were obtained: one T2-weighted image without diffusion-weighting (b value 0 seconds/mm2) and three DW images with orthogonally applied diffusion gradients (b value 1,000 seconds/mm2). In order to avoid the effects of diffusion anisotropy and T2 shine-through, trace images (trace of the diffusion tensor) and apparent diffusion coefficient (ADC) maps were calculated on a voxel-by-voxel basis.
PWI was similarly performed with a single-shot echo-planar spin-echo sequence (TR 1,500 milliseconds, TE 78 milliseconds, FOV 260 mm, matrix size 116 × 256). Seven 5-mm-thick axial slices with 1.5-mm interslice gaps were scanned at the slice positions containing the largest diffusion defect. Forty images per slice were acquired with 1.5-seconds intervals. A 0.2-mmol/kg dose of gadopentetate dimeglumine (Magnevist; Schering AG, Berlin, Germany) was injected into an antecubital vein at a rate of 5 mL/s followed by a 15-mL bolus of saline. The injection was given with an MRI-compatible power injector (Spectris; Medrad, Pittsburgh, PA, U.S.A.) after four baseline measurements.
Raw PW images were postprocessed to generate maps of relative cerebral blood volume (rCBV), relative cerebral blood flow (rCBF), and mean transit time (MTT). The rCBV was determined on a voxel-by-voxel basis by numerical integration of the first-pass concentration-time curve. The shape of the arterial input function was determined from the voxels located at a branch of the MCA, showing large signal losses during the bolus passage. The tissue impulse response function was determined by deconvolving the tissue concentration–time curve with the arterial input function. The rCBF was subsequently determined as the height of the deconvolved tissue impulse response, and MTT calculated according to the central volume theorem as the rCBV/rCBF ratio (0stergaard et al., 1996a,b).
Volumetric measurements were performed with commercial image analysis software (Cheshire; Hayden Image Processing Group, Boulder, CO, U.S.A.). The following volumes were measured: (1) the volume of tissue with decreased diffusion (infarcted tissue) from DWIs on day 1 and day 8, and (2) volume of hypoperfusion on the three types of perfusion maps (rCBV, rCBF, and MTT) on day 1. Moreover, (3) the normalized mismatches between hypoperfused tissue on perfusion maps (rCBV, rCBF, and MTT) and tissue with decreased diffusion on corresponding DWI slice were calculated, that is, PWI-DWI mismatch/initial infarct volume on DWI x 100%.
Volumes were measured by drawing the lesion areas on the trace images or corresponding perfusion maps, and by multiplying the lesion area by the slice thickness. The interslice gap was estimated to contain a lesion of the same size as the slice above it, and the lesion inside the gap was included in the volume calculation. Apparent diffusion coefficient maps were reviewed to rule out the effects of T2 shine-through, which would have in some cases caused overestimation of infarcted tissue. All volume measurements were made by a single operator, blind to the patients' genotype and clinical data.
The 2D-PC-MRA (TR 115 milliseconds, TE 9 milliseconds, flip angle 12°, slab thickness 70 mm, FOV 240 mm, matrix 224 × 256, velocity encoding 45 cm/s) images were evaluated independently and blinded to the findings in DWI and PWI by a radiologist and an experienced neuroradiologist for the presence and level of an occlusion.
Statistical analyses
Independent-samples t test and χ-square test were used to compare the findings between the groups. Pearson's two-tailed correlation was used to evaluate the correlations. The critical level for statistical significance was set at 0.05 for all tests.
RESULTS
Demographics, clinical picture, and outcome
The clinical characteristics of the study subjects are presented in Table 1. There were no significant differences in any of the variables, including a number of comorbidities, between the ε4 carriers and the noncarriers. The clinical outcome of the ε4 carriers and noncarriers are also listed in Table 1. There were no significant differences between the two groups on the NIHSS score on day 1, nor were there differences in the 3-month outcome as evaluated by the NIHSS or the mRS scores. There were no differences in the stroke subtype as proposed by the TOAST investigators (Adams et al., 1993) or the MRA findings between the ε4 carriers and the noncarriers (Table 1).
Imaging findings
The imaging findings are summarized in Table 1. The total infarct volume was significantly smaller in the ε4 carriers compared with the noncarriers on day 1, but the statistical significance of this difference had vanished by day 8 between the two groups. On average, the total infarct volume increased 145% of the initial infarct volume in the ε4 carriers, and 84% in the noncarriers (t = 1.81, P = 0.10). There were no differences in hypoperfused tissue volumes on day 1 between the two groups in rCBF, or in MTT perfusion maps, but the volume of hypoperfusion on rCBV map was significantly smaller in the ε4 carriers. There were no differences between the volumes of the rCBV-DWI mismatch, rCBF-DWI mismatch, or MTT-DWI mismatch between the two groups (Table 1).
Correlations between imaging findings with clinical status and outcome
The correlations between the neurologic and functional status and the imaging findings are presented in Table 2. In the ε4 noncarriers, the total infarct volume on days 1 and 8, and the volumes of hypoperfusion were significantly correlated with the NIHSS score on day 1 and at 3 months, and with the mRS at 3 months (r ⩾ 0.63, P < 0.05. In contrast, in the ε4 carriers, none of the imaging parameters correlated significantly with the clinical status initially or with the outcome at 3 months, with the exception of a significant correlation between hypoperfusion on rCBF map and the NIHSS score on day 1 (r = 0.78, P = 0.01).
Pearson correlation coefficients between infarct and hypoperfusion volumes with clinical outcome
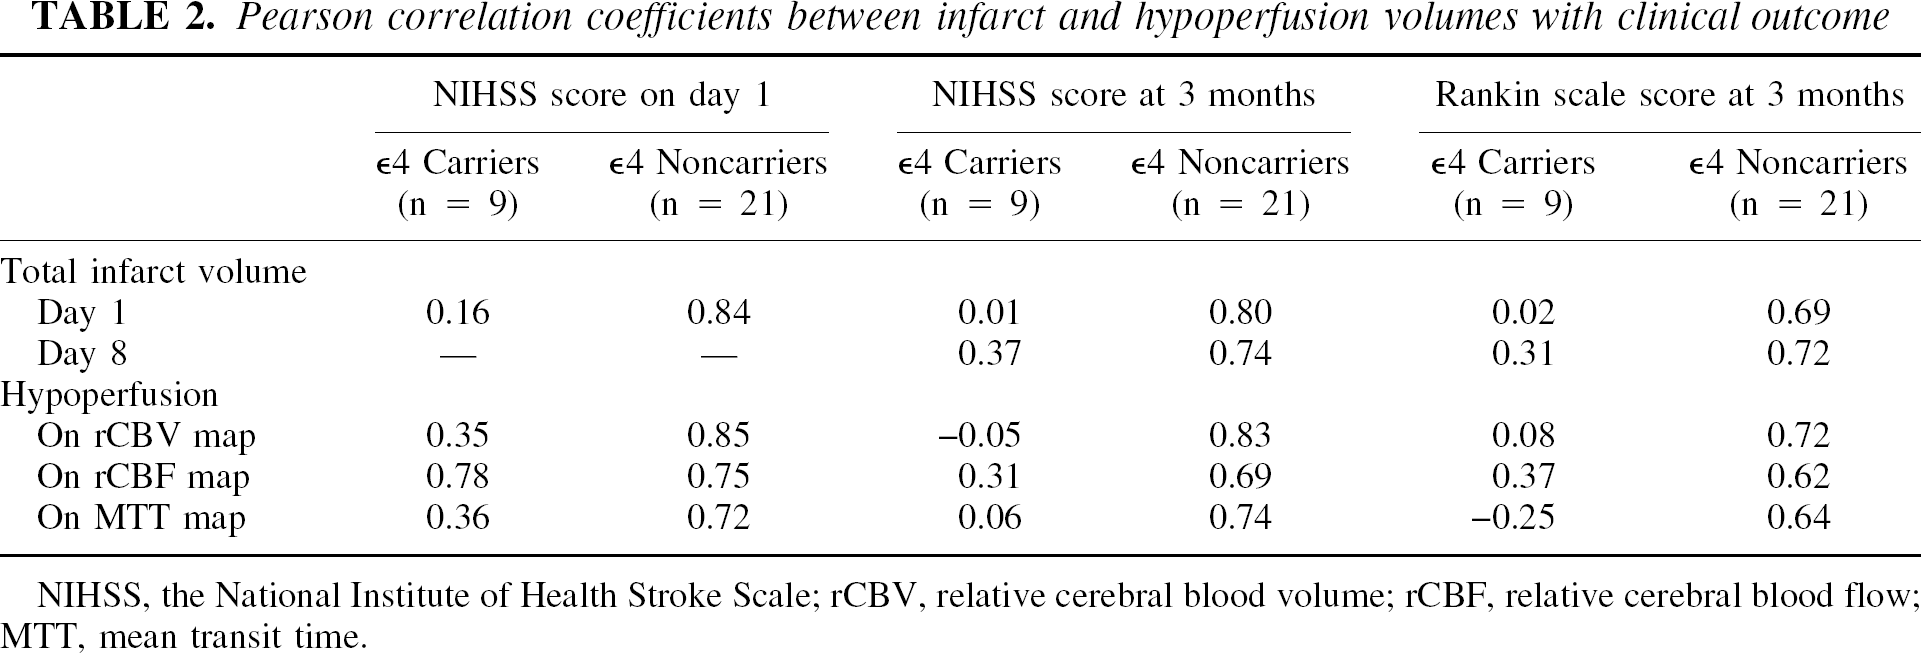
NIHSS, the National Institute of Health Stroke Scale; rCBV, relative cerebral blood volume; rCBF, relative cerebral blood flow; MTT, mean transit time.
Analysis with the subgroup of patients with middle cerebral artery infarct
To study whether or not these findings or trends hold in a subsample with a more homogeneous stroke, we analyzed a subgroup of subjects with MCA infarct. No differences were found in the demographics, comorbidities, stroke patterns, MRA findings, or the initial or 3-month clinical outcome (Table 3).
Clinical characteristics and imaging findings on the subgroup of subjects with the middle cerebral artery infarct
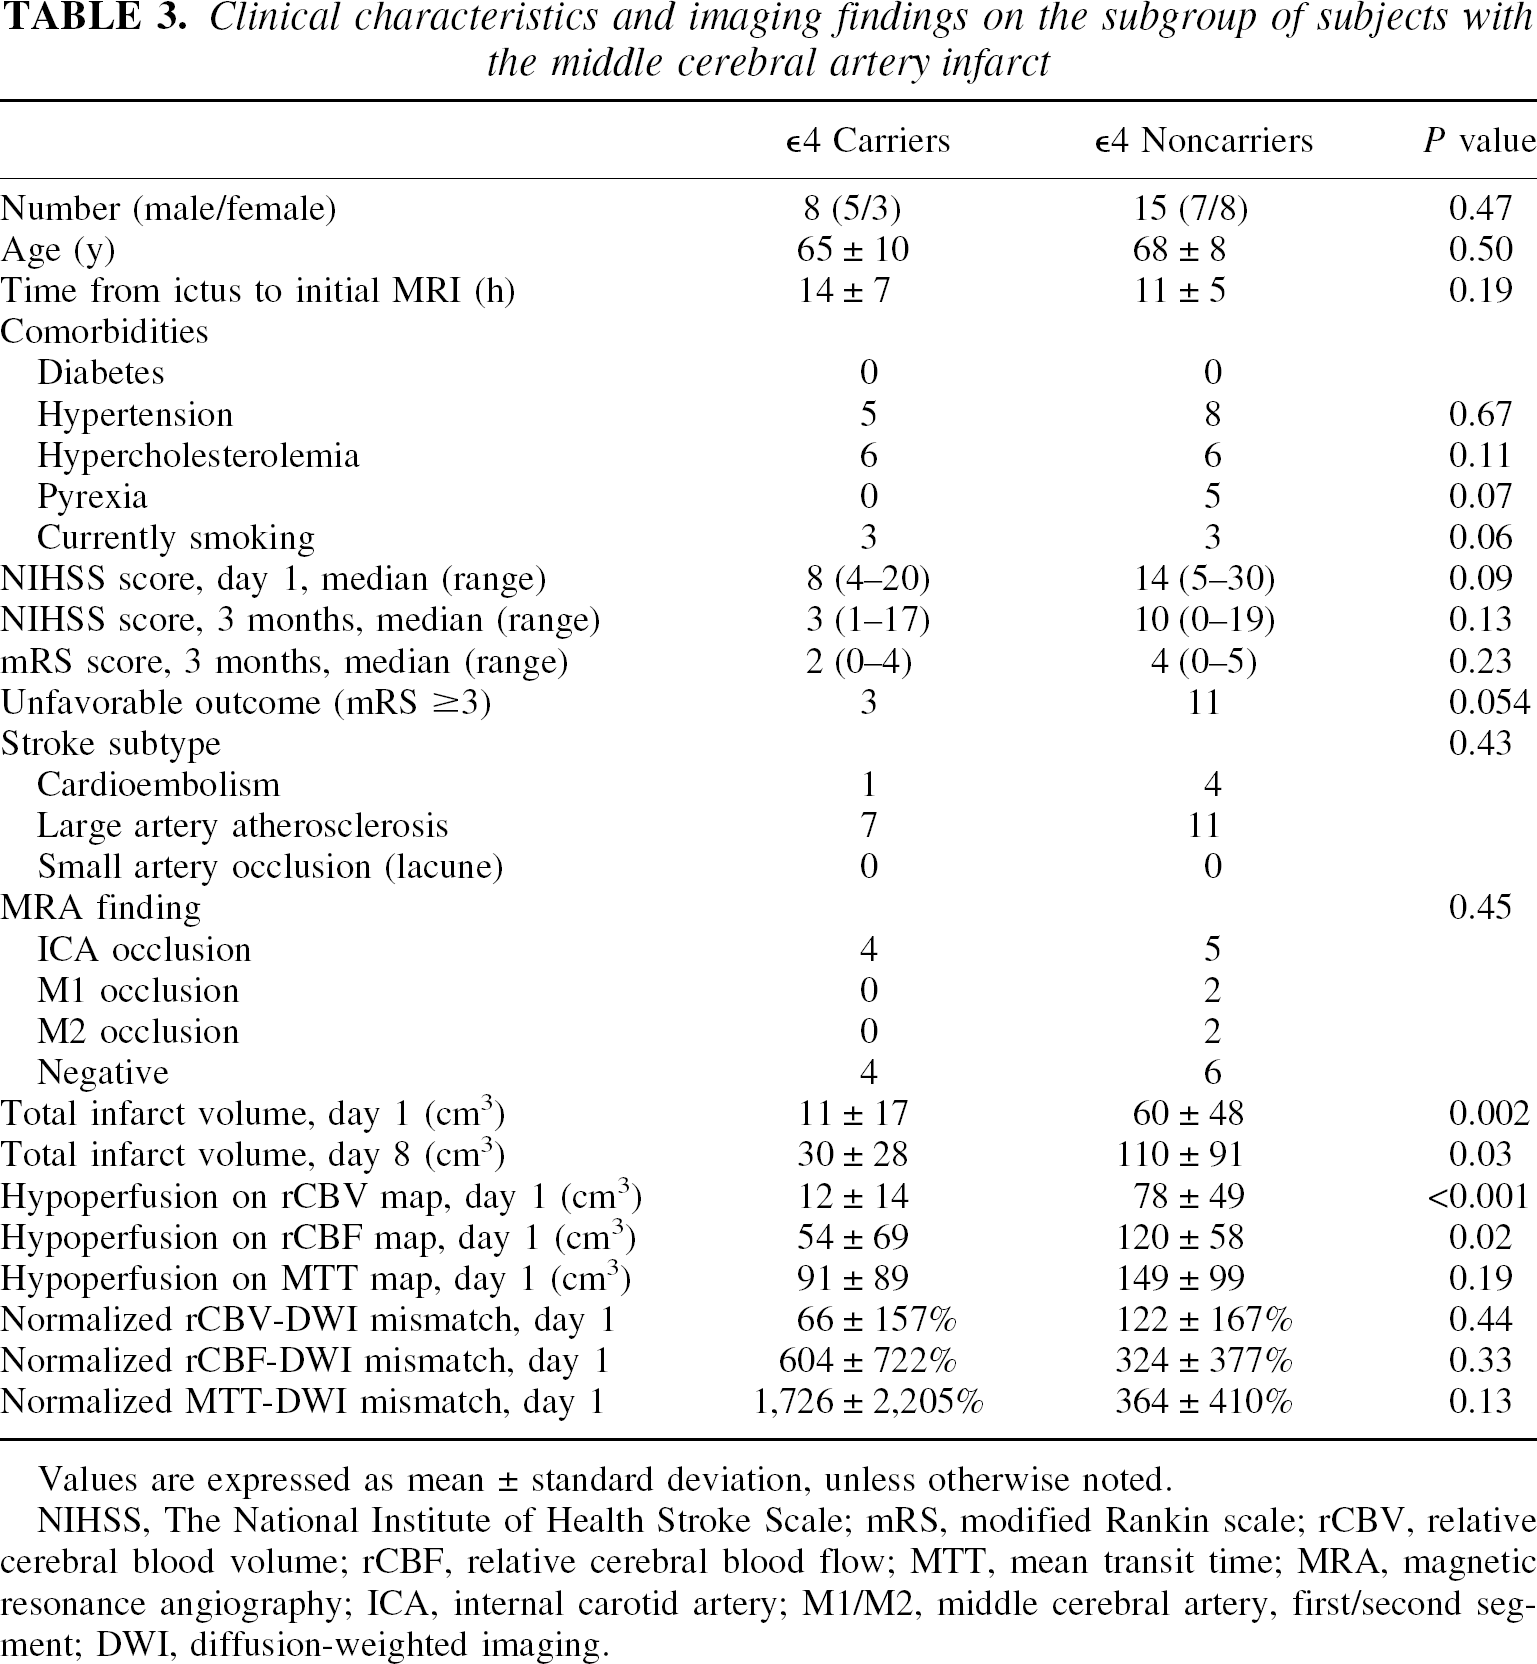
Values are expressed as mean ± standard deviation, unless otherwise noted.
NIHSS, The National Institute of Health Stroke Scale; mRS, modified Rankin scale; rCBV, relative cerebral blood volume; rCBF, relative cerebral blood flow; MTT, mean transit time; MRA, magnetic resonance angiography; ICA, internal carotid artery; M1/M2, middle cerebral artery, first/second segment; DWI, diffusion-weighted imaging.
Again, the total infarct volume was significantly smaller in the ε4 carriers compared with noncarriers on day 1, and this difference persisted by day 8. On average, however, the total infarct volume in this subgroup increased 173% of the initial infarct volume in the ε4 carriers compared with 84% in the noncarriers (t = 2.32, P = 0.03). In the MCA subgroup on day 1, the ε4 carriers displayed significantly smaller hypoperfused tissue volumes in the rCBF and rCBV maps but not in the MTT map. There were no differences between the volumes of the normalized rCBV-DWI mismatch, rCBF-DWI mismatch, or MTT-DWI mismatch between the two subgroups (Table 3).
The correlations between the neurologic and functional status and the imaging findings in the MCA subgroup are presented in Table 4. They are identical to the findings in the entire group. In the ε4 noncarriers, the total infarct volume on days 1 and 8 and the volumes of hypoperfusion were significantly correlated with the NIHSS score on day 1 and at 3 months, and with the mRS at 3 months (r ⩾ 0.59, P < 0.02). In contrast, in the ε4 carriers, none of the imaging parameters correlated significantly with the clinical status initially or with the outcome at 3 months, with the exception of a significant correlation between hypoperfusion on rCBF map and the NIHSS score on day 1 (r = 0.77, P = 0.03).
Pearson correlation coefficients between infarct and hypoperfusion volumes, with clinical outcome in the subgroup of subjects with the middle cerebral artery infarct
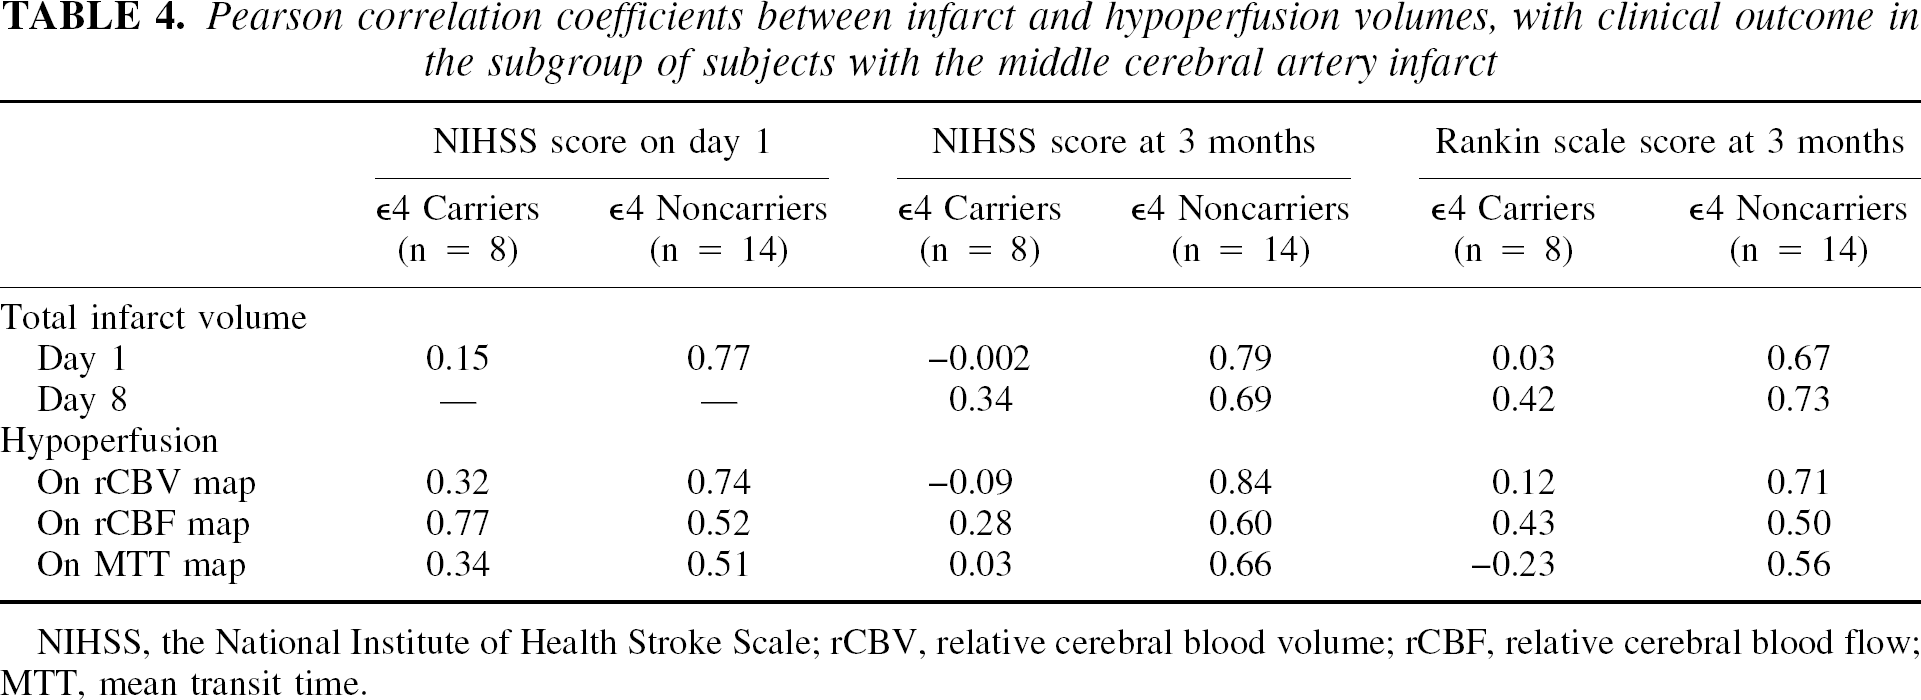
NIHSS, the National Institute of Health Stroke Scale; rCBV, relative cerebral blood volume; rCBF, relative cerebral blood flow; MTT, mean transit time.
DISCUSSION
In this study, we used DWI and PWI to study ischemic stroke in relation to the ApoE genotype. First, we found that the total infarct volume at the acute stage of stroke, less than 24 hours from the onset, was smaller in subjects who were ApoE allele ε4 carriers. The difference in the lesion size had vanished by day 8, reflecting relatively increased lesion growth. In a subgroup of patients with MCA stroke, the difference persisted, but the increase in the lesion growth was greater. In general, the findings within this subgroup were very similar compared with the entire study sample. These findings of increased lesion growth in the ApoE ε4 carriers are in line with theories of increased general vulnerability of the brain in the ApoE ε4 carriers, as suggested previously by increased vulnerability or impaired recovery of the brain in various conditions (Alberts et al., 1995; Helisalmi et al., 1996; Teasdale et al., 1997), and experimental studies on stroke (Laskowitz et al., 1997; Sheng et al., 1998, 1999; Horsburgh et al., 1999), but not clinically in human stroke (McCarron et al., 2000).
The detrimental effects of harboring an ε4 allele can also be observed in the patterns of correlations between imaging findings and neurologic and functional status and outcome. Neither initially nor during the follow-up did the infarct volumes correlate with clinical outcome in the ε4 carriers. This is in striking contrast with the noncarriers in whom strong correlations between the imaging findings and clinical outcome were found. Similarly, except for a single significant correlation between hypoperfusion on rCBF map and the NIHSS score on day 1, none of the imaging parameters were correlated with clinical status and outcome. This negative finding cannot be attributed to smaller number of ε4 carriers; the effect sizes form a pattern, being constantly of entirely different magnitude in the ε4 carriers versus noncarriers.
Previous studies have suggested that the volume of infarction and hemodynamics at the acute stage of stroke significantly correlate with neurologic and functional status and outcome (Lövblad et al., 1997; Beaulieu et al., 1999; Kluytmans et al., 2000). Diffusion-weighted imaging lesions have even been proposed as a part of a battery predicting stroke recovery (Warach et al., 2000) and as a surrogate marker of clinically meaningful lesion progression in stroke clinical trials (Baird et al., 2001). Our data extend, or rather narrow down, these findings to apply to the ApoE ε4 noncarriers only. Famous physicist Niels Bohr, the Nobel Prize Laureate in physics in 1922, has been quoted as saying “Prediction is very difficult, especially if it's about the future.” It is difficult to argue against this. While prediction of lesion growth on the individual level is challenging, it would be seem that such predictions would be especially challenging in individuals who are ApoE ε4 carriers.
Regardless of signs of increased vulnerability of the brain in the ε4 carriers, the results in terms of clinical outcome are also in accordance with those observed by McCarron et al. (2000). There were no significant differences in clinical or neurologic status at either acute stage or in the follow-up. A more cautious interpretation of this finding, however, is that the follow-up time was only 3 months, similar to the study by McCarron et al. (2000), and that this may be too short a time to observe the potentially harmful effects of the ε4 allele in its full extent. For example, ApoE ε4 allele increases the risk of dementia after stroke, the development of which may require more than 3 months (Basun et al., 1996; Slooter et al., 1997). Finally, the possibility of selection bias cannot be excluded. Given the adverse outcome related with the ε4 allele, it is possible that the ε4 carriers with larger infarcts may have been lost and were not available for the follow-up. This source of bias, however, may only limit conclusions about the initial lesion size, but it is not likely to account for the main thesis of this article, that is, the increased vulnerability of the brain in the ε4 carriers also in human stroke.
The exact mechanisms of ApoE genotype and increased vulnerability of the brain cannot be resolved by this study and remain to be elucidated. There is, however, one interesting point worth considering, namely, the smaller lesions of the ε4 carriers at the acute stage. If this is a true finding and not a coincidence, it may partly explain the findings of this study and the study by McCarron et al. (2000) in terms of clinical outcome. The smaller the lesion, the better the outcome in general. The existing literature in experimental studies on stroke (Laskowitz et al., 1997; Sheng et al., 1998, 1999; Horsburgh et al., 1999) has proposed a number of potential mechanisms regarding the role of ApoE in brain injury, including decreased availability of lipids, protection against oxidative stress, and downregulation of inflammatory response. While all these are plausible mechanisms to explain the long-term findings of the present study, it would seem that the time frame of these phenomena is too long to explain the findings of this study during the acute stage. Therefore, provided that the findings of the present study during the acute stage are replicated, there might be a more rapid mechanism in the action of the ApoE in the response to an acute injury that remains to be identified. A previous experimental study proposed increased cerebral blood flow in ApoE knockout mice during ischemia (Sheng et al., 1999), which may indicate ApoE-related changes in regulation of vasodilatation or vasoconstriction. Based on the results of the present study, and given that ApoE is expressed in vascular smooth muscle (Mahley and Rall, 2000), changes in the regulation of vasoactive mechanisms may be one candidate to explain the findings. Regarding the central nervous system, it is notable that vasoreactivity is regulated by both parasympathetic and sympathetic activity via the central cholinergic system. The cholinergic activity is different in the ε4 carriers versus noncarriers, and the cerebral vessels are endowed with acetylcholinesterase positive fibers (Mahley and Rall, 2000). Finally, ApoE ε4 carriers may differ from noncarriers in terms of reduced thrombotic tendency, which may also be a factor in explaining the initially smaller lesion size (Weir et al., 2001).
In summary, ApoE genotype is not likely to be without significance when predicting the clinical outcome in patients with acute stroke based on DWI and PWI findings. In this study, ApoE allele ε4 was associated with increased vulnerability of the brain, which is reflected in relatively greater lesion growth as well as in the lack of correlations between the imaging findings and clinical outcome in the ε4 carriers. Further prospective studies are needed to study whether or not the possibility of selection bias contributed to our findings in terms of smaller initial infarct volumes in the ε4 carriers. The range of ε4 allele frequency is about 5% to 35%, depending on the population studied, and it is approximately 15% in the North American population of European descent (Mahley and Rall, 2000). Thus, the effects of ApoE polymorphism should perhaps be accounted for when predicting lesion growth with DWI and PWI studies. By stating this, we are not endorsing ApoE genotyping on a regular basis. Rather, we are emphasizing the need to bear in mind the potentially confounding effects of ApoE polymorphism. On the other hand, in clinical studies such as drug trials, controlling for ApoE genotype may be justified.
Footnotes
Acknowledgments:
The authors thank Markku Kalinen for his assistance with collecting the blood samples, and Faith Gunning-Dixon for revising the language in an earlier version of the manuscript.