
Abstract
Dynamic cerebral autoregulation (dCA) in healthy young adults displays a daily variation. Whether the rhythm exists in patients with stroke is unknown. We studied 28 stroke patients (age: 26–83 years, 7 females) within 48 hours after thrombolysis. dCA was assessed 54 times in these patients during supine rest (twice in 26 and once in 2 patients): 9 assessments between 0–9AM, 12 between 9AM–2PM, 20 between 2–7PM, and 13 between 7PM–12AM. To estimate dCA, phase shifts between spontaneous oscillations of cerebral blood flow velocity (CBFV) in the middle cerebral artery and arterial blood pressure (BP) were obtained in four frequency bands: <0.05 Hz, 0.05–0.1 Hz, 0.1–0.2 Hz, and >0.2 Hz. CBFV-BP phase shifts at <0.05 Hz were significantly larger between 2–7PM, suggesting better dCA, than those at other times (p < 0.0001), and the daily rhythm was consistent for stroke and non-stroke sides. No significant rhythms were observed at higher frequencies (all p > 0.2). All results were independent of age, sex, stroke type and severity, and other cardiovascular conditions. dCA after stroke showed a daily rhythm, leading to a better regulation of CBFV at <0.05 Hz during the afternoon. The finding may have implications for daily activity management of stroke patients.
Introduction
Stable cerebral blood flow (CBF) is crucial for normal brain functioning due to the limited energy reserve in the brain. 1 Cerebral autoregulation (CA) is an important mechanism to maintain relatively stable CBF despite changes in systemic blood pressure (BP) that can be induced by mental and postural changes during daily activities.2–6 CA involves myogenic and neurogenic regulation, and it functions through dilation and constriction of cerebral arterioles to adjust cerebrovascular resistance in response to BP changes. 7 Impaired CA causes more passive dependence of CBF on BP even when BP fluctuates within the normal pressure range, leading to large variations in CBF and potentially causing damage to brain tissue due to either insufficient blood supply or increased intracranial pressure.
It has been shown that CA is impaired in various vascular disorders such as stroke, hypertension, and diabetes.8–12 Impaired CA also predicts an increased risk of stroke and adverse outcomes. For instance, in patients undergoing cardiac surgery with cardiopulmonary bypass, impaired CA increased the risk for stroke by >4 times. 13 In patients with carotid stenosis, impaired CA was found to be likely linked to a higher ipsilateral hemispheric stroke risk. 14 Impaired CA was also associated with larger infarction and poor clinical outcomes in patients after acute ischemic stroke. 15 Thus, impaired CA may be one of the pathways underlying the increased risk for stroke in patients with prior stroke, hypertension, or diabetes.16,17
CA can be evaluated by examining the changes of CBF either when BP is maintained at steady states (static CA) or when BP changes rapidly and continuously (dynamic CA: dCA).18,19 dCA can be assessed non-invasively by examining the relationship between cerebral blood flow velocity (CBFV) and BP oscillations. 20 Intact CA is characterized by certain advanced phases of CBFV oscillations as compared to that of BP oscillations, and such CBFV-BP phase shift is reduced when CA is impaired and CBFV depends on BP more passively. 20 Studies have indicated that the CBFV-BP phase relationship is more sensitive to changes in CA under pathological conditions than other CA measures based on the amplitudes of CBFV and BP. 20
A previous study showed that CA in healthy young individuals is not constant across 24 hours, but instead displays a daily variation with better CBFV regulation in the afternoon as compared to the early morning hours. 21 It is believed that the morning reduction of CA may be linked to or explain the well-known higher risk for stroke in the morning; 22 however, it is unknown whether CA in more vulnerable populations such as patients with stroke also displays a daily rhythm. To address this knowledge gap, we studied 28 patients who just had incident stroke, and we examined their dCA at different times of day within 48 hours after they underwent thrombolysis. We hypothesize that dCA in these stroke patients functions better in the afternoon, leading to a larger CBFV-BP phase shift. In addition, variations in many physiological variables such as CO2 and heart rate may affect BP and CBF, thus impacting the assessment of the CBFV-BP relationship.23–26 Thus, we also explored the daily variations of these physiological measures as well as mean CBFV and BP in the same patients after stroke.
Material and methods
Subject and protocol
This observational study involved only secondary data analysis of the existing de-identified datasets collected from patients who underwent their routine treatment procedures. Participants were recruited in Hospital das Clínicas at São Paulo between 2015–2017. All of the participants had had a stroke and had undergone thrombolysis within ∼5 h after the onset of symptoms. Twenty-eight participants who had at least one valid CA assessment within 48 hours after thrombolysis were included in this study, including 27 with stroke on one hemisphere and one with vertebrobasilar (VB) stroke. The time of CA assessment ranged across the whole cycle of 24 hours. The National Institutes of Health Stroke Scale (NIHSS) was performed to evaluate stroke-related neurological deficits before and after thrombolysis. All participants provided informed consent and research protocols were approved by the Institutional Review Board from the University of São Paulo. The study was approved by the IRB of Massachusetts General Brigham.
Data collection
For each assessment, patients remained supine at rest for up to 25 min. Beat-to-beat arterial blood pressure (BP) was recorded using Finometer-PRO, and cerebral blood flow velocity (CBFV) was measured from middle cerebral artery [MCA] non-invasively using transcranial doppler (Doppler box, DWL; Germany) (Figure 1). MCA was insonated from the temporal windows by placing the 2-MHz probe in the temporal area above the zygomatic arch. Each probe was positioned to record the maximal CBFV and fixed at the desired angle using a three-dimensional positioning system attached to the light-metal probe holder. Fourier transform of the Doppler shift, a difference between the frequency of the emitted signal and the frequency of the reflected signal, was used to calculate CBFV. BP and CBFV were recorded simultaneously at a sampling rate of 100 Hz for up to 25 min. Valid CBFV recordings were available on only one hemisphere side in 11 assessments, and on both hemisphere sides in the other 17 assessments. End-tidal carbon dioxide (ETCO2; Transmai MX-200) was also measured using a nasal cannula throughout the assessment period.
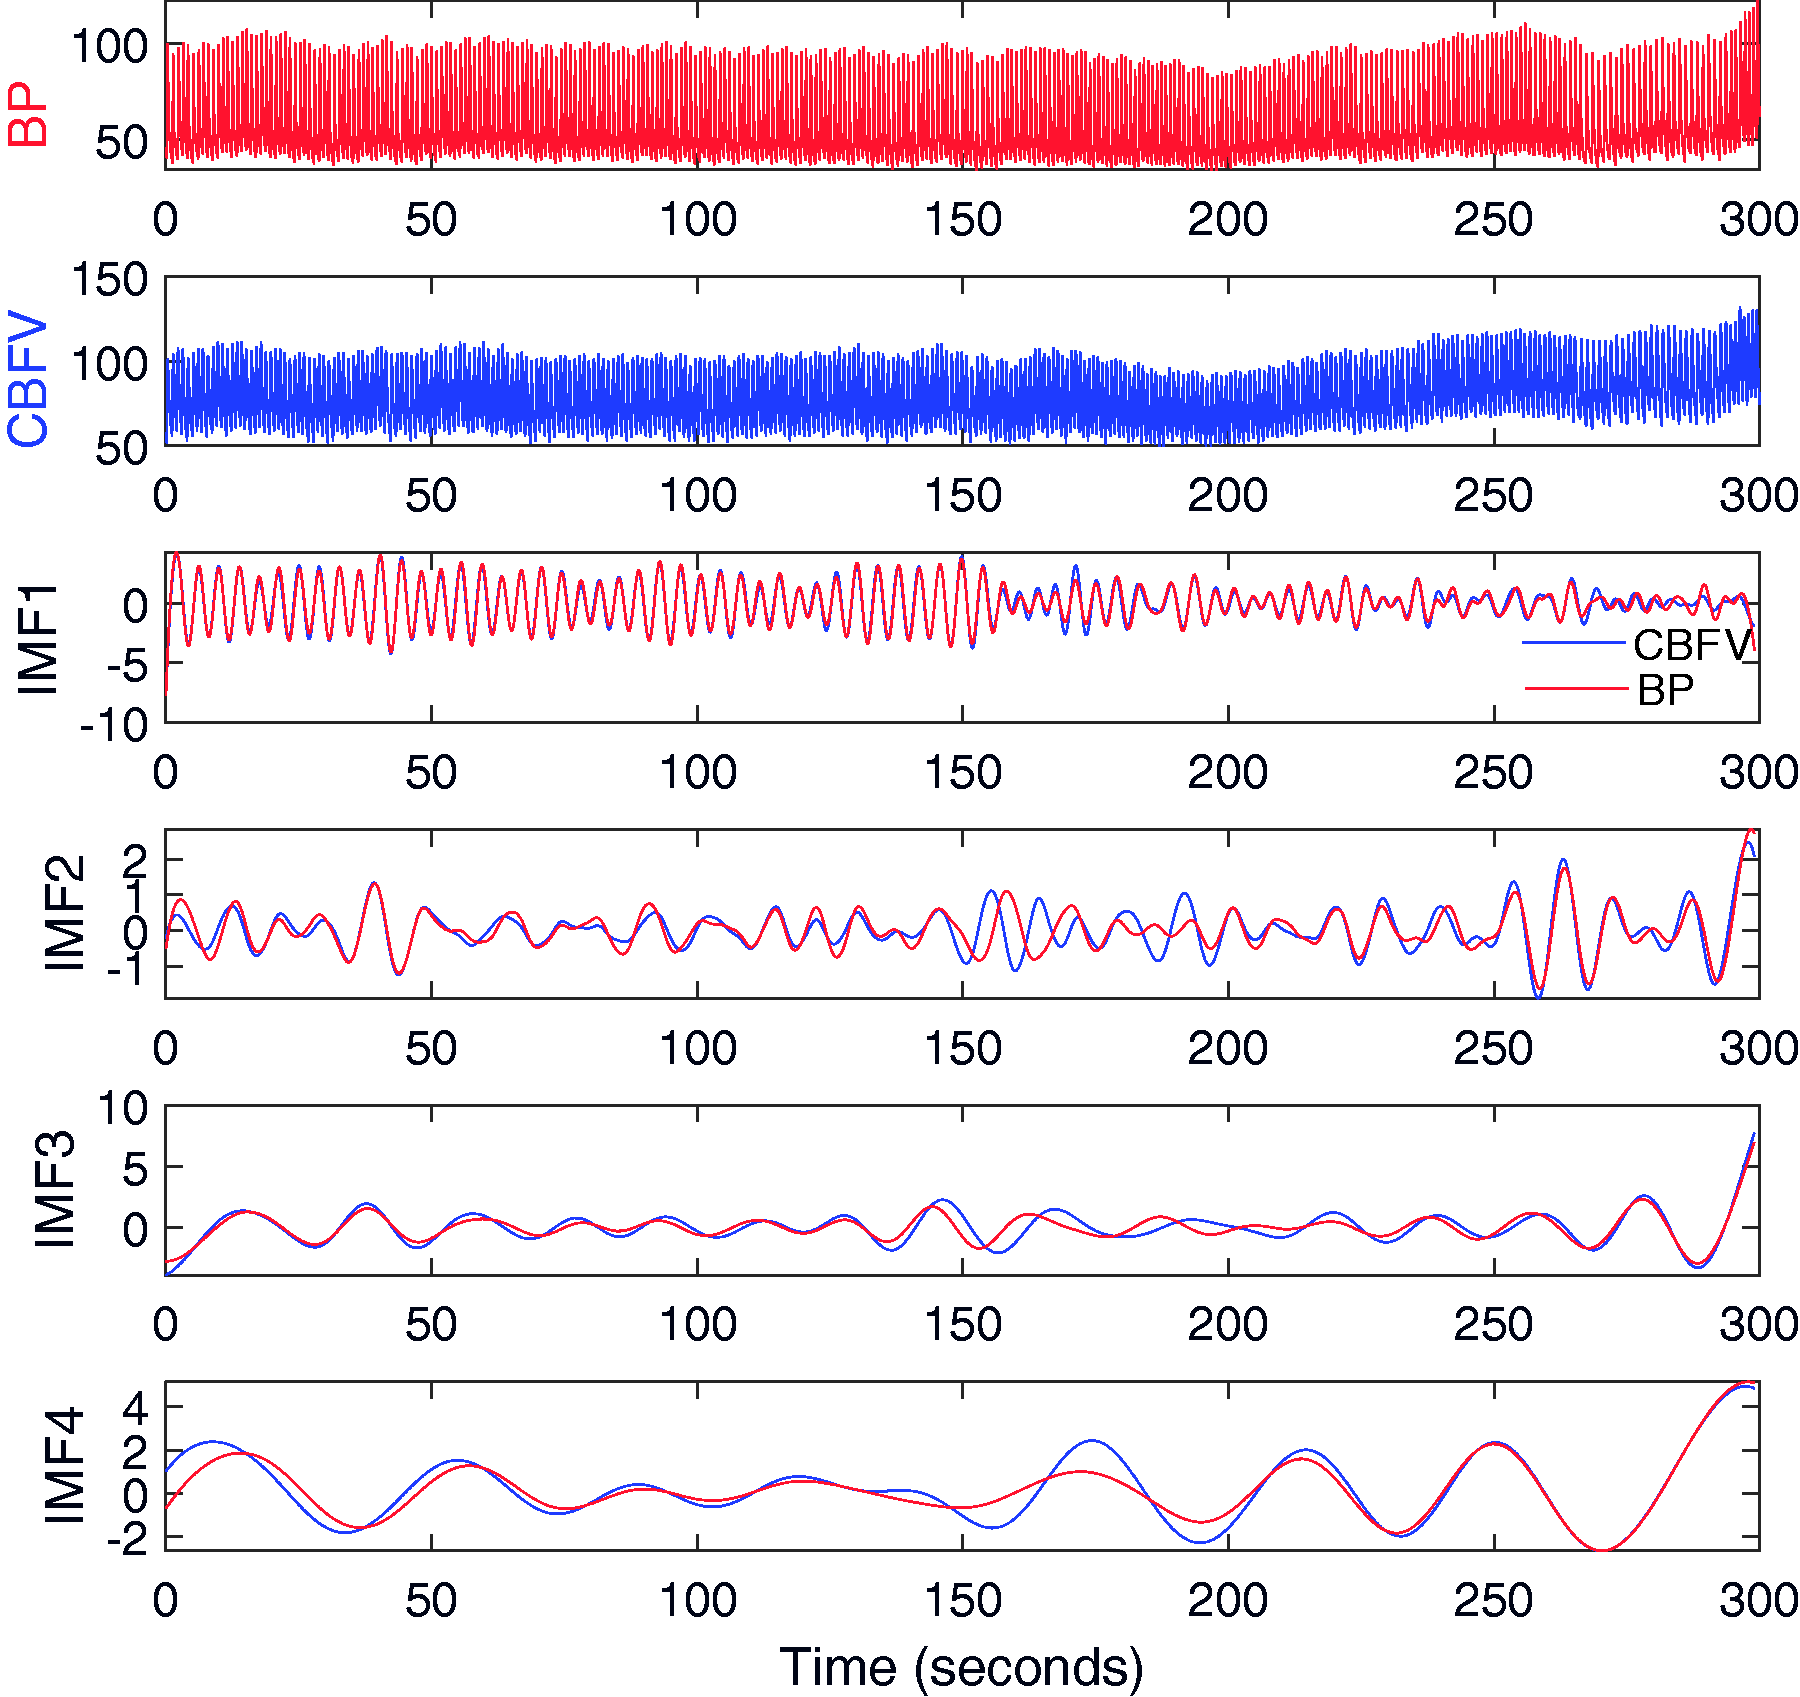
Representative blood pressure (BP) and cerebral blood flow velocity (CBFV) recordings of a patient after thrombolysis, and their oscillatory components at different frequencies. For raw BP or CBFV signal (top two panels), their oscillatory components, called intrinsic mode functions (IMFs; Panels 3–4), were extracted by the empirical mode decomposition (EMD). Each IMF represented oscillations in the raw signal within a narrow band of frequencies. For each IMF of BP, the corresponding IMF of BFV at the same frequency was matched to determine the phase shift between BP and CBFV at the corresponding frequency. The unit of BP is mm Hg and the unit of CBFV is cm/second.
Data analysis
All the recordings were visually inspected and only the segments of good quality (i.e., stable and without noise and artifacts) were selected for analysis according to the guideline published by the international Cerebrovascular Research Network (formal Cerebral Autoregulation Research Network). 27 The total duration of selected segments for each recording was 5.8 ± 2.1(SD) min (range: 2.5–14.5 min) with 9 recordings <5 min. Mean values of BP, CBFV, and CO2 were obtained from the selected data during each assessment. Mean heart rate during each assessment was also estimated from BP waveform recordings using an analysis program of cardiovascular signals (HeartScope II, AMPS-LLC). For the recordings with bilateral CBFVs, mean CBFV and mean CBFV-BP phase shift was calculated by averaging the values of both sides; for recordings with only one side CBFV, the values on the available side were used as the means.
Assessment of dCA
To evaluate dCA, we performed the multimodal pressure flow (MMPF) analysis to examine the phase relationship between CBFV and BP oscillations at different frequencies. 11 As a time-domain analysis, MMPF utilizes the novel empirical mode decomposition (EMD) that can better extract and examine nonlinear oscillations in nonstationary physiological signals. 28 As described previously, 11 performing the MMPF involved the following steps: (1) EMD was used to extract oscillatory components in a BP or CBFV signal at different frequency bands, called intrinsic mode functions (IMFs), each within a narrow band of frequencies (Figure 1). (2) Matched IMFs of BP and CBFV were identified in the frequency range of interest (0.01–0.5 Hz in this study). (3) The instantaneous phases of each BP IMF and matched CBFV IMF were calculated using the Hilbert transform, and the ‘instantaneous phase shift’ between BP and matched CBFV oscillatory components was obtained at each time point (see Supplementary Figure S1). (4) Based on instantaneous phases, each BP/CBFV IMF was divided into individual cycles with a phase increase of 360 degrees for each cycle, and cycle length or frequency of each cycle was then determined. (5) For each frequency band, mean phase shift was obtained from the instantaneous phase shifts of all CBFV/BP oscillatory cycles in each of the interested frequency bands. To eliminate the unmatched BP/CBFV cycles and avoid phase wrapping, the BP/CBFV cycles where the ‘instantaneous phase shift’ changed over 360 degrees were identified and removed in the calculation of mean phase shifts (See Supplementary Figure S1). In this study, we focused on four frequency bands: <0.05 Hz, 0.05–0.1 Hz, 0.1–0.2 Hz, and >0.2 Hz. We also calculated the mean CBFV-BP phase shifts in the traditional three frequency bands recommended for the transfer function analysis (TFA) 27 : very low frequency (VLF: 0.02–0.07 Hz), low frequency (LF: 0.07–0.2 Hz), and high frequency (HF: 0.2–0.5 Hz). Mean phase shift in each frequency band was obtained for left and right sides, separately.
Statistical analysis
All data were tested for normality. To determine whether dCA had a daily rhythm and whether the rhythm depended on the frequency of CBFV/BP oscillations, we used a mixed model ANOVA, in which CBFV-BP phase shift on the stroke side or non-stroke side was the outcome; frequency (four bands: <0.05 Hz, 0.05–0.1 Hz, 0.1–0.2 Hz, and >0.2 Hz; or three frequency bands: VLF, LF, and HF), time of assessment (four bins: 12 AM–9 AM, 9 AM–2 PM, 2 PM–7 PM, 7 PM–12 AM), and their interaction were included as fixed effects; and the subject was included as a random intercept. The time of assessments bins were chosen to ensure sufficient power in each bin (see Figure 2). The same mixed model was repeated to examine the effects on mean CBFV-BP phase shifts on both sides. Post hoc analyses were used to examine whether CBFV-BP phase shifts in each frequency bin displayed significant daily variations. In all these models, we considered and tested the potential effects of age, sex, stroke subtype, NIH Stroke scales before and after thrombolysis, Rankin score, time lag between symptom to thrombolysis, and other cardiovascular conditions (hypertension, diabetes, atrial fibrillation), mean CO2, mean BP, mean heart rate, and CBFV by including each variable individually in the mixed model. To explore whether there were daily rhythms in other variables (such as ETCO2, mean BP, heart rate, mean CBFV, stroke-side CBFV, and non-stroke side CBFV), we also used mixed models with time of assessment as the fixed effect and subject as a random intercept. All the statistical analyses were performed using JMP Pro15.0 (SAS Institute, Cary, NC).
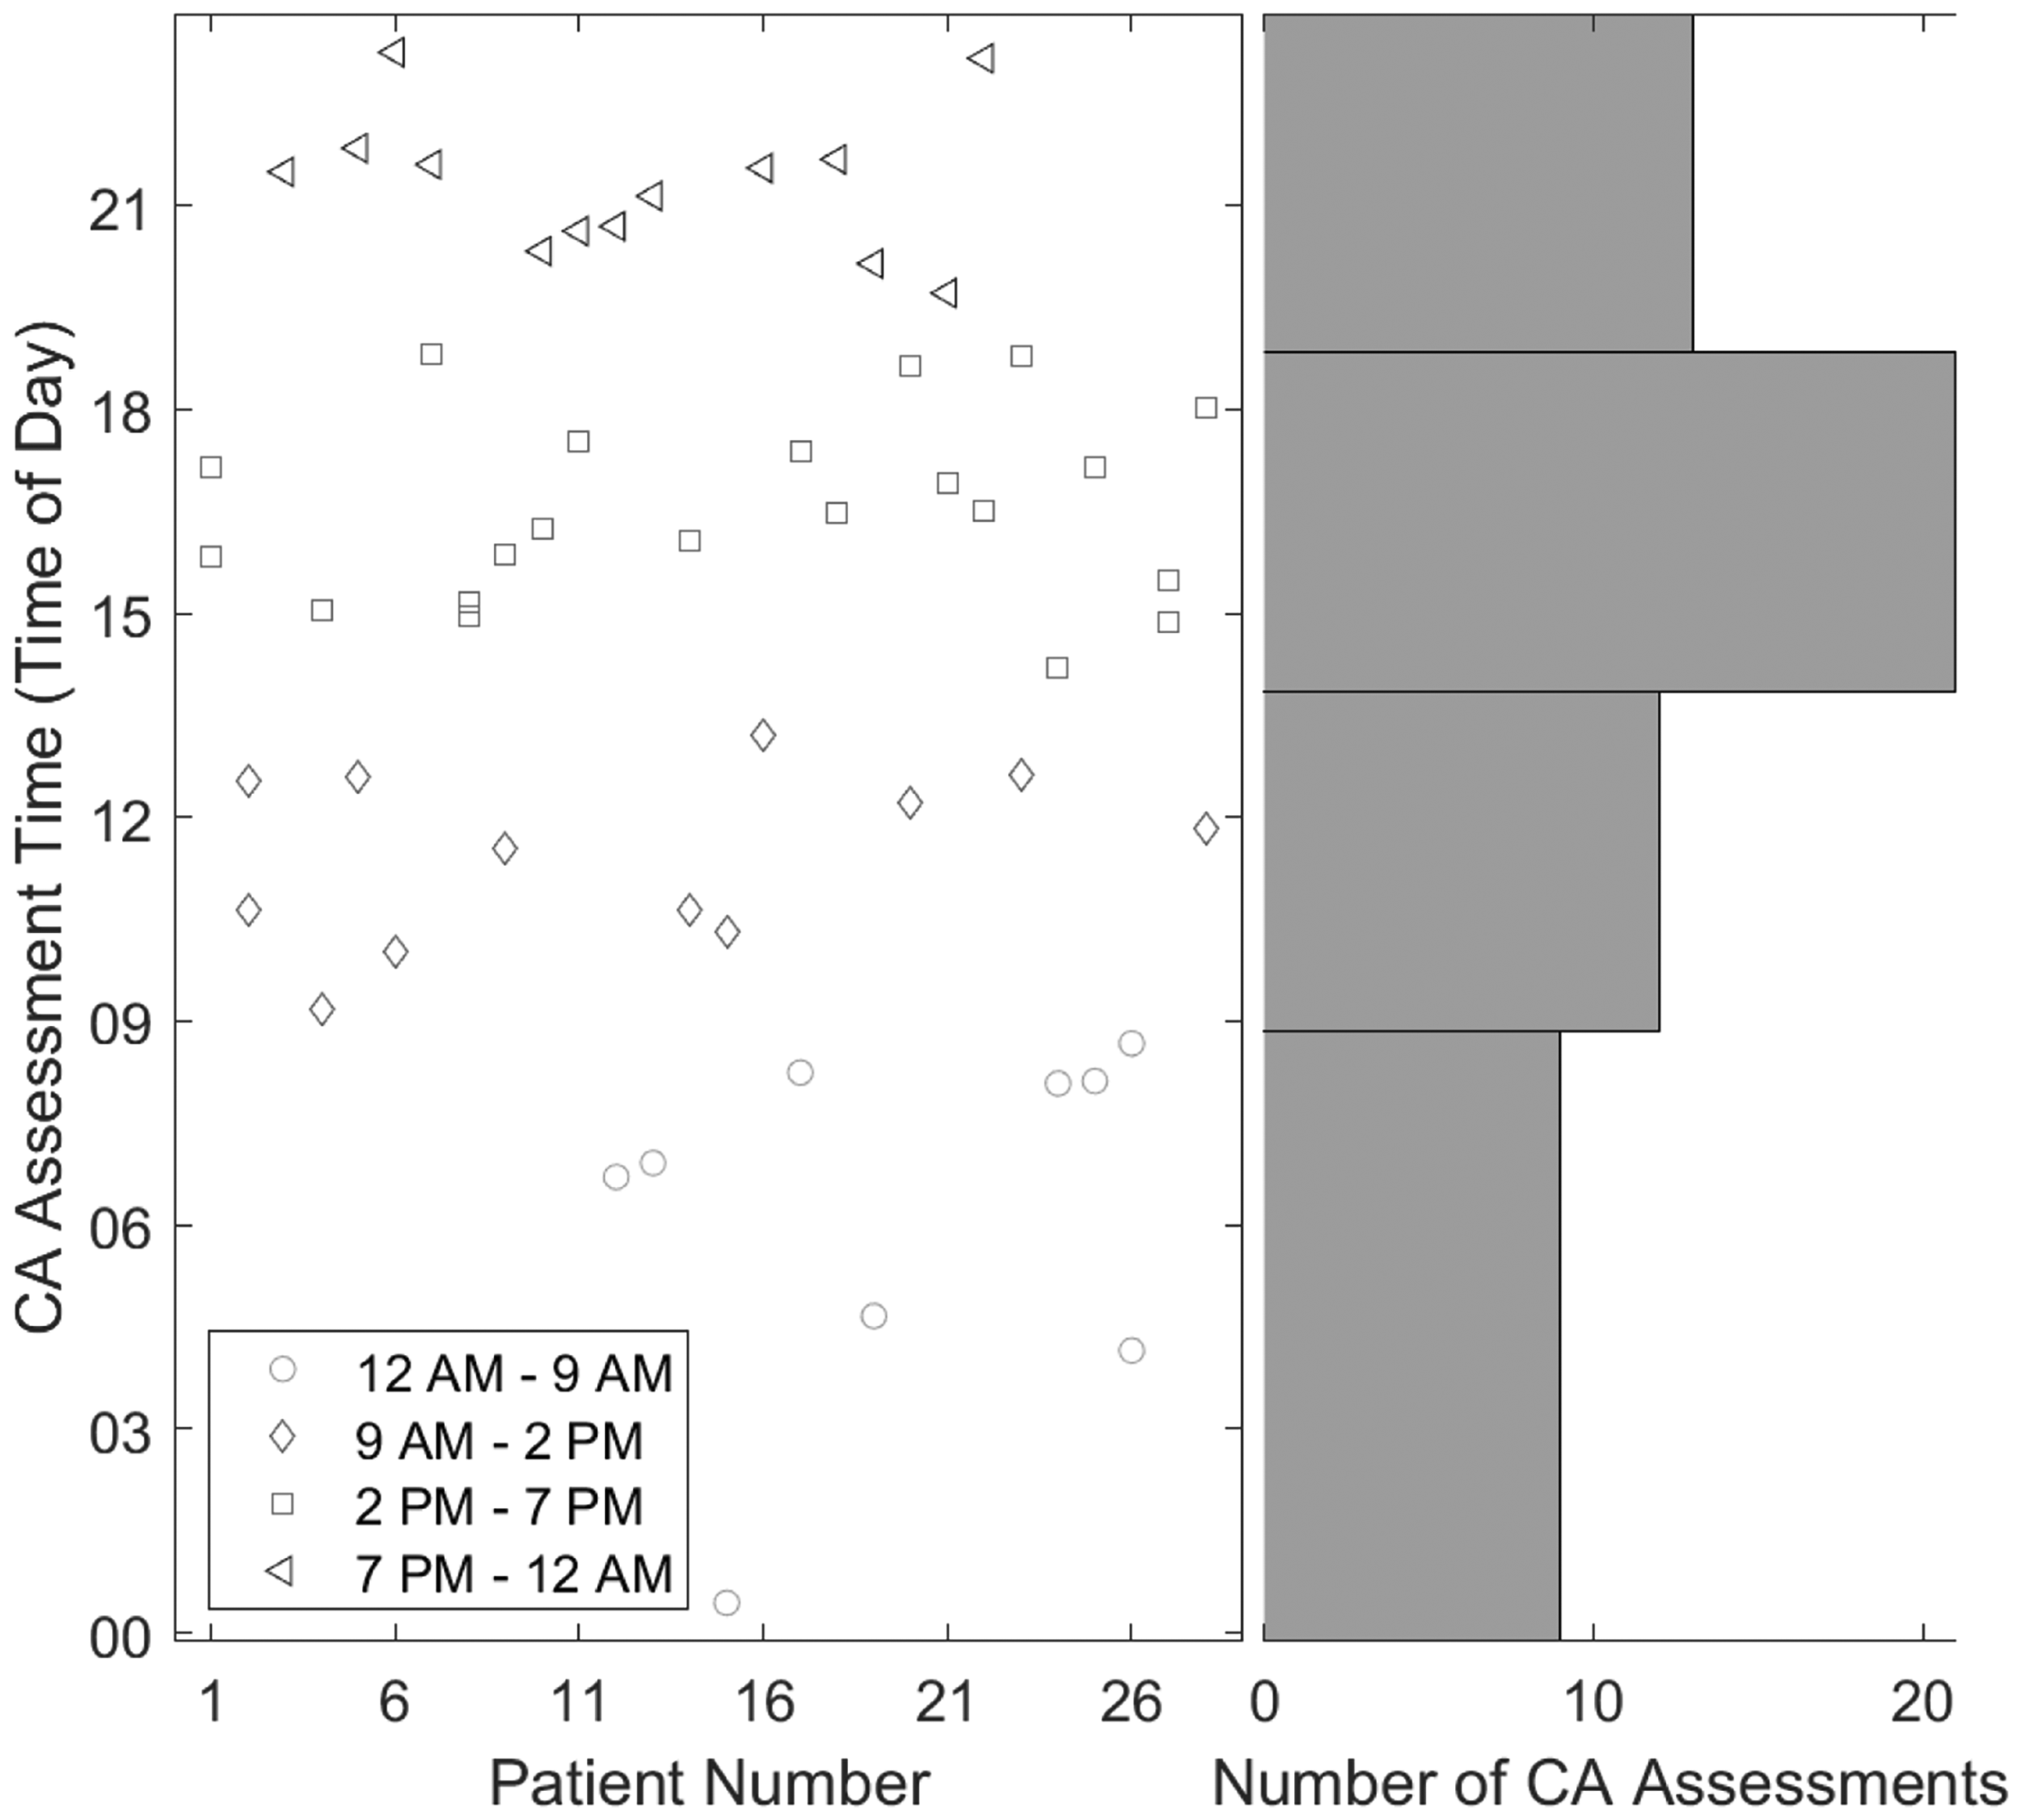
Timing of dCA assessments. (Left panel) Time of the day for CA assessments of 28 participants. (Right panel) The number of CA assessments within each of four time windows: 12 AM–9 AM, 9 AM–2 PM, 2 PM–7 PM, and 7 PM–12 AM. Time windows of unequal length were chosen to ensure an adequate number of samples in the morning hours, as seen in the figure. There were 54 CA assessments from of 28 participants. Each data point is for a CA assessment, and recordings from the same subject are vertically aligned (i.e., x axis is Patient number).
Results
We studied 28 stroke patients between the ages of 26–83 years old, including 7 females and 21 males. The detailed information is summarized in Table 1.
Demographic and clinical metrics of study participants.
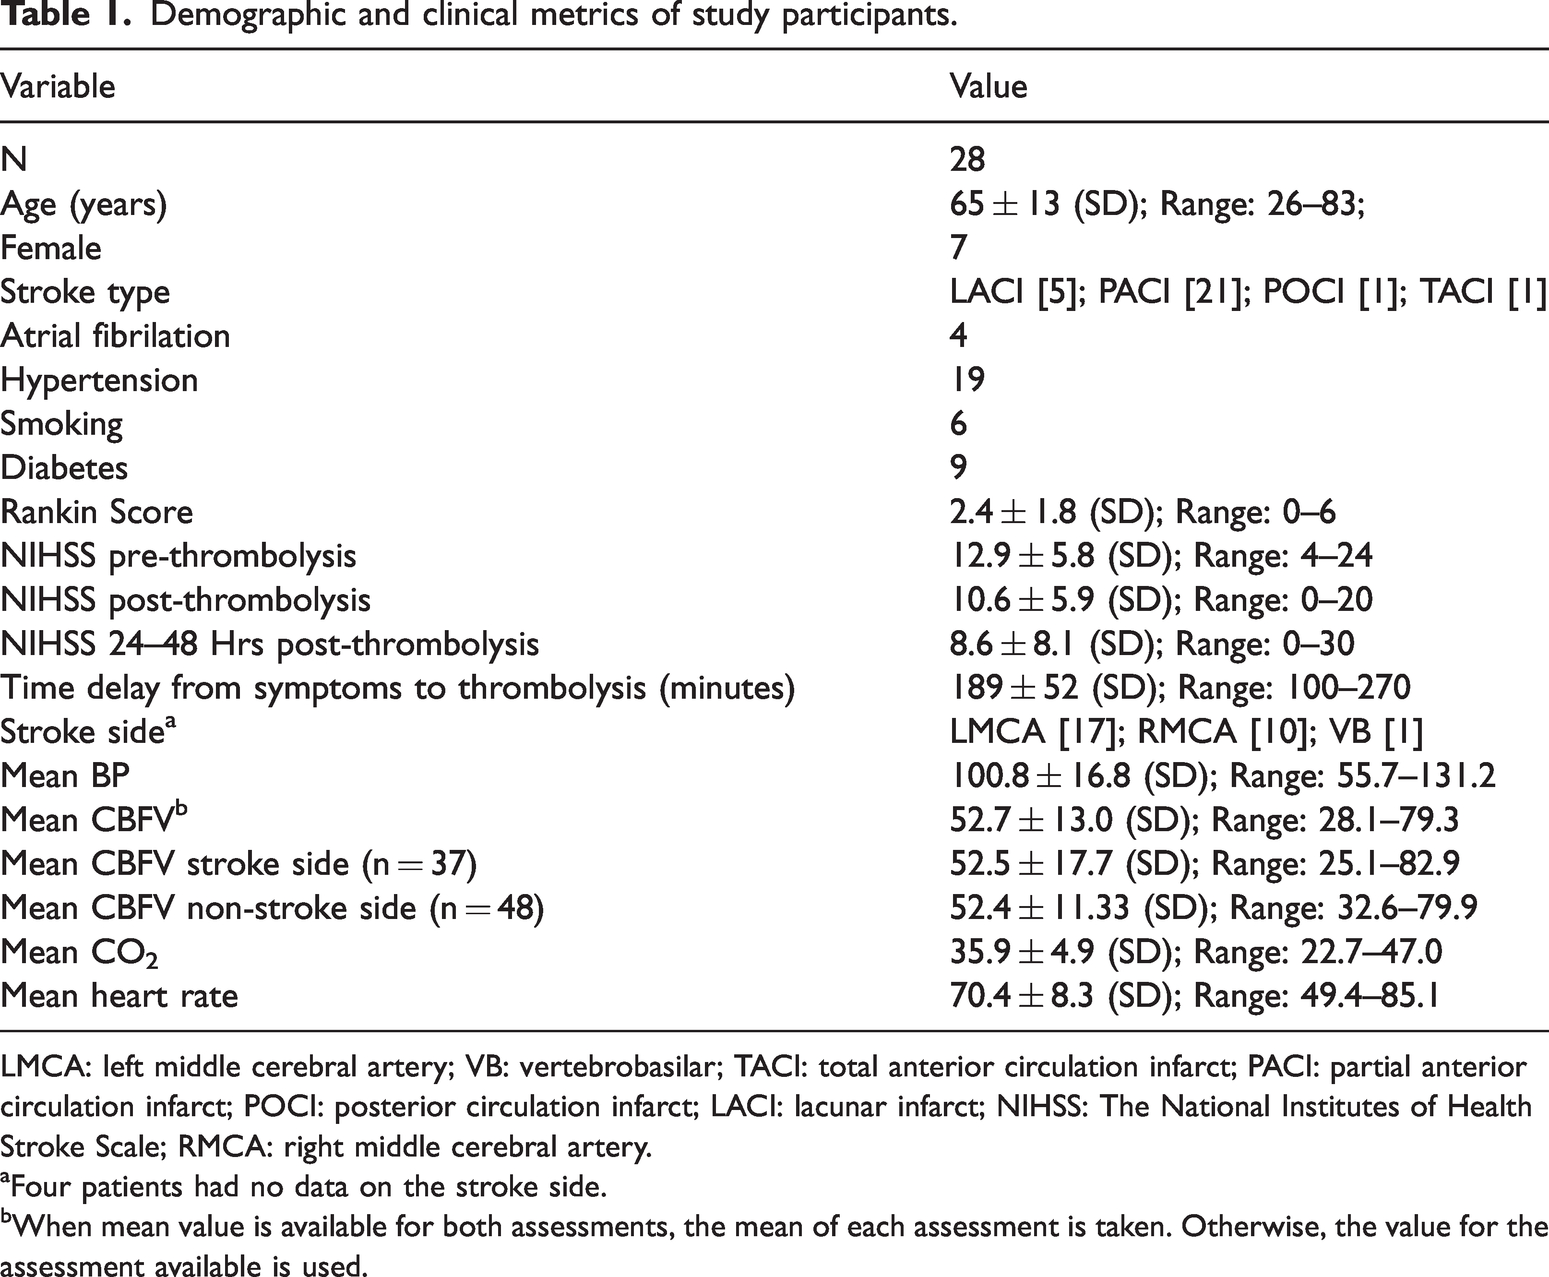
LMCA: left middle cerebral artery; VB: vertebrobasilar; TACI: total anterior circulation infarct; PACI: partial anterior circulation infarct; POCI: posterior circulation infarct; LACI: lacunar infarct; NIHSS: The National Institutes of Health Stroke Scale; RMCA: right middle cerebral artery.
aFour patients had no data on the stroke side.
bWhen mean value is available for both assessments, the mean of each assessment is taken. Otherwise, the value for the assessment available is used.
Fifty-four dCA assessments were performed within ∼48 hours following thrombolysis (twice in 26 patients and once in 2 patients). Nine assessments were taken between 0–9AM, 12 between 9AM–2PM, 20 between 2–7PM, and 13 between 7PM–12AM (Figure 2). These time bins were chosen to ensure sufficient data points in each bin. There was a significant interaction effect of assessment time and frequency on mean CBFV-BP phase shifts of left and right MCAs (p = 0.0002). Specifically, at frequency <0.05 Hz, phase shifts between 2–7 PM were larger (predicted Mean: 47.7°; 95% CI: 39.1°–56.3°) than those at other times (0–9 AM: Mean: 7.4°; 95% CI: −5.4°–20.2°; 9 AM–2 PM: Mean: 6.6°; 95% CI: −4.4°–17.7°; 7 PM–12 AM: Mean: 13.9°; 95% CI: 3.3°–24.4°; p < 0.0001); assessment time had no significant effects on mean CBFV_BP phase shifts and non-stroke side CBFV-BP phase shifts in higher frequency bands (all p > 0.2) (Figure 3). The similar interaction effect was observed for stroke-side (p = 0.0262) and for non-stroke side CBFV_BP phase shifts (p = 0.0118) (Figure 3), i.e., stroke side: phase shifts at <0.05 Hz between 2–7PM were larger (predicted Mean: 45.8°; 95% CI: 34.2°–57.3°) than those at other times (0–9 AM: Mean: 11.2°; 95% CI: –5.8–28.2°; 9 AM–2 PM: Mean: 2.8°; 95% CI: –11.4°–17.0°; 7 PM–12 AM: Mean: 8.9°; 95% CI: –4.3°–22.0°; p < 0.0001); non-stroke side: phase shifts at <0.05 Hz between 2–7PM were larger (predicted Mean: 47.0°; 95% CI: 37.2°–56.7°) than those at other times (0–9 AM: Mean: 10.7°; 95% CI: –2.6°–24.1°; 9 AM–2 PM: Mean: 13.9°; 95% CI: 1.9°–26.0°; 7 PM–12 AM: Mean: 18.3°; 95% CI: 6.3°–30.3°; p < 0.0001); assessment time had no significant effects on stroke-side or non-stroke side phase shifts in higher frequency bands (all p > 0.2). The same interaction effects of assessment time and frequency were observed using three frequency bands (VLF, LF, and HF), i.e., the daily rhythm of CBFV-BP phase shifts was significant at VLF but not at LF or HF (see details in Supplementary Materials, Figure S2).
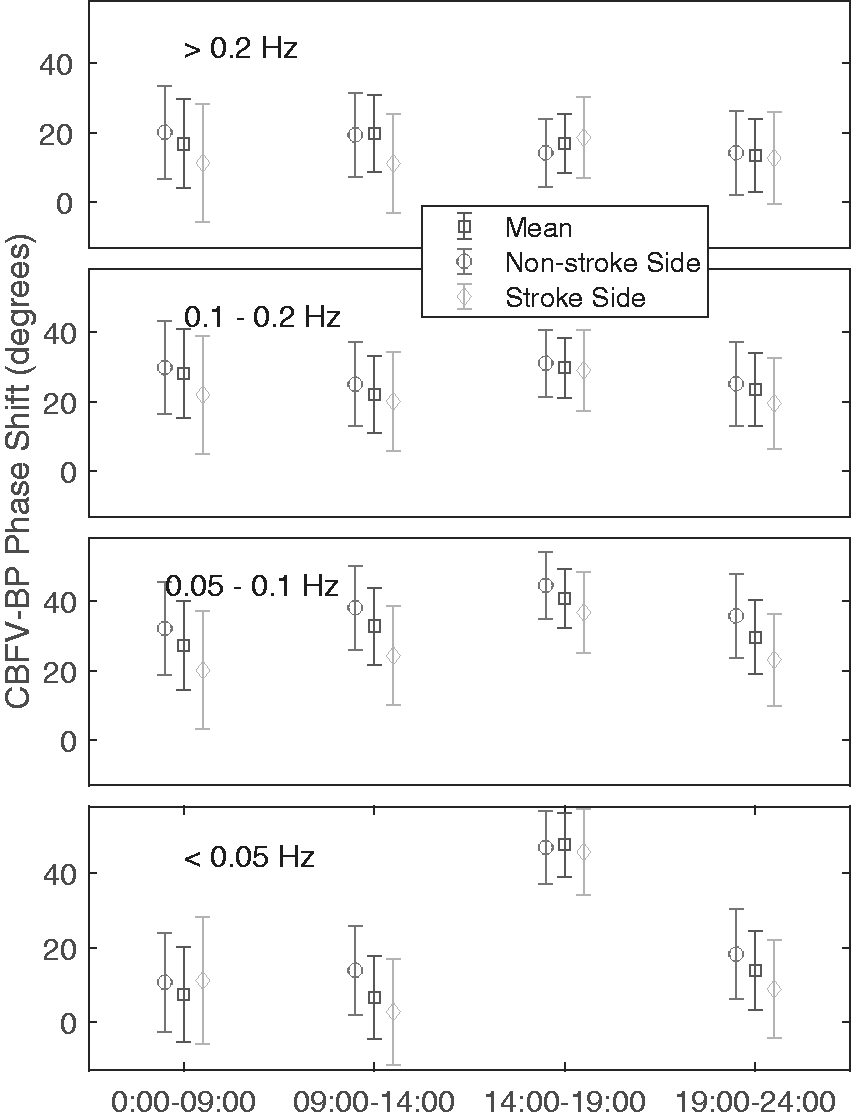
Effect of time of the day on phase shift between cerebral blood flow velocity (CBFV) and blood pressure (BP) at different frequencies. For each of 54 CA assessments (from 28 patients), phase shifts were obtained from the intrinsic mode functions (IMFs) of CBFV and corresponding IMFs of BP (see Figure 1) using Hilbert transform. For each cycle within each IMF of BP, mean CBFV-BP phase shift was calculated and assigned to one of the four frequency bands (<0.05 Hz, 0.05–1Hz, 0.1–0.2 Hz, 0.2–0.5 Hz) based on the frequency of the cycle. CBFV-BP phase shifts on the stroke side, non-stroke side, and the mean of both sides were calculated for each recording. Data are presented as predicted group means based on mixed mode models, and error bars indicate 95% confidence intervals.
In 9 recordings from 8 patients, the selected segment of good quality was shorter than 5 min. Though MMPF is suitable for short recordings, we did a sensitivity analysis by removing data points from the 9 recordings. Our findings remained, i.e., there was a significant daily rhythm in CBFV-BP phase shifts at frequencies <0.05 Hz (p < 0.0001 for stroke side, non-stroke side, and mean of both sides) with the highest phase shifts between 2–7 PM, and CBFV-BP phase shifts at higher frequencies showed no significant daily rhythm.
In addition, we did an independent sensitivity analysis by removing data points from the patient with stroke on both sides. Our findings remained as in the previous sensitivity analysis.
The effect of assessment time on CBFV-BP phase shift at <0.05 Hz remained significant after adjustment of age, sex, stroke subtype, and further individual adjustment of other potential factors that may affect phase shift including NIH Stroke scales before and after thrombolysis, Rankin score, time lag between symptom to thrombolysis, and other cardiovascular conditions (hypertension, diabetes, artrial fibrillation). In addition, the rhythm of the CBFV-BP phase shift at <0.05 Hz was independent of HR, CBFV, and mean CO2.
Assessment time had no significant effects on mean BP mean CBFV (stroke, non-stroke side, and mean of both sides), CO2, and heart rate (all p values >0.1).
Discussion
This study revealed for the first time, according to our knowledge, a daily rhythm of cerebral autoregulation in patients with stroke. The rhythm caused a better regulation of cerebral blood flow in the participants during the late afternoon hours (2–7PM) that was characterized by large phase shifts between CBFV and BP oscillations at frequencies <0.05 Hz as compared to other times of day. Such an effect of time on cerebral autoregulation was similar for hemispheres affected or not affected by stroke, and was independent of age, sex, stroke type, and stroke severity as well as other factors such as mean CO2 level and heart rate that may potentially influence cerebral blood flow regulation.
Three previous studies examined the daily variation of dCA in health young adults. Ainslie et al. first reported that dCA functioned better in the afternoon than in the morning. 29 However, two later studies found no significant variations in dCA during the daytime.30,31 One possible explanation for the seeming discrepancy is the frequency-dependent effect of cerebral autoregulation on the CBFV-BP relationship. 32 In the study of Ainslie et al., a thigh cuff inflation-deflation was used to introduce a BP oscillation at ∼0.008–0.024 Hz, i.e., a sudden BP drop followed by a recovery period of ∼41–122 s. 18 In the study of Guo et al., dCA was assessed from the relationship between spontaneous BP and CBFV oscillations between 0.06–0.12 Hz under supine resting conditions. 30 In the study of Burma et al., large BP/CBFV oscillations induced by squat‐stand maneuvers were mainly at 0.05 Hz or 0.1 Hz. 31 Thus, one possible hypothesis is that daily variations of dCA may be more pronounced at very low frequencies <0.05 Hz. Supporting this hypothesis, the current study showed that the daily rhythm of CBFV-BP phase shifts was robust at frequencies <0.05 Hz but was not significant at higher frequencies in stroke patients.
There are two other factors that may also contribute to different results in this and previous studies of the daily variation in dCA. (1) Different methods were used in different studies to assess dCA. Note that transfer function analysis (TFA) was used to assess the relationship between BP and CBFV signals in both studies that reported no diurnal variation of dCA. To explore this possibility, we also obtained TFA metrics in three frequency bands (VLF: 0.02–0.07 Hz, LF: 0.07–0.2 Hz, HF: 0.2–0.5 Hz) as recommended by the published TFA guideline. 27 Though TFA phase also displayed a daily rhythm at VLF (but not at LF and HF), the rhythm appeared to be not so robust as compared to that of MMPF derived CBFV-BP phase shifts (see Supplemental Material and Figure S3). For instance, the rhythm of VLF TFA phases was only significant for stroke side (p = 0.013) and for the mean phase of both sides (p = 0.01); and there was no sufficient power to detect the interaction effect of assessment time and frequency (p > 0.2 for stroke side, non-stroke side, and mean of both sides). This is expected because TFA results should be not reliable at VLF as indicated by low coherence in this frequency band (Supplemental Figure S4). (2) Participants and their health conditions were different in different studies. Note that participants in the three previous studies are healthy young adults while we studied patients during the acute phase of stroke. Follow-up studies are required to further test whether the daily rhythm of dCA is more pronounced after stroke.
In this study we focused on MMPF measures of dCA rather than TFA metrics due to the following considerations. TFA is a frequency-domain analysis that assumes (i) sinusoidal oscillatory components in a signal (i.e., constant amplitude and frequency) — an assumption of stationarity, and (ii) a linear relationship between CBFV and BP oscillations — an assumption of linearity that should be validated using coherence. TFA metrics derived from spontaneous BP/BFV fluctuations have low reproducibility and large variation between repeated assessments. 33 Certain previous studies based on TFA even failed to identify altered dCA in stroke and diabetes using BP/CBFV signals during the supine condition.9,11 Thus, interventions such as squat‐stand and Valsalva maneuvers are usually recommended to enhance the signal-to-noise ratio for better performance of TFA in health indiviudals. 33 However, these interventions are not desirable and can be dangerous for patients with impaired cerebral autoregulation, especially for patients during the acute phase of stroke in this study. MMPF is a time-domain analysis designed to assess CBFV-BP phase shifts during resting conditions, especially from short CBFV and BP signals. Without the assumptions of nonstationarity and nonlinearity, MMPF has a better performance than TFA in detecting altered dCA and its relevance to health outcome under many pathological conditions including hypertension, stroke, diabetes and brain injury.8–11,34–36 Importantly, MMPF derived CBFV-BP phase shifts from spontaneous BP/CBFV oscillations were comparable to those during Valsalva maneuver. 10 Our study provided further evidence for a better performance of MMPF in detecting a daily rhythm of dCA in stroke patients (TFA showed a similar daily dCA rhythm at VLF but it was less significant, see Figures 3, S2, and S3).
The consistent daily rhythm of dCA in both stroke and non-stroke sides indicates that the factor(s) driving the daily rhythm should affect CA globally. There are two mechanisms that may underlie the observed daily rhythm. One is the daily cycles of behaviors such as sleep, food intake, and exercise that can introduce daily alternations in physiology, leading to intrinsic stressors and a more vulnerable system during certain specific time such as transitions between sleep and wakefulness. The other one is the endogenous circadian rhythms of ∼24 h that are presented in a wide range of physiological functions (including sleep, cognition, and cardiac function) even in the absence of 24-h external stimuli (light-dark and sleep-wake cycles). 37 These endogenous rhythms are generated/orchestrated by the circadian system — a complex network of coupled central neural nodes that interact with peripheral organs and systems through numerous neural and humoral feedback loops in order to prepare the body for the anticipated environmental and day-night changes.38–40 Human studies have revealed that autonomic function and its response to external stress displayed robust endogenous circadian rhythms.41–44 Considering the established link between autonomic function and cerebral autoregulation, 3 these circadian results support the hypothesis of an endogenous circadian rhythm in cerebral autoregulation. This hypothesis is also supported by the previous finding that the risk for syncope is modulated by the circadian clock, leading to a lower risk at the circadian times corresponding to the afternoon hours (lowest at ∼4:30 PM). 44 Note the time window for the lower risk of presyncope matches with the observed peak of dCA (2–7 PM) in this study. To formally test whether the daily rhythm of dCA was caused by the endogenous circadian regulation and/or the daily behavioral cycles, future circadian studies with better design are warranted.
As the first study to examine the daily variation of dCA in patients with stroke, this observational study involved only secondary data analysis of the existing datasets collected in clinics from patients who underwent their routine treatment procedures. There are certain limitations and questions that should be addressed in follow-up studies: (1) The sample size was relatively small such that we could not examine whether stroke subtype, co-morbidity, medication, and timing of drug administration affect the observed daily rhythm of dCA in patients after stroke. Future studies are warranted to consider these potentially important factors. In addition, caution should be taken when interpreting those negative results (e.g., no significant daily rhythms in BP and heart rate) that might be just due to insufficient power. (2) dCA was assessed only in each stroke patient twice or once within 48 hours after thrombolysis and there were less data points during nighttime. To ensure reliable results, we used a larger bin size during the nighttime. To better determine the daily rhythm of dCA, assessments should be scheduled within the same patients evenly across the 24-h cycle. To better determine the impacts of stroke on dCA and its daily variation, it is ideal to include both stroke patients and non-stroke controls and to assess dCA of the same patients before the stroke, immediately after stroke before the reperfusion therapy, immediately after the reperfusion therapy, and even after discharge from hospital. (3) To separate the influences of daily behavioral cycle and the circadian rhythms on dCA, it is necessary to monitor/control daily schedules and activities (e.g., sleep and physical activity level) of participants and to collect physiological variables (e.g., melatonin) that can be used to estimate the timing of the endogenous circadian cycle.
Despite the limitations, the results of this study provided solid evidence for the existence of a daily rhythm of cerebral autoregulation in patients after stroke that leads to different cerebral blood flow regulation at frequencies <0.05 Hz at different times of day. Because impaired CA is linked to increased risk for stroke,13,14 the daily rhythm of dCA may contribute to the 24-hour day/night pattern of the incidence stroke that is consistent for first-ever and recurrent stroke events. 22 In addition, considering the important role of cerebral autoregulation in neurocognitive function, brain atrophy, and other functional outcomes,6,36,45–47 our finding has clear implications for clinical practice and patient care. For instance, to reduce further cerebrovascular insults in patients after stroke, any tasks or activities such as exercise or surgery that may induce large fluctuations in blood pressure should be scheduled during the afternoon hours when dCA functions better.
Supplemental Material
sj-pdf-1-jcb-10.1177_0271678X231153750 - Supplemental material for Daily rhythm of dynamic cerebral autoregulation in patients after stroke
Supplemental material, sj-pdf-1-jcb-10.1177_0271678X231153750 for Daily rhythm of dynamic cerebral autoregulation in patients after stroke by Daniel S Abadjiev, Edgar Toschi-Dias, Angela SM Salinet, Nicole N Gaykova, Men-Tzung Lo, Ricardo C Nogueira and Kun Hu in Journal of Cerebral Blood Flow & Metabolism
Footnotes
Funding
The author(s) disclosed receipt of the following financial support for the research, authorship, and/or publication of this article: KH was partially supported by the National Institutes of Health grants (RF1AG059867 and RF1AG064312). ET-D was supported by the São Paulo Research Foundation (FAPESP, # 2021/03076-4) and by the National Council for Scientific and Technological Development (CNPq, # 307434/2021-4).
Declaration of conflicting interests
The author(s) declared no potential conflicts of interest with respect to the research, authorship, and/or publication of this article.
Authors’ contributions
DSA: data analysis, data interpretation, drafting manuscript, manuscript revision.
ET: data acquisition, data interpretation, manuscript revision
ASMS: data acquisition, data interpretation, manuscript revision
NNG: data analysis, data interpretation, manuscript revision
ML: study design, data analysis, data interpretation, manuscript revision
RN: study design, data acquisition, data analysis, data interpretation, manuscript revision
KH: study concept and design, data analysis, data interpretation, drafting manuscript, manuscript revision
Supplementary material
Supplemental material for this article is available online.
References
Supplementary Material
Please find the following supplemental material available below.
For Open Access articles published under a Creative Commons License, all supplemental material carries the same license as the article it is associated with.
For non-Open Access articles published, all supplemental material carries a non-exclusive license, and permission requests for re-use of supplemental material or any part of supplemental material shall be sent directly to the copyright owner as specified in the copyright notice associated with the article.