
Abstract
Enhanced external counterpulsation (EECP) treatment for cerebral ischemic stroke patients with differing severity of stenosis, is subject to uncertainties due to the varying effects of the cerebral autoregulation mechanism on haemodynamics. The current study reports the development of a cerebral multi-autoregulation (MR) mathematical model, based on cerebral arteriole regulation of neurogenic, vascular smooth muscle reflex and shear stress mechanisms which takes into account the severity of stenosis. The model was evaluated by comparison to authentic clinical measurements of cerebral autoregulatory efficiency. Then it was applied to a 0D/3D geometric multi-scale haemodynamic model of a cerebral artery. Haemodynamic indicators were calculated under different pressurization durations of EECP to evaluate the efficacy for different stenosis lesions. Moderate stenosis of 50% to 60% produced excessive time-averaged wall shear stress in the distal area of the stenosis (>7 Pa) during prolonged pressurization and may result in damage to vascular endothelial cells. However, prolonged pressurization did not result in haemodynamic risk for severe stenosis of 70% to 80%, indicating that the duration of pressurization may be extended with increasing severity of stenosis. The current MR model accurately simulated cerebral blood flow and has relevance to the simulation of cerebral haemodynamics in a clinical setting.
Keywords
Introduction
Enhanced external counterpulsation (EECP) represents an auxiliary circulation method which is triggered by an ECG signal. EECP increases aortic diastolic blood pressure to improve perfusion of the heart, brain and other organs by non-invasive mechanical compression of the lower body in the diastolic period of the heart via air cuffs wrapped around the limbs and buttocks. 1 EECP redistributes blood flow to ischemic organs through a unique “double pulse” perfusion mode in both systole and diastole.2,3 Cerebral ischemia is improved through the increase of mean arterial pressure (MAP) and cerebral blood flow (CBF) due to acute global haemodynamic effects. EECP improves the local haemodynamic environment of vascular endothelial cells during atherosclerosis, increases wall shear stress (WSS), reduces oscillatory shear index (OSI) and promotes the growth of collateral circulation.4,5 These local haemodynamic effects affect long-term treatment outcomes with great significance for the treatment of ischemic stroke.
Cerebral perfusion pressure (CPP) greatly increases during EECP but autoregulatory mechanisms within the brain cause cerebral arterioles to contract, increasing distal blood flow resistance and maintaining stable blood flow. However, studies have shown that the ability of cerebral autoregulation in patients with ischemic stroke is weaker than that in healthy people.6 –8 Therefore, during EECP, the CBF of ischemic stroke patients will get some improvement, and the increase of blood flow depends on the severity of cerebral artery stenosis. This is another reason why EECP can treat ischemic stroke patients. 9
Knowledge regarding optimized EECP treatment strategies for ischemic stroke patients with differing severity of stenosis is lacking. Prolonged pressurization duration in each cardiac cycle has been shown to increase MAP, thereby increasing CPP and CBF. 10 However, due to the role of cerebral autoregulation, the CBF increment of patients with ischemic stroke is affected by the stenosis severity. The same pressurization duration has different therapeutic benefits for patients with different stenosis severities. Therefore, for each patient, the pressurization duration should be appropriately controlled to prevent excessive ineffective treatment. Furthermore, in addition to the improvement of global effects, WSS and other indicators should be considered to improve the local haemodynamic environment of vascular endothelial cells. This requires preoperative planning of EECP treatment strategy to estimate the efficacy of various treatment modes.
Computational fluid dynamics (CFD) has been used for physiological simulation during preoperative planning.11,12 A patient-specific three-dimensional (3D) model of blood vessels may be reconstructed using medical imaging and digital image processing technology, allowing CFD to quantify haemodynamic parameters for the evaluation of vascular disease and treatment. CFD-based haemodynamic modelling has been used for virtual coronary artery bypass grafting, optimization of vascular stents and quantitative evaluation of myocardial ischemia.13 –15 However, cardiovascular and cerebrovascular diseases are associated with a complex haemodynamic environment and modelling accuracy becomes paramount.
Therefore, based on the physiological mechanism of the human brain, a mathematical cerebral multi-autoregulation (MA) model was developed during the current work and applied to a 0D/3D geometric multi-scale haemodynamic model of cerebral arteries. different counterpulsation modes were simulated to study the global and local haemodynamic effects of EECP. Optimized counterpulsation treatment strategies could be formulated for cerebral ischemic stroke patients with different stenosis severities.
Materials and methods
Cerebral multi-autoregulation model
Cerebral autoregulation maintains a constant CBF during sudden changes in CPP. Cerebral arterioles contract or dilate in response to blood pressure changes due to the regulation of vascular smooth muscle reflexes, neurogenesis and shear stress, producing a variation in vessel resistance to cope with changes in CPP. Cerebral autoregulation has previously been modeled on the assumption of a linear relationship between CBF and CPP at low (<75 mmHg) and high (>125 mmHg) pressure but the influence of atherosclerosis on autoregulation was not considered, resulting in some calculation errors. 10 Here we propose a MA model of CBF with the consideration of cerebral artery stenosis, which is more in line with human physiological mechanism. Mathematical models were established for neurogenic regulation of arterioles, myogenic regulation of vascular smooth muscle, and shear stress regulation, respectively, to simulate the mechanism of cerebral autoregulation by integrating various factors.
Neurogenic regulation
Cerebrovascular neurogenic regulation accommodates sudden changes in blood pressure and is affected by atherosclerosis.6,16 Ischemic injury was found to increase peroxynitrite production after stroke, impairing the vascular reactivity of rat brain
17
and loss of local neurogenic regulation correlated with severity of stenosis.6
–8 A mathematical model of neurogenic regulation which takes into account the severity of stenosis is presented. Sympathetic signals are thought to stimulate neurogenic regulation.
18
Wei et al. have shown that large cerebral vessels constrict by approximately 7% in response to sympathetic stimulation under normal conditions.
19
In fact, not only sympathetic nerves, but also the cerebral arteries are innervated by multiple nerve types, including cholinergic and peptidergic neurons.
20
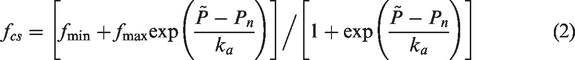
The contributions from these other nerve types may promote either vasodilation or vasoconstriction. Only sympathetic nerves were considered in the current study to reduce the complexity of modelling. The sympathetic signal is a monotonic exponential function negatively correlated with afferent neural pathway activity, which can be mathematically described as follows:


Myogenic regulation
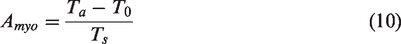
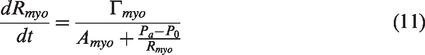
Myogenic regulation refers to changes in vascular smooth muscle tension under conditions of altered pressure difference across the wall of blood vessels.
21
The tension of vascular smooth muscle in the resting state may be described as:
22


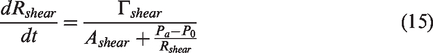
Shear stress regulation
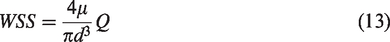
Shear stress regulation refers to the regulatory mechanism of arterial vessels to control vasodilation and contraction by releasing NO and possibly other vasoactive molecules when responding to shear stress changes.
23
According to Hagen-Poiseuille’s law,
24
in a segment of ideal vessel, the formula for calculating WSS is:


The lumped parameter model (0D model) without cerebral autoregulation, simple linear model and MA model were used to simulate CBF under each CPP numerically. Mackenzie et al. collected CBF of people under different CPP through clinical experiments and fitted their variation curves.25 –27 Results from different cerebral autoregulation models were compared with the clinically acquired data to identify the most favorable model.
Numerical simulation of EECP
A 0D/3D coupled geometric multi-scale model was used to simulate the haemodynamic effects of EECP on the cerebral artery. The 3D model was based on computed tomography angiography (CTA) images of the cerebral artery of a volunteer provided by Peking University Third Hospital. Human subject was involved in this study, which was reviewed and approved by the Medical Ethics Committee of Peking University Third Hospital. The ethical guideline was “Approval document for rapid review of clinical experimental study on haemodynamic effects of enhanced external counterpulsation (2019, no. 417-02)”. The volunteer provided his written informed consent to participate in this study. Studies show that about 18–25% of ischemic stroke is caused by occlusion or stenosis of internal carotid artery.28,29 Furthermore, there are pretty reports about the atherosclerotic stenosis in intracranial cerebral arteries, and among the intracranial vessels supplying blood to the brain, stenosis develops in the internal carotid artery most.30 –32 Therefore, a 50-year-old patient with moderate stenosis (60%) of the internal carotid artery and no other serious cardio-cerebrovascular disease, cardiac disease, such as aortic insufficiency, no history of hemorrhagic disease, no thrombophlebitis or infectious lesions in the limbs, no symptoms such as premature beats and atrial fibrillation, was chosen to participate in the study. The patient had no contraindication for EECP and with moderate stenosis likely to cause slight regional cerebral ischemia would be considered suitable for EECP treatment. The volunteer patient did not fully represent the target patient population for EECP therapy but his condition was appropriate for the methodological approach of generating a generic mathematical model of cerebral autoregulation and for numerical simulation of haemodynamic effects of EECP on cerebral arteries.
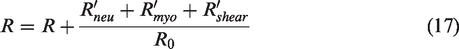
The 3D geometry of the cerebral arteries was generated by Mimics and the 0D model was based on the 3D structure of the cerebral artery. 0D modelling utilizes circuit elements to simulate the blood circulatory system 33 and is often coupled to the inlet and outlet of the 3D model as a boundary condition in a geometric multi-scale model. A coupling algorithm 13 was used to develop a closed-loop geometric multi-scale model of the cerebral artery for haemodynamic simulation. Details of the 0D/3D models and the modelling method are shown in the Appendix of supplementary material.
Fluid simulation software, ANSYS-CFX, was used for the haemodynamic calculation of the 3D model. Fluid density was 1050 kg/m3, viscosity was 0.0035 Pa·s,34 –37 the number of fluid elements was 1186933, 10 the vessel wall was simplified to a rigid wall and blood flow was transient. Blood viscosity was determined by reference to previous studies and the numbers of fluid elements tested by grid dependency (see details in Appendix of Supplementary material). A constant temperature was assumed during local blood flow and energy conservation disregarded. Pulsating blood flow in the cerebral artery was considered to be a transient incompressible Newtonian fluid flow problem. The Navier-Stokes equations were applied for haemodynamic simulations of the 3D model and flow assumed to be laminar. During multi-scale calculation, the time step of the 3D model was 0.001 s and that of the 0D model was 0.00001 s. The two models achieved a data exchange after 100 times calculation of 0D model.
The cerebrovascular 0D model was built according to physiological anatomy (see details in Supplementary Figure 3 of Appendix) and included pre-arterioles of diameter 100–500 μm (e.g. R161), arterioles of diameter <100 μm (R261), microcirculation vessels of diameter 10–100 μm (R361), venules of diameter <0.2 mm (R461) and small veins of diameter 0.2–1 mm (R561). Pre-arteriole and arteriole resistance varied to simulate cerebral autoregulation during EECP. Significant variations in lumen diameter of the anterior cerebral artery, the distal middle cerebral artery and the posterior cerebral artery in response to blood pressure regulation have been found. 38 Consequently, the mathematical MR model was applied to the resistances of the anterior cerebral (R163 and R165), distal middle cerebral (R261 and R267), and posterior cerebral (R158 and R170) arteries to simulate neural regulation. Each resistor was connected to a downstream capacitor and voltage source, Pe, to simulate intracranial pressure and reflect variations in transmural pressure with different diameters of cerebral arterioles. External intracranial pressure was assumed to be the same for each vascular segment but intravascular pressure differed, gradually decreasing from proximal to distal vessels. Continuous decrease of blood pressure caused the transmural pressure difference of different vascular segments to change with the diameter of the blood vessel, according to the formula for smooth muscle tension calculation shown in equation (8). Mathematical models of myogenic and shear stress regulation were applied to each resistor of the cerebrovascular 0D model. In our previous study, 10 we found that the pressure amplitude of EECP affected the cerebral perfusion pressure amplitude, but it could not influence more when adjusting the amplitude. On the contrary, the pressurization duration during each cardiac cycle significantly affected the CBF, wall shear stress, and other indicators (see details in Appendix of Supplementary material). As a result, different pressure amplitudes were tested to examine the practicability of neural regulation models and pressurization duration was changed to investigate haemodynamic effects of different EECP modes. The EECP simulation method is presented in Appendix of supplementary material.
EECP model verification
The establishment of a generic model suitable for simulation of haemodynamic effects of EECP in most patients was investigated and previously reported data used for validation. MAP from 38 people under different counterpulsation pressures with blood flow velocity waveforms of the middle cerebral artery before and during counterpulsation measured by transcranial Doppler were reported by Lin et al. 39 Numerical calculations of MAP and flow rate waveforms were extracted and compared with reported clinical data to validate the EECP haemodynamic numerical calculation.
Concerned haemodynamic indicators
Different stenosis severities (50%-80%) were added to the reconstructed 3D model of the cerebral artery (see Supplementary Figure 7 in Appendix and Supplementary Figure 8 and equation (26) for quantification of stenosis severity)
40
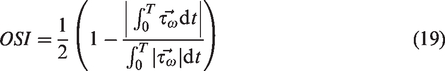
. Haemodynamic indicators were extracted using the 0D/3D geometric multi-scale model to demonstrate EECP treatment effects for different stenosis severities. Parameters included time-averaged wall shear stress (TAWSS), OSI, percentage of risk TAWSS area (PRTAWSSA), and flow rate of the stenotic branch. TAWSS and OSI influence vascular endothelial cell gene expression, affecting atherosclerosis development. TAWSS and OSI were calculated by:
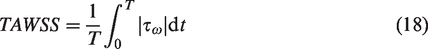
Low TAWSS (<1 Pa) and excessive TAWSS (>7 Pa) areas form around areas of severe stenosis, promoting atherosclerosis or plaque rupture.41,42 Therefore, PRTAWSSA was calculated to reflect the ratio of the sum of the low shear and high shear areas to the total area of the cerebral artery, to evaluate the haemodynamic environment:

PRTAWSSA should be minimized and smaller risk areas indicate lower likelihood of atherosclerosis development or plaque rupture. Flow rate of the stenotic branch may be used to evaluate improvement in cerebral ischemia in stroke patients. Therefore, the above four haemodynamic indicators were extracted to evaluate therapeutic effects of different EECP pressurization durations on different stenosis severities.
Research ethics approval
This study was approved by the local institutional review board of the Peking University Third Hospital.
Results
Comparison of cerebral autoregulation models
Changes in CBF under different CPPs caused by counterpulsation pressures of 160, 200, 240, 280, and 320 mmHg were simulated by the MR model, linear model and the model without cerebral autoregulation. CPP increased in line with counterpulsation pressure and mean CPP varied between 100–125 mmHg. Comparisons of the three models and Mackenzie et al.’s experimental fitting curve (clinical data) 25 are shown in Figure 1. CBF significantly increased with CPP when cerebral autoregulation was not considered, in a manner inconsistent with human physiology. CBF simulated by the linear model increased linearly with CPP with a significant error compared with the standard curve. In contrast, the MA model showed a nonlinear trend and a minor error compared with the standard curve and showed higher accuracy and physiological applicability. Simulation results correlated well with the clinical data (r = 0.90, p = 0.001) and minor differences were found between simulated normalized flow and clinical data (−0.063 ± 0.062, p = 0.000, Figure 2).
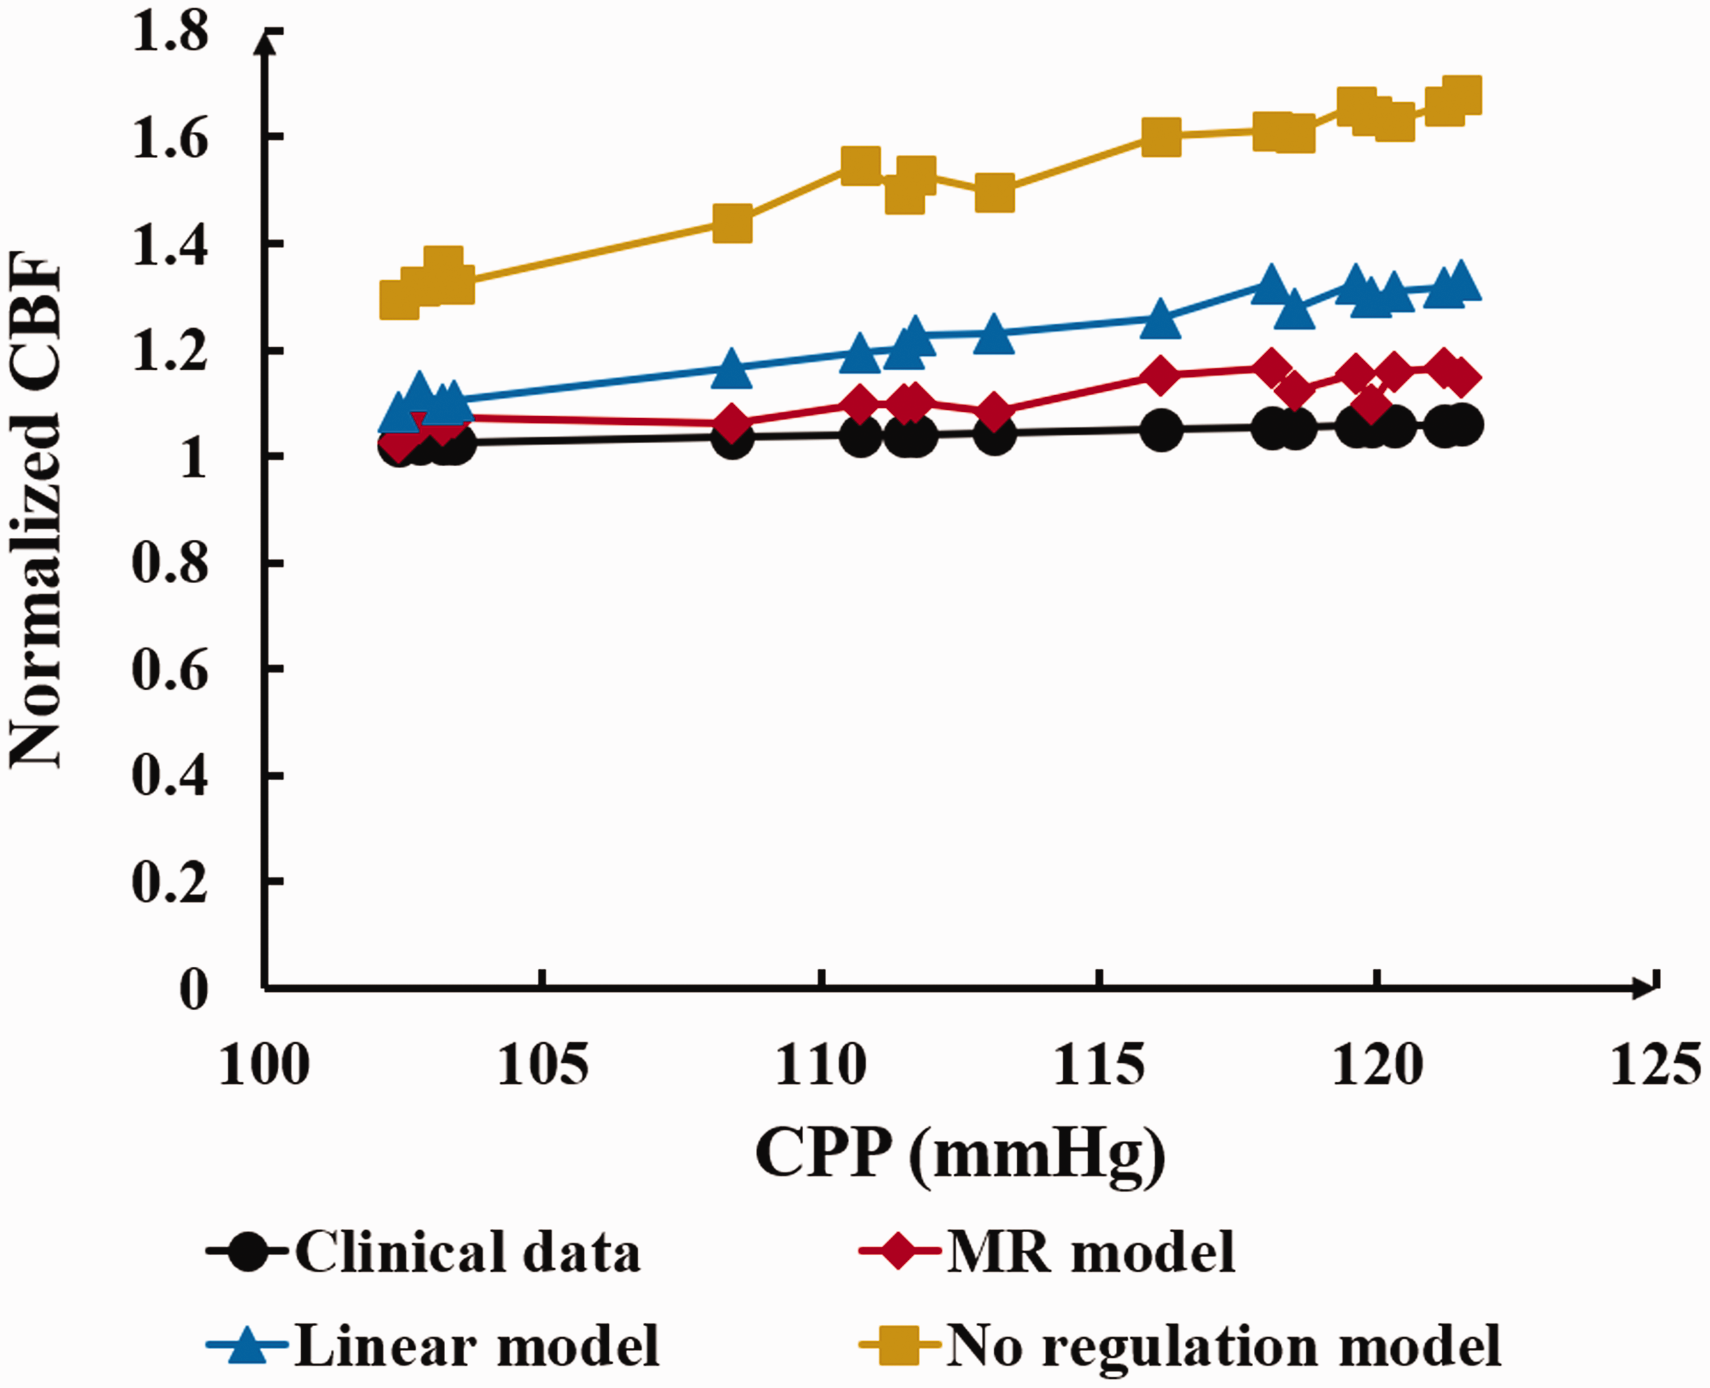
Comparison of normalized CBF-CPP between clinical measured data and simulated data of MR model, linear model, and no regulation model. Where CBF is cerebral blood flow, CPP is cerebral perfusion pressure, MR model is multi-regulation model.
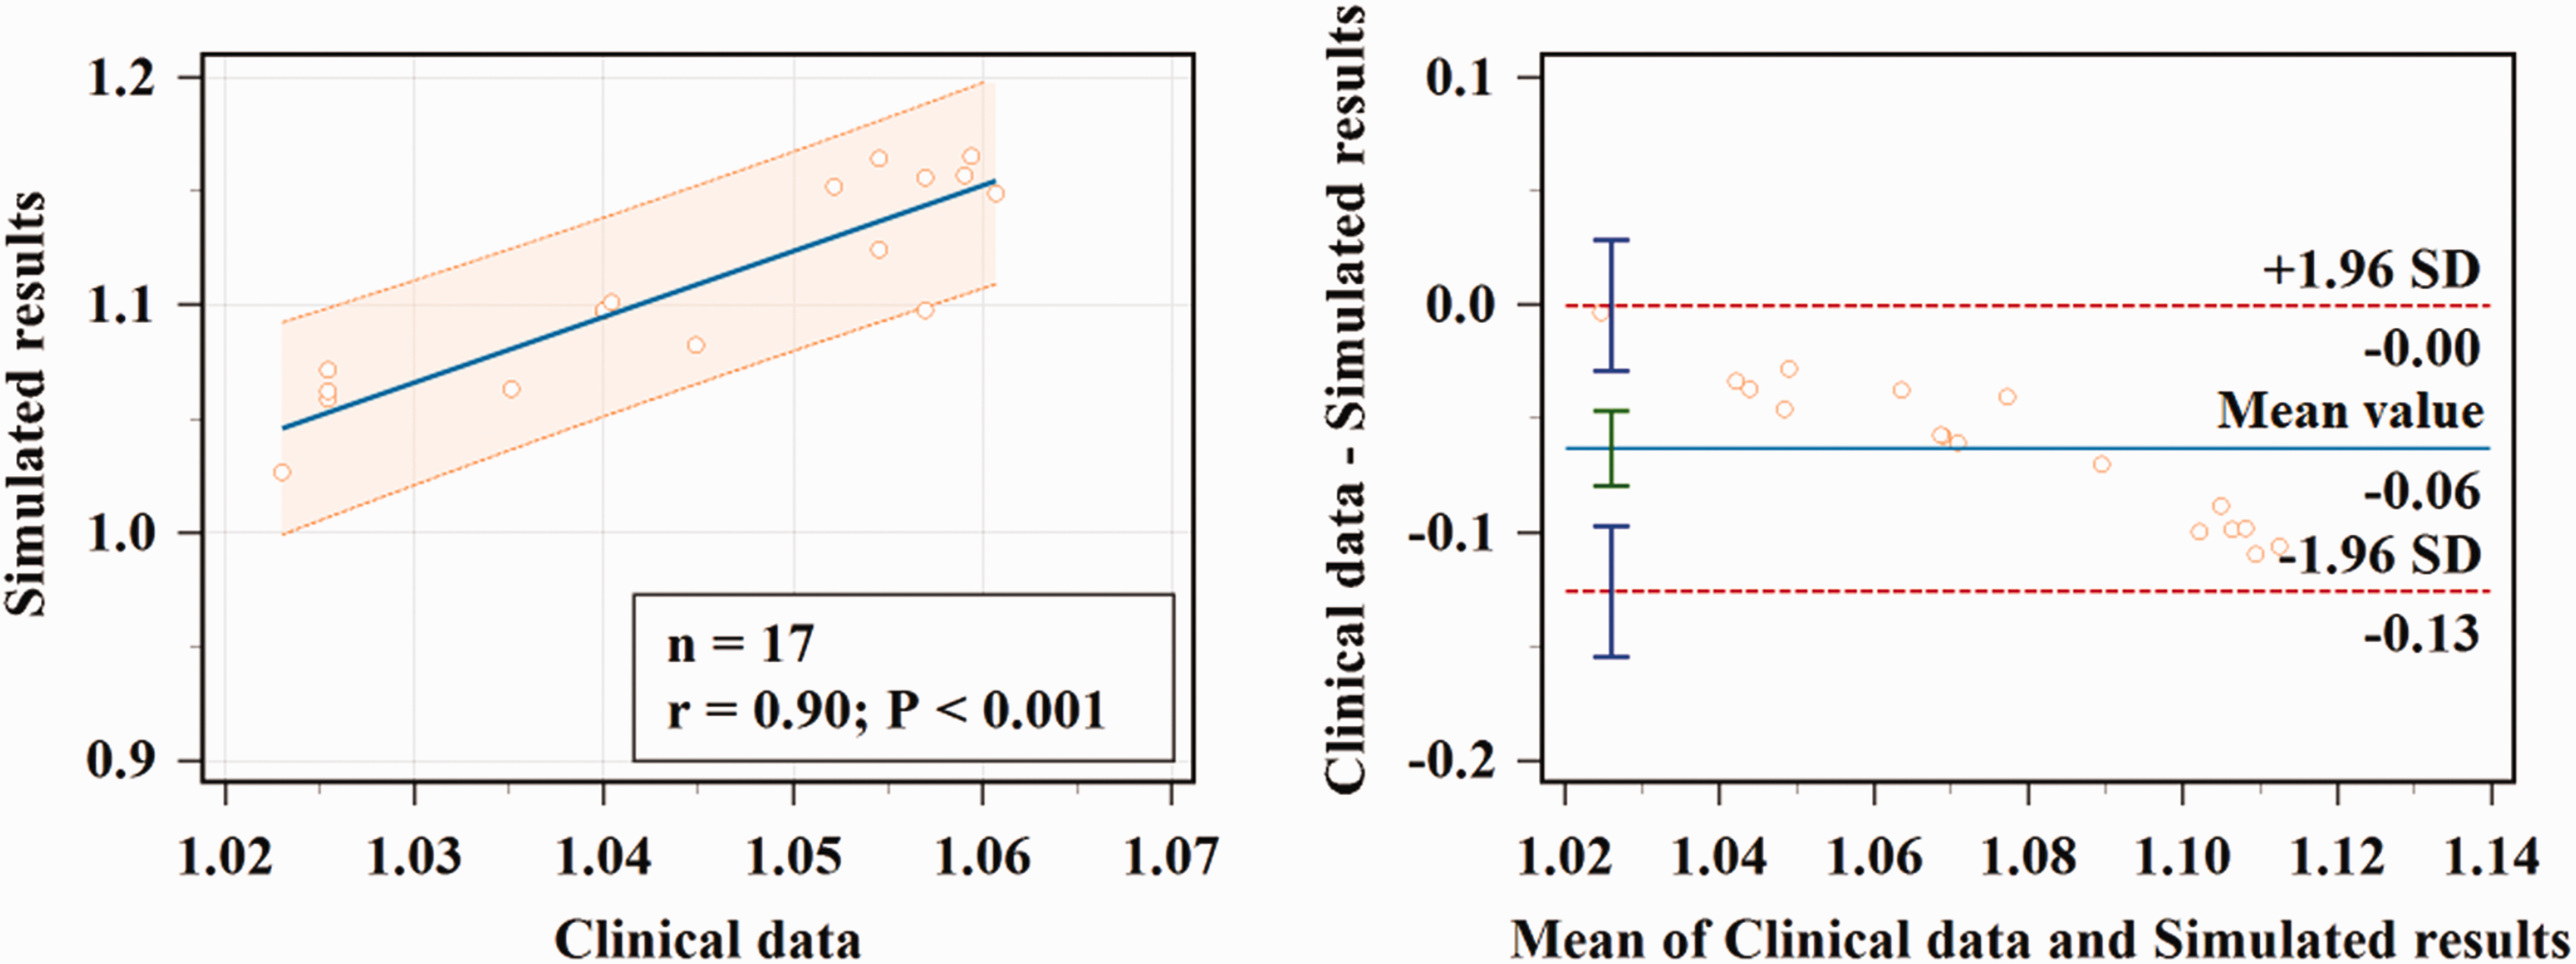
Correlation and consistency analysis results of clinical measured data and MR model simulation data.
EECP model verification
Numerically calculated MAP under different counterpulsation pressures was compared with the clinical data reported by Lin et al. 39 (Figure 3(a)) and good correlation was found. The root mean square error (RMSE) between the two sources was 1.05 mmHg. Comparison between clinically measured flow velocity waveforms 43 and model-simulated flow rate waveforms of the middle cerebral artery in resting and counterpulsation state showed them to be similar (Figure 3(b)).
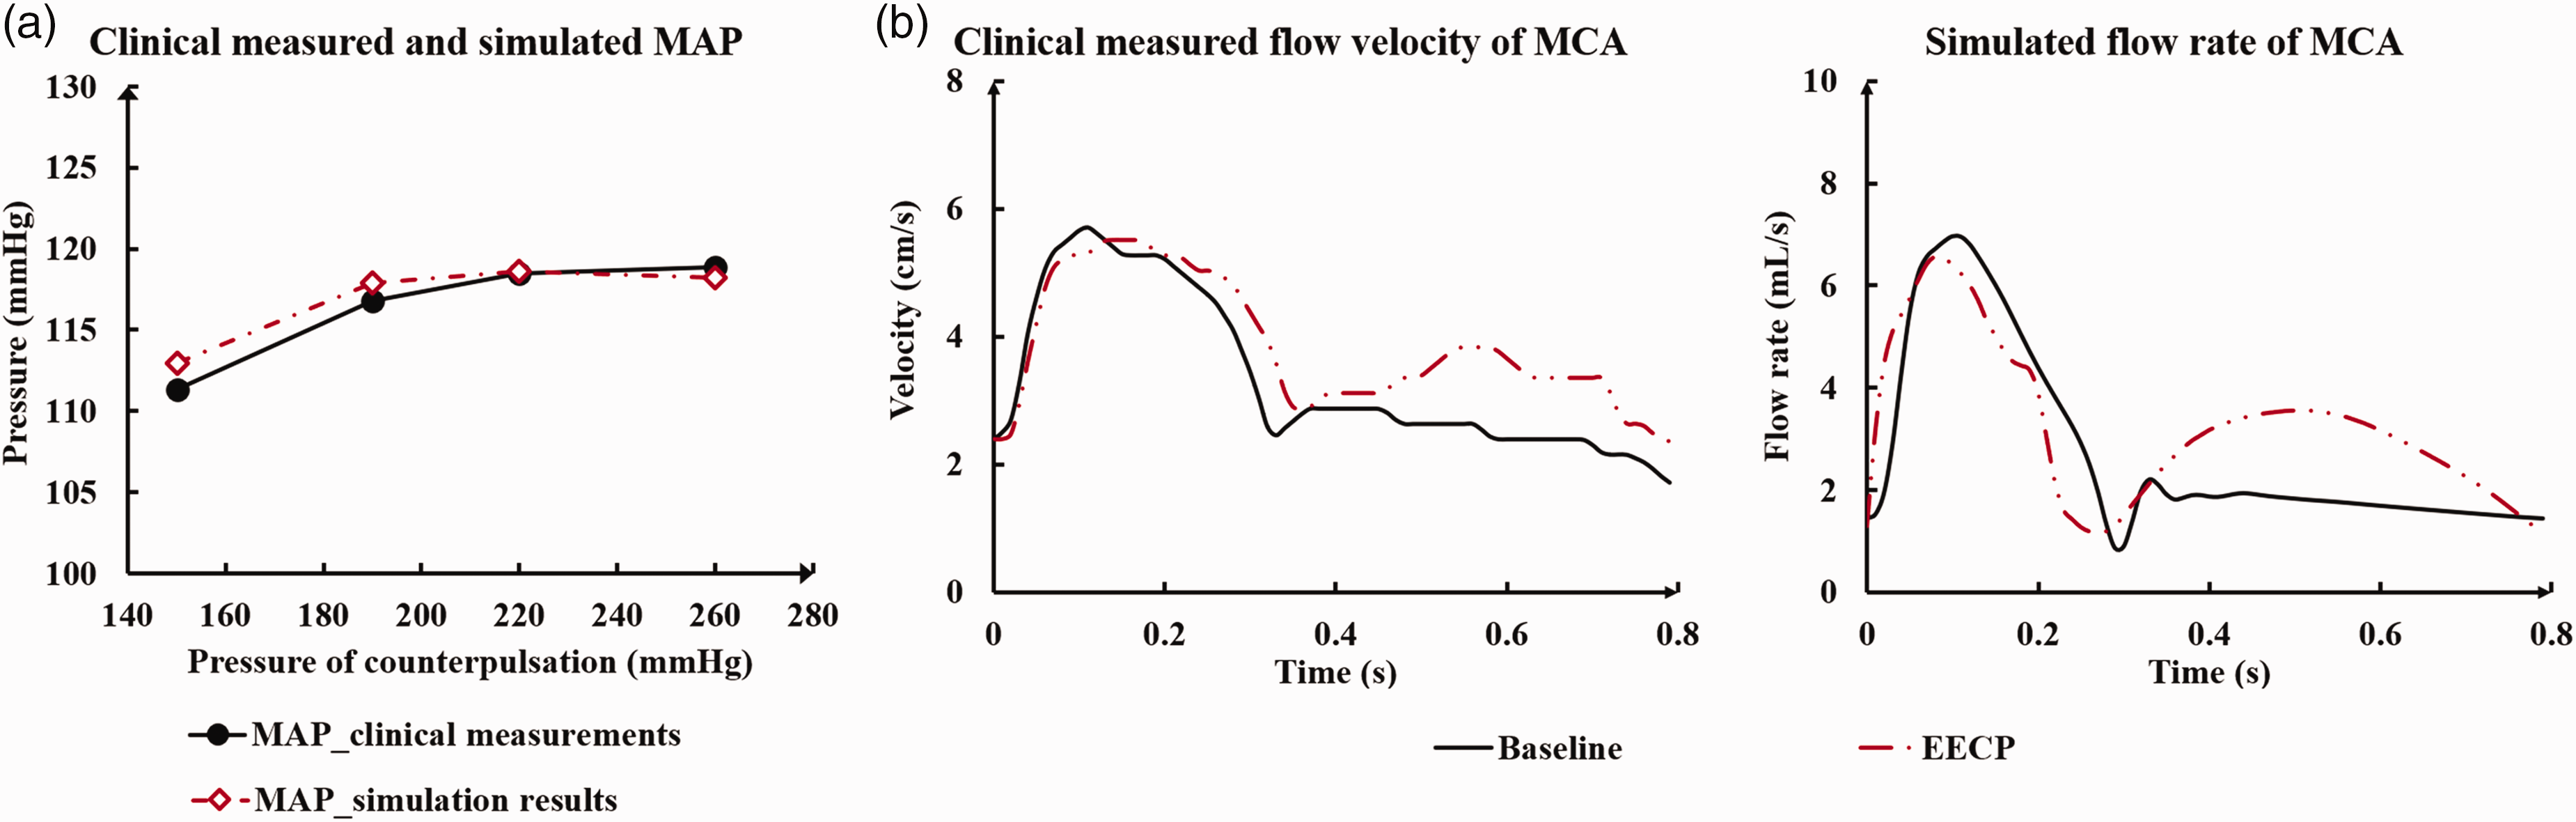
Comparison results between the numerically calculated data and the clinical reported data. MAP under different counterpulsation pressures and of Lin et al. Where (a) is the comparison of MAP under different counterpulsation pressures. The MAP is mean arterial pressure. (b) is the comparison between the clinically measured flow velocity waveforms and the model simulated flow rate waveforms of the middle cerebral artery both in resting and counterpulsation state.
Haemodynamic effects of EECP on different stenosis severities
TAWSS
Different pressurization durations were applied to the different stenosis severity models and the more accurate MA model used. Analysis of TAWSS contours and area-averaged TAWSS (ATAWSS) in the distal area of cerebral artery stenosis of differing severity showed that, for equivalent stenosis severity, prolongation of pressurization duration in each cardiac cycle (the pressure release moment is within the range of 0.5·Tc-0.7·Tc s) increased ATAWSS in the distal area of stenosis (Figure 4). ATAWSS decreased with more severe stenosis.
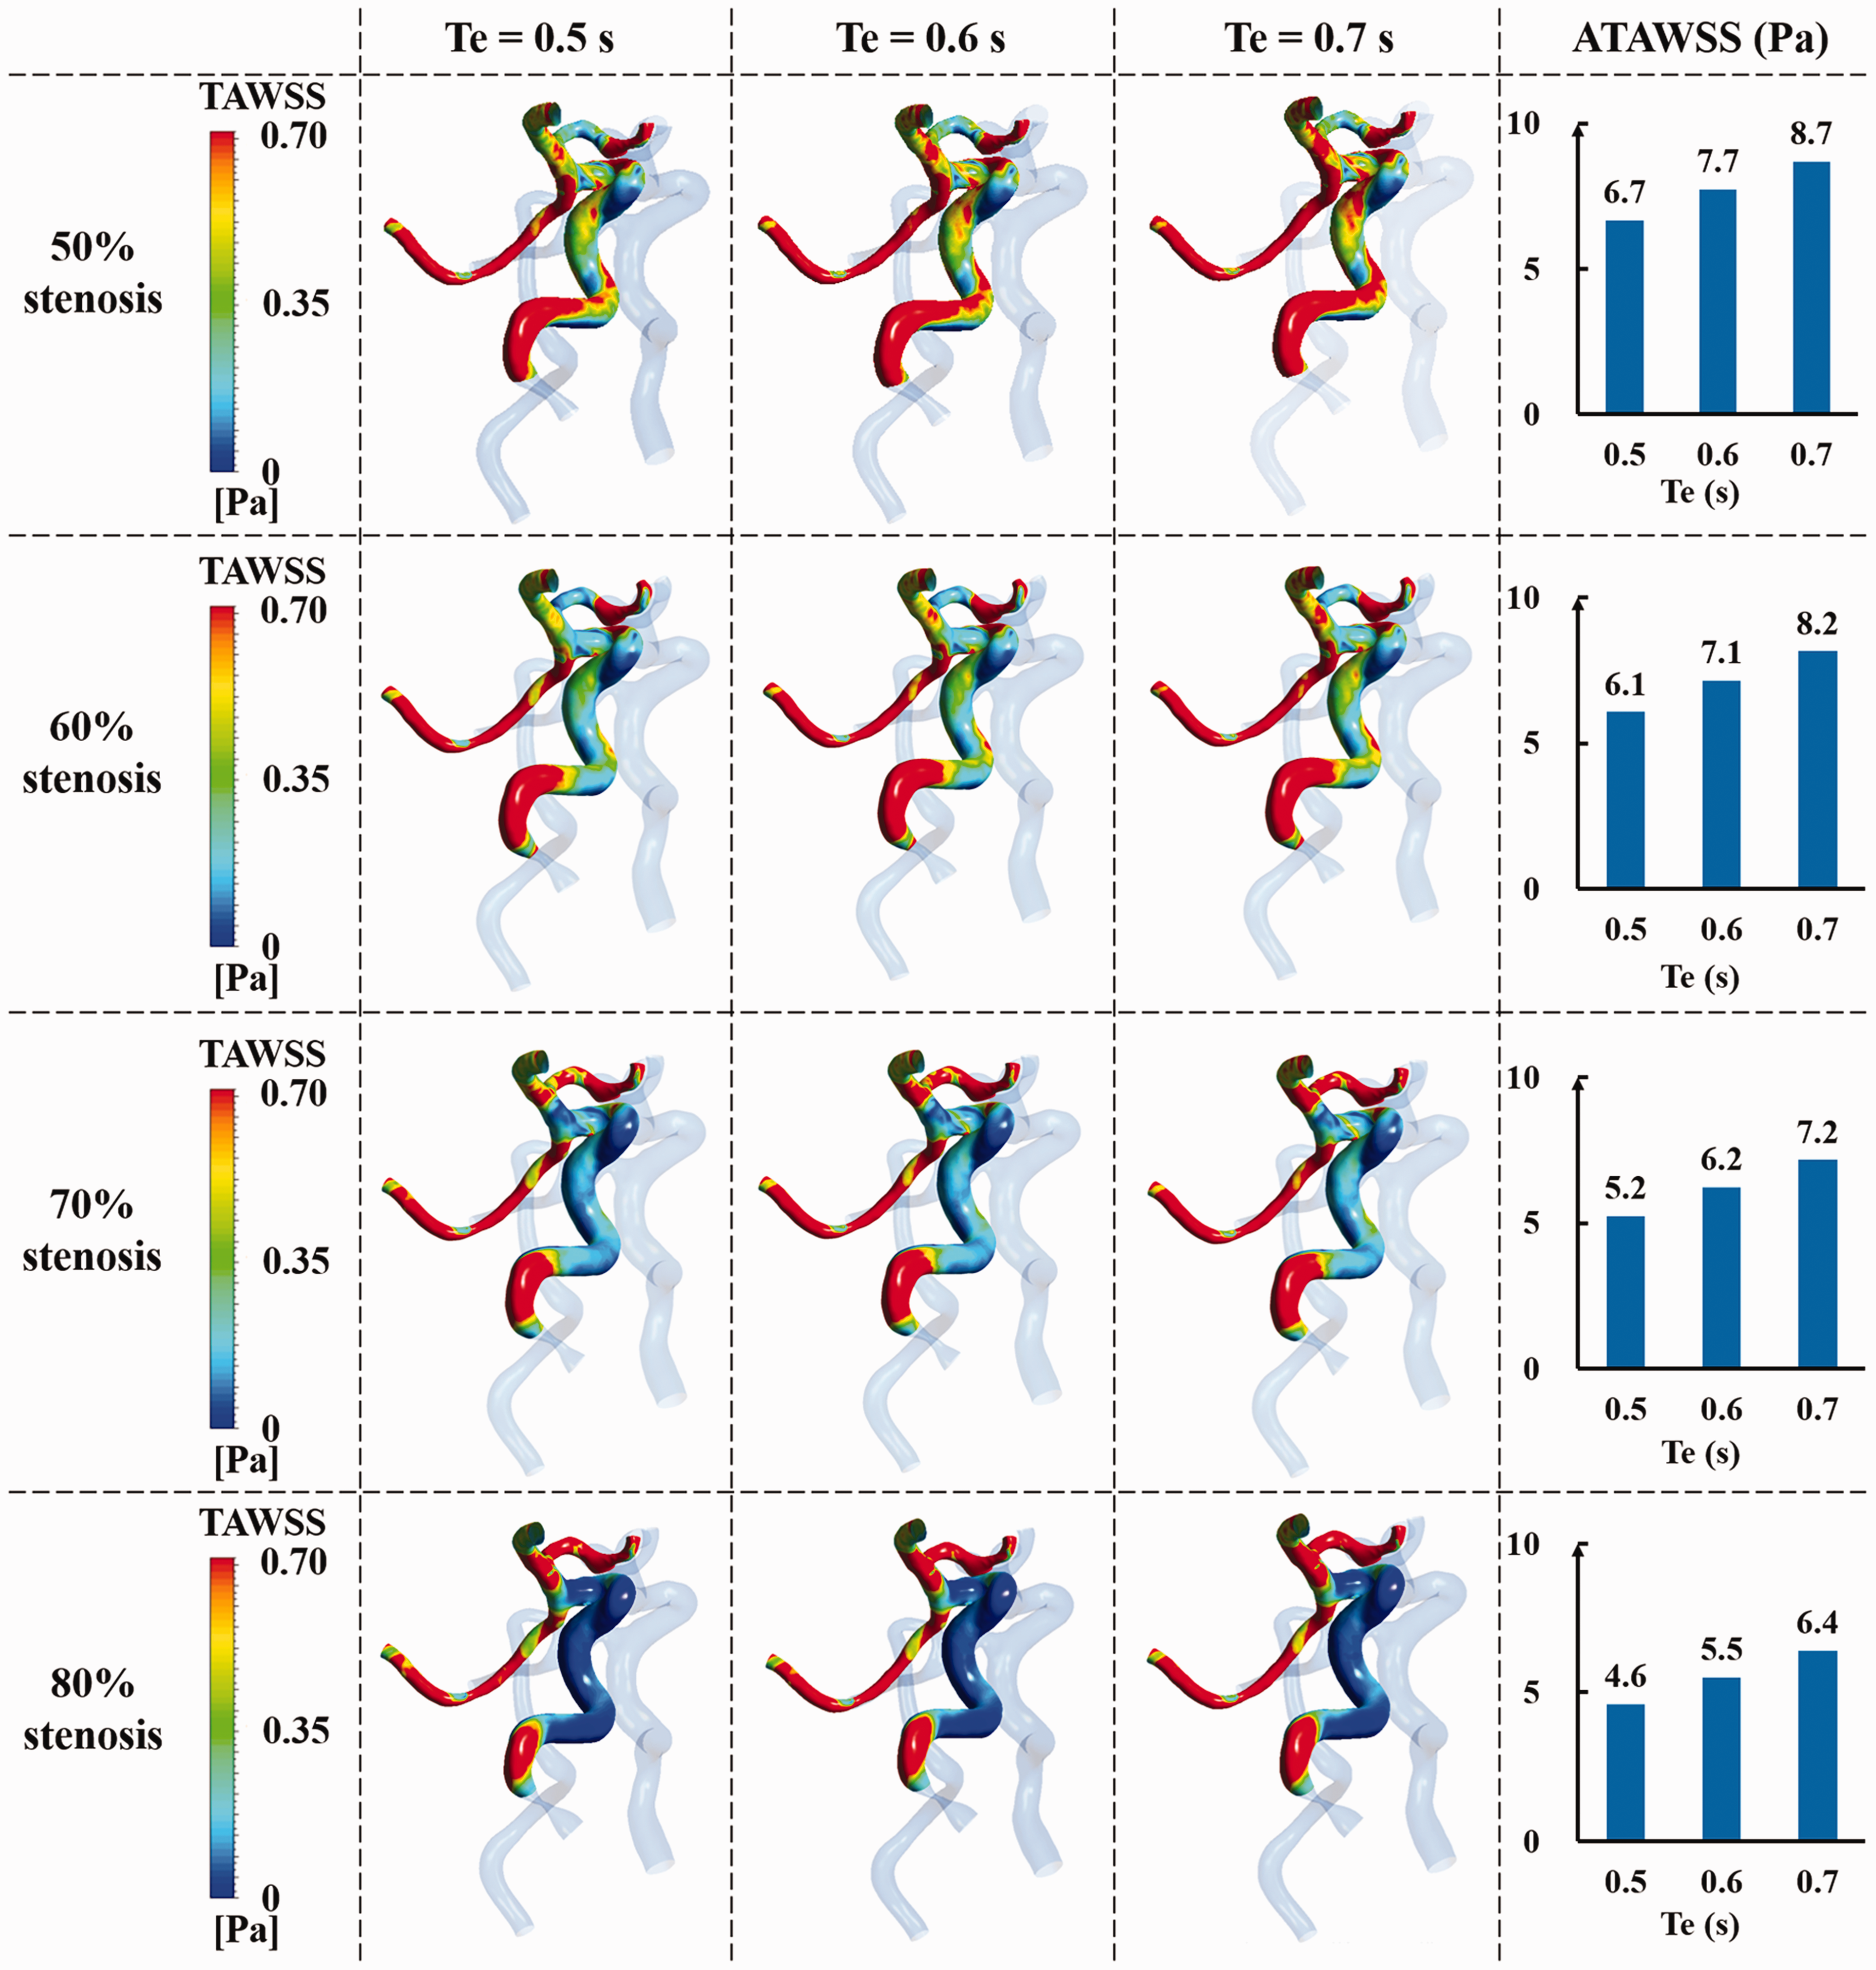
The TAWSS contours and ATAWSS in the distal area of stenosis of each stenotic cerebral artery under different pressurization durations. Where TAWSS is time-averaged wall shear stress, ATAWSS is area-averaged TAWSS, Te is the pressure release moment of EECP.
OSI
Figure 5 shows the comparison of OSI in the distal area of stenosis of cerebral artery with different stenosis severities under different pressurization durations. It can be found that for cerebral arteries with different stenosis severities, OSI hardly changed with different pressurization durations.
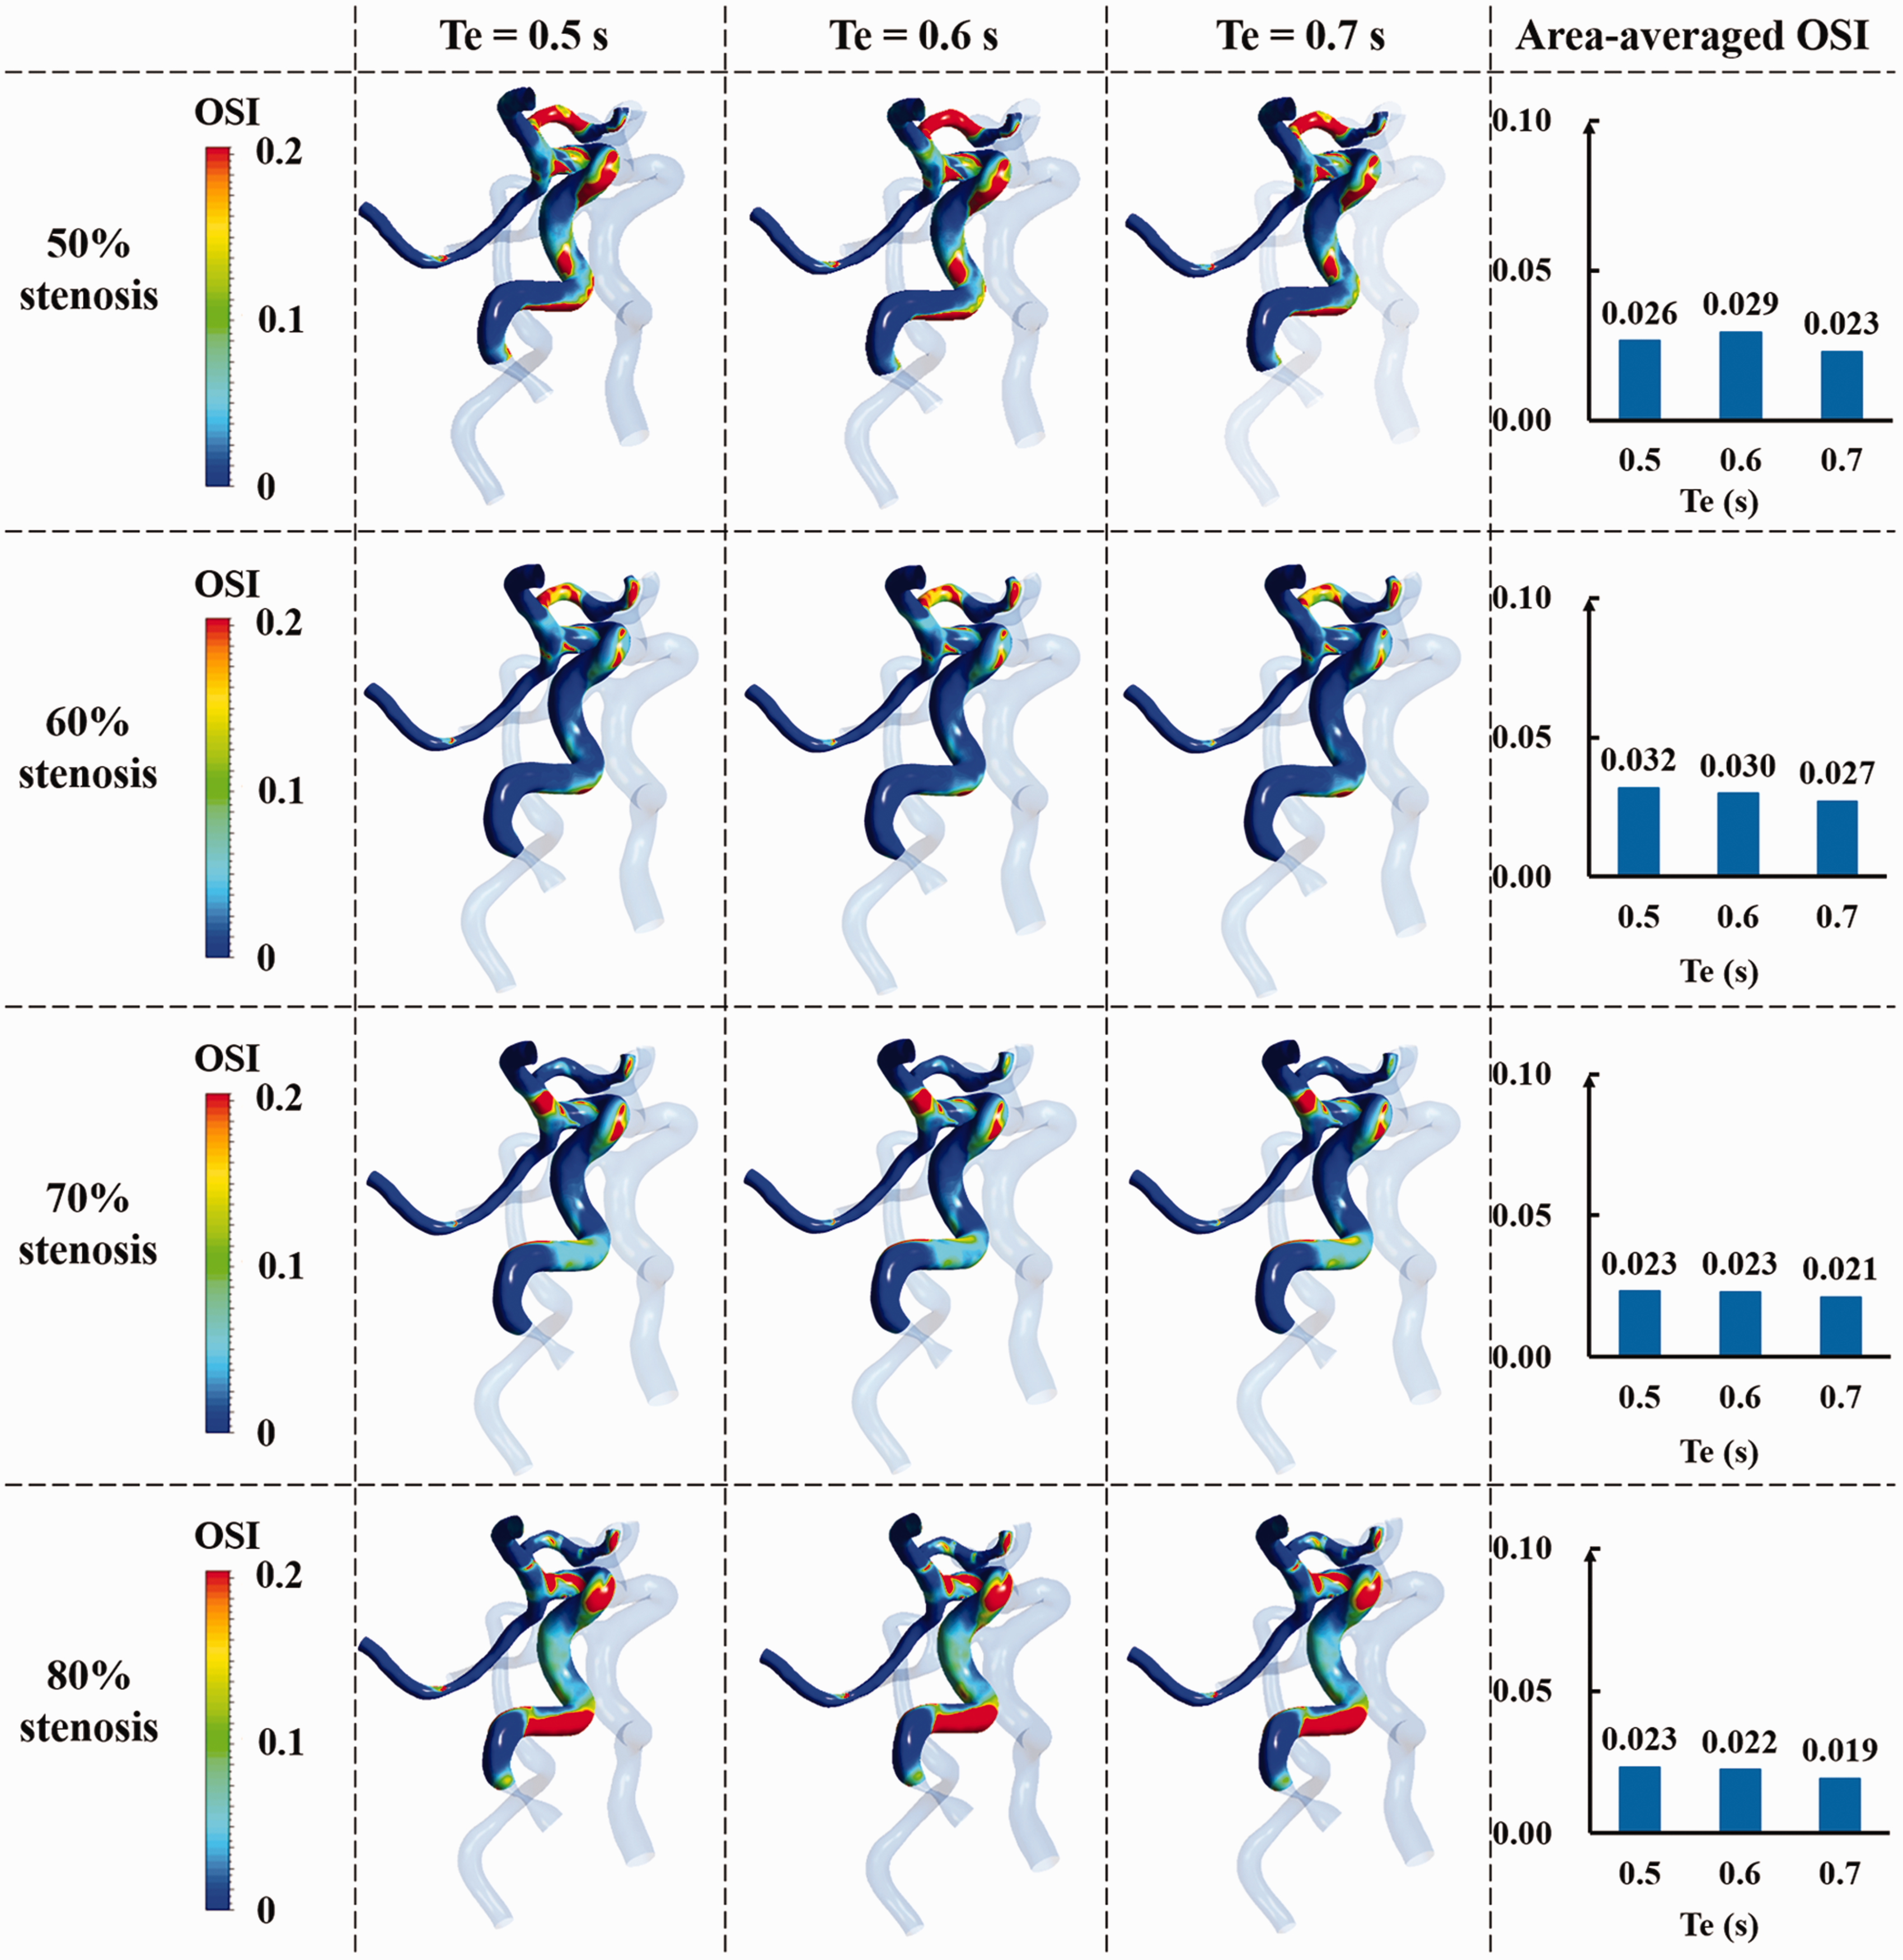
The comparison of OSI in the distal area of stenosis of each stenotic cerebral artery under different pressurization durations. Where OSI is oscillatory shear index, Te is the pressure release moment of EECP.
PRTAWSSA
PRTAWSSA (ATAWSS > 7 Pa and ATAWSS < 1 Pa) increased with prolonged pressurization for arteries with less severe stenosis but a smaller gradient was observed for arteries with more severe stenosis (Figure 6(a)). Thus, prolonged pressurization had a slight impact on haemodynamic risk areas in the severe stenosis model. For example, the increase in PRTAWSSA was only 0.3% in the 80% stenosis model when the pressure release moment was between 0.6·Tc s and 0.7·Tc s.
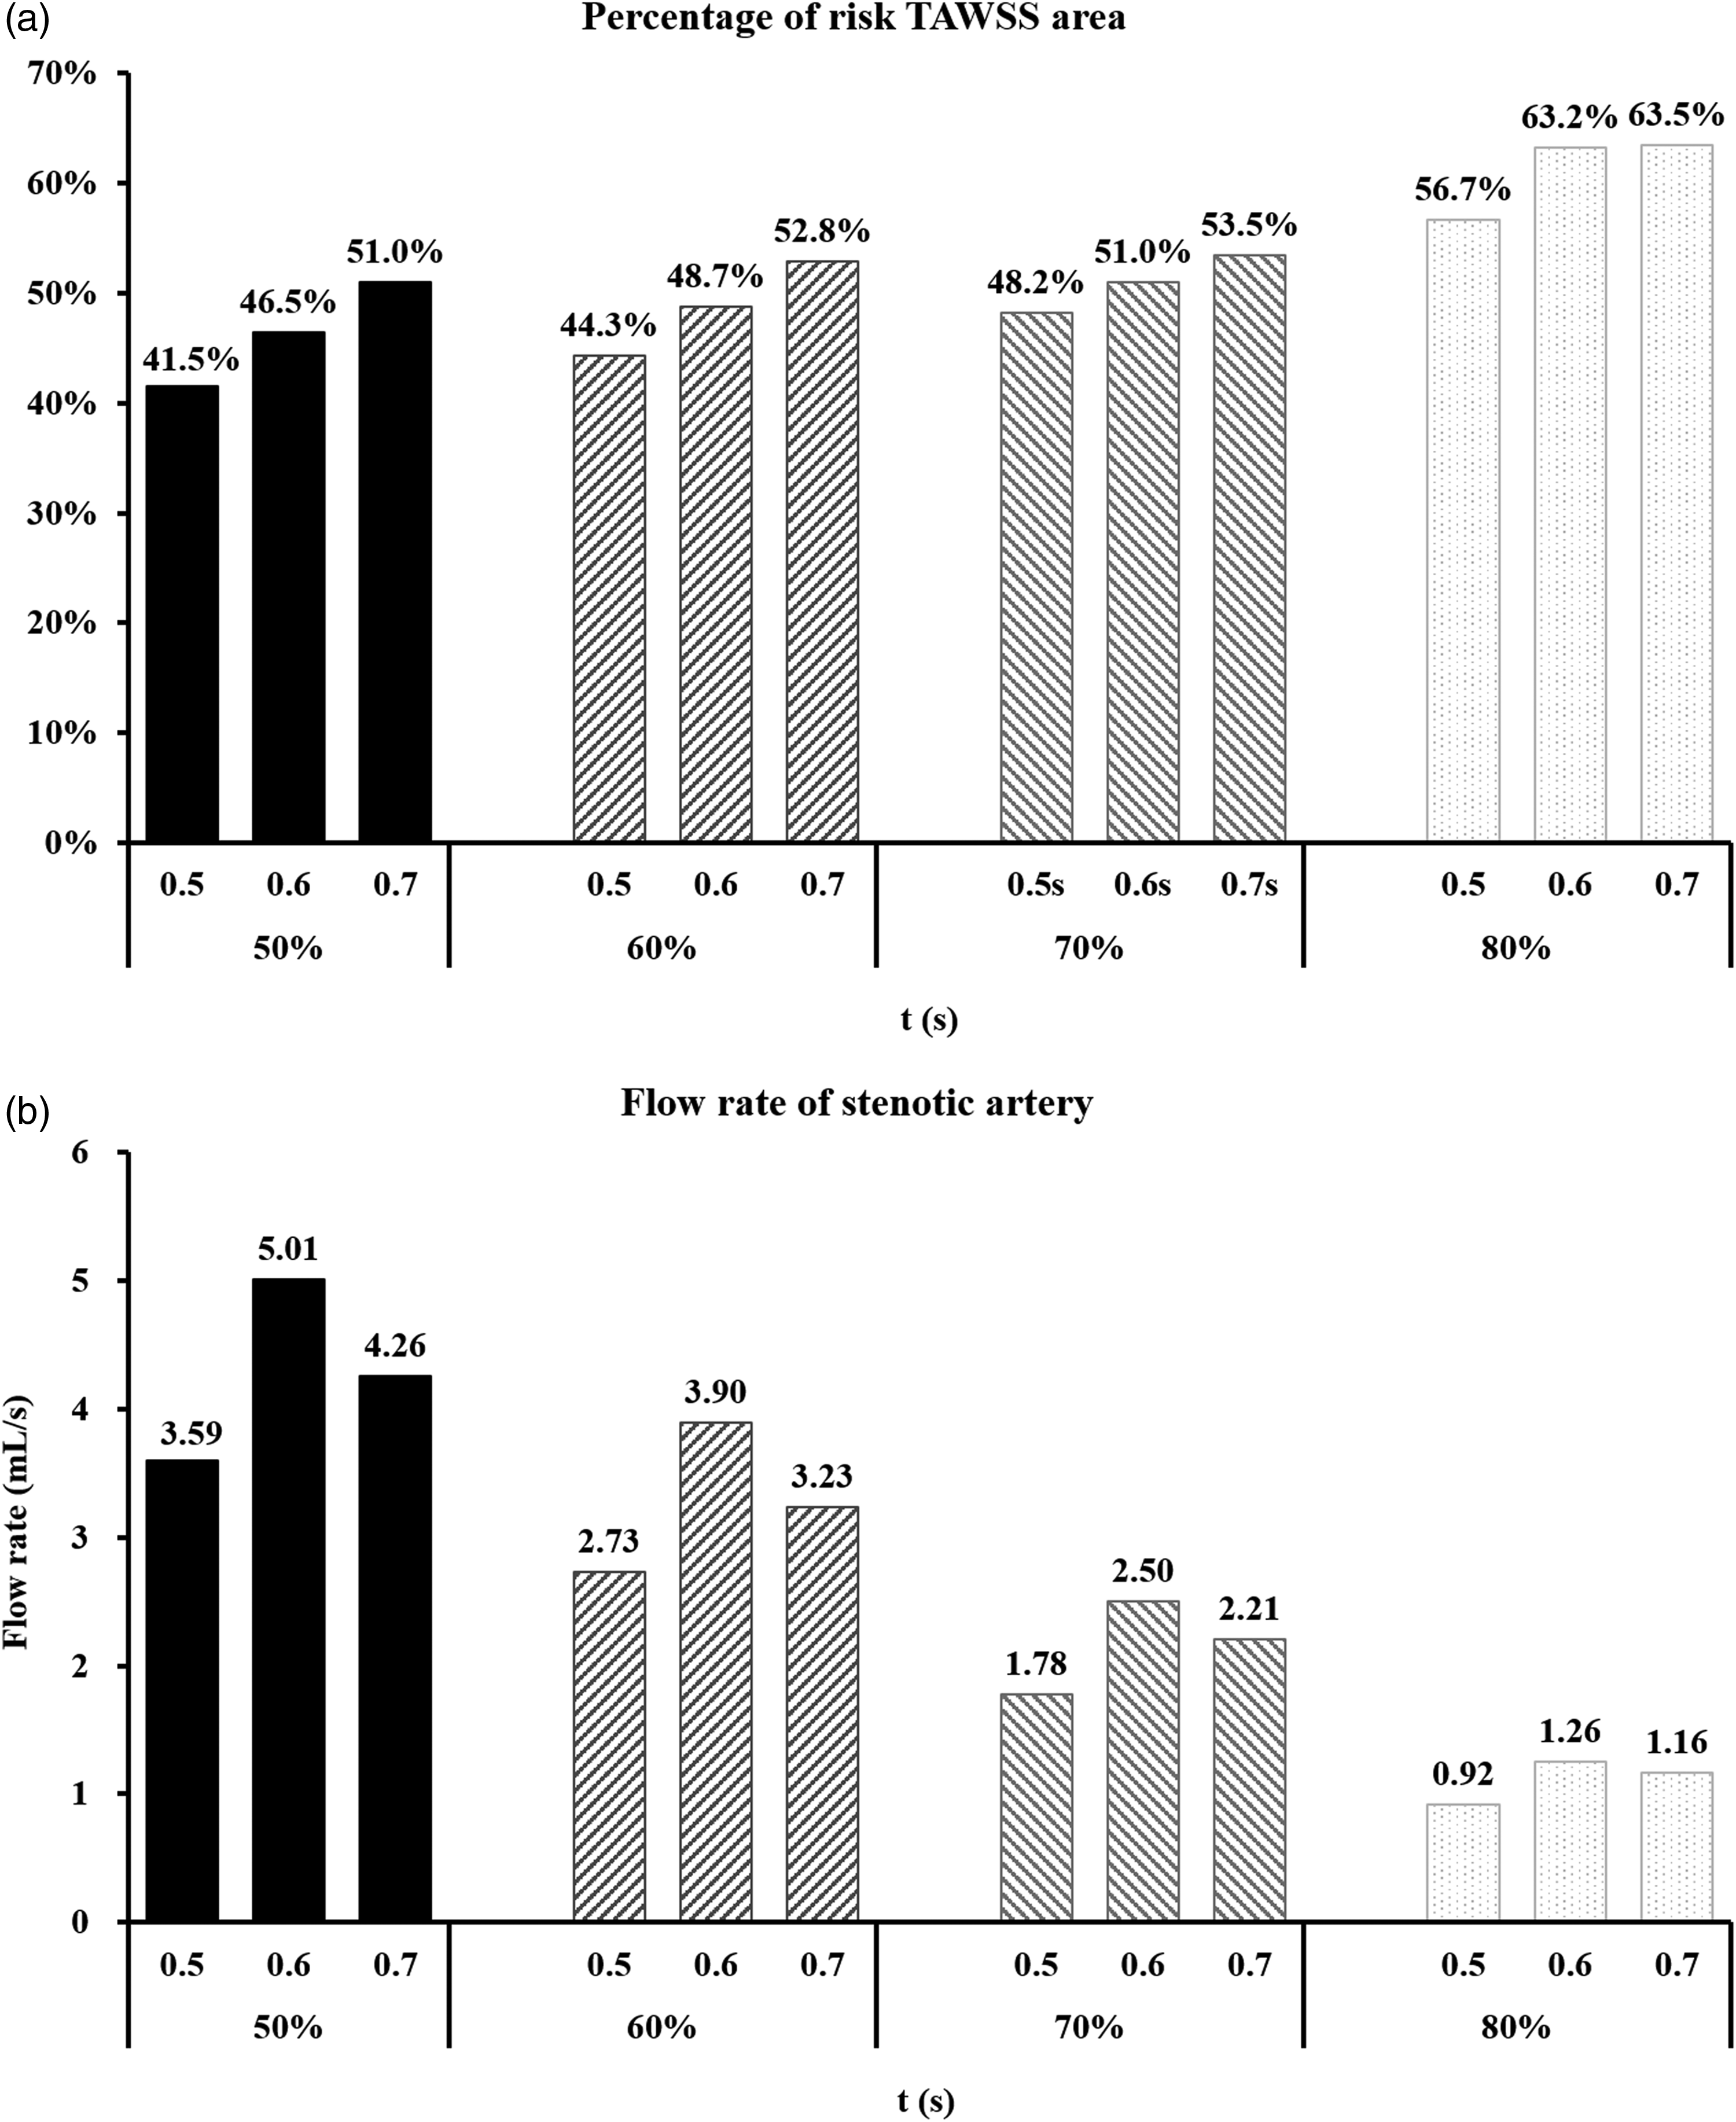
A is the PRTAWSSA (ATAWSS > 7 Pa and ATAWSS < 1 Pa) of each stenotic cerebral artery under different pressurization durations. Where PRTAWSSA is the percentage of risk TAWSS area. B is the flow rate of the stenotic branch of each cerebral artery model under different pressurization durations.
Flow rate of stenotic branch
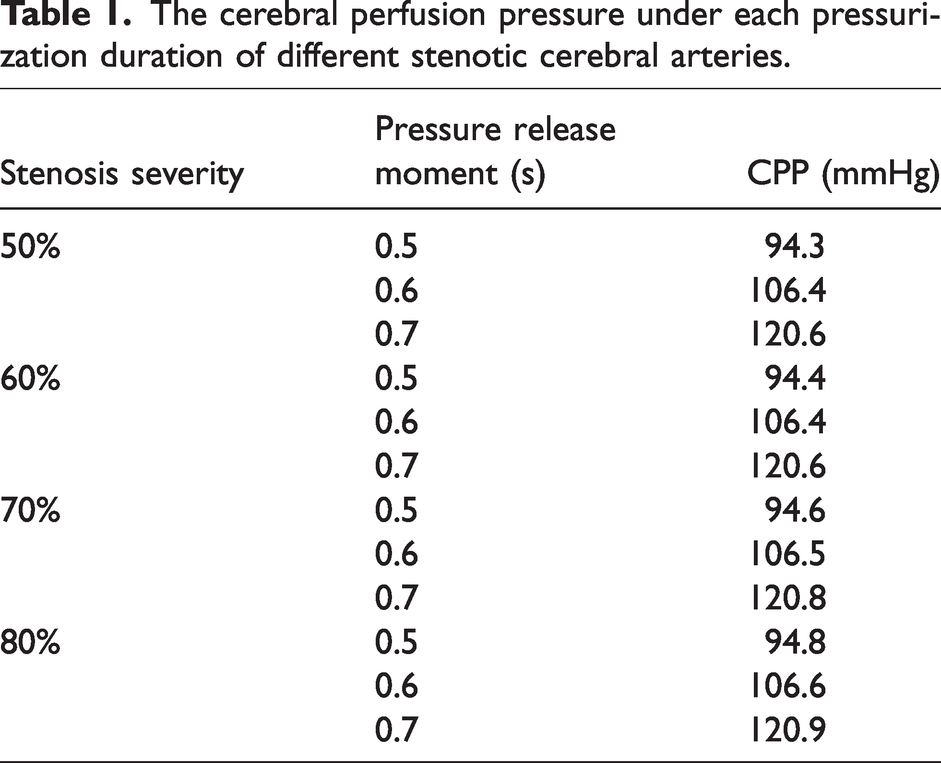
EECP therapy can obviously increase cerebral blood perfusion and improve ischemia. However, it was found that the flow rate of the stenotic branch increased first and then decreased with the prolongation of the pressurization duration, as shown in Figure 6(b). In addition, when the pressure release moment was from 0.6·Tc s to 0.7·Tc s, the flow reduction gradient of the severe stenosis became smaller than that of the moderate stenosis. For example, in the 80% stenosis model, when the pressure release moment was 0.7·Tc s, the flow rate of stenotic branch was only 0.1 mL/s lower than that in the mode of 0.6·Tc s. The CPP was also extracted under each pressurization duration, as shown in Table 1.
The cerebral perfusion pressure under each pressurization duration of different stenotic cerebral arteries.
Discussion
Cerebral autoregulation model
Analysis of model calculation results
From the calculation results of MA model, linear model, and model without autoregulation mechanism shown in Figure 1, it can be found that the MA model was most close to the standard fitting curve of clinical measurements, which can prove the reliability and effectiveness of the MA model proposed in this paper. When the perfusion pressure was in the range of 100–120 mmHg, the increase of CBF calculated based on the MA model showed a nonlinear trend and the increment was small, which was the result of the nonlinear function in the model. Multi-autoregulation produces blood vessel contraction, reducing diameter to increase the blood flow resistance and decreasing blood flow under physiological conditions. However, the increase of CBF calculated by the linear model was linearly related to the CPP, which could not accurately reflect the real physiological situation. Therefore, the increase of CBF calculated by the linear model was higher than the clinical measurement. In addition, the blood flow calculated by the model without autoregulation mechanism was very large, which was more unreasonable. In general, with regard to the neurogenic regulation of the MR model, although only a sympathetic nerve model was established without considering the role of cholinergic and peptidergic neurons in this study, it can still be found from the comparison of results that the accuracy of the proposed MR model is significantly higher than that of the linear model and the model without autoregulation.
Furthermore, the cardiac cycle-averaged CPP value changed about from 100 to 125 mmHg due to different EECP pressures in our model calculation. According to the study of Liang, 44 the upper limit of cardiac cycle-averaged CPP for the brain to maintain the stable flow is about 120 mmHg in the cerebral autoregulation. The calculation results of MR model, as shown in Figure 1, demonstrate that the cerebral blood flow can still be almost stable when CPP is slightly greater than 120 mmHg, indicating that neural regulation operates for increases in CPP above the upper limit of autoregulation. 45 In our MR model, neural regulation might play a role when CPP was greater than 120 mmHg, leading to the stability of cerebral blood flow. However, neural regulation is limited and, if CPP continues to increase, the flow will also increase.
In the numerical simulation results of EECP with different stenosis severities, the flow rate of the stenotic branch was found to first increase and then decrease with pressurization duration during EECP simulation with different stenosis severities. We believe that this is the result of use of the MA model. Prolonged pressurization was associated with higher CPP (Table 1), which exceeded 106 mmHg when the pressure release moment was more than 0.6·Tc s, activating cerebral autoregulation and increasing cerebral arteriole resistance. Combined with the inhibition of stenosis on CBF, the CBF would decrease when the CPP was high. CBF would decrease when the CPP was high with mild stenosis but not for severe (80%) stenosis. Many clinical studies have shown deterioration of cerebral autoregulation in stroke patients, an effect which correlates with disease severity.6 –8 The MA model proposed in this paper takes stenosis degree into account. Therefore, prolonged EECP pressurization did not decrease CBF in the severe stenosis (80%) model. Autoregulation was good for the moderate stenosis (50%) model and inhibition of acute CBF increase was seen. The mechanical effect of stenosis in eventually reducing the CBF is consistent with clinical experience, illustrating the accuracy of the MA model.
Analysis of physiological authenticity
It is noteworthy to be acknowledged that as a kind of perivascular nerves, although sympathetic nerve has some regulatory effect in response to sudden changes in blood pressure, its role is limited. Previous study shown that autoregulation functioned well following sympathetic ganglionectomy. The sympathetic nerves modulated the upper limit of cerebral autoregulation, which can play some role in the autoregulation of CBF. 45 But the autoregulation mechanism does not completely depend on the perivascular sympathetic nerve activity. The cerebral multi-autoregulation model established in this study includes vascular smooth muscle reflex regulation, neurogenic regulation, shear stress regulation, whereas neurogenic regulation only plays a part in it. Apart from neurogenic regulation, the other two regulatory mechanisms also play an important role in cerebral autoregulation.
Regarding to the shear stress reactivity, a major component of the response to it is attributable to endothelial release of NO and possibly other vasoactive molecules. 23 Typically, the vascular endothelium is damaged in the region of the stroke, but not in other (penumbral) areas. This would predict that the efficiency of autoregulation would vary as a function of distance from the core of the main stroke, which emphasizes that the relative contribution from each autoregulatory mechanism varies significantly among different brain regions, and can be quite different in core ischemic, penumbral, and unaffected areas. Whereas the 3D model of the cerebral artery in this study has a relatively complete Willis ring (single left posterior communicating artery (PCoA)) and compensatory activity means that, even if the right internal carotid artery is narrowed, distal ischemia may not necessarily result. 46 As a result, the selected patient (60% stenosis) in this study may not present serious ischemic regions, and the cerebral autoregulation may not differ significantly by region. However, stenosis downstream of the Willis ring is likely to lead to ischemia. From the perspective of modelling, the MA model in this study is still imperfect. The brain has previously been divided into 68 functional regions. 47 A more comprehensive brain model can be established according to this partition method, so that the brain region can be better correlated with the stenosis position, and thus a more accurate mathematical model of cerebral autoregulation can be established.
Blood flow is known to fluctuate and EECP is highly dependent, as is CPP. As such, wall tension and myogenic reactivity are also highly dynamic and vary pulse-to-pulse. The highly transient nature of perfusion pressure pulse was considered in the simulation model. Because in the autoregulation model, the vascular resistances of cerebral artery varied in each time step according to the time-varying perfusion pressure waveform. For example, R261 varied with the change of CPP at each calculation time step (see Supplementary Figure 4 in Appendix) and resistance rose to maintain blood flow stability when CPP was greater than 100 mmHg reaching an upper limit when CPP was greater than 140 mmHg. Therefore, the change of cerebrovascular resistance caused by the mathematical cerebral autoregulation model was highly transient.
Optimized EECP treatment strategies with different stenosis severities
Prolonged pressurization produces more areas of risk of high TAWSS (> 7 Pa) at distal stenosis for a cerebral artery with the same stenosis severity. However, the increased gradient of risk TAWSS area gradually decreased and the flow rate of the stenotic branch did not decrease with increased stenosis severity. The three haemodynamic indicators, mean TAWSS value, PRTAWSSA and the flow rate of the stenotic branch, show that only the mean TAWSS in the distal area of stenosis under the 0.5·Tc s-pressure release moment was within the healthy range (4–7 Pa) and the PRTAWSSA was significantly smaller than that under the pressure release moment of 0.6·Tc s and 0.7·Tc s (difference ≥ 5%) for a cerebral artery with 50% stenosis. Therefore, the EECP mode with 0.5·Tc s-pressure release moment should be selected for a cerebral artery with 50% stenosis. The mean TAWSS in the distal area of stenosis was approximately 7 Pa when the pressure release moment was 0.6·Tc s for 60% stenosis and the treatment effect was relatively good. The mean TAWSS exceeded 7 Pa when the pressure release moment was 0.7·Tc s which would likely cause damage to endothelial cells. PRTAWSSA showed a ≤ 5% difference for pressure release moments of 0.5·Tc s and 0.6·Tc s. Therefore, for the cerebral artery with 60% stenosis, the EECP mode with pressure release moment of 0.6·Tc s should be selected. The mean TAWSS in the distal area of stenosis was close to 7 Pa and stenotic branch flow was close to the 0.6·Tc s mode with the maximum flow when the pressure release moment was 0.7·Tc s for cerebral arteries with 70% or 80% stenosis, producing a considerable treatment effect. Therefore, for cerebral arteries with 70% or 80% stenosis, the EECP mode of 0.7·Tc s-pressure release moment should be selected. In conclusion, longer pressurization duration should be chosen for EECP treatment of cerebral ischemic stroke patients with more severe stenosis to achieve better treatment outcomes.
However, the effects of atherosclerosis on cerebral ischemia and cerebral haemodynamics vary with the stenosis locations and stenosis severities among different patients. The occurrence of stenosis is not accidental. Research showed that the development of atherosclerosis is closely related to haemodynamics and is caused by the interaction between blood flow and vascular wall. 48 Affected by risk haemodynamic factors, atherosclerosis is prone to develop in specific location of artery. The model established in this study is mainly for patients with ischemic stroke caused by internal carotid artery stenosis. Because there is a large curvature in the cavernous sinus segment of internal carotid artery, which is easy to resulting in risk haemodynamic environment and thereby forming stenosis. Previous studies show that about 18–25% of ischemic stroke is caused by atherosclerotic lesions in the internal carotid artery.28,29 Therefore, internal carotid artery stenosis is one of the main causes of diseases in patients with ischemic stroke. In this study, the haemodynamic numerical simulations of different stenosis severities were carried out to optimize the treatment strategy of EECP for this kind of population. While the impact of different stenosis locations has not been considered in this study, which will be investigated in the future work.
Clinical significance
The simulation results of MA model proposed in this paper was close to the standard fitting curve of clinical measurements. Compared with the linear model we used before, MA model can reflect the human physiological reality, which presents better clinical practicability. Based on the MA model, a more accurate haemodynamic 0D model of cerebrovascular system can be established to simulate the CBF of patients with ischemic stroke. By applying this model to the 0D/3D geometric multi-scale model, the local haemodynamic environment of cerebral artery under different EECP modes can be simulated with more accuracy. Combined with the individualization algorithm for 0D model, 49 the global and local haemodynamic effects under different treatment strategies of EECP can be accurately simulated for each patient before the clinical operation. Among them, global effect (CBF) can be used to evaluate the improvement of cerebral ischemia, while local effects (TAWSS, etc.) can evaluate the development of atherosclerosis, so as to formulate the optimal EECP treatment strategy for each patient in two aspects and improve the clinical treatment benefit for each patient.
At present, establishing a reliable numerical simulation model based on human physiological reality is the future development direction. The establishment of a reliable and physiological multi-coupling brain model can provide a wealth of technical approaches for brain related research. The MA model proposed in this study presents a good reference in simulating the CBF response to acute changes of blood pressure, which provides a reliable method for the study of cerebral haemodynamics in the future. Especially in the aspect of cerebral neurovascular coupling,50,51 the MA model can provide a technical reference. This also lays a foundation for establishing a more realistic multi-coupling model of the human brain.
Limitations and future work
In terms of clinical validation, this study only compared the MAP and CBF waveforms under different counterpulsation pressures with the clinical reported results. Due to the lack of relevant multi-center clinical research, further verification for the simulation model cannot be conducted. This study only uses a patient-specific model with cerebral artery stenosis to establish a generic cerebral haemodynamic model, which is not convincing enough. In the regard of modelling, some simplifications were conducted and will inevitably cause some simulated errors. First, a same regulation model was applied to cerebral artery resistances in this study, without considering the variability in myogenic and neurogenic activity in cerebral conduit arteries and arterioles. Then, there is potent interaction between sympathetic activity and myogenic activity in the larger arteries, but not in the very small arterioles that generally lack a functional innervation. These physiological mechanisms were not considered in the proposed model, which may contribute to predictive inaccuracies. In addition, the model did not account for major differences in artery stiffness and contractility that present with advancing age or hypertension. The neurogenic regulation, myogenic regulation, and shear stress regulation models established in this study contained many empirical parameters. And these parameters were not time-sensitive variables. Therefore, the mathematical model of cerebral autoregulation could not be highly dynamic. This did lead to larger model calculation error when CPP was high. In the future work, clinical experiments could be conducted to collect more clinical data and test different EECP modes. Furthermore, the cerebral autoregulation model and the EECP numerical model could be optimized and calibrated so as to obtain more accurate simulation results. In addition, previous study has shown that the function of cerebral autoregulation mechanism in patients with cerebral ischemic stroke will gradually recover with EECP treatment, 9 but this mechanism has not been simulated in this study.
Conclusions
In this study, cerebral MA model taking into account the severity of cerebral artery stenosis was established and added to the 0D/3D geometric multi-scale haemodynamic model of a cerebral artery. The accuracy of the cerebral MA and EECP numerical models were verified by reference to published clinical data. In addition, haemodynamic numerical simulation of different EECP pressurization durations was performed on cerebral artery models with different stenosis severities. Suitable EECP modes with pressure release time of 0.5·Tc, 0.6·Tc, 0.7·Tc s were identified for stenosis rates of 50%, 60%, 70–80%, respectively. The MA model proposed in this study is significant to improve the numerical simulation accuracy of cerebral haemodynamics. The simulation results based on this model have potential clinical application value for the optimization of EECP treatment strategy for cerebral ischemic stroke patients with different stenosis severities.
Supplemental Material
sj-pdf-1-jcb-10.1177_0271678X231179542 - Supplemental material for Cerebral multi-autoregulation model based enhanced external counterpulsation treatment planning for cerebral ischemic stroke
Supplemental material, sj-pdf-1-jcb-10.1177_0271678X231179542 for Cerebral multi-autoregulation model based enhanced external counterpulsation treatment planning for cerebral ischemic stroke by Bao Li, Youjun Liu, Jincheng Liu, Hao Sun, Yili Feng, Zhe Zhang and Liyuan Zhang in Journal of Cerebral Blood Flow & Metabolism
Footnotes
Funding
The author(s) disclosed receipt of the following financial support for the research, authorship, and/or publication of this article: We acknowledge financial support received from the National Key Research and Development Program of China (Grant No. 2021YFA1000200, 2021YFA1000202, and 2020YFC2004400), the National Natural Science Foundation of China (Grant No. 12202022, 11832003, 32271361, 12102014), China Postdoctoral Science Foundation (Grant No. 2022M710281), and the Beijing Postdoctoral Research Foundation (Grant No. 2022-ZZ-035).
Data availability
Data are available on reasonable requests by qualified investigators to the corresponding author.
Research ethics approval
This study was approved by the local institutional review board of the Peking University Third Hospital.
Declaration of conflicting interests
The author(s) declared no potential conflicts of interest with respect to the research, authorship, and/or publication of this article.
Authors’ contributions
(1) Guarantor of integrity of entire study, Liyuan Zhang and Bao Li; (2) study concepts/study design, Bao Li, Youjun Liu, and Liyuan Zhang; (3) data acquisition, Zhe Zhang and Yili Feng; (4) data extraction and analysis, Bao Li, Jincheng Liu, and Hao Sun; (5) manuscript drafting, Bao Li and Liyuan Zhang; (6) manuscript revision for important intellectual content, all authors; (7) approval of final version of submitted manuscript, all authors; (8) agrees to ensure any questions related to the work are appropriately resolved, all authors; (9) statistical analysis, Bao Li and Liyuan Zhang; (10) manuscript editing, all authors.
Supplementary material
Supplemental material for this article is available online.
References
Supplementary Material
Please find the following supplemental material available below.
For Open Access articles published under a Creative Commons License, all supplemental material carries the same license as the article it is associated with.
For non-Open Access articles published, all supplemental material carries a non-exclusive license, and permission requests for re-use of supplemental material or any part of supplemental material shall be sent directly to the copyright owner as specified in the copyright notice associated with the article.