
Abstract
Cerebral edema following cerebral infarction can be severe and directly affect mortality and mobility. Exercise therapy after cerebral infarction is an effective therapeutic approach; however, the molecular mechanism remains unclear. Myokines such as interleukin-1 receptor antagonist (IL-1RA) are released during skeletal muscle contraction with effects on other organs. We hypothesized that myokine release during exercise might improve brain edema and confirmed the hypothesis using transient middle cerebral artery occlusion (tMCAO) model rats. Rats subjected to tMCAO were divided according to the severity of illness and further assigned to exercise and non-exercise groups. Treadmill exercises were performed at a speed of 2–8 m/min for 10 min from 1–6 days post-reperfusion after tMCAO. Exercise significantly reduced edema and neurological deficits in severely ill rats, with a reduction in aquaporin-4 (AQP4) expression in the ischemic core and increased blood IL-1RA release from the stroke-unaffected hindlimb muscle after tMCAO. Administration of IL-1RA into the lateral ventricles significantly reduced edema and AQP4 expression in the ischemic core. In conclusion, treadmill exercise performed in the early phase of stroke onset alleviated the decrease in blood IL-1RA following ischemic stroke. IL-1RA administration decreased astrocytic AQP4 expression in the ischemic core, suppressing brain edema.
Introduction
Stroke, including cerebral infarction, is the second leading cause of death worldwide; moreover, it is a global health problem. Cerebral ischemia or reperfusion after ischemia causes cerebral capillary dysfunction, which results in cerebral edema. 1 Cerebral edema is defined as brain swelling owing to excess fluid accumulation in the brain parenchyma, which can be severe and directly cause death. Treatment options for cerebral edema include pharmacological treatment with hyperosmotic solutions such as D-mannitol or hypertonic saline and intravenous steroids, as well as conventional surgical treatments such as decompressive craniectomy for cerebral edema, which often leads to brain herniation.
Exercise therapy after cerebral infarction is another effective therapeutic approach. Rehabilitation in the subacute post-stroke phase improves neurological and motor functions. Further, initiating rehabilitation in the hyperacute phase decreases neuromotor dysfunction. In an animal model study of cerebral infarction, treadmill exercise reduced infarct volume and cerebral edema as well as restored motor function. 2 Post-infarction exercise inhibits inflammatory responses and endothelial cell apoptosis and promotes angiogenesis.3,4 However, the molecular mechanisms underlying the improvement of post-stroke brain dysfunction remain unclear.
There has been increasing attention regarding the involvement of myokines in the systemic effects of exercise. Myokines are bioactive substances that are produced and released during skeletal muscle contraction and affect other organs. 5 Dozens of myokines are involved in various pathological conditions. For example, interleukin (IL) 6 and osteonectin are cancer inhibitory myokines, whereas brain-derived neurotrophic factor, which is a brain neurotrophic factor, improves depression and brain function.6–8 Furthermore, irisin exerts neuroprotective effects after cerebral ischemia, and IL-1 receptor antagonist (IL-1RA) is an anti-inflammatory cytokine and a myokine.9–13 However, the function of most myokines remains unclear.
The expression of aquaporin-4 (AQP4), which is the most abundant water channel protein in the brain, increases after infarction and is closely involved in the pathophysiology of cerebral edema.14,15 In the brain, AQP4 is localized in the subarachnoid space, epithelial cells of the choroid plexus, and perivascular astrocytic endfeet. 16 A study using AQP4-knockout mice reported that AQP4 deficiency slowed astrocyte swelling and reduced brain edema in a model of brain edema with water intoxication or hyponatremia. 17 After brain injury or disease, these astrocytes change to a phenotype called “reactive”, with altered expression of numerous genes.18,19 Liddelow et al. reported that IL-1 alpha (IL-1α), tumor necrosis factor (TNF), and C1q secreted by activated microglia are closely involved in the phenotypical changes in reactive astrocytes. 20 We recently demonstrated that IL-1α and TNF secreted from activated microglia in the ischemic core induce astrocyte activation and increase AQP4 expression. 14 Furthermore, we found that the expression levels of AQP4 and IL-1α in the ischemic core of transient middle cerebral artery occlusion (tMCAO) model rats were higher in severely ill rats than in mildly ill rats, whereas IL-1 beta (IL-1β) expression was lower. 14
We hypothesized that myokines such as IL-1RA would improve cerebral edema after stroke. To test the hypothesis, this study investigated the effects of exercise and of myokines on cerebral edema using tMCAO model rats, as well as primary cultured astrocytes of rats.
Materials and methods
Animals and surgical procedures
Animal care and experiments conformed to the Guidelines for Animal Experiments of Osaka University and were approved by the Animal Research Committee of Osaka University (No. 01-024-002). The experiments are reported following the ARRIVE guidelines (Animal Research: Reporting in Vivo Experiments). 21 We subjected 7-week-old male Wistar rats (n = 211, weight 210 ± 20 g; Kiwa Laboratory Animals Co., Wakayama, Japan) to tMCAO for 90 min, as previously described. 22 Rats were anesthetized with 1.5–2% isoflurane via face mask, and the right middle cerebral artery was occluded using a 4-0 nylon monofilament suture, which was advanced from the internal carotid artery. Rats were allowed to recover from anesthesia during occlusion and were then re-anesthetized 90 min later and re-perfused by withdrawing the thread. For the sham surgery, animals were anesthetized, a midline incision was made in the neck, and the right carotid artery was isolated. Rats that were subjected to tMCAO were weighed before the surgery, and rats with less than 10% weight loss on the day after tMCAO were excluded from the analysis. 14 For IL-1RA administration, immediately before tMCAO, a microsyringe (4015-11000, Hamilton, Reno, NV, USA) was inserted into the lateral ventricle 0.8 mm posterior to the bregma, 1.6 mm to the left side, and 4.3 mm deep from the brain surface using a stereotaxic instrument (Narishige, Tokyo, Japan). The control group received 2 μL of artificial cerebrospinal fluid (ACSF) (R&D Systems, Inc., Minneapolis, MN, USA), whereas the IL-1RA group received 2 μL of recombinant rat IL-1RA (10 µg/μL; ProSpec-Tany TechnoGene Ltd., Ness-Ziona, Israel)/ACSF. In both groups, the administration rate was 1 μL/min; moreover, the needle was left in place for 5 min after administration. Body temperature was maintained at 37 ± 0.2°C during the surgical procedures. For IL-1RA plasmid administration, 50 µg of pRP[Exp]-EGFP/Puro-CAG>rIl1rn[NM_022194.2] plasmid (IL-1RA_plasmid) (VB900004-2610xgp, VectorBuilder Inc., Chicago, IL, USA) or pRP[Exp]-EGFP/Puro-CAG>ORF_stuffer (VB010000-9288rhy, VectorBuilder Inc.) plasmid (control_plasmid) treated with 200 µL of GenJet™ Plus DNA In Vivo Transfection Reagent (SignaGen Laboratories, Frederick, MD, USA) was injected into the right hindlimb gastrocnemius muscle 2 days before tMCAO. The sham rats were injected GenJetTM Plus DNA In Vivo Transfection Reagent without plasmid.
In vitro experiments were performed using neonatal Wistar rats (n = 33, Kiwa Laboratory Animals Co.) aged 0–2 days. The rats were kept at room temperature (22 ± 1°C) with free access to water and food (light period (7:00 am to 7:00 pm); dark period (7:00 pm to 7:00 am)) until the experiments.
Treadmill exercise
The animals were forced to run on a multi-unit treadmill system (TMS- 4B, Merquest Ltd., Toyama, Japan) at a speed of 4–6 m/min for 10 min at 18°C for 3 days before surgery. 2 On day 1 post-reperfusion (dpr) after tMCAO, the rats were assigned to the non-exercise or exercise group based on the percentage of weight loss compared with the pre-treatment period. From 1 dpr to 6 dpr after tMCAO, the exercise group performed treadmill exercises using a multi-unit treadmill system at a speed of 2–8 m/min for 10 min at 18°C.
Grip test
Forelimb muscle strength was measured using a small animal grip strength measuring device (GPM-101B, Merquest Ltd.). The measurements were performed three times each before tMCAO and at 7 dpr after tMCAO.
Blood count measurement
Blood was collected from the inferior vena cava at 7 dpr after tMCAO. Subsequently, using a fully automatic blood cell counter (PCE-210T; Erma Inc., Saitama, Japan), the following parameters were determined: number of white blood cells, red blood cells, and platelets; number and rate of lymphocytes, monocytes, and granulocytes; hemoglobin concentration; hematocrit rate; mean corpuscular volume; mean corpuscular hemoglobin; mean corpuscular hemoglobin concentration; red blood cell distribution width; mean platelet volume; platelet distribution width; and platelet crit value.
Neurological examination
Each rat was subjected to neurological examination before tMCAO and at 7 dpr after tMCAO. Neurological functions were assessed using the modified Neurologic Severity Score, including motor, sensory, reflex, and balance tests (Supplemental Table 1). The scores range from 0 to 18: 13–18, severe injury; 7–12, moderate injury; and 1–6, mild injury.
Brain water content measurement
The cerebrums were dissected from the euthanized rats at 7 dpr after tMCAO and divided into left and right hemispheres at the midline. Each hemisphere was weighed, dried at 100°C for 24 h, and weighed again. The ratio of dry to wet weight (wet/dry weight) was calculated for both hemispheres.
Primary culture of glial cells
Whole forebrains of neonatal rats were dissected and dissociated into individual cells using a nylon bag with 160-μm pores. The dissociated cells were a mixture of glial cells, including astrocytes. The suspensions were seeded in 75 cm2 flasks (Corning, NY, USA) coated with poly-L-lysine hydrobromide (PLL) (Sigma-Aldrich, St. Louis, MO, USA) in two flasks per animal and cultured in Dulbecco’s modified Eagle’s medium (DMEM) (Fujifilm Wako Pure Chemicals, Osaka, Japan) containing 10% fetal bovine serum (FBS) and penicillin-streptomycin-amphotericin B suspension (PSA) (Fujifilm Wako Pure Chemicals). The medium was changed every other day; moreover, the culture was maintained for 13 days.
Isolation of astrocytes
Glial cells cultured for 13 days were shaken using a BioShaker (Titech Co., Saitama, Japan) at 200 rpm at 37°C for 1 h. The astrocytes were purified using the Anti-GLAST (ACSA-1) MicroBead Kit (Miltenyi Biotec, Bergisch Gladbach, Germany) and seeded in PLL-coated 6- or 24-well plates (Corning) or PLL-coated coverslips (Matsunami Glass, Osaka, Japan). The next day, cells were grown in a serum-free E2 medium, which comprised PSA-supplemented DMEM-based medium containing 10 mM HEPES (pH 7.4), 4.5 mg/mL glucose, 10 μg/mL insulin, 38.7 nM sodium selenite, 5.5 μg/mL transferrin (GIBCO, Grand Island, NY, USA), and 1 mg/mL bovine serum albumin (BSA) (Sigma-Aldrich). For some experiments, E2 was supplemented with recombinant rat IL-1α (3 ng/mL; Sigma-Aldrich) and/or recombinant rat IL-1RA (1 µg/mL).
Triphenyltetrazolium chloride stain
Rats subjected to tMCAO were euthanized using CO2 gas at 0.25, 1, 2, 3, 5, and 7 dpr. Brains were dissected, and 2-mm-thick coronal sections were prepared at the caudo-putaminal level. The brain slices were stained using 0.1% 2, 3, 5-triphenyl-2H-tetrazolium chloride (Fujifilm Wako Pure Chemicals), dissolved in phosphate-buffered saline (PBS) for 5 min, and divided into the contralateral cortex, peri-infarct tissue, and ischemic core. 23 These tissues were homogenized using 5-mm stainless steel beads (Titech Inc.) in reagents for messenger ribonucleic acid (mRNA) or protein.
Quantitative real-time polymerase chain reaction (qPCR)
Brain tissue RNA was extracted using the mirVana miRNA Isolation Kit (Thermo Fisher Scientific, Waltham, MA, USA), whereas the gastrocnemius muscles and cultured cells were extracted using ISOGEN® (Nippon Gene, Tokyo, Japan). Extracted RNA was used for complementary DNA synthesis using ReverTra Ace® qPCR RT Master Mix with gDNA Remover (Toyobo, Osaka, Japan). Subsequently, it was treated with TB Green Premix Ex Taq II (Takara Bio Inc., Shiga, Japan), followed by qPCR using the CFX Connect Real-Time System (Bio-Rad Laboratories, Hercules, CA, USA). All gene-specific mRNA expression values were normalized to the expression value of glyceraldehyde-3-phosphate dehydrogenase mRNA. The primer sequences for each gene are listed in Supplemental Table 2.
Immunohistochemistry
Immunofluorescence staining of the cerebral infarct tissue was performed as previously described. 22 For immunocytochemical staining, cultured cells were seeded on PLL-coated coverslips and fixed using 4% paraformaldehyde. Next, tissues and cells were incubated with the primary antibodies against AQP4 (1:50; rabbit polyclonal, AB3594; Chemicon, Temecula, CA, USA), glial fibrillary acidic protein (GFAP) (1:250; mouse monoclonal, MAB360; Chemicon), ionized calcium-binding adapter protein 1 (Iba1) (1:250; goat polyclonal, ab107159; Abcam, Cambridge, UK), or IL-1RA (1:100; rabbit polyclonal, NBP1-32568; Novus Biologicals, LLC., Centennial, CO, USA) in Tris-buffered saline containing 0.1% Tween-20 (TBST) and 0.1% BSA. After washing with TBST, tissues and cells were incubated with DyLight 488, DyLight 549, and/or DyLight 649-labelled secondary antibodies (1:1000; Invitrogen, Carlsbad, CA, USA), and Hoechst 33342 (1:1000; Invitrogen) was used for nuclear staining. Finally, the immune-stained specimens were observed using an all-in-one fluorescence microscope (BZ-X710; Keyence, Osaka, Japan) with a CFI Plan Fluor 20× lens (Nikon, Tokyo, Japan) or a confocal laser scanning microscope (AX-R Ti2; Nikon) with a Plan Apo λD 60× Oil OFN25 DIC N2 lens (Nikon in the Nikon Imaging Center, Osaka University). The images were quantified using Adobe Photoshop (Adobe Systems Incorporated, San Jose, CA, USA). The grayscale images were converted to black and white, and the stained-area was selected. The area and mean fluorescence intensity average were calculated by superimposing the stained area and raw images.
Western blot analysis
The cultured cells were lysed using the Laemmli sample solution. The lysate was electrophoresed using 10–20% acrylamide gel (SuperSep Ace, Fujifilm Wako Pure Chemicals) and transferred onto a polyvinylidene fluoride membrane (Millipore, Billerica, MA, USA), which was then cut at 37 kDa. The membranes containing 25 to 37 kDa or 37 to 50 kDa were immunoblotted with primary antibodies against AQP4 (1:100; rabbit polyclonal, AQP-004; Alomone, Jerusalem, Israel) or β-actin (1:500; mouse monoclonal, A5441; Sigma-Aldrich), respectively. Following incubation with a horseradish peroxidase-linked secondary antibody (1:5000; GE Healthcare, Marlborough, MA, USA), the immunoreactions were visualized using Western BLoT Chemiluminescence HRP Substrate (Takara Bio Inc.) and photographed with a ChemiDoc Touch Imaging System (Bio-Rad Laboratories). Immunoreactive bands were analyzed by densitometry using Adobe Photoshop. The densitometry data were standardized against the immunoreactivity of β-actin.
Enzyme-linked immunosorbent assay (ELISA)
Blood was drawn from the inferior vena cava of the rats at 7 dpr after tMCAO using a heparin-containing syringe. Plasma was collected through centrifugation at 4°C for 5 min at 3000 rpm. Moreover, the brains were homogenized in PBS containing a protease inhibitor cocktail (Sigma-Aldrich). The plasma and brain levels of IL-1RA and IL-1α were determined using a rat IL-1RA ELISA kit (RayBiotech Life, Inc., Peachtree Corners, GA) and a rat IL-1α ELISA kit (R&D Systems), respectively, according to each manufacturer’s instructions.
Plasmid DNA transfection
HEK-293T cells were maintained in 10% FBS-DMEM. The day before transfection, HEK-293T cells (2.5 × 10⁴ cells/cm2) were seeded in 6-well plates. The next day, IL-1RA_plasmid and control_plasmid were introduced into HEK-293T cells using a Lipofectamine® 3000 (Invitrogen) cell transfection kit. These cells were evaluated for the expression of IL-1RA mRNA using qPCR.
Statistical analysis
Values are expressed as the mean ± standard deviation. Data were analyzed using GraphPad Prism 8 (GraphPad Software, La Jolla, CA, USA). Data normality was examined using the Shapiro–Wilk normality test. The equality of variance between two normally distributed datasets was examined using the F test. Data were analyzed using a two-tailed Student’s t-test (unpaired). Multiple comparison tests were performed using one-way or two-way analysis of variance, followed by post-hoc tests (Dunnett or Tukey methods). Additionally, correlations between two variables were analyzed using Pearson’s correlation test. Statistical significance was set at p < 0.05. The results of the blood count measurements were normalized by unit variance processing using SIMCA 15 (Sartorius Stedium Data Analytics AB, Óstra Strandgatan, Umeå, Sweden), followed by principal component analysis (PCA).
Results
Indices for grouping according to the post-tMCAO severity of illness
First, we searched for indices for grouping the rats as mildly or severely ill with good or poor prognosis, respectively, after cerebral infarction. We had previously observed a negative correlation between the magnitude of weight loss and brain edema at 7 dpr after tMCAO. 14 Therefore, we assessed whether the magnitude of weight loss on the day after tMCAO could be used as a prognostic indicator. As shown in Figure 1, we examined the correlation between the magnitude of weight loss on the day after tMCAO and cerebral edema (a), neurological deficits (b), and forelimb muscle strength (c). There was a negative correlation between the magnitude of weight loss on the day after tMCAO and brain edema at 7 dpr after tMCAO (Figure 1(a), p < 0.001). Further, neurological deficits were also negatively correlated (Figure 1(b), p < 0.05). To assess forelimb muscle strength, we calculated the ratio of forelimb muscle strength at 7 dpr after tMCAO to that before tMCAO and found a positive correlation between the magnitude of weight loss on the day after tMCAO and forelimb muscle strength (Figure 1(c), p < 0.05). These results indicated that the magnitude of weight loss on the day after tMCAO predicted the prognosis of cerebral infarction. We used the magnitude of weight loss at 1, 2, and 7 dpr after tMCAO, and these profile data were applied to PCA for visualization. As shown in Supplemental Figure 1, rats at 1 dpr were provided with a number (e.g., Rat 1, 2 … 20) that corresponded to the order of weight loss magnitude. The rat number corresponded to the order of weight loss magnitude (i.e., a low number indicated a more severe condition). In the score plot, the data of low-number rats, except for those of Rat 9, were plotted in a negative direction with respect to the PC1 axis, whereas the data of high-number rats, except for those of Rat 11, were plotted in the positive direction (Supplemental Figure 1). Accordingly, we used a cut-off value of 15% to group the rats based on the magnitude of weight loss on the day after tMCAO. The rats with a magnitude of weight loss more than 15% on the day after tMCAO who continued to lose weight until 7 dpr were included in the severe group (0 dpr, 207.3 ± 11.8 g; 1 dpr, 173.4 ± 11.1 g). The rats that comprised the mild group (0 dpr, 210.6 ± 4.8 g; 1 dpr, 184.1 ± 4.4 g) with a magnitude of weight loss under 15% showed a tendency of gaining weight after peaking at 2 dpr after tMCAO (Figure 1(d)).
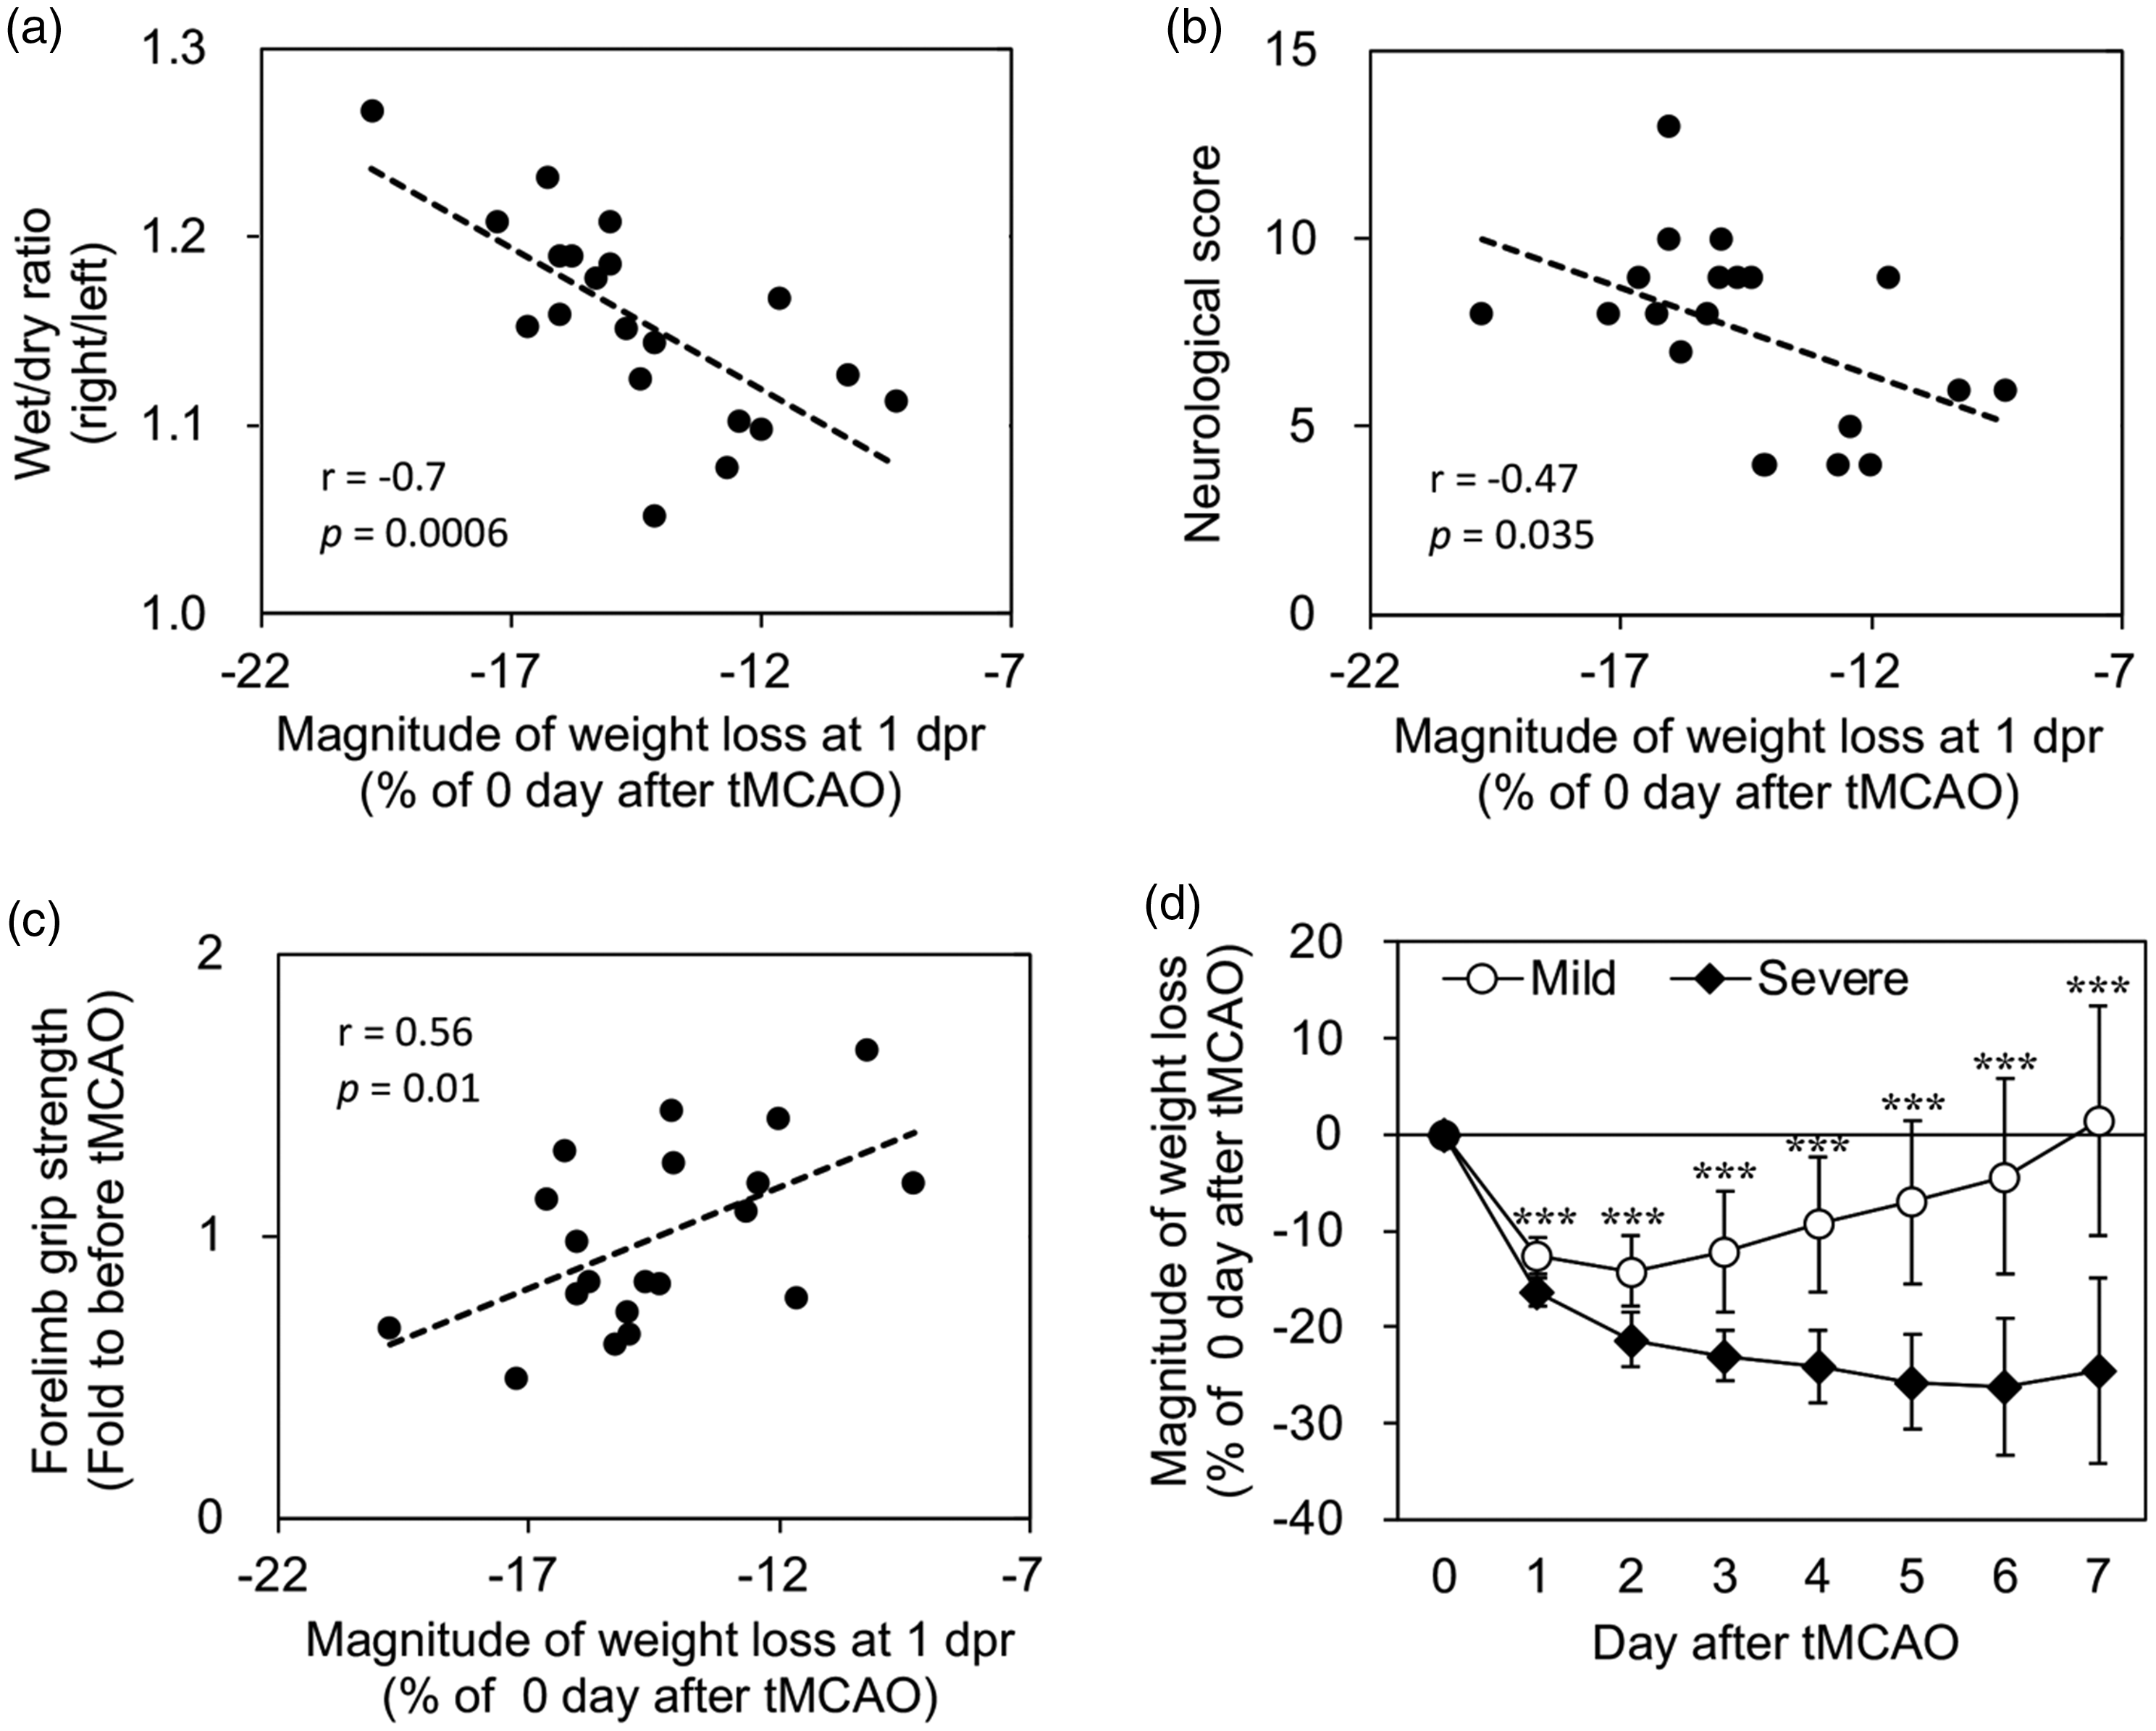
Correlation of the magnitude of weight loss. Correlation of the magnitude of weight loss on the day after transient middle cerebral artery occlusion (tMCAO) with brain edema (a), neurological score (b), and forelimb muscle strength (c) at 7 days post-reperfusion (dpr) following tMCAO (n = 20). (d) Weight changes after tMCAO in the mild and severe disease groups (n = 10, respectively). Data are expressed as mean ± standard deviation. *** indicates p < 0.001, compared with the severe group.
Effects of exercise on cerebral edema, neurological function, muscle strength, and blood cell composition
We examined the effect of exercise in the mild and severe groups. The day after tMCAO, the rats in both groups were subjected to a treadmill exercise using the protocol shown in Figure 2(a). First, we evaluated the validity of grouping with a weight loss magnitude under 15%. In the non-exercise groups, severely ill rats showed significantly increased brain edema and neurological deficits, as well as decreased forelimb muscle strength (Figure 2(b) to (d)). These results are consistent with those shown in Figure 1(a) to (c) and indicate the validity of the grouping. Next, we examined the effect of exercise on disease severity. In severely ill rats, exercise significantly reduced cerebral edema and neurological deficits (Figure 2(b) and (c)), as well as tended to increase forelimb muscle strength (Figure 2(d)). We measured 18 items in the blood cell counts, and these profile data were applied to PCA for visualization. In the score plot of Figure 2(e), there was no specific difference in the position of cluster formation in any group; however, some severely ill rats in the non-exercise group significantly deviated in a negative and positive direction with respect to the PC1 and PC2 axes, respectively. For the loading score (Figure 2(f)), the hematocrit rate, hemoglobin concentration, mean corpuscular hemoglobin, mean corpuscular hemoglobin concentration, and number of red blood cells were plotted in negative and positive directions with respect to the PC1 and PC2 axes, respectively, and showed that the severely ill rats in the non-exercise group, shown in Figure 2(f), had higher blood parameters. This finding suggests that the severely ill rats in the non-exercise group tended to be more dehydrated than those in the other groups.
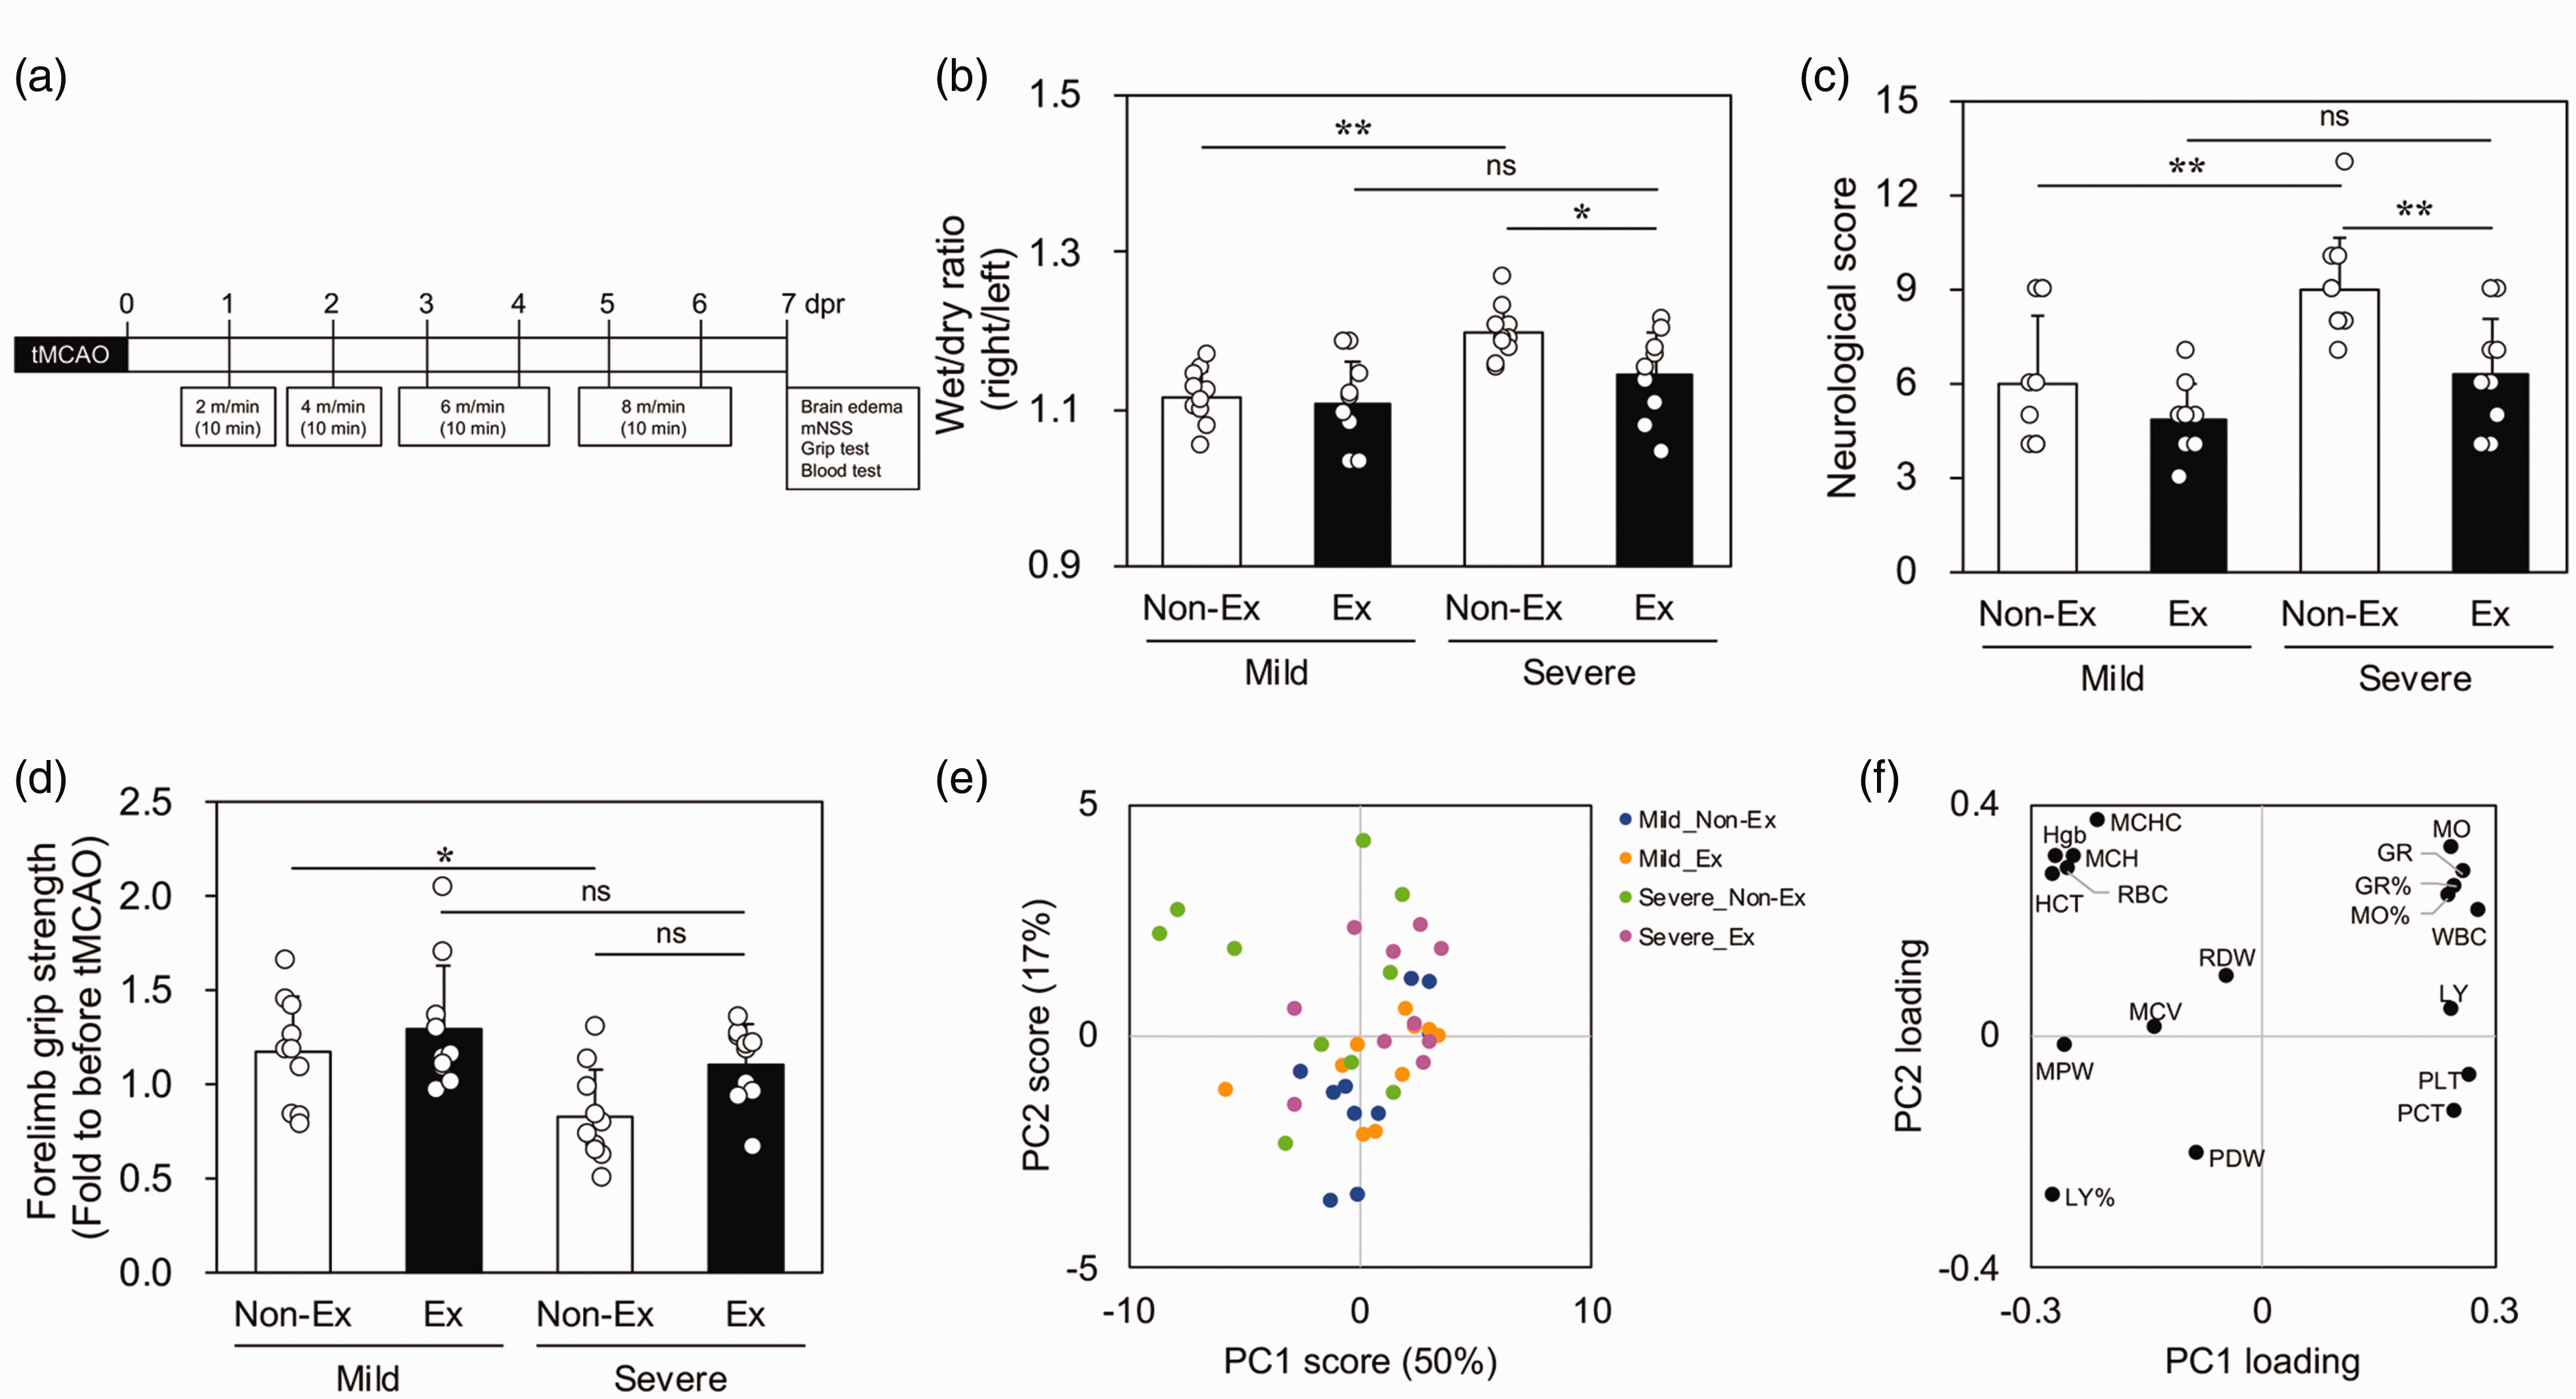
Exercise-induced changes in mildly and severely ill rats after transient middle cerebral artery occlusion (tMCAO). Exercise protocol (a), cerebral edema (b), neurological score (c), and forelimb muscle strength (d) at 7 days post-reperfusion (dpr) after tMCAO in the mild and severe groups. Data are expressed as mean ± standard deviation. * and ** indicate p < 0.05 and 0.01, respectively. Score (e) and loading (f) plots in the principal component analysis of blood counts at 7 dpr after tMCAO. Variances along principal component 1 (PC1) and 2 (PC2) accounted for 50% and 17%, respectively (e). Ex: exercise; GR: number and rate of granulocytes; HCT: hematocrit rate; Hgb: hemoglobin concentration; LY: number and rate of lymphocytes; MCH: mean corpuscular hemoglobin; MCHC: mean corpuscular hemoglobin concentration; MCV: mean corpuscular volume; mNSS: modified Neurologic Severity Score; MO: number and rate of monocytes; MPV: mean platelet volume; PCT: platelet crit value; PDW: platelet distribution width; PLT: number of platelets; RBC: number of red blood cells; RDW: red blood cell distribution width; WBC: number of white blood cells.
Effects of exercise on the expression of various genes
Next, we examined the expression changes of genes involved in brain edema in severely ill rats at 7 dpr after tMCAO. Exercise significantly decreased AQP4 mRNA expression in the ischemic core (Figure 3(e)). Additionally, we examined mRNA expression of the astrocyte activators IL-1α, TNF, and C1q. IL-1α and TNF were involved in the induction of AQP4 expression; however, they were not affected by exercise (Figure 3(a) and (b)). Contrastingly, C1q expression in the ischemic core was significantly reduced by exercise (Figure 3(c)). There was no effect of exercise on the expression of IL-1β mRNA (Supplemental Figure 2a) or endogenous IL-1RA mRNA (Figure 3(d)). Similarly, there was no exercise effect on the expression of microtubule-associated protein 2 (a marker for neurons), GFAP (a marker for astrocytes), or allograft inflammatory factor 1 (Iba1 (a marker for microglia and macrophages)) (Supplemental Figure 2 b–d). Furthermore, there was no exercise effect on the expression of signature genes in the macrophages accumulating in the ischemic core (Supplemental Figure 2e). As shown in Figure 3(g), GFAP-positive and AQP4-positive cells were abundant in the peri-infarct tissue (top two rows of Figure 3(g)) and ischemic core (bottom two rows of Figure 3(g)); contrastingly, there was no AQP4 expression in Iba1-positive cells. In the peri-infarct tissue, there was no difference in AQP4, GFAP, and Iba1 expression between the non-exercise and exercise groups. In the corpus callosum, the exercise group showed weaker GFAP and AQP4 expression than the non-exercise group. There was no significant between-group difference in the intensity and distribution of Iba1 expression. This suggests that AQP4 expression was suppressed by exercise in the ischemic core of severely ill rats.
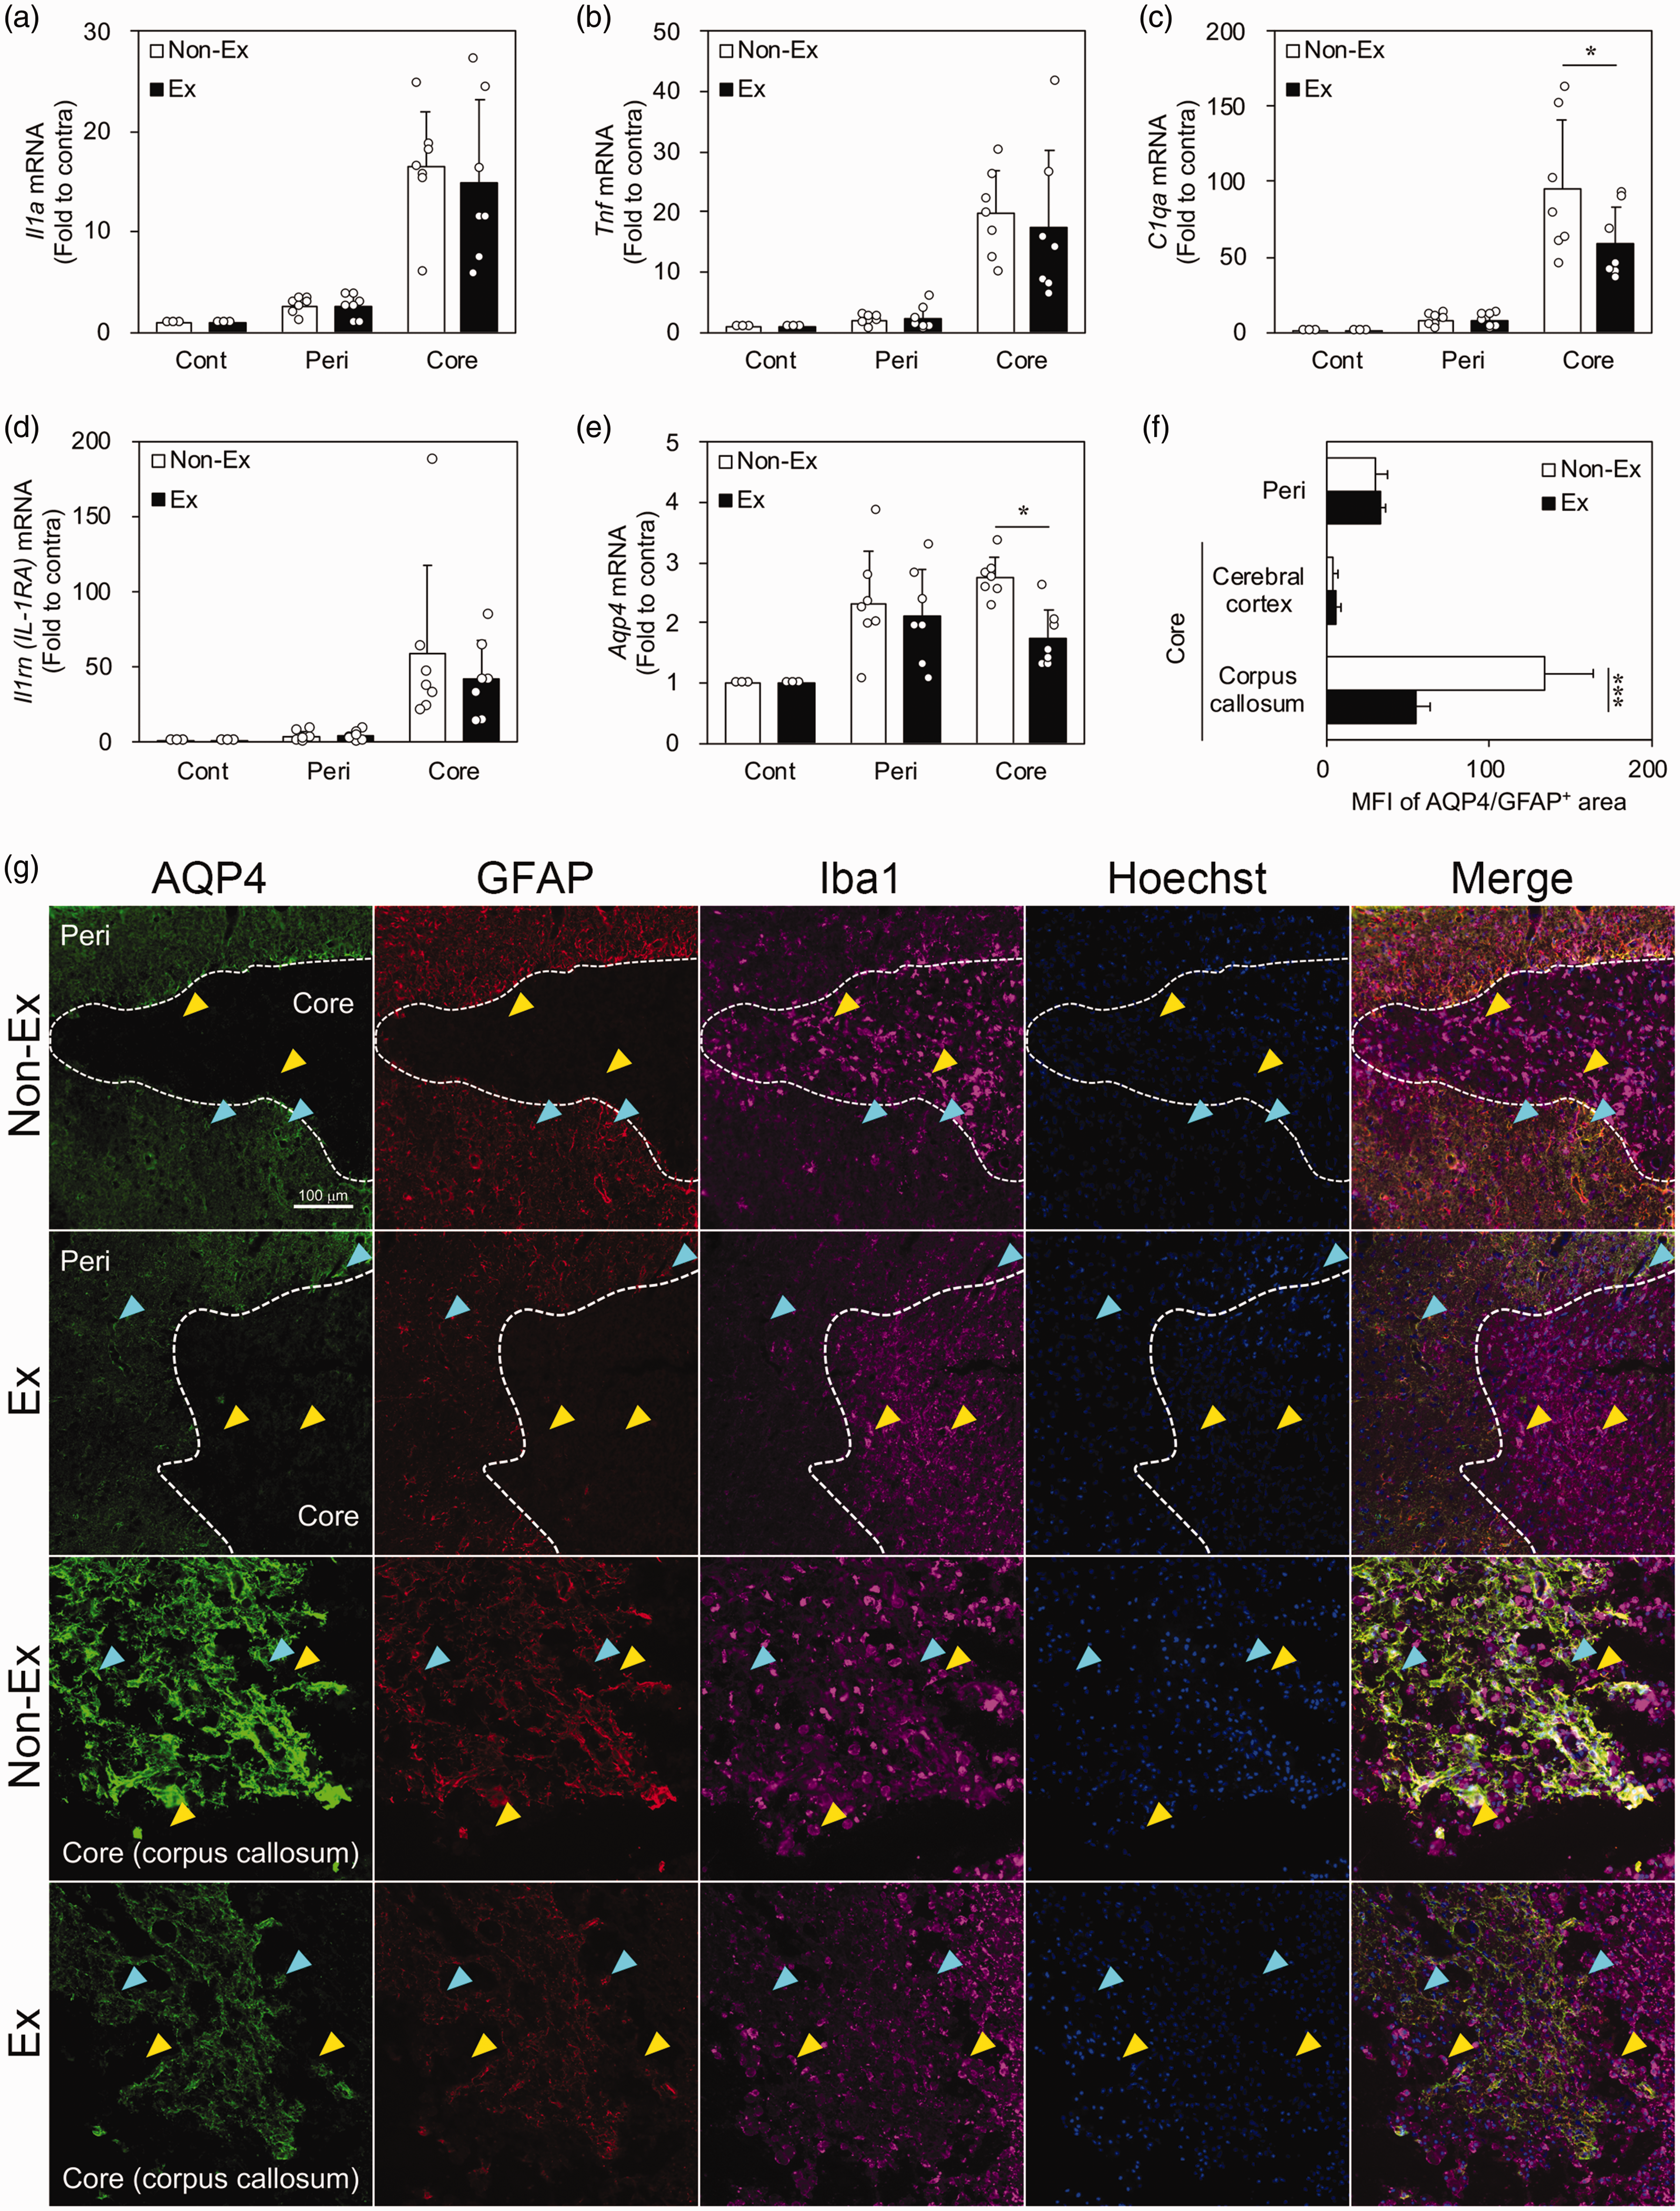
Cytokines and AQP4 expression in the non-exercise and exercise (Ex) groups of severely ill rats. Quantitative real-time polymerase chain reaction analysis of IL-1α (a), TNF (b), C1qa (c), IL-1RA (d), and AQP4 (e) mRNA expression in the ischemic core, peri-infarct tissue (peri), and contralateral cortex (cont) at 7 days post-reperfusion (dpr) following transient middle cerebral artery occlusion (tMCAO) (n = 7). (f and g) Immunofluorescent-stained images of AQP4 (green), GFAP (red), and Iba1 (pink) in the border region between the ischemic core and peri-infarct tissue (top two rows) as well as near the corpus callosum in the ischemic core (bottom two rows) at 7 dpr after tMCAO (g). Hoechst 33258 fluorescence (blue) indicates nuclei. Light blue and yellow arrowheads indicate AQP4+/GFAP+ and AQP4−/Iba1+ cells, respectively. Quantitative analysis of the mean fluorescence intensity (MFI) of AQP4 in GFAP-positive areas in peri, cerebral cortex, and corpus callosum regions in the ischemic core (f) (n = 5). Data are expressed as mean ± standard deviation. * and *** indicate p < 0.05 and 0.001, respectively. AQP4: aquaporin-4; IL: interleukin; TNF: tumor necrosis factor; RA, receptor antagonist; GFAP: glial fibrillary acidic protein; Iba1: ionized calcium-binding adapter protein 1; Ex: exercise.
Effect of IL-1RA on AQP4 expression in primary cultured rat astrocytes
We examined whether IL-1RA affected AQP4 expression in primary cultured rat astrocytes. Astrocytes were cultured with or without recombinant IL-1α for 24 h. Results from the qPCR and western blot analyses respectively revealed that IL-1α increased AQP4 mRNA (Figure 4(a)) and AQP4 protein levels (Figure 4(b) and Supplemental Figure 3). Additionally, when the astrocytes were preincubated with recombinant IL-1RA for 3 h, IL-1α-induced AQP4 expression was inhibited (Figure 4(a) and (b)). Immunofluorescence staining showed that astrocytes cultured with IL-1α were activated with short, thick processes and enlarged somata (Figure 4(d); IL-1α). These morphological changes were suppressed by IL-1RA (Figure 4(d); IL-1α/IL-1RA). Furthermore, the AQP4-positive area relative to the GFAP-positive area was significantly increased by IL-1α administration (Figure 4(c)). In addition, IL-1RA suppressed that effect of IL-1α (Figure 4(c)). These results suggest that IL-1RA may be involved in reducing AQP4 expression in astrocytes.
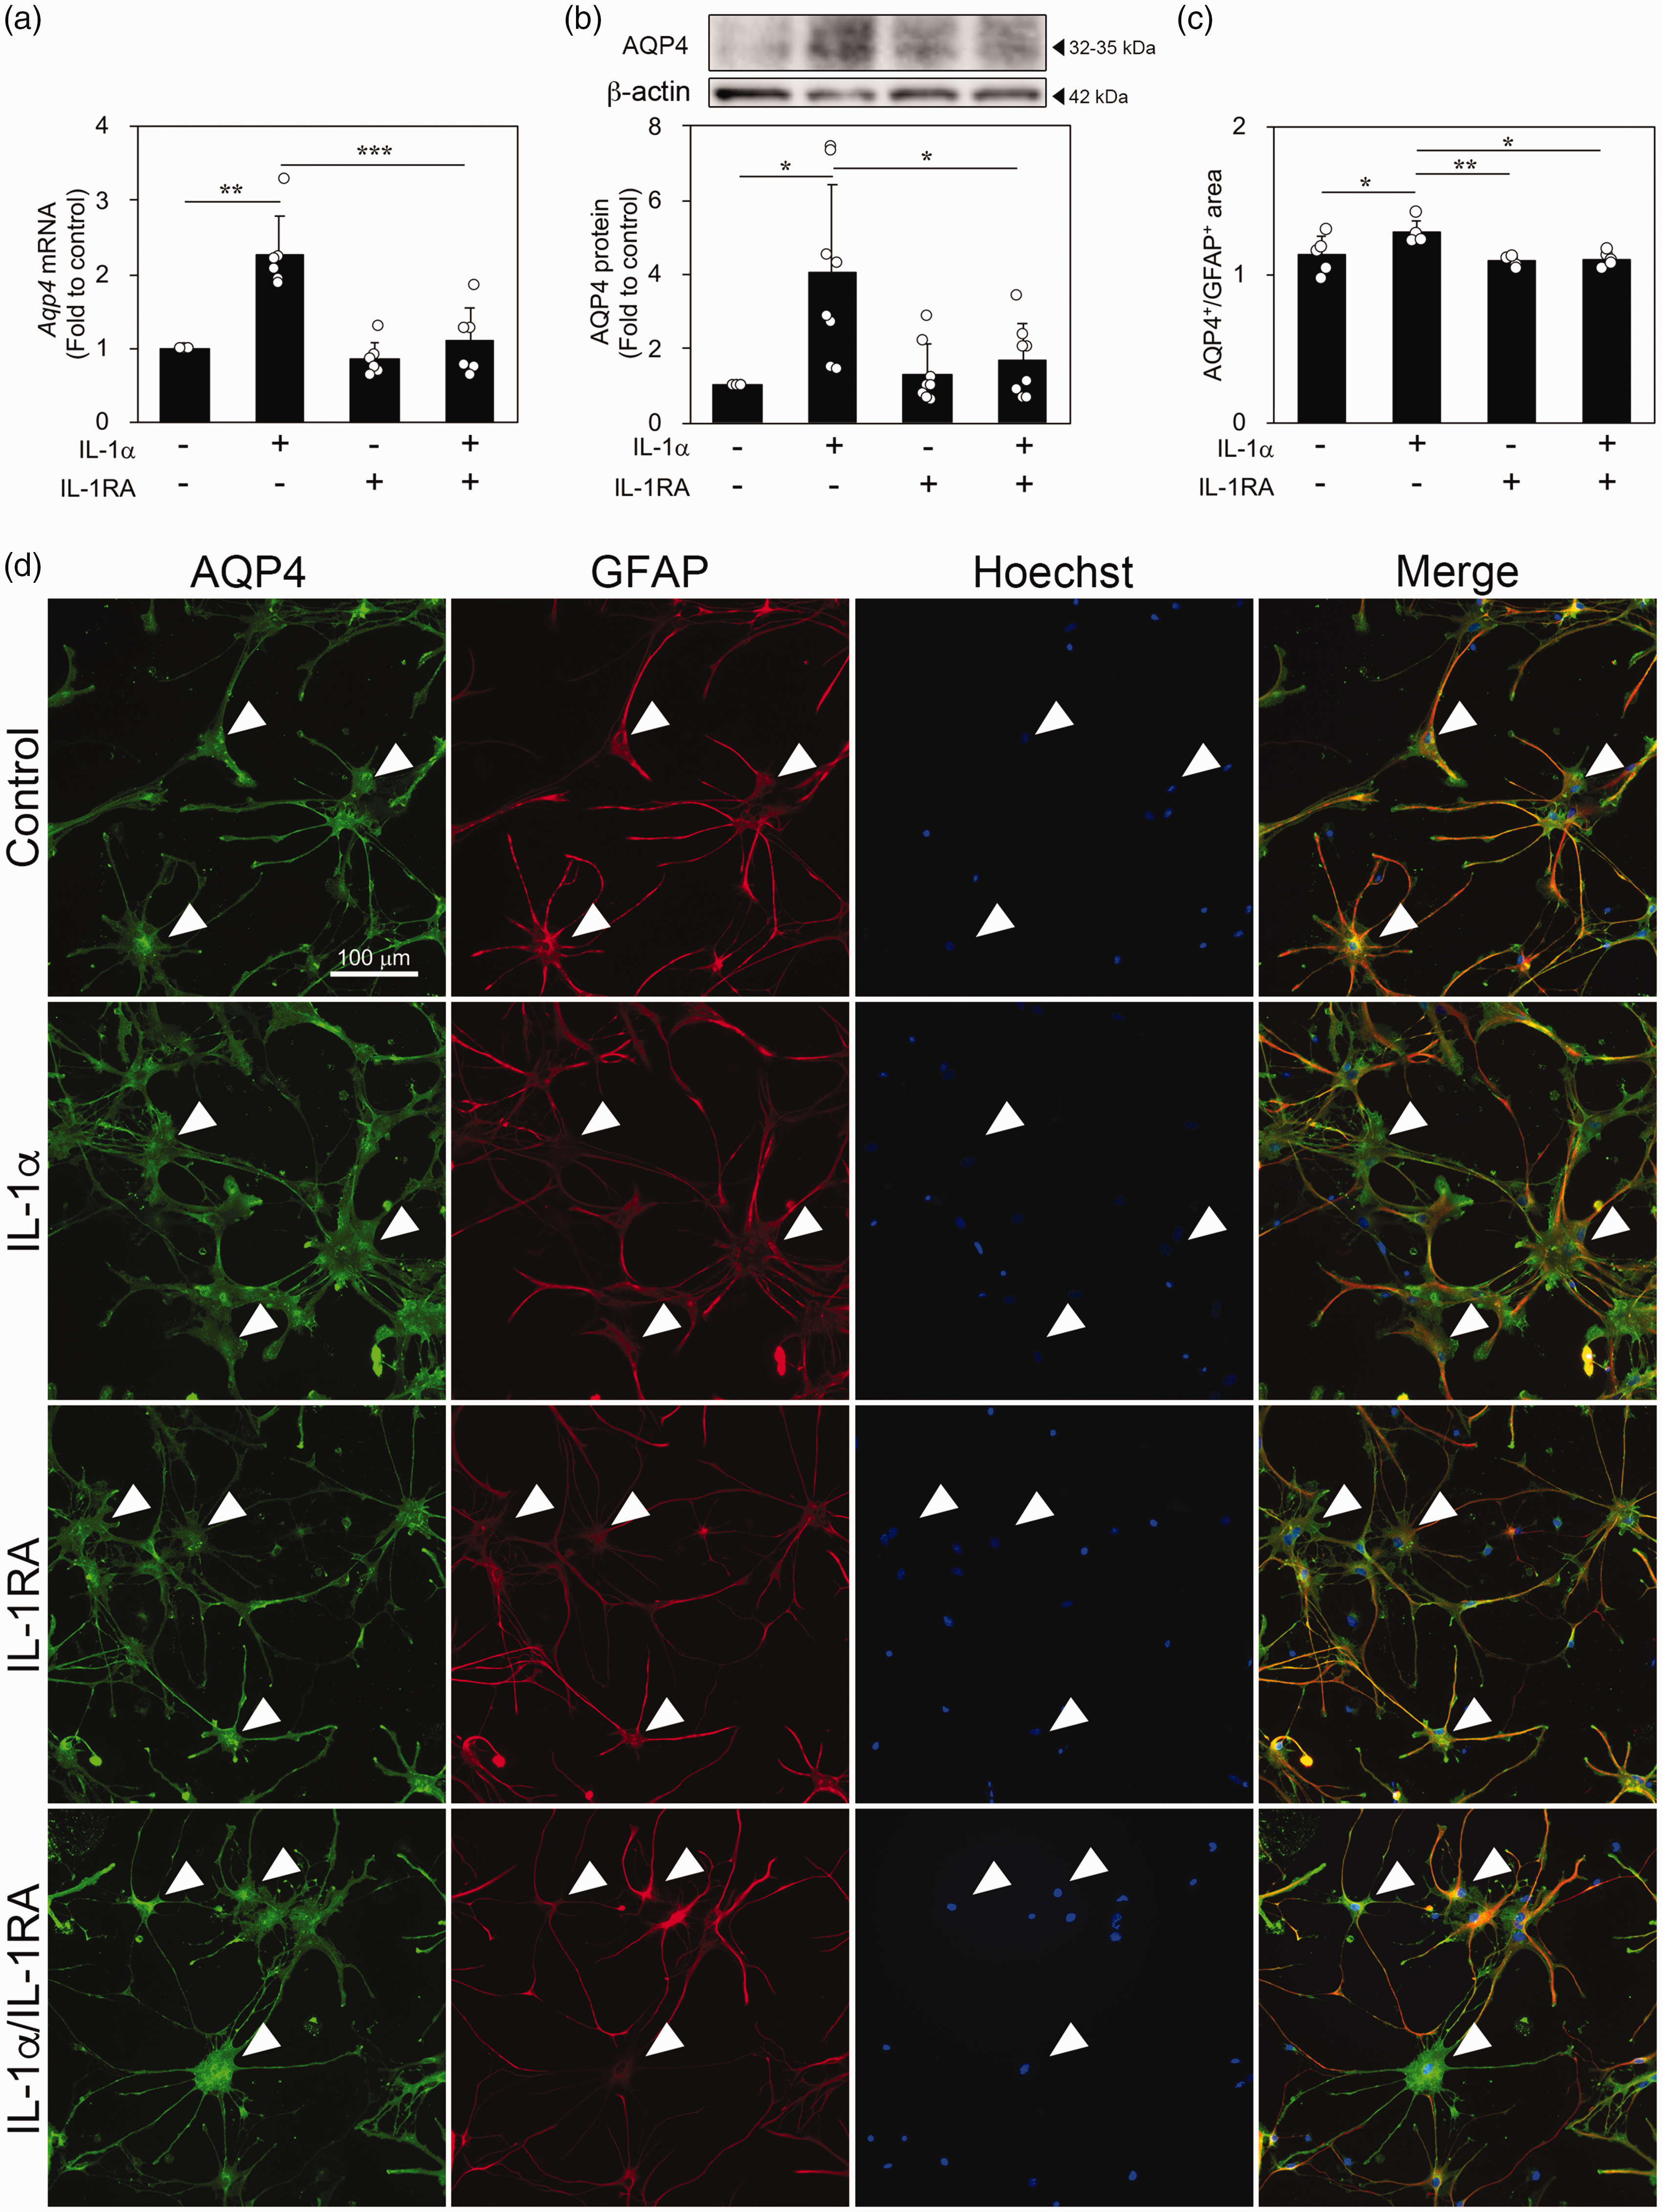
Effects of IL-1α and IL-1RA on AQP4 expression in primary cultured astrocytes. (a) Quantitative real-time polymerase chain reaction analysis of AQP4 mRNA expression in astrocytes treated with IL-1α (3 ng/mL) after treatment with IL-1RA (1 µg/mL) (n = 6). (b) Western blot analysis showing the protein levels of AQP4 in astrocytes treated with IL-1α after IL-1RA treatment (n = 8). (c and d) Images of fluorescence immunostaining of AQP4 (green) and GFAP (red) in astrocytes (d). Hoechst 33258 fluorescence (blue) indicates nuclei. Quantitative analysis of AQP4-positive area in GFAP-positive area in astrocytes treated with IL-1α after IL-1RA treatment (c) (n = 5). Arrowheads indicate AQP4+/GFAP+ cells. Data are expressed as mean ± standard deviation. *, **, and *** indicate p < 0.05, 0.01, and 0.001, respectively. IL: interleukin; RA: receptor antagonist; AQP4: aquaporin-4; GFAP: glial fibrillary acidic protein.
Effect of exercise on IL-1RA and IL-1α levels in blood, gastrocnemius muscle, and brain tissue
Next, we investigated the levels of IL-1RA and IL-1α in the blood of rats at 7 dpr after tMCAO using ELISA. First, we investigated IL-1RA levels in the blood after tMCAO. Compared with the sham group, groups that were subjected to tMCAO had significantly decreased blood IL-1RA levels (Figure 5(a)). Further, we examined the exercise effects on IL-1RA (Figure 5(b)) and IL-1α (Figure 5(c)) levels in the blood of mildly and severely ill rats. Exercise significantly affected IL-1RA levels in severely ill rats; however, the levels did not increase in mildly ill rats (Figure 5(b)). Contrastingly, there was no significant effect on IL-1α levels (Figure 5(c)). To further examine whether this blood IL-1RA is a myokine derived from skeletal muscle, we examined the effect of exercise on IL-1RA expression in the hindlimb gastrocnemius muscle. Rats subjected to tMCAO performed exercise for 6 days, and the gastrocnemius muscles of both the right (stroke-unaffected) and left (stroke-affected) hindlimbs were dissected 3 h after the last exercise. In sham rats, IL-1RA expression did not differ between the right and left hindlimbs or between the exercise and non-exercise groups (Supplemental Figure 4). Compared with the sham group, the expression of IL-1RA mRNA was significantly increased only in the right (stroke-unaffected) hindlimb of mildly ill rats but not in their left (stroke-affected) hindlimb (Figure 5(d)). In severely ill rats, the results were similar to those of sham rats (Figure 5(d)). Exercise significantly increased the IL-1RA mRNA level in the right (stroke-unaffected) hindlimb of severely ill rats; however, it did not increase it in mildly ill rats (Figure 5(e)). Finally, we investigated the levels of IL-1RA and IL-1α in the brain tissue of rats at 7 dpr after tMCAO using ELISA. There was no significant effect of exercise on IL-1RA (Figure 5(f)) and IL-1α (Figure 5(g)) levels in the brain tissue of severely ill rats. These results suggest that IL-1RA expression in muscles was decreased in both the stroke-unaffected and stroke-affected hindlimb muscles of severely ill rats. Treadmill exercise improved IL-1RA expression; specifically, IL-1RA expression increased in the stroke-unaffected hindlimb muscle.
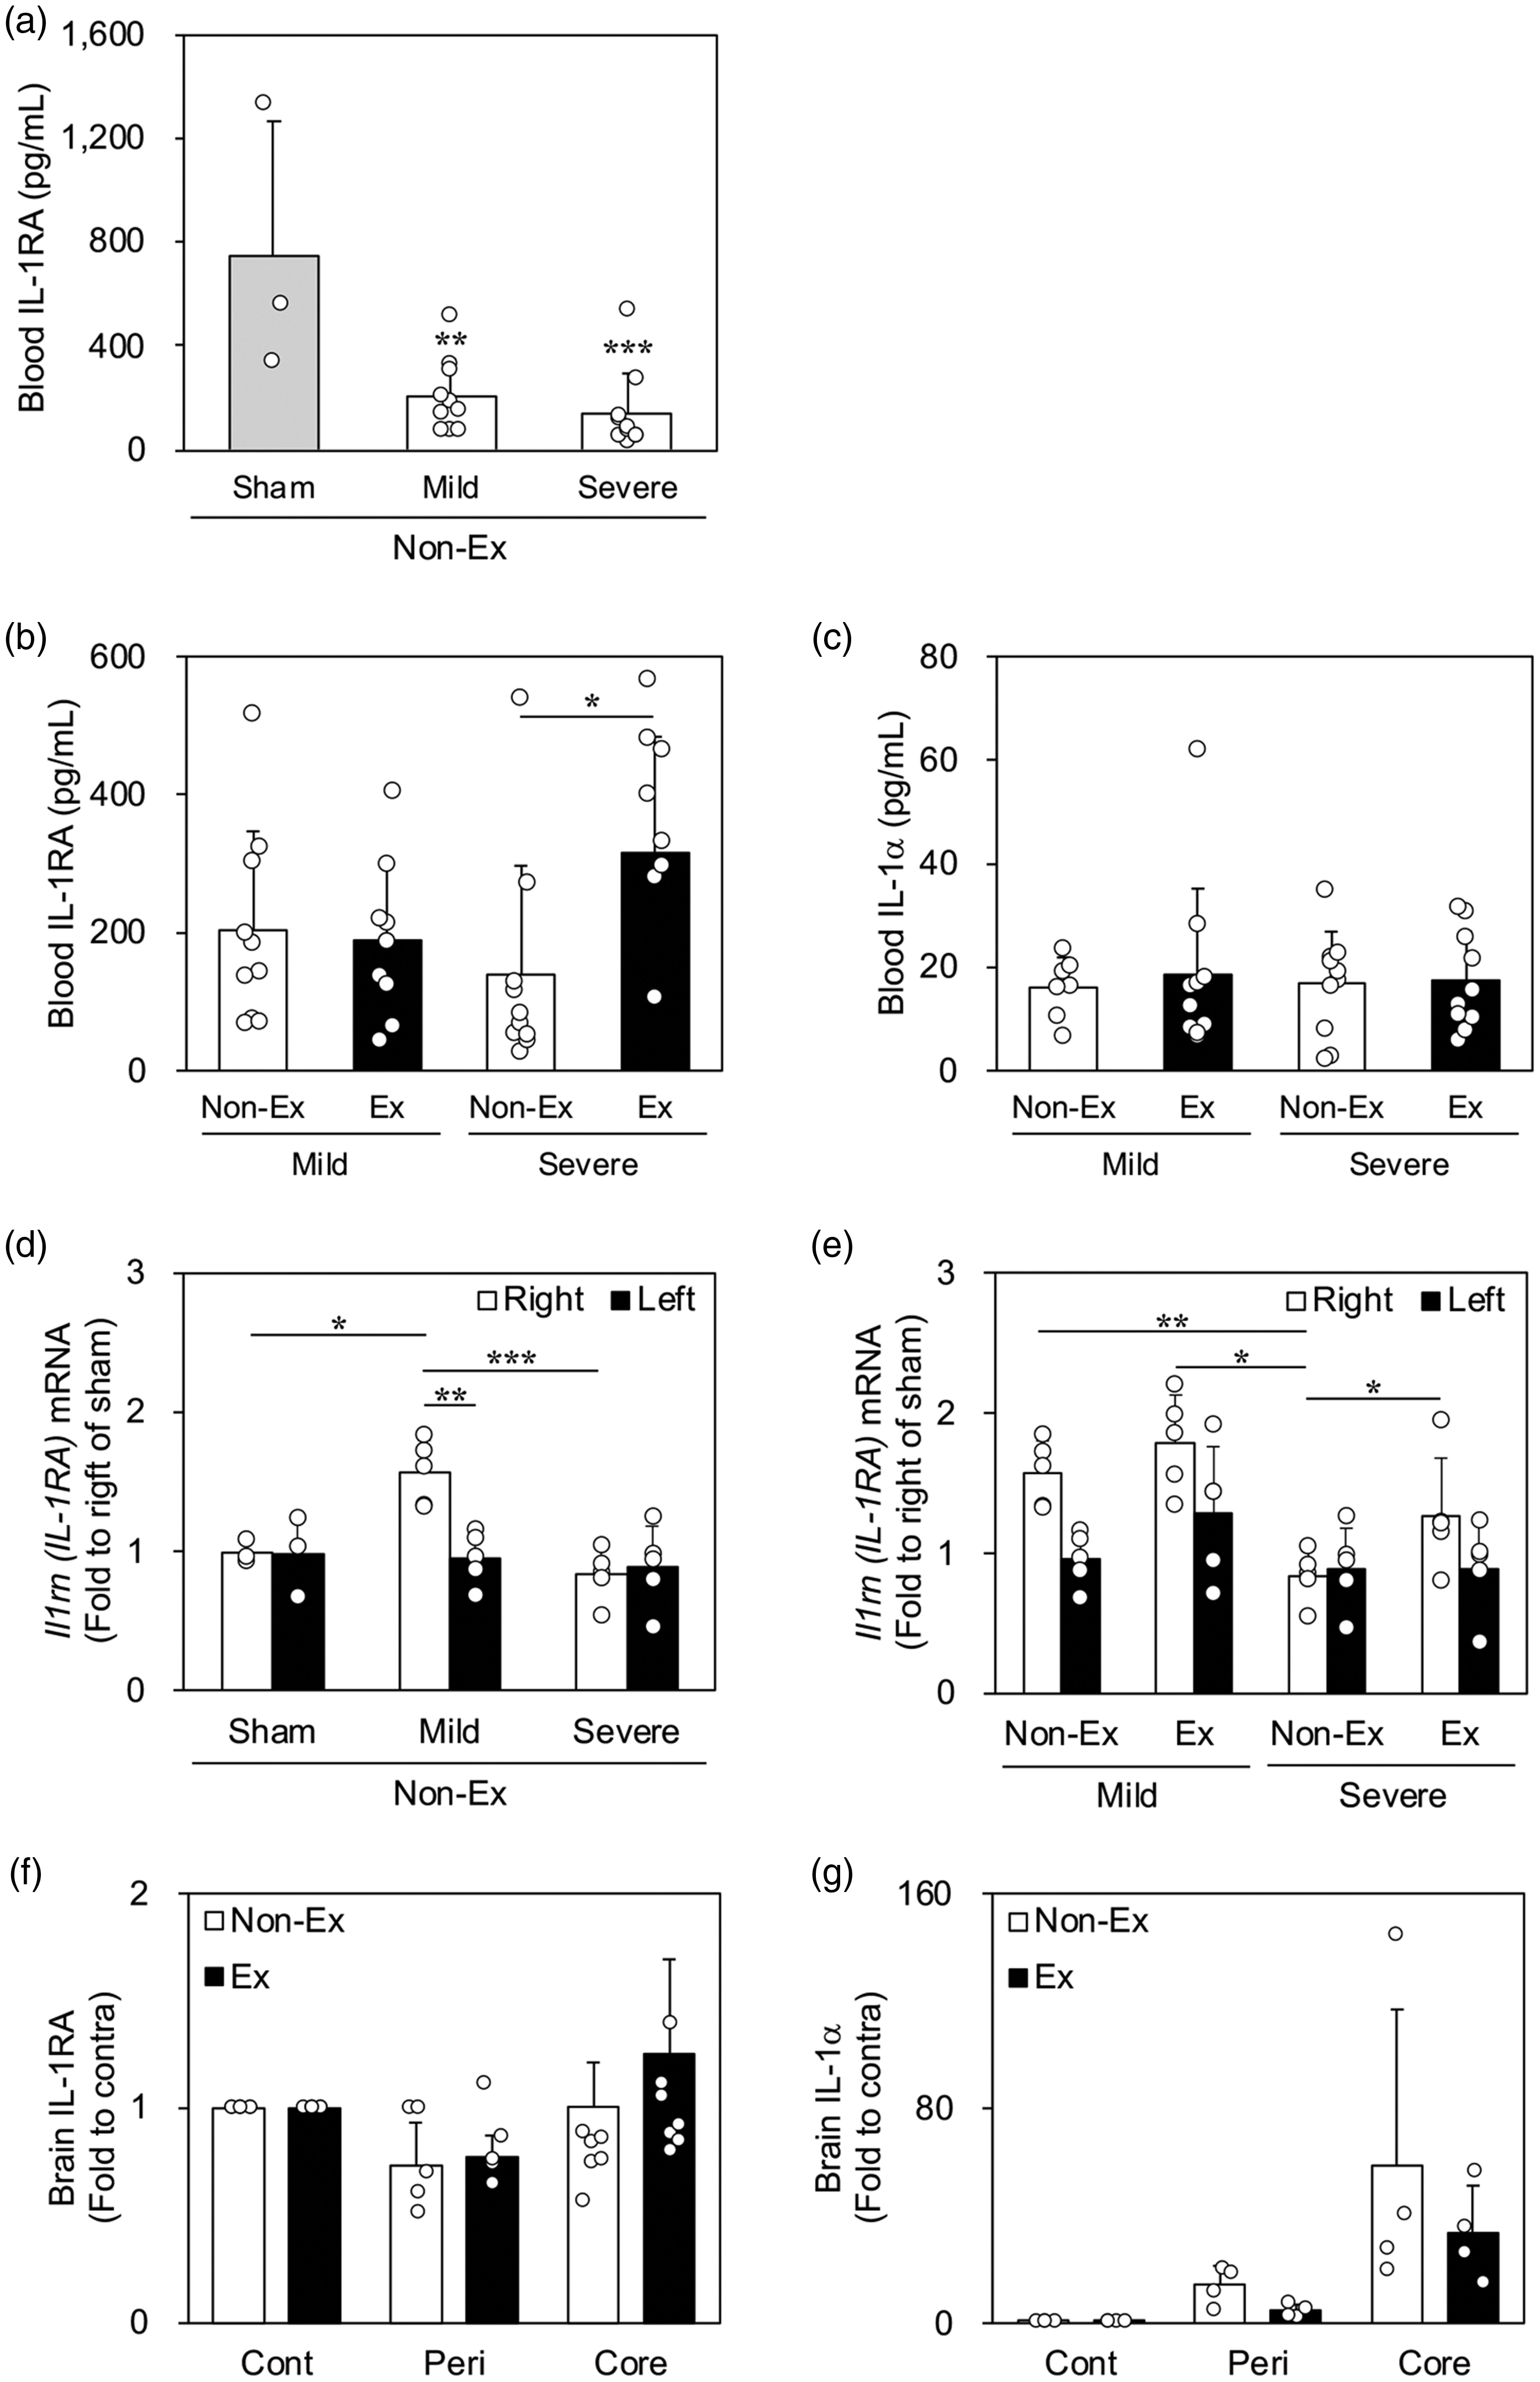
IL-1RA and IL-1α levels in blood, gastrocnemius muscles, and brain tissue after transient middle cerebral artery occlusion (tMCAO). Enzyme-linked immunosorbent assay of IL-1RA (a and b) and IL-1α (c) protein in blood at 7 days post-reperfusion (dpr) after tMCAO (sham, n = 3; mild, n = 7–10; severe, n = 10). (d) Immunofluorescence-stained images of IL-1RA (green) in the gastrocnemius muscles of sham rats. Hoechst 33258 fluorescence (blue) indicates nuclei. (e and f) Quantitative real-time polymerase chain reaction analysis of IL-1RA mRNA expression in the gastrocnemius muscle at 6 dpr after tMCAO (sham, n = 3; mild, n = 5; severe, n = 5). (g and h) Enzyme-linked immunosorbent assay of IL-1RA (g) and IL-1α (h) protein in the brain tissue of severely ill rats at 7 dpr after tMCAO (IL-1RA, n = 7; IL-1α, n = 4). Data are expressed as mean ± standard deviation. a, ** and *** indicate p < 0.01 and 0.001, respectively, as compared with sham. b, e, and f, *, **, and *** indicate p < 0.05, 0.01, and 0.001, respectively. IL-1RA: interleukin-1 receptor antagonist; cont: contralateral cortex; peri: peri-infarct tissue.
Lateral ventricular administration of IL-1RA
To investigate whether IL-1RA suppresses brain edema in a rat model of cerebral infarction, we administered IL-1RA to the left lateral ventricle. To evaluate the administration timing, we examined the spatial and temporal expression of the IL-1α and IL-1RA genes after tMCAO. IL-1α showed a bimodal pattern, with an increase during the hyperacute phase at 6 h, followed by a decrease, and then an increase during the acute phase between 5 and 7 dpr (Supplemental Figure 5a). IL-1RA mRNA expression was upregulated in the infarct region from 1 to 7 dpr (Supplemental Figure 5b). Therefore, as shown in Figure 6(a), IL-1RA was administered before the tMCAO procedure to target the hyperacute phase; moreover, sham rats were subjected to the same procedure except for intracerebroventricular administration and thread insertion. We examined whether IL-1RA treatment affected gene expression in the ischemic core at 6 h after tMCAO (Figure 6(b) to (g)). Compared with the sham group, both IL-1α and TNF mRNA levels were increased in both the ACSF and IL-1RA groups, with no significant between-group difference (Figure 6(b) and (c)). However, only the ACSF group showed significantly increased AQP4 mRNA expression, which was suppressed in the IL-1RA group (Figure 6(g)). Further, we investigated whether this IL-1RA-induced decrease in AQP4 mRNA expression affects brain edema formation. Accordingly, we compared brain edema at 7 dpr after tMCAO to investigate whether IL-1RA inhibited brain edema. As shown in Figure 6(a), IL-1RA-treated tMCAO rats were divided into mild and severe groups using a cut-off value of 15% to group the rats based on the magnitude of weight loss on the day after tMCAO. In severely ill rats, brain edema was suppressed in the IL-1RA group compared with the ACSF group, but this was not true for mildly ill rats (Figure 6(h) and (k)); the wet/dry ratio at 7 dpr after operation in the sham group was 1.00 ± 0.003 (Supplemental Table 3). However, IL-1RA treatment did not significantly affect neurological function or forelimb muscle strength in both mildly and severely ill rats (Figure 6(i), (j), (l) and (m)). Our findings suggest that suppression of AQP4 by IL-1RA treatment attenuated brain edema.
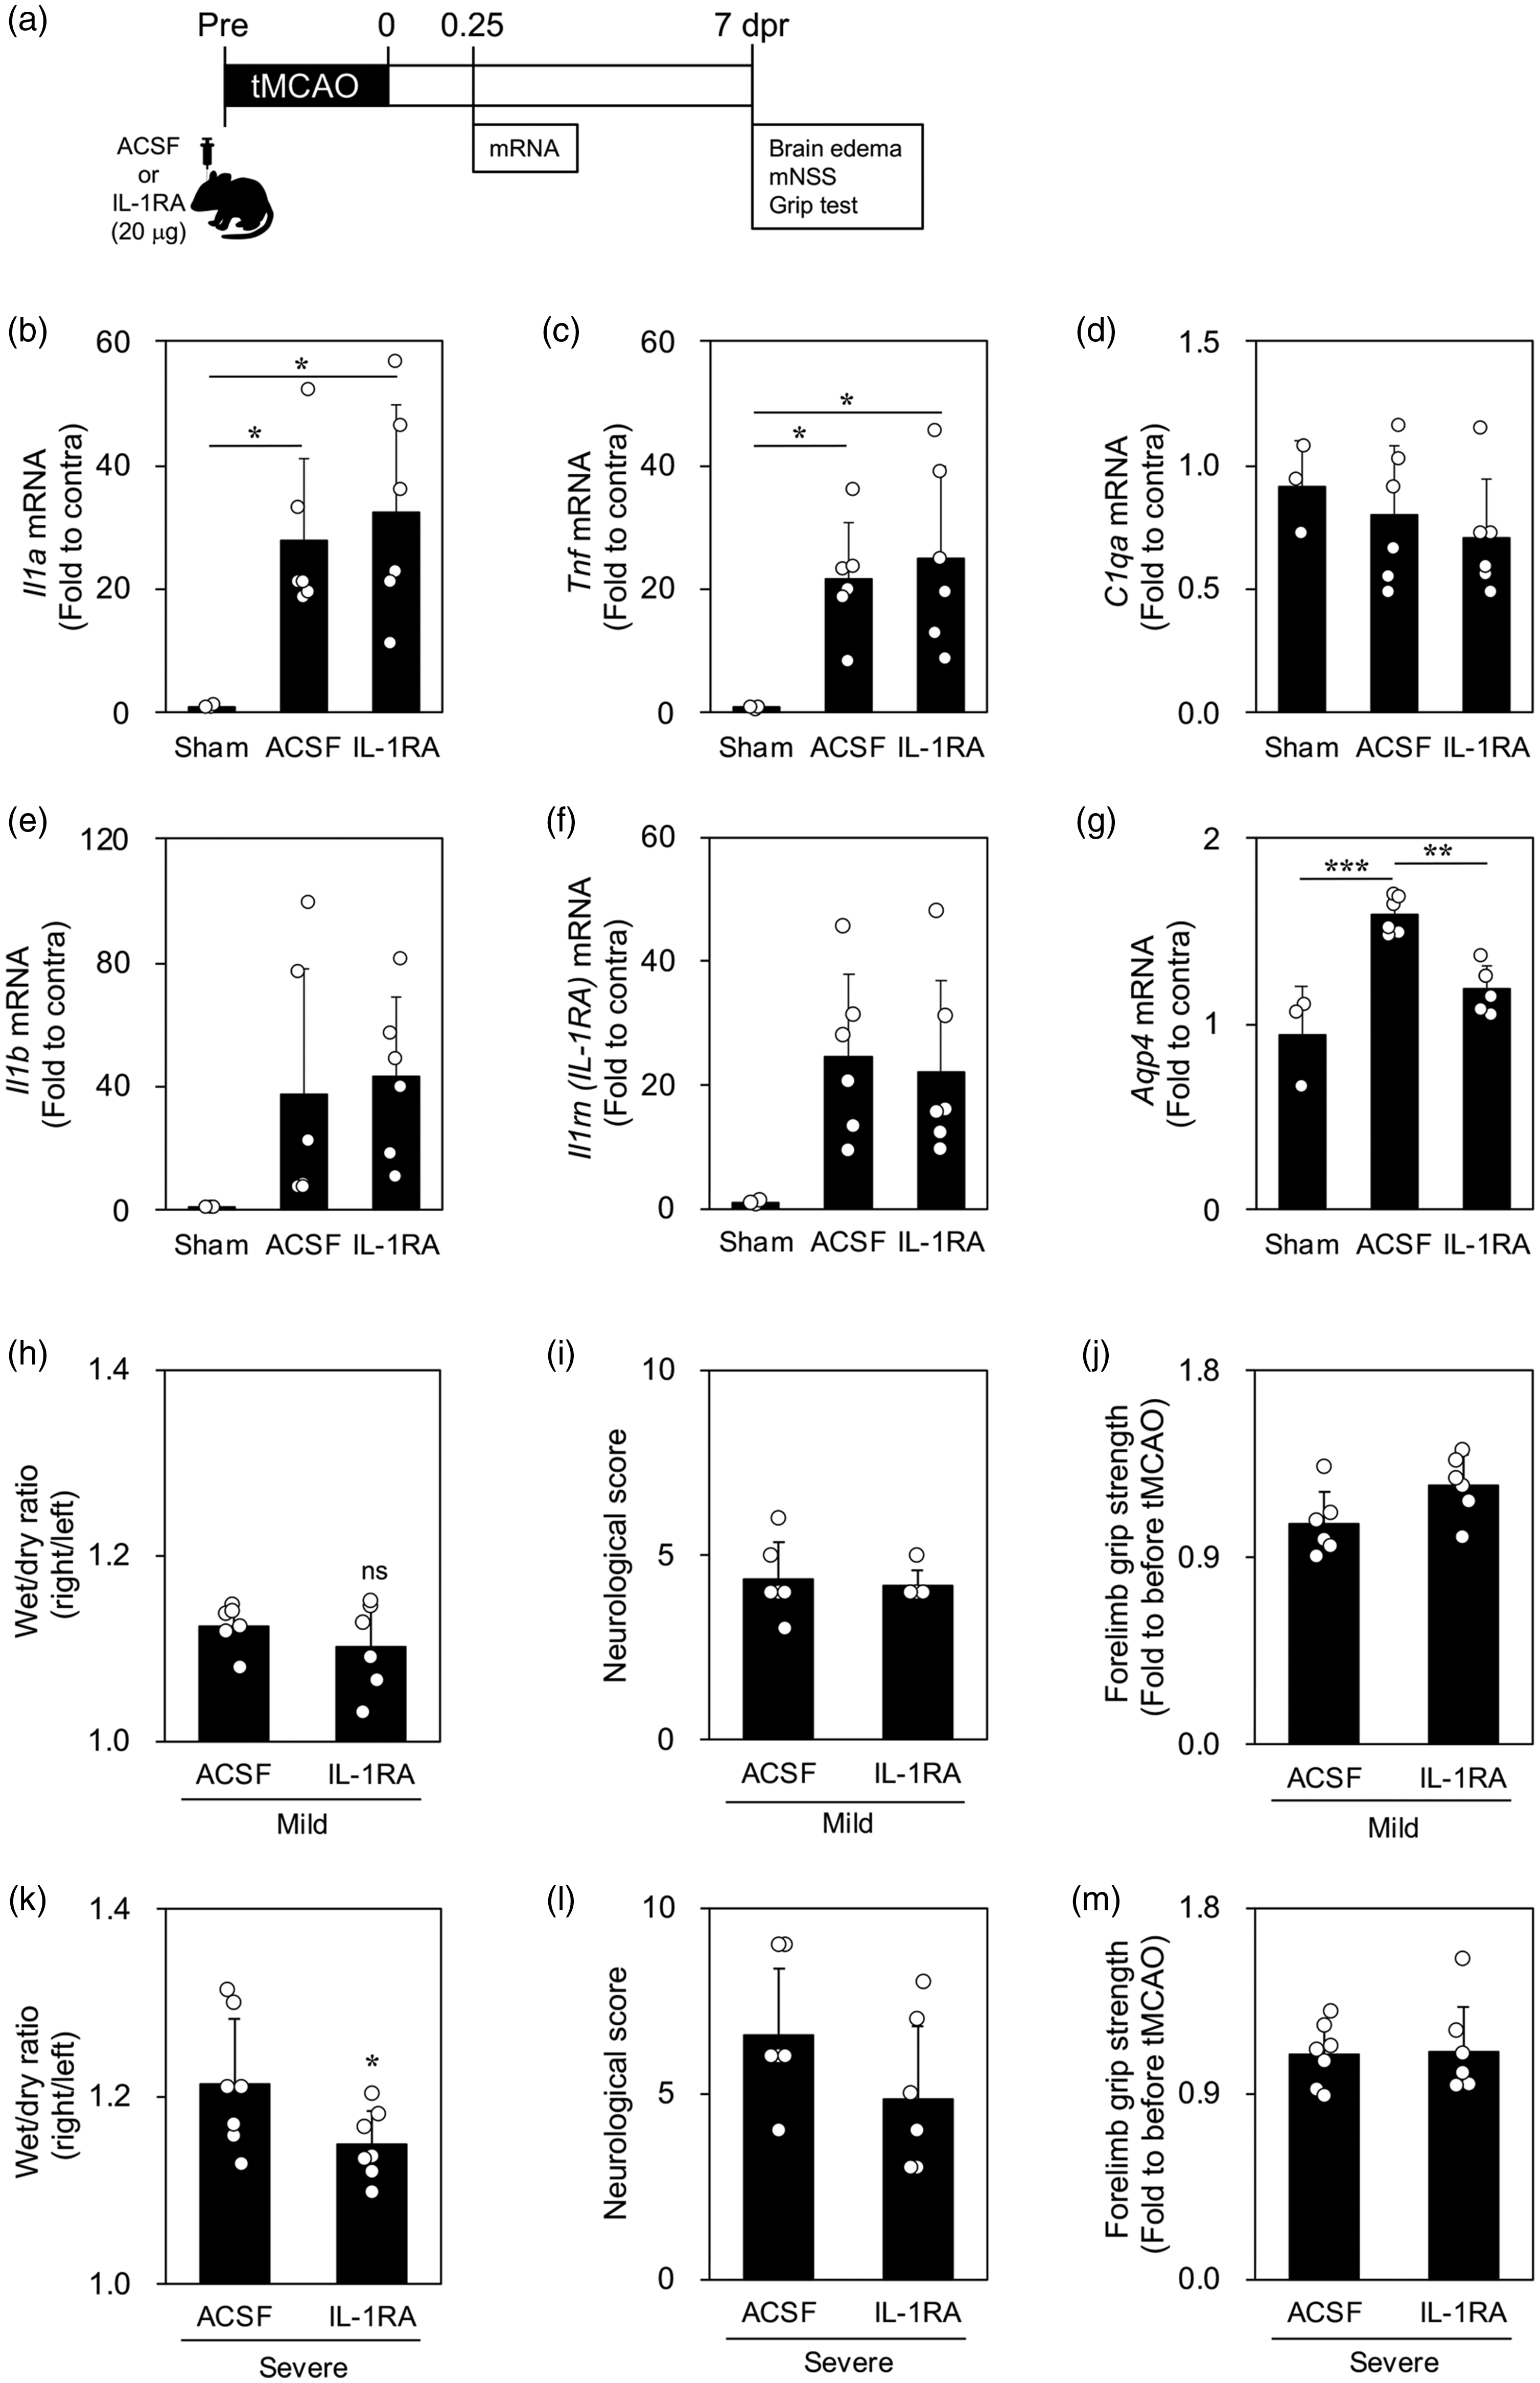
Effects of intracerebroventricular administration of IL-1RA on transient middle cerebral artery occlusion (tMCAO) model rats. (a) Experimental protocol for IL-1RA administration for 7 days after tMCAO. Quantitative real-time polymerase chain reaction analysis of IL-1α (b), TNF (c), C1q (d), IL-1β (e), IL-1RA (f), and AQP4 (g) mRNA expression at 6 h after tMCAO in the sham, artificial cerebrospinal fluid (ACSF), and IL-1RA groups (n = 6). Brain edema (h), neurological score (i), and forelimb muscle strength (j) at 7 days post-reperfusion (dpr) after tMCAO in the artificial cerebrospinal fluid (ACSF) and IL-1RA groups of mildly ill rats (n = 6). Brain edema (k), neurological score (l), and forelimb muscle strength (m) in severely ill rats (n = 7). Data are expressed as mean ± standard deviation. *, **, and *** indicate p < 0.05, 0.01, and 0.001, respectively. IL-1RA: interleukin-1 receptor antagonist; AQP4: aquaporin-4; TNF: tumor necrosis factor; dpr: days post-reperfusion; mNSS: modified Neurologic Severity Score.
IL-1RA_plasmid administration in the hindlimb gastrocnemius muscle
Finally, we forced expression of IL-1RA-EGFP in the gastrocnemius muscle of the right hindlimb to assess whether IL-1RA produced in the gastrocnemius infiltrates the brain parenchyma. IL-1RA mRNA was clearly elevated in HEK-293T cells transfected with the IL-1RA_plasmid-containing gene encoding rat Il1rn, but not in control_plasmid non-containing rat Il1rn (Supplemental Figure 6). The expression level of IL-1RA mRNA in the gastrocnemius muscle of the IL-1RA_plasmid group was significantly increased over those in the sham and control_plasmid groups after 2 days of plasmid injection (Figure 7(a)). Furthermore, IL-1RA+/EGAP+ cells were observed in the gastrocnemius muscle of the IL-1RA_plasmid group but not in that of the sham group (Figure 7(c)). However, there was no difference in the expression levels of IL-1RA mRNA in the brain (Figure 7(b)). Figure 7(d) shows the presence of EGFP+/IL-1RA+/GFAP+ cells in the ischemic core the day after tMCAO. These data revealed that IL-1RA-EGFP produced in the gastrocnemius muscle infiltrates the brain parenchyma.
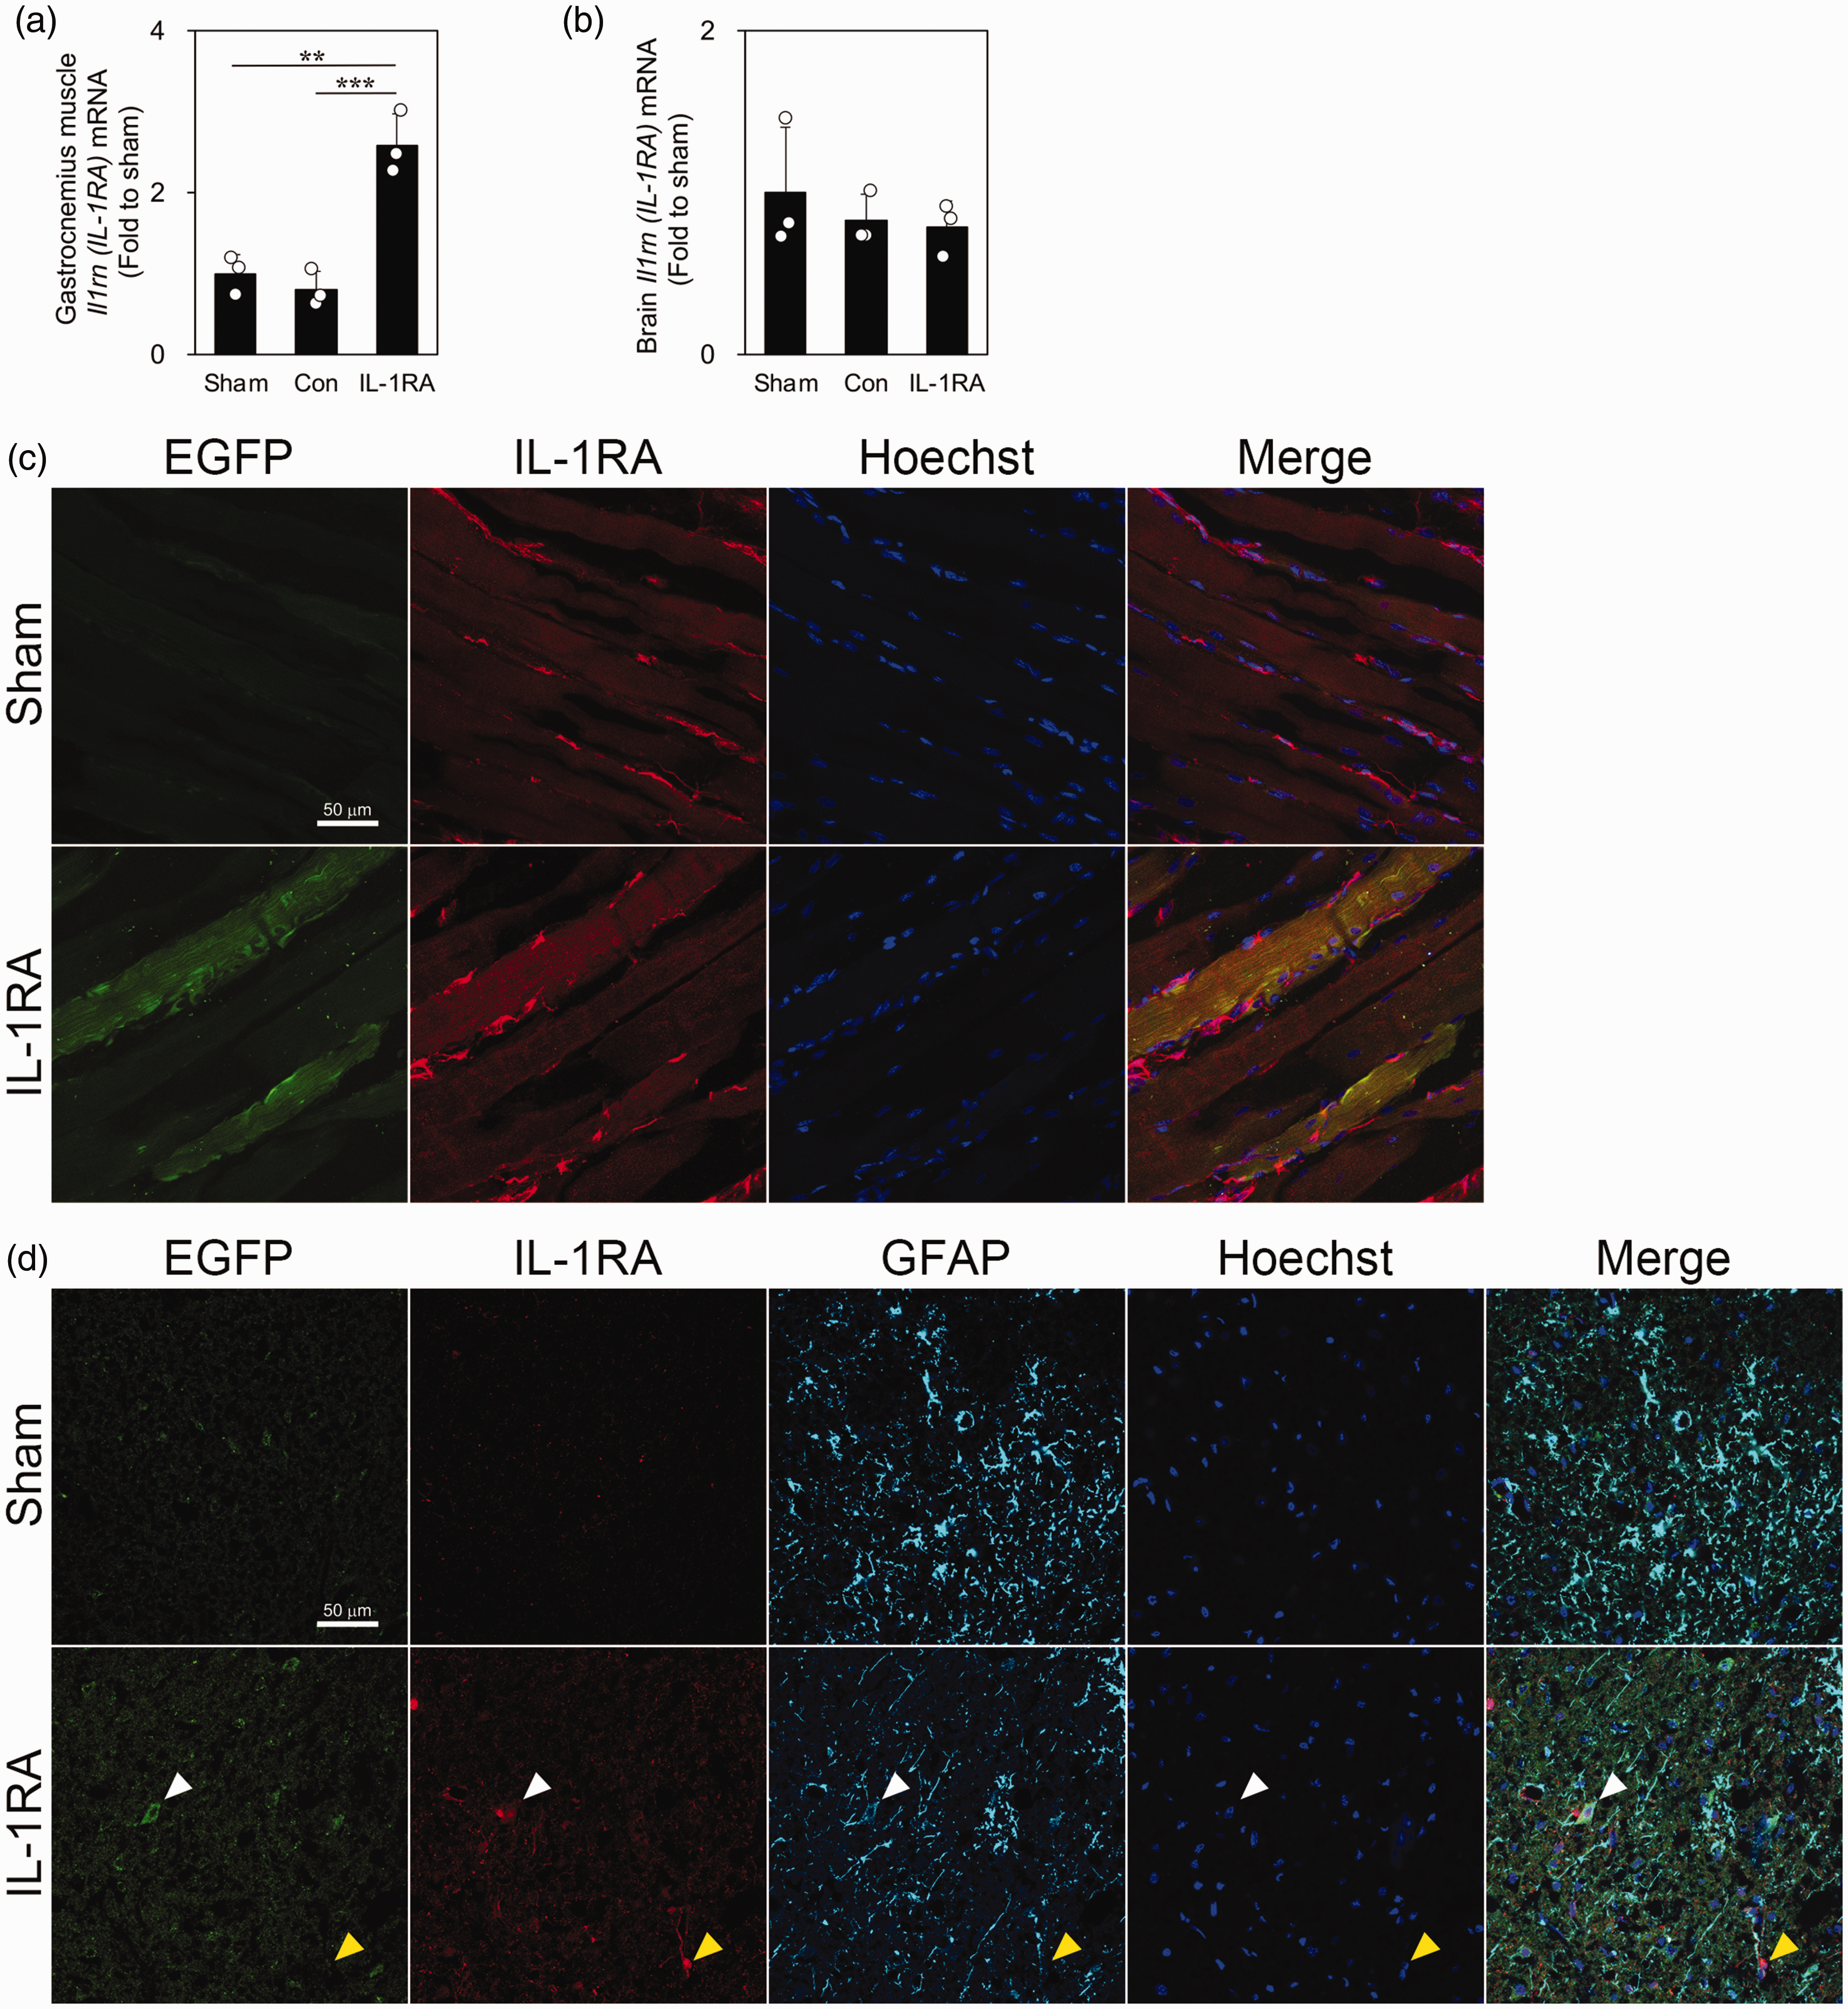
Presence of IL-RA-EGFP expression in the infarcted brain of rats transfected with IL-1RA_plasmid in the gastrocnemius muscle. Quantitative real-time polymerase chain reaction analysis of IL-1RA mRNA expression in the gastrocnemius muscle (a) and brain (b) of the sham, control_plasmid, and IL-1RA_plasmid groups 2 days after plasmid injection (n = 3). Data are expressed as mean ± standard deviation. ** and *** indicate p < 0.01 and 0.001, respectively. (c) Images of fluorescence immunostaining of EGFP (green) and IL-1RA (red) in the gastrocnemius muscle of the sham and IL-1RA_plasmid groups 2 days after plasmid injection. Hoechst 33258 fluorescence (blue) indicates nuclei. (d) Images of fluorescence immunostaining of EGFP (green), IL-1RA (red), and GFAP (purple) in the ischemic core of the sham and IL-1RA_plasmid groups the day after transient middle cerebral artery occlusion. Hoechst 33258 fluorescence (blue) indicates nuclei. White and yellow arrowheads indicate EGFP+/IL-1RA+/GFAP+ and EGFP−/IL-1RA+/GFAP− cells, respectively.
Discussion
We hypothesized that exercise-induced reduction of cerebral edema and improvement of motor and neurological functions after cerebral infarction may be mediated by myokines. Accordingly, we investigated the effect of exercise on the reduction of cerebral edema and the involvement of myokines using the tMCAO model in rats and primary cultured astrocytes of rats.
In the present study, mildly and severely ill rats had good and poor prognoses, respectively, at an early stage; moreover, we examined the effects of exercise for each group. We had previously observed a correlation of the magnitude of weight loss at 7 dpr after tMCAO with brain edema and neurological function. 14 We focused on the magnitude of weight loss on the day after tMCAO to determine whether it reflected the prognosis. The magnitude of weight loss on the day after tMCAO demonstrated a correlation with brain edema, neurological function, and forelimb muscle strength at 7 dpr after tMCAO (Figure 1(a) to (c)). This indicated that the magnitude of weight loss on the day after tMCAO could be used as a prognosis indicator. As shown in Figure 2(b) to (d), there were significant differences in brain edema, neurological function, and motor function between severely and mildly ill rats in the non-exercise group. Similarly, blood cell analysis revealed that severely ill rats in the non-exercise group had abnormal red blood cell composition and were dehydrated. This suggests that the magnitude of weight loss on the day after tMCAO can be used as an indicator of the severity of the disease.
Cerebral edema causes neurological deterioration and has a poor prognosis. 24 Several studies have demonstrated that intense treadmill exercise improves infarct volume, neurological function, and motor function in rat models of cerebral infarction.25,26 However, we observed that even mild treadmill exercise reduced cerebral edema and improved neurological and motor functions in severely ill rats (Figure 2(b) to (d)). Li et al. reported that intense exercise (30 m/min, 30 min) did not procure further benefits when compared with its milder counterpart (5–12 m/min, 30 min); thus, mild exercise may be adequate to elicit rehabilitative benefits post stroke. 27 Furthermore, mild exercise (2–8 m/min, 30 min) has been found to be more effective than intense exercise (8–22 m/min, 30 min) in improving post-stroke memory impairment. 28 However, we found no significant effect for exercise in mildly ill rats, which suggests that the exercise intensity may have been insufficient for mildly ill rats. Thus, we should have considered the amount of activity in the cages of mildly and severely ill rats.
Compared with severely ill rats in the non-exercise group, those in the exercise group showed decreased AQP4 expression in the ischemic core. AQP4 has been implicated in the pathogenesis of brain edema associated with various brain injuries and diseases and plays a complex bimodal role in the pathology of ischemic stroke. 29 Manley et al. first reported that the absence of AQP4 prevented the formation of edema and improved neurological outcomes in a permanent ischemia model in AQP4-deficient mice. 17 Subsequently, a number of studies have reported similar results.30–34 However, several studies have reported an opposite role of AQP4 in the pathology of ischemic stroke. AQP4 knockout resulted in astrocyte hypertrophy and aggravated brain injury with enlarged infarct size and serious loss of CA1 neurons. 35 Moreover, AQP4 knockout resulted in more severe neutrophil infiltration, microglial activation, and neuronal loss but less astrocyte proliferation in the brain after tMCAO compared with wild-type mice. 36 The effects of AQP4 on the pathophysiological process of ischemic stroke are very complex; thus, it is necessary to establish a treatment regimen that considers the type of brain edema and its timing.
We had previously found that IL-1α and TNF produced by activated microglia in the peri-infarct tissue and ischemic core are strongly involved in astrocytic AQP4 expression. 14 However, here, we observed no significant between-group difference in IL-1α or TNF mRNA expression in severely ill rats (Figure 3(a) and (b)). Therefore, we considered that these effects might have been due to the action mediated by IL-1RA, a type of myokine.10,11 IL-1RA is an intrinsic antagonist that binds to the IL-1 receptor and competitively inhibits IL-1α and IL-1β.37,38 Blood IL-1RA levels at 7 dpr after tMCAO were significantly higher in the exercise group than in the non-exercise group of severely ill rats (Figure 5(b)). Therefore, exercise may inhibit the decrease in blood IL-1RA levels after stroke.
Sen et al. reported increased IL-1RA expression in the gastrocnemius muscle of rats undergoing mechanical rehabilitation therapy after cerebral infarction, which is consistent with our findings. 13 Sham rats had similar levels of IL-1RA mRNA expression in the gastrocnemius muscle with the severely ill rats (Figure 5(e)), but blood IL-1RA levels were clearly higher than those in the severely ill rats (Figure 5(a)). We found that treadmill exercise induced IL-1RA release from the stroke-unaffected hindlimb muscle. These findings suggest that exercise after stroke should be performed not only on the affected but also on the unaffected side in patients. After cerebral infarction, blood IL-1RA leaked into the infarcted region through the disrupted blood–brain barrier, 39 which is consistent with our findings. IL-1RA-EGFP produced in the gastrocnemius muscle was found within astrocytes in the ischemic core the day after tMCAO (Figure 7(d)). However, we observed no significant increase in brain IL-1RA levels in the exercise group (Figure 5(f)). These findings are consistent with those of a previous report of increased levels in the blood, but not the brain, following irisin administration after cerebral infarction. 9 The rate of IL-1RA consumption and degradation in the brain tissue may be greater than in muscle. Additionally, we found that IL-1RA suppressed IL-1α-induced AQP4 expression in cultured astrocytes (Figure 4). Therefore, blood-derived IL-1RA may have inhibited astrocytic AQP4 expression in the ischemic core.
We hypothesized that IL-1RA, which inhibits AQP4 expression, might have therapeutic value in the treatment of brain edema. We examined changes in the expression of IL-1RA and related genes after tMCAO to determine the optimal timing of IL-1RA administration. The IL-1α mRNA expression level showed a bimodal pattern, with an increase during the hyperacute phase at 6 h, followed by a decrease and then an increase during the acute phase between 5 and 7 dpr (Supplemental Figure 5a). As shown in Figure 6(a), we targeted IL-1RA administration to the hyperacute phase of cytotoxic edema. IL-1RA treatment reduced brain edema at 7 dpr after tMCAO in the severe group (Figure 6(k)). This is consistent with the results of treadmill exercise in a rat model of cerebral infarction (Figure 2(b)). IL-RA administration to the lateral and third ventricles twice before and after tMCAO has also been reported to reduce the infarct volume.40,41 Moreover, Xia et al. reported a reduction in the infarct area and neurological deficits after intravenous IL-1RA administration at 3–12 h after cerebral ischemia. 42
We attempted to administer IL-1RA at 3 dpr after tMCAO to target the acute phase when angiogenic edema occurs. However, given the effects of cerebral edema, we could not accurately administer the drug into the left lateral ventricle; thus, no useful data could be obtained. Nevertheless, we demonstrated that IL-1RA inhibited cytotoxic edema. Inhibition of IL-1α and IL-1β signaling, which is increased during the hyperacute phase, may improve the prognosis of cerebral infarction. This is consistent with our results, where the magnitude of weight loss on the day after tMCAO was correlated with brain edema and neurological function at 7 dpr (Figure 1(a) to (c)). Prognosis may be established in the hyperacute post-stroke phase. The IL-1 receptor-mediated signaling system may be involved in prognostic determinants. Regrettably, we could not administer multiple doses of IL-1RA or perform non-invasive intravenous administration owing to cost considerations.
In this study, treadmill exercise performed in the early phase of stroke onset alleviated the decrease in blood IL-1RA following ischemic stroke. Furthermore, we demonstrated that IL-1RA administration decreased astrocytic AQP4 expression in the ischemic core, resulting in the suppression of brain edema.
Supplemental Material
sj-pdf-1-jcb-10.1177_0271678X231151569 - Supplemental material for Molecular mechanism of cerebral edema improvement via IL-1RA released from the stroke-unaffected hindlimb by treadmill exercise after cerebral infarction in rats
Supplemental material, sj-pdf-1-jcb-10.1177_0271678X231151569 for Molecular mechanism of cerebral edema improvement via IL-1RA released from the stroke-unaffected hindlimb by treadmill exercise after cerebral infarction in rats by Rina Gono, Kana Sugimoto, Chihpin Yang, Yukie Murata, Reiko Nomura, Mai Shirazaki, Kazuo Harada, Teiji Harada, Yohei Miyashita, Kazuma Higashisaka, Ryuichi Katada and Hiroshi Matsumoto in Journal of Cerebral Blood Flow & Metabolism
Footnotes
Funding
The author(s) disclosed receipt of the following financial support for the research, authorship, and/or publication of this article: This work was supported in part by Japan Society for the Promotion of Science [grant numbers: 18H04078, 19K09456, and 22K09256].
Acknowledgements
We are grateful to the Nikon Imaging Center at Osaka University for being very helpful with confocal microscopy and image acquisition and to Prof. Hidekazu Tanaka, College of Life Sciences, Ritsumeikan University, for kindly gifting the HEK-293T cells. We would like to thank Editage (![]() ) for English language editing.
) for English language editing.
Declaration of conflicting interests
The author(s) declared no potential conflicts of interest with respect to the research, authorship, and/or publication of this article.
Authors’ contributions
RG induced the animal model and undertook all experiments. KS designed the project, obtained funding, and was a major contributor in writing the manuscript. YMu and CY performed work on qPCR and ELISA. RN performed work on qPCR. MS and TH provided technical support. KHa performed statistical analyses and wrote the manuscript. YMi, KHi, and RK performed formal analyses. HM obtained funding, reviewed the manuscript, and made critical revisions related to its content. All authors read and approved the final manuscript.
Availability of data and material
The data and materials supporting the results in this article are available from the corresponding author on reasonable request.
Supplementary material
Supplementary materialSupplemental material for this article is available online.
References
Supplementary Material
Please find the following supplemental material available below.
For Open Access articles published under a Creative Commons License, all supplemental material carries the same license as the article it is associated with.
For non-Open Access articles published, all supplemental material carries a non-exclusive license, and permission requests for re-use of supplemental material or any part of supplemental material shall be sent directly to the copyright owner as specified in the copyright notice associated with the article.