
Abstract
The present study assessed the isolated and synergetic effects of hypoxic exposure and prolonged exercise on cerebral volume and subedema and symptoms of acute mountain sickness (AMS). Twelve healthy males performed three semirandomized blinded 11- hour sessions with (1) an inspiratory oxygen fraction (FiO2) of 12% and 4-hour cycling, (2) FiO2 = 21% and 4-hour cycling, and (3) FiO2 = 8.5% to 12% at rest (matching arterial oxygen saturation measured during the first hypoxic session). Volumetric, apparent diffusion coefficient (ADC), and arterial spin labelling 3T magnetic resonance imaging sequences were performed after 30 minutes and 10 hours in each session. Thirty minutes of hypoxia at rest induced a significant increase in white-matter volume (+0.8 ± 1.0% compared with normoxia) that was exacerbated after 10 hours of hypoxia at rest (+1.5 ± 1.1%) or with cycling (+1.6 ± 1.1%). Total brain parenchyma volume increased significantly after 10 hours of hypoxia with cycling only (+1.3 ± 1.1%). Apparent diffusion coefficient was significantly reduced after 10 hours of hypoxia at rest or with cycling. No significant change in cerebral blood flow was observed. These results demonstrate changes in white-matter volume as early as after 30 minutes of hypoxia that worsen after 10 hours, probably due to cytotoxic edema. Exercise accentuates the effect of hypoxia by increasing total brain volume. These changes do not however correlate with AMS symptoms.
INTRODUCTION
Rapid ascent to high altitude (>2,500 m) is commonly associated with acute mountain sickness (AMS), a syndrome of nonspecific symptoms (headache, nausea, dizziness, fatigue, etc) encountered after several hours of hypoxic exposure. In similar conditions but less frequently, high altitude cerebral edema can occur and is defined as the onset of ataxia, altered consciousness or both in someone with AMS, that can result, without appropriate treatment, in death subsequent to brain herniation. 1 The precise mechanisms underlying AMS and in particular its cerebral component possibly leading to high altitude cerebral edema remain to be fully understood. 2
Changes in brain volume and cerebral edema have been reported during hypoxic exposure based on magnetic resonance imaging (MRI). Two MRI studies provided evidence for brain swelling in the white matter after 6 to 16 hours of passive exposure to normobaric hypoxia (inspiratory O2 fraction, FiO2 = 0.12).3,4 Changes in apparent diffusion coefficient (ADC, characterizing the selfdiffusion of water in tissue) of the gray matter 5 and an increase in the total brain parenchyma volume 6 have also been reported within minutes (<40 minutes) of hypoxia. The kinetics of cerebral volume changes and their relationships with alteration in ADC and cerebral blood flow (CBF) in hypoxia remain to be clarified.2,7 Although the ‘tight-fit’ hypothesis suggests that increased brain volume and subsequent enhanced intracranial pressure may underlie AMS symptoms, 7 the link between changes in brain volumes, signs of cerebral edema, and symptoms of AMS typically developing over the first 6 to 12 hours of hypoxic exposure remains controversial.3,4,8–10
Some reports suggest that performing physical activity during the first hours of hypoxic exposure may accentuate symptoms of AMS.11–13 Only one recent study compared the effects of hypoxic exposure for 8 hours associated or not with physical exercise (3 × 30 minutes of moderate intensity exercise) on brain volume and cerebral edema. 14 The authors reported greater increase in gray- and white-matter volumes and higher ADC after hypoxic exposure when subjects performed physical exercise but these changes did not correlate with AMS severity. Accentuation of arterial deoxygenation and cardiorespiratory responses during exercise are two mechanisms potentially underlying the exacerbation of AMS and cerebral edema when hypoxic exposure is associated with exercise.13,14 Whether larger cerebral changes during hypoxia when exercise is performed compared with resting condition as reported by Mairer et al. 14 are the consequences of exercise-induced accentuation of hypoxemia (and therefore due to greater hypoxic stress) or cardiorespiratory responses to exercise (e.g., hemodynamic changes) remains to be determined to further clarify the mechanisms of cerebral changes associated with hypoxic exposure.
In a recent study, 15 we compared two sessions of 11 hours in hypoxia with or without prolonged exercise, with arterial oxygen saturation (SpO2) matched between both conditions. Similar AMS severity was observed in both sessions, suggesting that the level of arterial deoxygenation per se is critical in AMS. In the same setting and subjects, the present study aimed to investigate changes in cerebral volume, ADC, and CBF to assess the effects of hypoxic exposure and prolonged exercise on the brain of healthy subjects. The rational for assessing CBF is that increased CBF and cerebral blood volume may be involved in cerebral volume changes in hypoxia. 7 We also assessed potential early MRI changes after 30 minutes of passive hypoxic exposure, i.e., the hypoxic exposure duration eliciting maximal cerebral deoxygenation (assessed in a recent report from our group by near-infrared spectroscopy). 16 We hypothesized that (1) hypoxia would induce signs of cerebral edema as early as after 30 minutes and this would be exacerbated after 10 hours of exposure and (2) hypoxia associated with exercise would induce similar changes in brain volumes and ADC as hypoxia at rest with matched arterial oxygenation levels, i.e., demonstrating the primary role of hypoxemia regarding cerebral changes.
MATERIALS AND METHODS
Subjects
Twelve healthy endurance-trained men were studied. Their physical characteristics were as follows (mean ± s.d.): age 35 ± 8 years, weight 71 ± 9 kg, height 177 ± 7 cm. All subjects were unacclimatized to high altitude (no sojourn above 2,000 m of altitude over the past 3 months) and none had history of chronic migraine, cardiorespiratory, or metabolic diseases. Subjects did not take any medication and refrained from intense physical activity on the 2 days prior testing and from drinking caffeinated beverages on test days due to the potential effects of caffeine on exercise responses and AMS. 17 Subjects were informed about the risks and signed an informed consent form but were kept naïve regarding the expected outcomes of the study. The study was approved by the local ethics committee (Comité de Protection des Personnes Sud-Est V, 2010-A00121-38) and was performed according to the Declaration of Helsinki.
Study Design
Each subject completed two preliminary test sessions at least 2 days apart, consisting in a progressive cycling exercise test to exhaustion performed once in normoxia (FiO2 = 0.21) and once in hypoxia (FiO2 = 0.12). The tests were performed on a computer-controlled electrically-braked cycle ergometer (Corival, Lode, Groningen, The Netherlands) and started at 90 W (normoxia) or 60 W (hypoxia) followed by 15 W increments every minute until volitional exhaustion. Subjects inhaled a gas mixture delivered by an Altitrainer 200 (SMTEC, Nyon, Switzerland) via a face mask and were blinded to the gas composition and their maximal performances. The maximum normoxic and hypoxic workload measured during these two preliminary sessions allowed the calculation of power output for the experimental sessions.
At least 1 week after preliminary tests, three experimental sessions were performed in a semirandomized order as previously described. 15 In the first session, subjects inhaled an hypoxic gas mixture (FiO2 = 0.12) for 11 hours and performed three 80-minute cycling bouts at 45% of maximum hypoxic workload (i.e., 113 ± 14W) separated by 30 minutes of recovery from the fourth to eighth hour. In the second session, subjects inhaled a hypoxic gas mixture for 11 hours at rest (FiO2 = 0.08 to 0.12, continuously adjusted by the experimenters to match the individual SpO2 measured during the first session). In the third session, subjects inhaled a normoxic gas mixture (FiO2 = 0.21) for 11 hours and performed three 80-minute cycling bouts at 45% of maximum normoxic workload (i.e., 152 ± 22W) separated by 30 minutes of recovery from 4 to 8 hours. Subjects breathed through a face mask throughout all test sessions and were blinded to gas mixture composition delivered by an Altitrainer 200 (SMTEC). They were sitting in a comfortable clinical chair throughout all test sessions except during cycling and MRI evaluations. Magnetic resonance imaging examinations were performed after 30 minutes and 10 hours of gas exposure while subjects continued breathing the gas mixture corresponding to the experimental session. The MRI measurements after 30 minutes in the third session were used as the reference normoxic baseline images (Normoxia-rest). The MRI measurements after 30 minutes in the first and second sessions (i.e., in similar conditions of hypoxia without prior physical exercise) were averaged and used to assess early changes in hypoxia at rest (Hypoxia-rest 30 minutes). The MRI measurements at the end of the second session were used to assess changes induced by prolonged hypoxia at rest (Hypoxia-rest 10 hours). The MRI data measured at the end of the first and third sessions were used to assess changes induced by exercise in normoxia (Normoxia-exercise) and hypoxia (Hypoxia-exercise), respectively.
Commercially available high-energy drinks and cakes (GO2, Rennes, France) were provided ad libitum and fluid and food intakes were recorded during all experimental sessions. Subjects were weighed before and after each session and total urine volume was measured during each session. Weight loss was calculated as the difference between measurements before and after each session and corrected weight loss was calculated as follows:
Corrected weight loss = weight before the session + fluid and food intake-(weight after the session + urine volume)
Capillary blood glucose (ACCU-CHEK Performa, Roche Diagnostics, Mannheim, Germany) and lactate (Lactate Plus, Nova Biomedical Corporation, Waltham, MA, USA) concentrations were measured before gas exposure at the start of each experimental session, at the end of each exercise/rest period, and at the end of the session.
Magnetic Resonance Imaging Examination
All MR images were acquired using a whole body scanner at 3 Tesla (MedSpec S300 Bruker Biospin/Bruker Medizintechnik GmbH, Ettlingen, Germany) equipped with a quadrature emitting/receiving head coil and operating with the ParaVision 4.0 software (Bruker BioSpin, Ettlingen, Germany). The following sequences were applied:
(i) High-resolution 3D T1-weighted MP-RAGE gradient-echo sequence covering the whole brain: 904 ms TI (inversion time), linear order phase encoding, two segments with 2,500ms segment repetition time (TR), 5ms echo time, 16ms TR, 8° flip angle, sagittal orientation with 256mm (H-F) × 224mm (A-P) × 176mm (L-R) field of view, 256 × 224 × 176 acquisition matrix reconstructed to isotropic 1mm resolution.
(ii) Diffusion-weighted spin-echo echoplanar imaging (EPI): 28 axial slices parallel to the anterior commissure-posterior commissure plane, 4.25mm slice thickness, 0.75mm interslice gap, interleaved slice acquisition order, 216mm square field of view, single-shot 72 × 72 EPI readout reconstructed to 128 × 128 (3mm nominal in plane resolution interpolated to 1.69mm), 92ms echo time, 8,400ms TR, 90° flip angle, diffusion weighting b factor of 936 s/mm 2 applied in 30 directions, 18 b = 0 image averaged over 5 excitations. A standard multigradient echo data set was also acquired with the same geometry settings in view of Bo field map estimation for magnetic field susceptibility-related geometric distortion correction.
(iii) Cerebral blood flow-weighted quantitative imaging of perfusion using a single subtraction, second version-pulsed arterial spin labelling (ASL): 12 axial slices were acquired parallel to the diffusion-weighted slices with 4mm thickness and 1mm interslice gap, sequential order, gradient-echo EPI readout, 26-ms echo time, other EPI parameters as for the diffusion-weighted slices. The ASL module used bandwidth-modulated selective saturation and inversion RF pulses for presaturation, label, and quantitative imaging of perfusion using a single subtraction, second version saturation, 19 100-mm label width, 5-mm label gap. The quantitative imaging of perfusion using a single subtraction, second version-saturation time (TI1) was optimized individually for each subject using the bolus turbo sampling method. 20 Values for TI1 ranged from 500 to 750 ms, and were identical between MRI sessions. The postlabelling delay was 750ms in all cases. A total of 120 control and tag images were acquired with a 3,000-ms TR for a total scan time of 12minutes. Mo reference images were acquired in a separate scan using an EPI readout identical to the ASL scan, with an 8-second TR and 5 repetitions.
For each subject, particular care was taken to match between sessions location and orientation of acquired imaging volumes, using anatomic reference features (anterior commissure-posterior commissure).
Postprocessing of Magnetic Resonance Imaging Data
Standard processing was performed using the SPM8 (Wellcome Department of Cognitive Neurology, London, UK) and FSL 4.1.9 (Analysis Group, FMRIB, Oxford, UK) softwares. All individual images were spatially normalized to the normoxic baseline images. A ‘brain mask’ for each subject was defined from the normoxic baseline T1 images and was grown by 3mm in all directions to encompass the intracranial cerebrospinal fluid (CSF) but avoiding extracranial high signal areas (e.g., scalp and orbits). The individual brain mask was applied to all images before segmentation into gray matter, white matter, and CSF using the SPM8 New Segment toolbox. For each subject, total brain parenchyma volume was defined as the sum of gray- and white-matter volumes.
Whole brain diffusion-weighted images were corrected for Bo field distortions using the SPM8 Fieldmap toolbox based on Bo map data acquired during each MRI session. FSL was then used to correct for eddy current distortions and to compute ADC maps from the eigenvalues of the diffusion tensor as estimated by FSL. Coregistration of ADC map with the corresponding high-resolution T1 image was performed with SPM8 coregistration functionality. Quality controls were performed after every step by visual inspection.
Whole brain ASL images were scaled to correct for T1 decay on a per-slice basis and realigned using SPM. Any systematic differences in realignment parameters between control and label images were removed from the parameters. The ASL and Mo images were coregistered with the high-resolution T1 images and the ASL signal amplitude was scaled to express the difference between control and tag images in units of mL/100 g perminute. Basal CBF was modelled with a regressor alternating between 0.5 and −0.5 for control and tag images, respectively, throughout the scan.21,22
Cardiorespiratory Parameters and Symptoms
Arterial oxygen saturation, end-tidal carbon dioxide partial pressure (PetCO2), heart rate (HR), and mean arterial blood pressure (MAP) were measured outside (DATEX Ohmeda, Madison, WI, USA) and inside the magnet (Maglife, Schiller medical, Wissembourg, France). At the end of each experimental session, subjects completed the Lake Louise questionnaire (LLS) 23 and the Environmental Symptom Questionnaire to calculate its cerebral subscore (ESQc 24 ). Subjects also scored their headache severity on a 100-mm visual analog scale. 15
Statistical Analysis
Normality of distribution and homogeneity of variances of the main variables were confirmed using a Skewness-Kurtosis normality test and the Levene's test, respectively. Magnetic resonance imaging and cardiorespiratory measurements were compared between the five experimental conditions (Normoxia-rest, Normoxia-exercise, Hypoxia-rest 30 minutes, Hypoxia-rest 10 hours, and Hypoxia-exercise) by using one-way ANOVA with repeated measures. Symptom scores at the end of each experimental session (Normoxia-exercise, Hypoxia-rest 10 hours, and Hypoxia-exercise) were also compared by one-way ANOVA with repeated measures. Fisher's least significant difference tests were used for post hoc analysis when appropriate. Relationships between physiologic parameters and symptoms were evaluated by Pearson product correlation. For all statistical analyses, a two-tailed alpha level of 0.05 was used as the cutoff for significance. All data are presented as mean values ± s.d.
RESULTS
Cardiorespiratory Measurements
Cardiorespiratory parameters assessed during MRI measurements in each experimental condition are shown in Table 1. Repeated measures ANOVA revealed a significant main effect of experimental conditions for SpO2 (F = 35.1, P<0.001), PetCO2 (F = 4.8, P<0.001), and HR (F = 7.9, P<0.001). Arterial oxygen saturation was significantly reduced in all hypoxic conditions compared with normoxic conditions (all P<0.001). PetCO2 was significantly lower in the Hypoxia-rest condition compared with all other conditions (all P<0.01). Heart rate was significantly increased in all conditions compared with Normoxia-rest (all P<0.01). Repeated measures ANOVA revealed no significant main effect of experimental conditions for MAP (F = 2.1, P=0.339).
Cardiorespiratory parameters during MRI measurements and symptoms in each experimental condition (Normoxia-rest, Normoxia-exercise, Hypoxia-rest 30 minutes, Hypoxia-rest 10 hours, and Hypoxia-exercise)
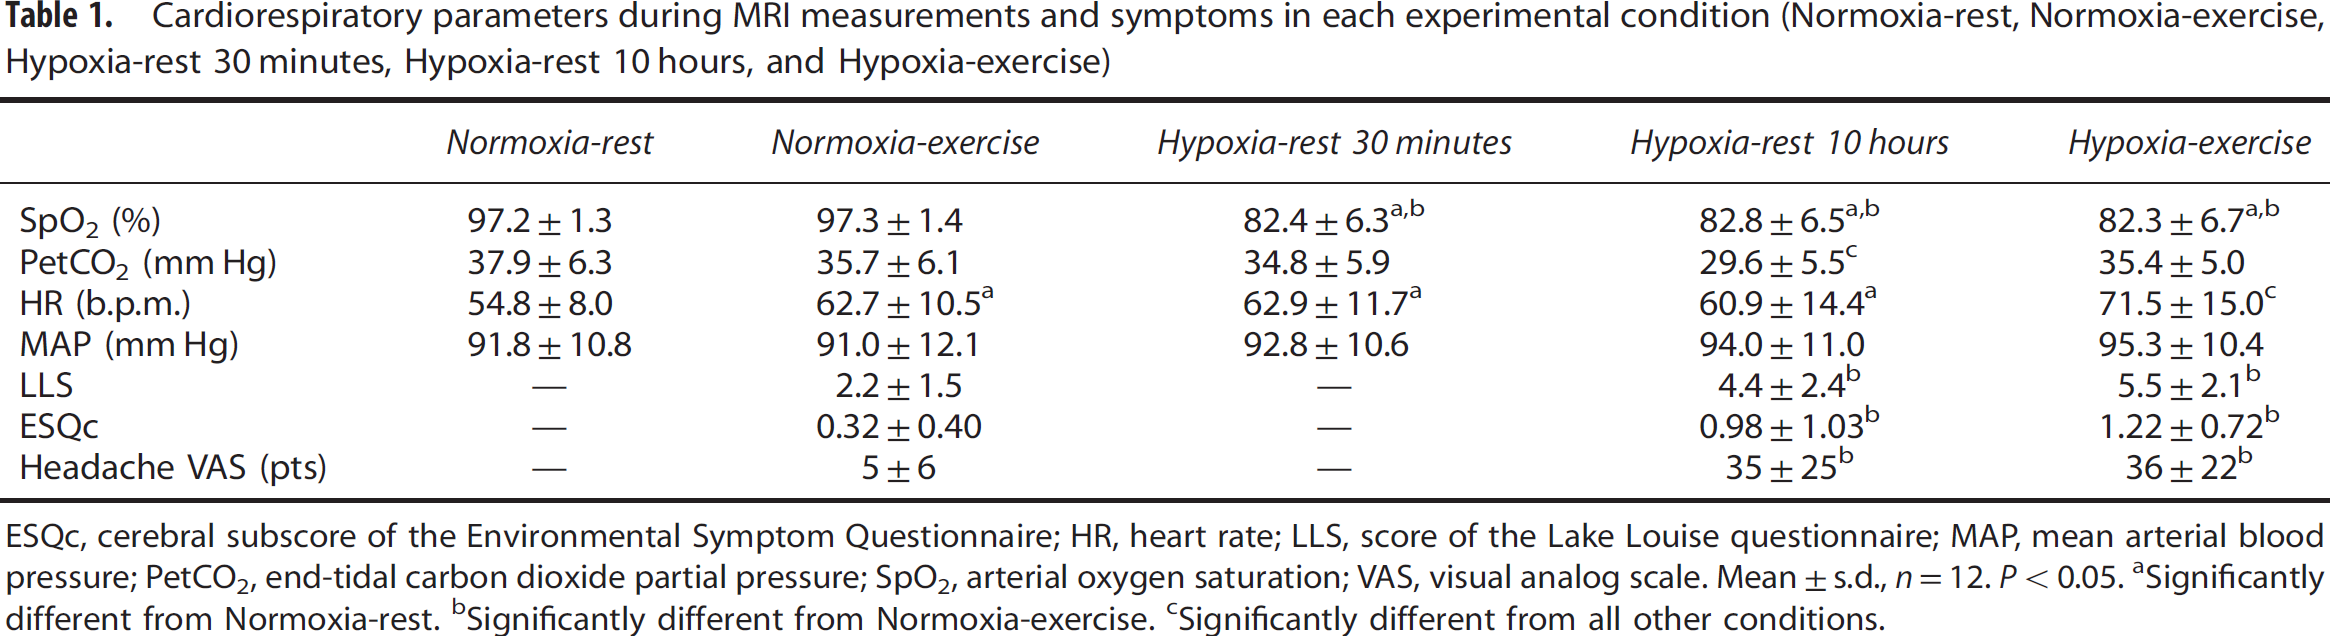
ESQc, cerebral subscore of the Environmental Symptom Questionnaire; HR, heart rate; LLS, score of the Lake Louise questionnaire; MAP, mean arterial blood pressure; PetCO2, end-tidal carbon dioxide partial pressure; SpO2, arterial oxygen saturation; VAS, visual analog scale. Mean ±s.d., n =12. P<0.05.
Significantly different from Normoxia-rest.
Significantly different from Normoxia-exercise.
Significantly different from all other conditions.
The comparison of the three 80-minute cycling bouts during the Hypoxia-exercise condition with the corresponding rest periods with matched SpO2 during the Hypoxia-rest condition confirmed that according to the study design SpO2 did not differ between conditions during this time period (74.8 ± 3.9% and 74.5 ± 5.7% for Hypoxia-exercise and Hypoxia-rest, respectively; P>0.05) while HR (143 ± 17 versus 70 ± 12 b.p.m.) and MAP (102 ± 18 versus 89 ± 12 b.p.m.) were higher during Hypoxia-exercise compared with Hypoxia-rest (all P<0.001).
Cerebral Volumes
Cerebral volumes measured in each experimental condition are shown in Figure 1. Repeated measures ANOVA revealed a significant main effect of experimental conditions for white-matter volume (F= 8.4, P<0.001). White-matter volume was significantly larger in all hypoxic conditions compared with Normoxia-rest (Hypoxia-rest 30 minutes, +0.8 ± 1.0%, P=0.040; Hypoxia-rest 10 hours, +1.5 ± 1.1%, P = 0.007; Hypoxia-exercise, +1.6 ± 1.1%, P<0.001). Hypoxia-rest 10 hours and Hypoxia-exercise induced larger increase in white-matter volume compared with Normoxia-exercise (P = 0.007 and P = 0.002, respectively) and Hypoxia-rest 30 minutes (P = 0.040 and P = 0.015, respectively). Repeated measures ANOVA revealed no significant main effect of experimental conditions for gray-matter volume (F = 2.3, P=0.074) but a significant main effect for total brain parenchyma volume (F = 4.3, P = 0.005). Total brain parenchyma volume was significantly larger in the Hypoxia-exercise condition compared with all other conditions (+1.3 ± 1.1% compared with Normoxia-rest, P<0.001). Repeated measures ANOVA revealed no significant main effect of experimental conditions for CSF volume (F= 1.3, P=0.268).
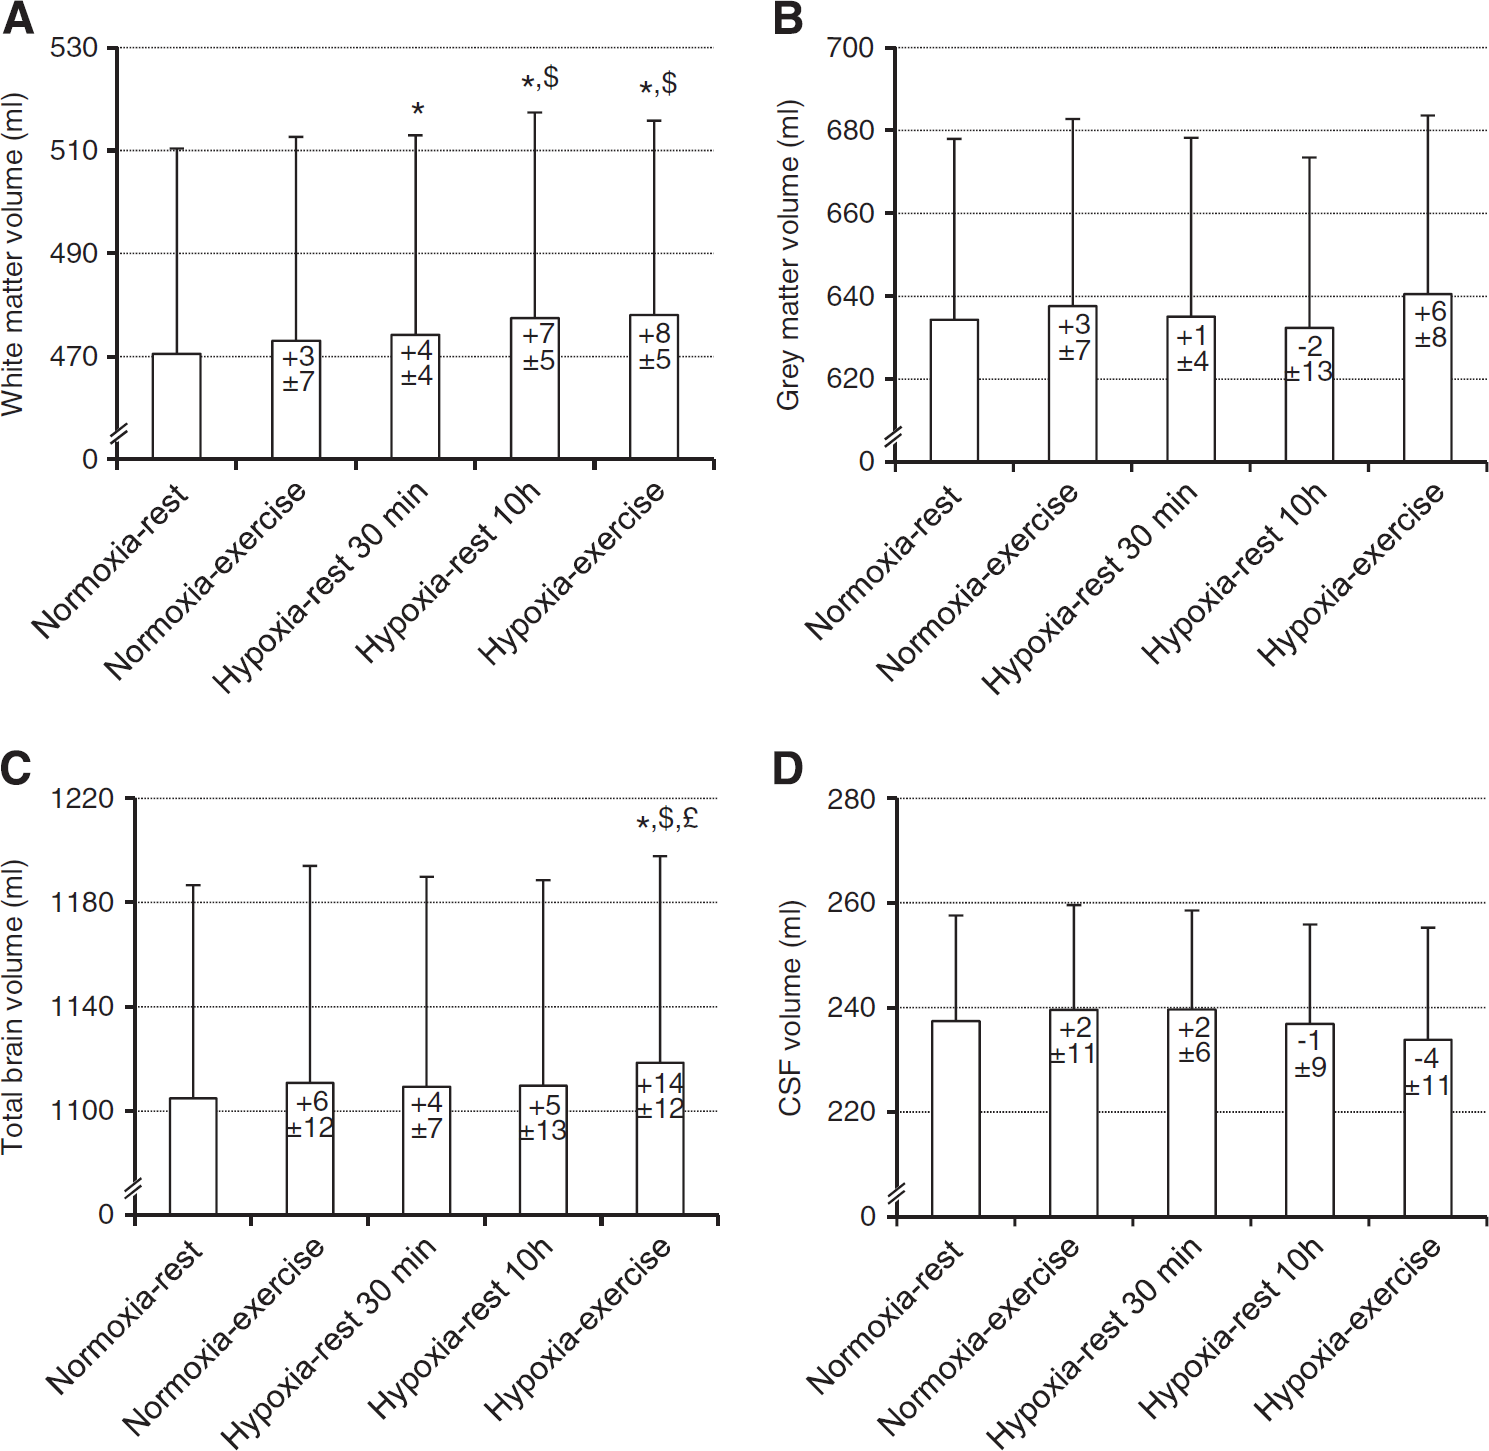
Cerebral volumes (
Diffusion
Whole brain ADC and fractional anisotropy values are shown in Figure 2. Repeated measures ANOVA revealed a significant main effect of experimental conditions for whole brain ADC (F = 3.1, P = 0.026). Apparent diffusion coefficient was significantly reduced in Hypoxia-rest 10 hours (−2.1 ± 3.5%, P = 0.013) and Hypoxia-exercise (−2.4 ± 1.9%, P = 0.004) conditions compared with Normoxia-rest. Repeated measures ANOVA revealed no significant main effect of experimental conditions for fractional anisotropy (F = 1.7, P = 0.160).
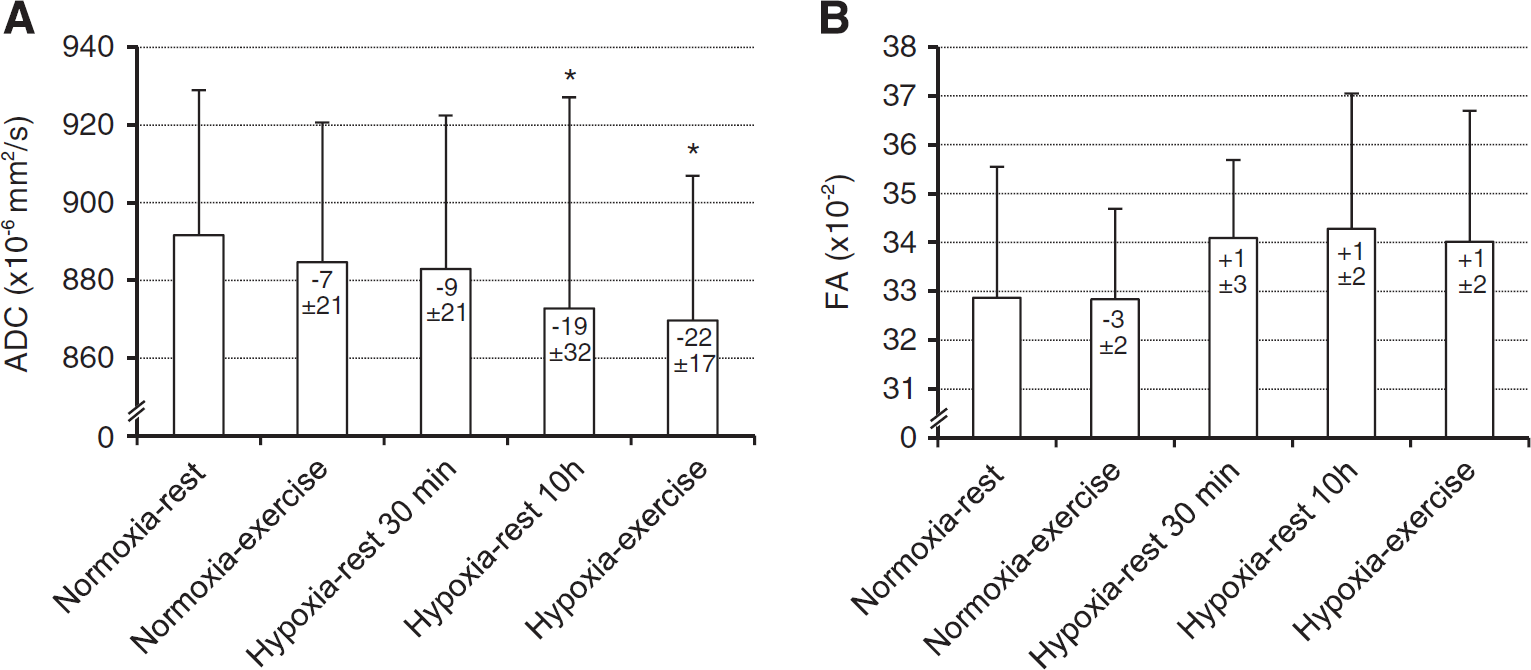
Whole brain apparent diffusion coefficient (ADC,
Cerebral Blood Flow
Cerebral blood flow values in the whole brain are shown in Figure 3. Repeated measures ANOVA revealed no significant main effect of experimental conditions for white matter (data not shown, F = 1.4, P = 0.257), gray matter (data not shown, F = 1.13, P = 0.376), and whole brain (F = 0.5, P = 0.768) CBF.
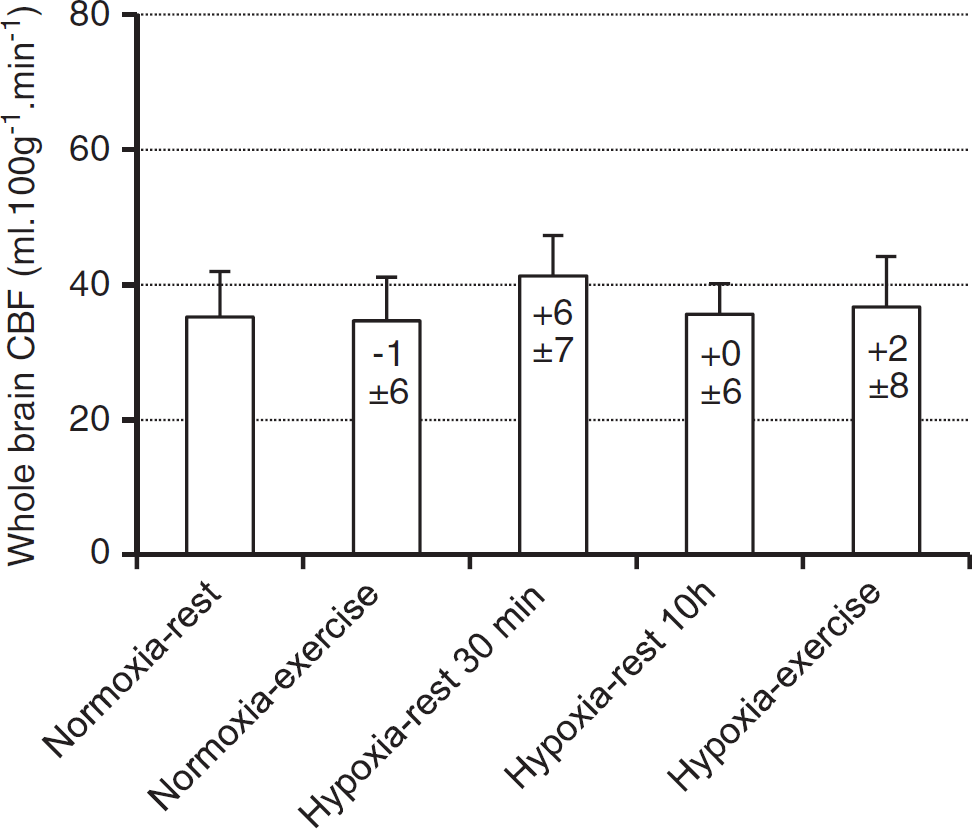
Cerebral blood flow (CBF) in the whole brain measured during each experimental condition (Normoxia-rest, Normoxia-exercise, Hypoxia-rest 30 minutes, Hypoxia-rest 10 hours, and Hypoxia-exercise). Values in the bars indicate difference (in mL/ 100 g per minute) compared with Normoxia-rest. Values are expressed as mean ± s.d.
Symptoms, Body Weight, and Energy Intake
Symptoms at the end of each experimental session are shown in Table 1. Repeated measures ANOVA revealed a significant main effect of experimental conditions for LLS (F = 13.3, P<0.001), ESQc (F = 10.8, P<0.001), and headache (F = 12.2, P<0.001) scores. The LLS, ESQc, and Headache scores were significantly larger in the Hypoxia-rest and Hypoxia-exercise sessions compared with Normoxia-exercise (all P<0.001), without significant difference between both hypoxic sessions (LLS, P = 0.11; ESQc, P = 0.25; Headache, P = 0.921).
Table 2 shows body weight loss, fluid and food intake, and urine volume during the three experimental sessions. Repeated measures ANOVA revealed a significant main effect of experimental conditions for weight loss (F = 9.3, P<0.001), fluid intake (F = 48.8, P<0.001), and energy intake (F = 85.6, P = 0.002). During the Normoxia-exercise and Hypoxia-exercise sessions, weight loss (both P<0.001), fluid (both P<0.001), and energy intake (P = 0.025 and P<0.001) were significantly greater compared with the Hypoxia-rest session. Repeated measures ANOVA revealed a significant main effect of experimental conditions for food intake (F = 6.4, P = 0.007) and corrected weight loss (F = 85.6, P<0.001). Food intake was significantly greater (P = 0.048) and corrected weight loss (P = 0.010) was significantly lower during the Hypoxia-exercise when compared with the Normoxia-exercise session. Repeated measures ANOVA revealed no significant main effect of experimental conditions for urine volume (F = 0.9, P = 0.491).
Change in body weight, fluid and food intake, and urine volume during the three experimental sessions (Normoxia-exercise, Hypoxia-rest, and Hypoxia-exercise)
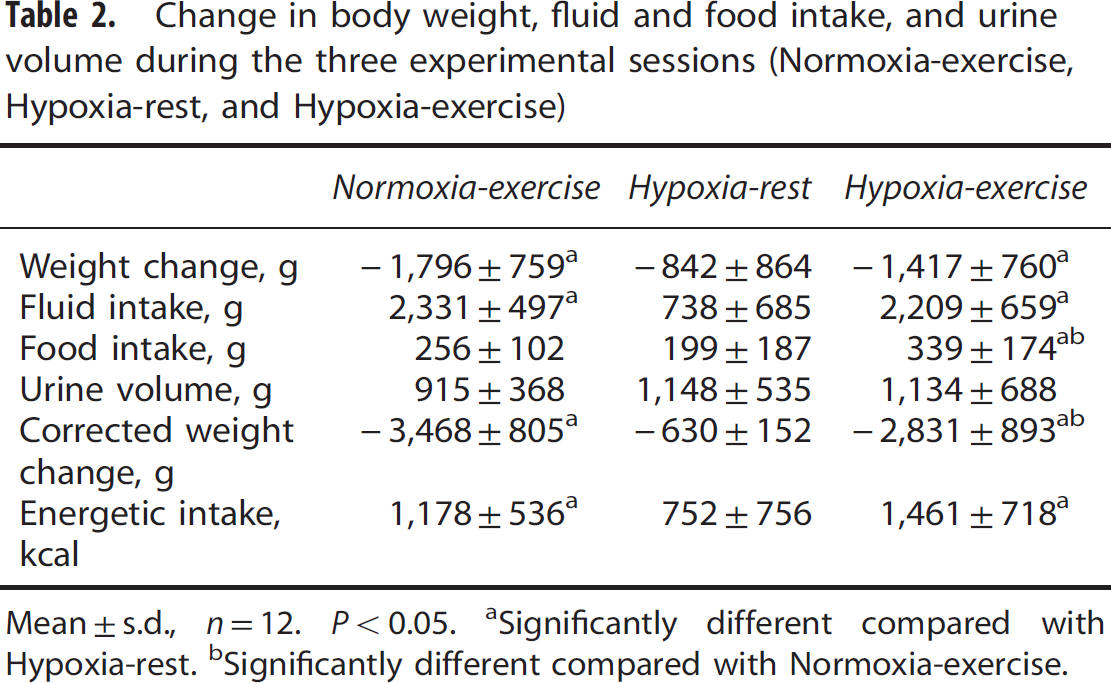
Mean ±s.d., n=12. P<0.05.
Significantly different compared with Hypoxia-rest.
Significantly different compared with Normoxia-exercise.
Correlations
Correlations between changes (relative to baseline normoxic values, i.e., Normoxia-rest) in brain volumes, ADC, CBF and SpO2 and PetCO2 are shown in Table 3. Arterial oxygen saturation was negatively correlated with the increase in white-matter (Figure 4) and total brain parenchyma volumes in the Hypoxia-rest 30 minutes and Hypoxia-rest 10 hours conditions. End-tidal carbon dioxide partial pressure was negatively correlated with brain volume changes in the Hypoxia-exercise condition (Figure 5). Arterial oxygen saturation was positively correlated with CBF changes in all hypoxic conditions (Figure 5). No significant correlations between symptoms (LLS and ESQc scores and their items taken individually, headache assessed on visual analog scale) and changes in cerebral volumes, ADC, or CBF were observed (results not shown, all R<0.40, P>0.05).
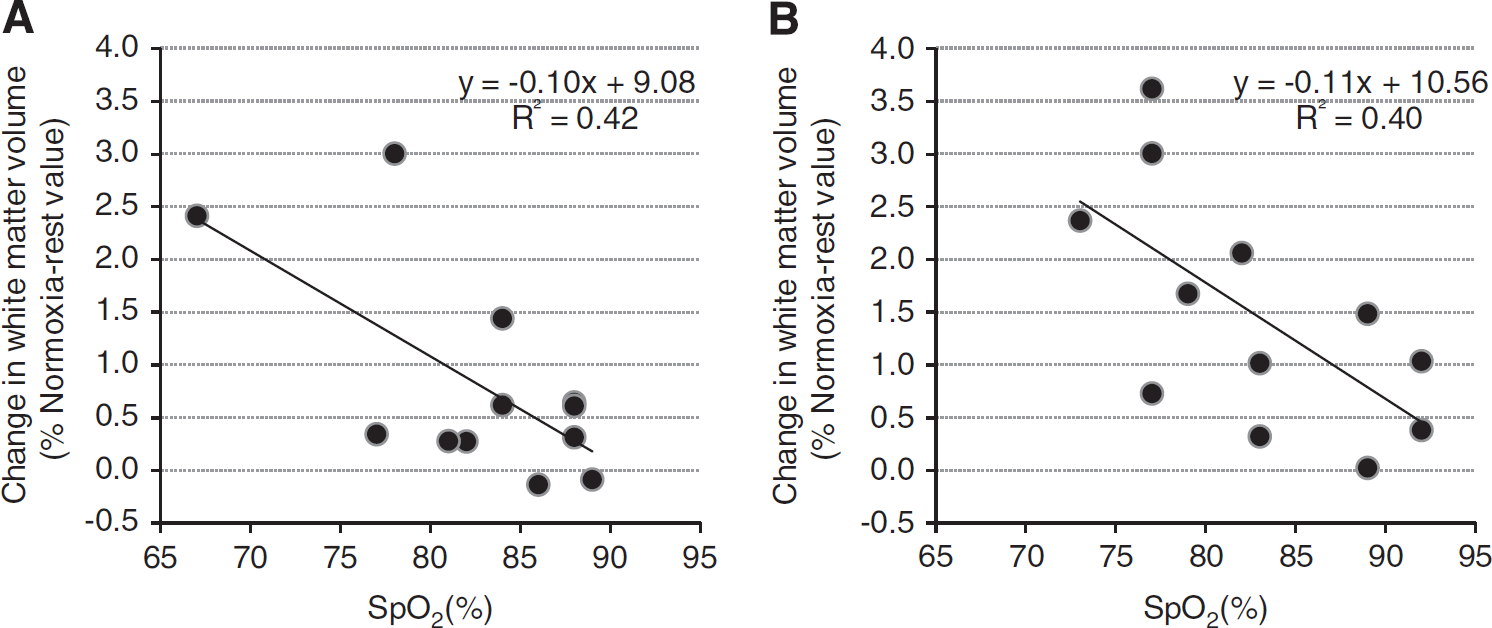
Correlations between arterial oxygen saturation (SpO2) and changes in white-matter volume in the Hypoxia-rest 30 minutes (
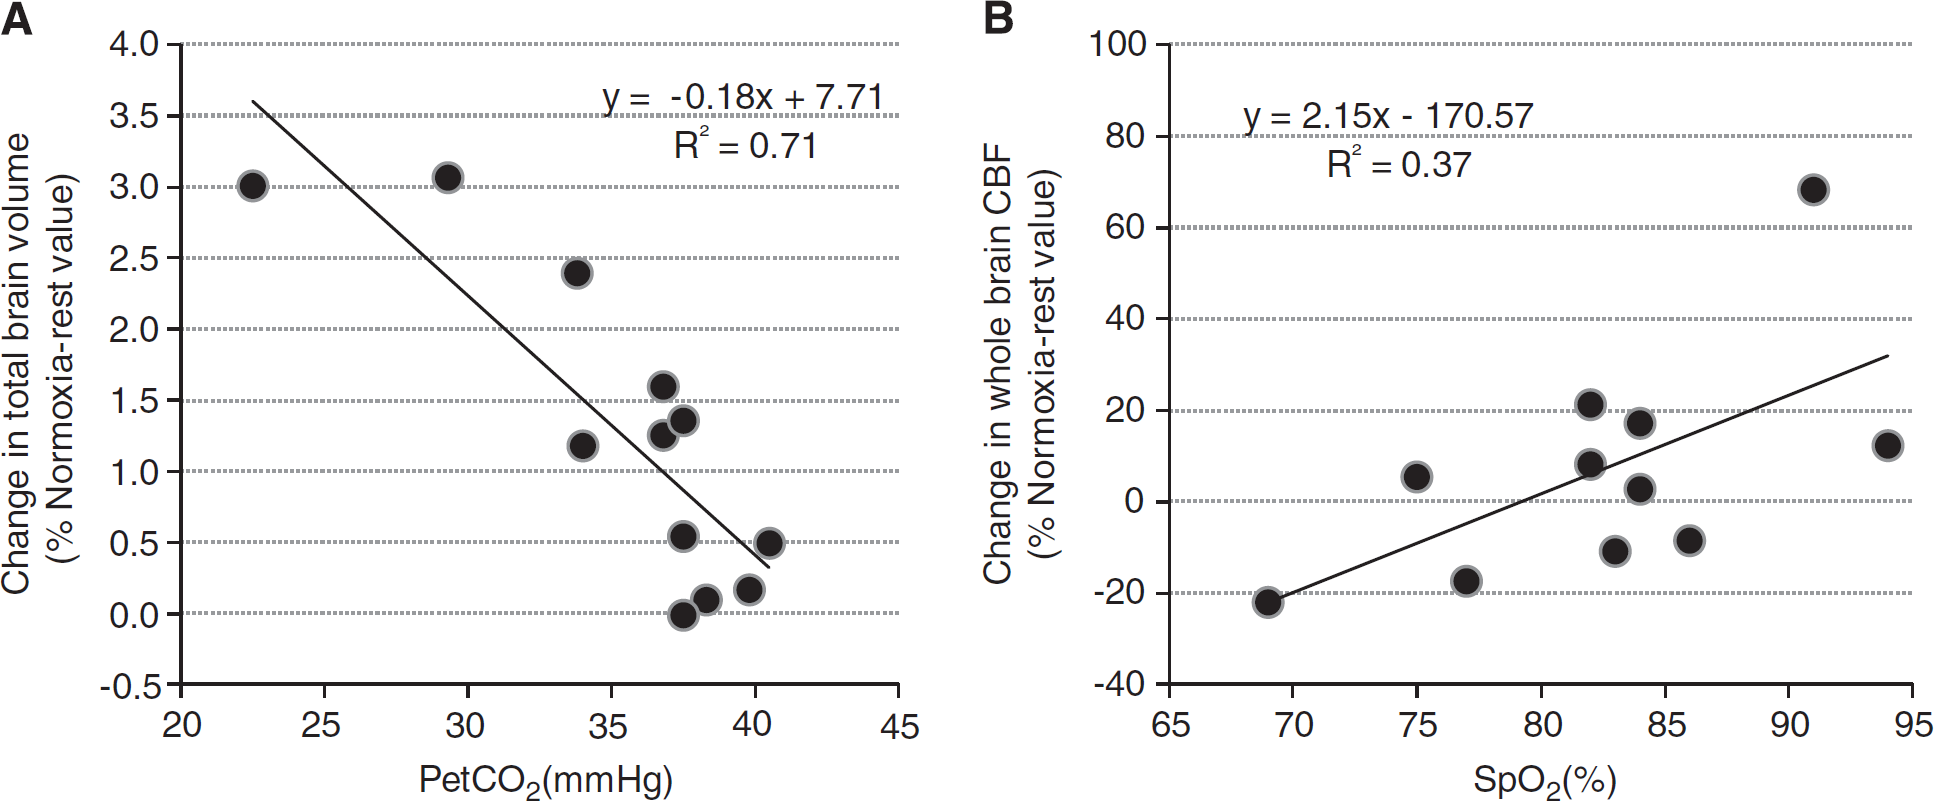
Correlations between end-tidal carbon dioxide partial pressure (PetCO2) and changes in total brain parenchyma volume (
Correlation coefficients between changes (relative to baseline normoxic values) in brain volumes, apparent diffusion coefficient (ADC), cerebral blood flow (CBF) and arterial oxygen saturation (SpO2) and end-tidal carbon dioxide partial pressure (PetCO2) in Hypoxiarest 30 minutes, Hypoxia-rest 10 hours, and Hypoxia-exercise conditions
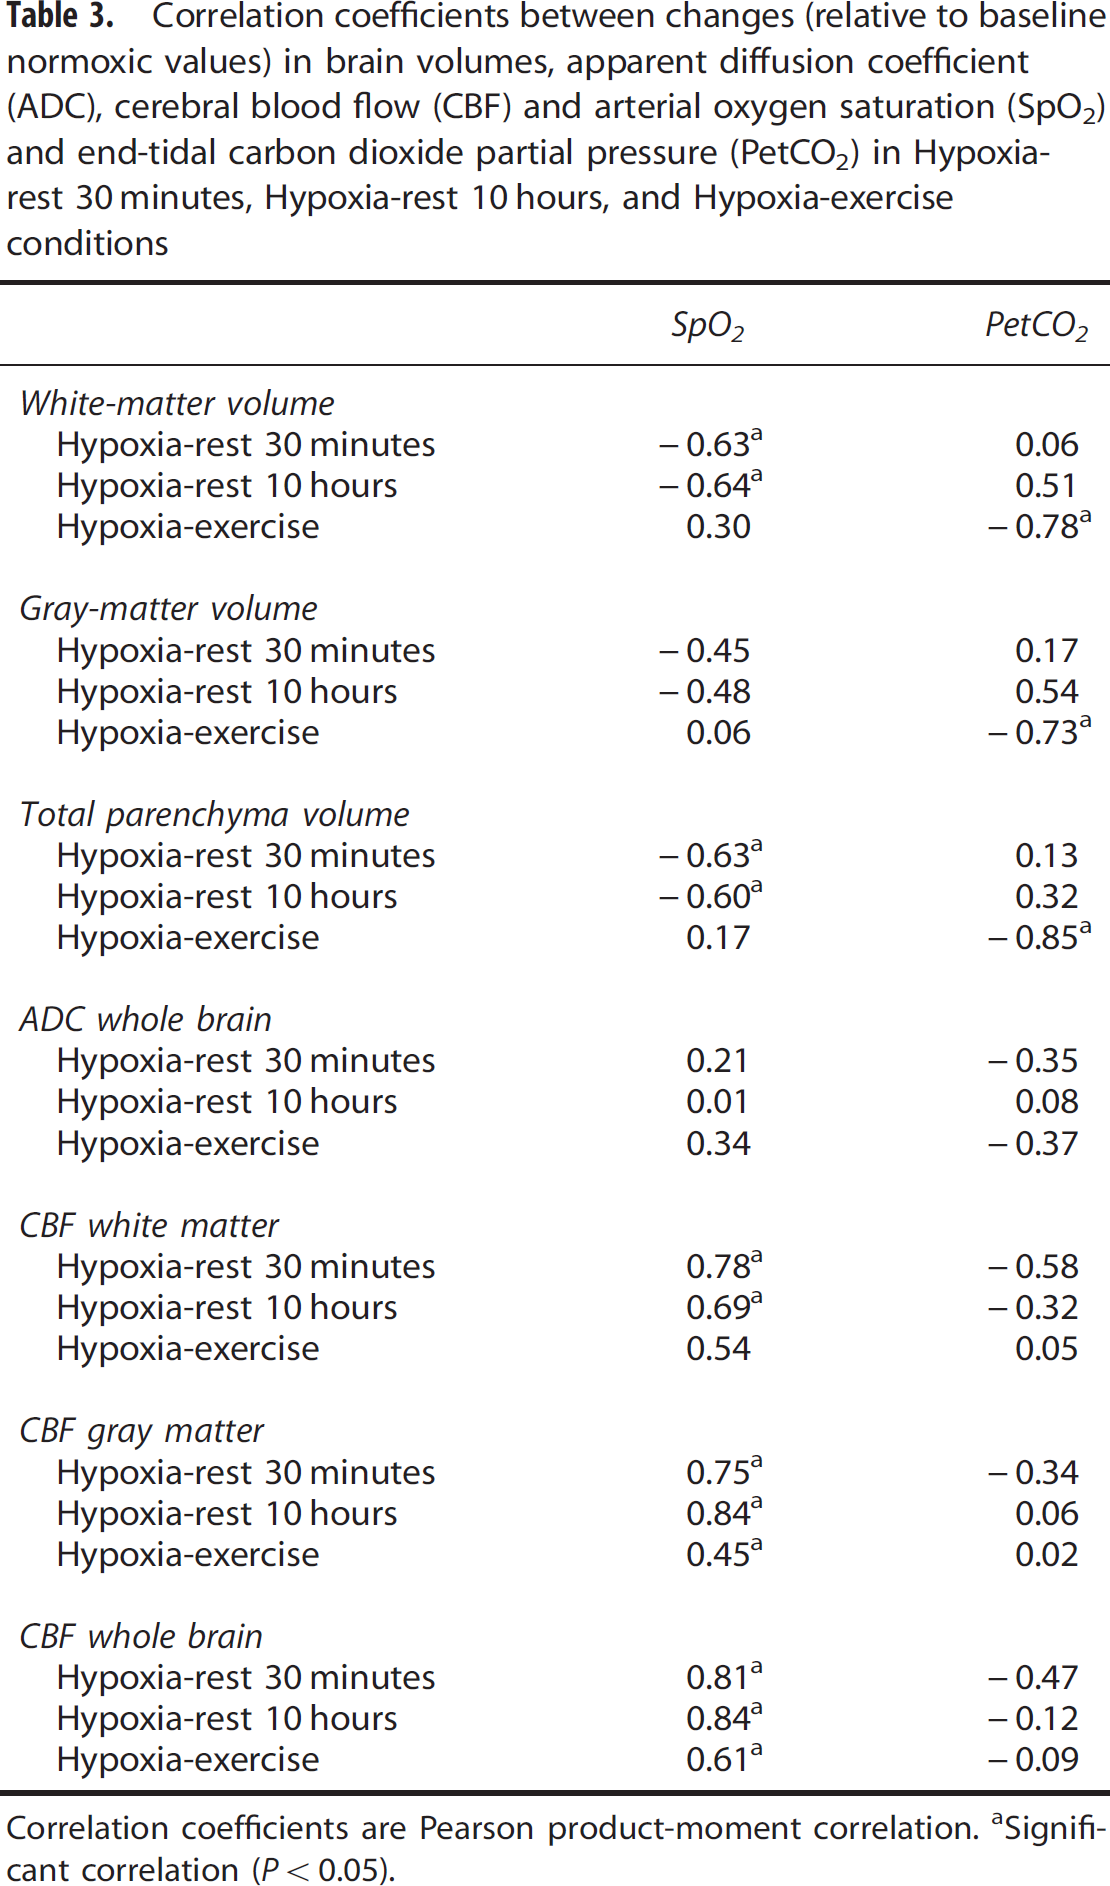
Correlation coefficients are Pearson product-moment correlation.
Significant correlation (P<0.05).
DISCUSSION
This study shows that hypoxia induces a significant increase in white-matter volume as early as after 30 minutes of exposure at rest that further increases after 10 hours of hypoxic exposure (+1.5%) while ADC was significantly reduced. The increases in white-matter volume were negatively correlated with SpO2 after both 30 minutes and 10 hours of hypoxia at rest. A significant increase in total brain parenchyma volume (+1.3%) was observed only when 4 hours of moderate intensity cycling were performed during 10 hours of hypoxic exposure. Acute mountain sickness symptoms were similar after 10 hours of hypoxic exposure with or without 4 hours of exercise and did not correlate with changes in cerebral volumes, ADC, or CBF.
Cerebral Volume Changes in Hypoxia
Acute mountain sickness is frequently observed at high altitude and can be considered as an early stage of subclinical brain edema leading to intracranial hypertension and symptoms such as headache and fatigue. 1 Hence, understanding the cerebral consequences of hypoxic exposure is of major interest to clarify the mechanisms and conditions leading to AMS and potentially to high altitude cerebral edema during high altitude sojourn. Some previous studies suggested that MRI signs of cerebral subedema may be observed as early as during the first hour of hypoxic exposure.5,6 In the present study, white-matter volume already increased significantly after 30 minutes of hypoxic exposure. This time point coincides with significant and near maximal reduction in cerebral oxygenation measured by near-infrared spectroscopy during a 4-hour hypoxic exposure (FiO2 = 0.12) at rest. 16 Short-term changes in cerebral volume are commonly caused by changes in tissue water content or perfusion. The absence of significant change in ADC after 30 minutes of exposure suggests that edema is not responsible for this early increase in white-matter volume. From unchanged CBF, it may be extrapolated that cerebral blood volume was also unchanged, 6 but the relationship between CBF and cerebral blood volume may not be always straightforward especially with potential changes in venous blood volume. 7 We recently showed that prefrontal total haemoglobin concentration measured by near-infrared spectroscopy increased within 30 minutes of hypoxic exposure at rest, suggesting that an increase in cerebral blood volume may occur after short duration hypoxic exposure and might underlie an increase in cerebral volume as observed in the present study. Because of the small amplitude of cerebral volume changes observed after 30 minutes of hypoxic exposure only, further investigations with greater sample size and repeated MRI assessments are needed to provide a more detailed description of the kinetic of early brain volume changes in hypoxia. After 10 hours of hypoxic exposure at rest, the white-matter volume further increased and was accompanied by a significant reduction in ADC. A reduction in ADC is generally interpreted as a consequence of cytotoxic edema with intracellular swelling and may be associated with perturbations in cellular energy status responsible for reduced Na+/K+ ATPase pump and altered ionic homeostasis.9,25
Previous studies regarding the effect of hypoxic exposure on ADC reported contradictory results with increased3,4,14 or reduced5,10 ADC values. Hunt et al 9 reported significant reduction in ADC values among subjects with AMS after 48 hours at 3,800 m while ADC was increased in subjects without AMS. Two studies also reported ADC reductions in subjects with the highest AMS scores.3,4 These results support the concept that intracellular swelling and cytotoxic cerebral edema may be linked to the severity of AMS during hypoxic exposure. 7 In the present study, 10 hours of hypoxic exposure at rest induced a significant increase in white-matter volume, a significant reduction in whole brain ADC, and induced mild to severe AMS in ∼75% of the subjects (LLS >3, 23 ). These cerebral changes did not correlate however with symptoms of AMS. Interestingly, total brain parenchyma volume did not change significantly during hypoxic exposure at rest (Figure 1). Therefore, it can be speculated that despite no significant reduction in gray-matter and CSF volumes, the increase in white-matter volume during hypoxic exposure at rest in the present study could be buffered without inducing large increase in intracranial pressure and eventually provoking symptoms.
The increase in white-matter volume was negatively correlated with SpO2 both after 30 minutes and 10 hours of hypoxic exposure (Figure 4). This strongly suggests that the level of hypoxemia is a key factor regarding changes in white-matter volume during hypoxic exposure at rest and that subjects with the largest oxygen desaturation in hypoxia are more prone to present increased white-matter volume. Arterial oxygen saturation was also negatively correlated with changes in CBF in hypoxia (Figure 5), possibly due to larger hyperventilation in subjects with higher SpO2 inducing cerebral vasoconstriction neutralizing the vasodilatory effect of hypoxia. 26 The fact that subjects with the lowest SpO2 had the largest increase in white-matter volume and small or no increase in CBF does not support the concept that increased CBF and cerebral blood volume underlie increased brain volume in hypoxia. 7 The absence of significant correlation between changes in white-matter volume and ADC as well as between changes in ADC and SpO2 during hypoxic exposure at rest suggests that changes in white-matter volume and ADC may rely on distinct mechanisms, although this remains to be further clarified.
The Effect of Exercise on Hypoxia-Induced Changes in Cerebral Volumes
Whether performing physical exercise at high altitude exacerbates symptoms of AMS remains debated.11–15,27 Rupp et al 15 showed that when conditions of hypoxic exposure with and without physical exercise are matched for SpO2 level (i.e., taking into account the exercise-induced desaturation and therefore the larger hypoxic stress during exercise), AMS score and prevalence are not significantly increased by prolonged moderate intensity exercise. This suggests that hypoxemia, whether exercise is performed, is the main mechanism underlying AMS. In the present study, we were able to compare cerebral changes after hypoxic exposure with or without exercise but with similar hypoxemic stress by adjusting FiO2 continuously, therefore leaving the cardiorespiratory and metabolic responses as the main difference between both hypoxic conditions. Despite similar changes in white-matter volume in the Hypoxia-rest 10 hours and Hypoxia-exercise conditions, only the latter was associated with a significant increase in total brain parenchyma volume (Figure 1). Although no significant difference was observed between conditions, larger gray-matter volume tended to be observed in Hypoxia-exercise compared with Hypoxia-rest 10 hours (ANOVA, P = 0.07) and probably contributed to the increase in total brain parenchyma volume. Interestingly, while changes in white-matter and total brain parenchyma volumes were significantly correlated with SpO2 in conditions of hypoxia at rest, no correlation was observed between changes in brain volumes and SpO2 in the Hypoxia-exercise condition. These results suggest that prolonged exercise at moderate intensity during hypoxic exposure (similar to climbing at high altitude) induces specific brain perturbations as illustrated by increased total brain volume that may rely on mechanisms other than hypoxemia only.
Prolonged exercise can modify osmolality and especially induce hyponatremia. 28 Hypoosmalality is known to promote cerebral edema. 29 Mild global dehydration may also result in a slight reduction in cerebral extracellular water and consequently reduce ADC. 9 Since weight change, fluid intake, and urine volume were similar between Normoxia-exercise and Hypoxia-exercise conditions (Table 2), large differences in osmolality or hydration between both conditions are unlikely to explain the increased total brain volume observed in the Hypoxia-exercise session only. Hemodynamic changes associated with prolonged exercise may induce specific responses at the brain level such as increased cerebral capillary hydrostatic pressure, potentially promoting vasogenic edema. 7 Larger HR in Hypoxia-exercise compared with Hypoxia-rest 10 hours (Table 1) may support this hypothesis, although MAP did not differ significantly between conditions. The similar CBF in Hypoxia-rest 10 hours and Hypoxia-exercise conditions does no support that changes in cerebral blood perfusion or volume may underlie the increase in total brain parenchyma volume observed in the Hypoxia-exercise condition only. One could however hypothesize that an increased pulmonary arterial pressure due to hypoxia and exercise 30 may impair venous return from the brain and therefore promote an increase in venous blood volume that could not be detected from ASL measurements in the present study. Such an increase in venous blood volume has been proposed as a potential mechanism leading to increase cerebral volume and intracranial hypertension at high altitude. 7 At last, ADC reduction was similar in the Hypoxiarest 10 hours and Hypoxia-exercise conditions, suggesting that prolonged exercise did not accentuate cerebral edema during hypoxic exposure.
In the Hypoxia-exercise condition only, PetCO2 was negatively correlated with changes in brain volumes (Figure 5). This may suggest that subjects with the largest hyperventilation exhibit the greatest increase in brain volume. Conversely, the lower mean PetCO2 observed in the Hypoxia-rest 10 hours condition compared with Hypoxia-exercise (Table 1) while total brain parenchyma was increased in the latter condition only rather suggests that larger hyperventilation and hypocapnia may be associated with smaller overall increase in brain volume. Hyperventilation in the Hypoxiarest and Hypoxia-exercise conditions can be due to the consequence of hypoxia and/or the residual effect of prolonged exercise (associated with the oxygen debt). Lower PetCO2 may promote a reduction in CBF but its effect on cerebral blood volume is hypothetical. Hence, based on the present results, no conclusion can be drawn on the potential consequences of changes in arterial CO2 on cerebral volume and subedema in hypoxia.
Finally, the fact that a significant increase in total brain parenchyma volume was observed in the Hypoxia-exercise condition only while similar symptoms of AMS were observed in the Hypoxia-rest 10 hours and Hypoxia-exercise conditions further emphasizes the lack of direct relationship between changes in brain parenchyma volume and symptoms of AMS. Hence, although AMS symptoms are frequently considered to indicate an early stage of subclinical brain edema, 1 the present study as well as the one from Mairer et al 14 for instance questioned the relationship between changes in brain volume, cerebral subedema, and symptoms of AMS.
Study Limitations
While white- and gray-matter volumes showed distinct changes during hypoxic exposure, the present study could not evaluate whether changes in ADC differed between gray and white matter because of insufficient resolution of ADC map. Also, T1 images may be of limited value to detect small changes in CSF volume so that T2 images would have been helpful to accurately track changes in CSF volume within the present experimental conditions. 6 Volumetric regional changes were not investigated in the present study because we previously observed (unpublished data) that spatial normalization to standard templates induces slight images distortions able to interfere with subtle brain volumetric changes. Although previous studies suggest a rather homogenous effect of hypoxia and exercise on the main cerebral regions, 14 further studies are needed to determine whether specific regions of the brain may show larger hypoxiainduced alterations. The absence of correlation between symptoms of AMS and changes in brain volume or ADC during 10 hours of hypoxic exposure cannot exclude any consequences of cerebral changes over longer hypoxic exposure duration where symptoms are known to be the most severe (12 to 48 hours). 9
CONCLUSIONS
The present study shows that hypoxic exposure induces a significant increase in white-matter volume and ADC reduction suggesting cytotoxic edema in symptomatic subjects. Prolonged moderate intensity exercise in hypoxia induces a significant increase in total brain parenchyma volume that was not observed during hypoxic exposure at rest with identical SpO2, suggesting specific cerebral consequences due to exercise in hypoxia. Although the level of hypoxemia appears to be a key factor regarding the hypoxia-induced increase in white-matter volume, other mechanisms may underlie cerebral volumetric changes associated with hypoxic exposure and exercise that remain to be clarified. The present results also demonstrate that changes in brain volume and cerebral subedema are independent of AMS symptoms.
Footnotes
ACKNOWLEDGEMENTS
The authors thank the subjects for the time and effort they dedicated to this study, the French National Research Agency for financial support (grant number NT09_653348) and GO2 for providing high-energy drinks and cakes.
The authors declare no conflict of interest.