
Abstract
Cerebral autoregulation (CA) refers to the control of cerebral tissue blood flow (CBF) in response to changes in perfusion pressure. Due to the challenges of measuring intracranial pressure, CA is often described as the relationship between mean arterial pressure (MAP) and CBF. Dynamic CA (dCA) can be assessed using multiple techniques, with transfer function analysis (TFA) being the most common. A 2016 white paper by members of an international Cerebrovascular Research Network (CARNet) that is focused on CA strove to improve TFA standardization by way of introducing data acquisition, analysis, and reporting guidelines. Since then, additional evidence has allowed for the improvement and refinement of the original recommendations, as well as for the inclusion of new guidelines to reflect recent advances in the field. This second edition of the white paper contains more robust, evidence-based recommendations, which have been expanded to address current streams of inquiry, including optimizing MAP variability, acquiring CBF estimates from alternative methods, estimating alternative dCA metrics, and incorporating dCA quantification into clinical trials. Implementation of these new and revised recommendations is important to improve the reliability and reproducibility of dCA studies, and to facilitate inter-institutional collaboration and the comparison of results between studies.
2022 Update summary
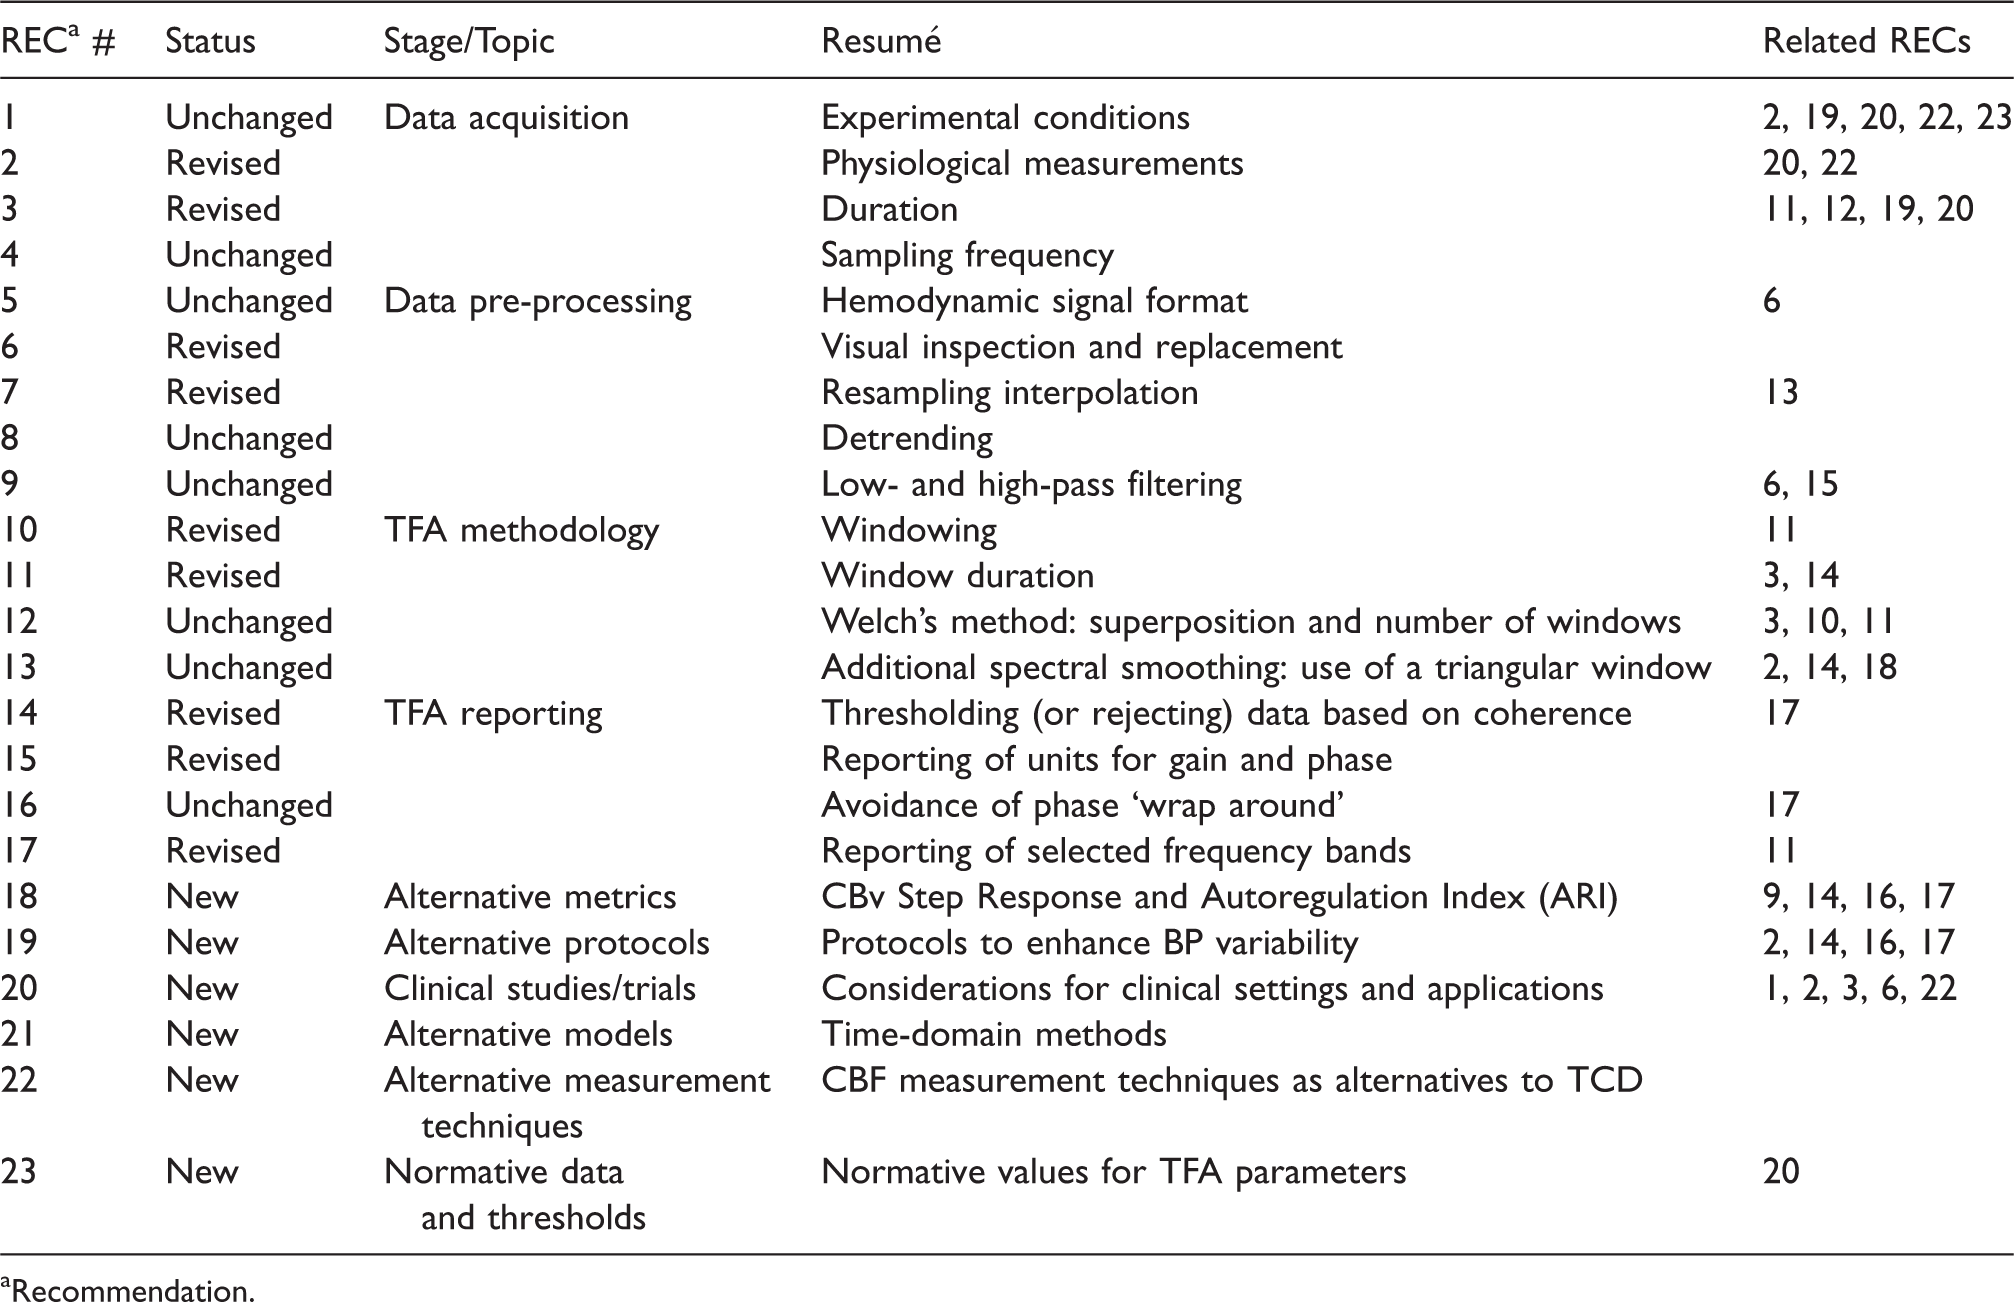
Recommendation.
Introduction
Cerebral autoregulation (CA), the ability of the brain’s vasculature to attenuate changes in cerebral blood flow (CBF), following changes in arterial blood pressure (BP), was initially defined based on measurements of CBF of low temporal resolution, such as indicator-dilution methods. Those assessments are now regarded as ‘static’ CA, as compared to more recent methods that allow much higher temporal resolution for measurements of CBF, giving rise to the concept of ‘dynamic’ CA (dCA). Dynamic CA is the transient response of CBF to an acute change in BP, lasting only a few seconds.1,2 Most modern physiological and clinical studies of CA tend to be dominated by the dynamic modality, as relatively shorter recordings can be used, without the need of inducing long lasting changes in BP, which are generally dependent on the infusion of vasoactive drugs. 3 Indeed, in its original formulation, dCA involved recordings of CBF with transcranial Doppler ultrasound (TCD), lasting shorter than a minute, following the sudden release of inflated thigh cuffs. 1 The demonstration that dCA could also be assessed from spontaneous fluctuations in BP, was a major advancement, facilitating examination of dCA without any interventions that could interfere with the physiological determinants of dCA.4–6 The use of spontaneous fluctuations in BP as the stimulus (or input) to induce corresponding changes in CBF (or output), paved the way for the use of transfer function analysis (TFA) to represent dCA as a frequency-dependent phenomenon and this approach has received considerable attention in the literature.7–10 Although the main focus of the white paper is the study of dCA in humans, it is important to note that TFA has also been used in animal studies 11 and these would also benefit from many of the recommendations described below.
The 2016 white paper from the Cerebrovascular Research Network (CARNet) proposed a set of recommendations to standardize the application of TFA to study dCA. 7 The primary motivation for that original paper was the lack of methodological consistency observed in the TFA literature, in which large discrepancies can be found in measurement protocols, parameter settings, and reporting of results.9,12,13 Since its original publication, the white paper has had a noticeable impact, reflected by an increasing number of citations and greater methodological convergence in the field, which has facilitated the comparison of outcomes in multi-center studies and promoted collaborative efforts.14–19
Despite the intention of making recommendations based on well-established evidence, the original paper was somewhat constrained by the limited existence of comparative studies assessing alternative measurement protocols, parameter sensitivity, reproducibility, and the disparity of clinical outcomes. For this reason, many of the recommendations could not be supported by evidence; instead, they were based on common practice and expert opinion. In the last five years, however, this evidence gap has been partially filled, allowing for a stronger endorsement of more rigorous recommendations. Moreover, measurement protocols have evolved considerably, broadening the application of TFA beyond the use of spontaneous fluctuations in BP, and these approaches have been extended to different areas of cerebrovascular physiology and clinical applications. These recent developments warrant an update and revision of the original white paper to maintain continuous improvement in scientific rigour and promote cohesion in this vibrant field of research.
This revision has followed an open process of consultation with the entire CARNet membership (Appendix). The notion was first proposed to members during the 10th Annual Meeting of the network that took place during April 2021. All members were invited to submit suggestions for recommendations that would benefit from revision, as well as for novel recommendations that considered recent advances. The writing group amalgamated these suggestions into succinct themes, which were then delegated to working groups for revisions or preparation of new content. Subsequent drafts of the complete, revised manuscript were circulated to the entire membership for review and approval (see Appendix). This process resulted in the revision of 9 of the original 17 recommendations, based on recent evidence. Furthermore, 6 novel recommendations, particularly relevant for clinical studies, are now included herein.
The main aim of this white paper is to provide concise guidelines and not present a systematic review of the literature. For this reason, citations are limited to key references from the peer-reviewed literature that provided evidence to support the revision of existing recommendations or inclusion of new ones. To ensure this new version of the white paper is as succinct as possible, only brief reference is made to those recommendations that have not been substantially amended.
CARNet recommendations
Data acquisition
Environmental conditions
The following controls for each assessment should be considered: • With the exception of studies where sex differences are not pertinent (e.g., pregnancy), it is highly recommended that study designs include a balanced number of participants of both sexes, to consider the influence of sex on outcomes and also to generate representative data for subsequent clinical studies, • Assessments should occur in an environmentally controlled location (e.g., temperature, humidity, acoustic noise or other disturbances) and unusual settings (e.g. high altitude, zero gravity) should be clearly stated, giving details (e.g., barometric pressure) where possible, • Assessments should occur at a standardized time of day within a study and across repeated measures, • Sensory stimuli (e.g., noise, lights) should be minimized unless designed as an experimental stimulant, • Participants should refrain from caffeine, nicotine, chocolate, and alcohol for at least 12 h prior to measurement, • Participants should refrain from moderate (or more vigorous) exercise for at least 6 h prior to measurement, • Participants should refrain from high calorie meals for at least 4 h prior to measurement, • Chronic and acute medications should be noted, • Body position should be clearly noted. For resting measures, a 15-min period of rest with uncrossed legs should precede the assessment, and • Departures from these recommendations should be discussed in the manuscript.
CBF is responsive to a wide range of stimuli. As such, control over the environmental conditions for performing measurements 20 and participant preparation protocols is paramount for reproducible and reliable data. Recent data suggest that diurnal effects may be small,21,22 but standardizing time of day is still recommended to limit even subtle confounding effects. The original recommendation to restrict assessments until at least 12 h following acute exercise has been eased in response to recent evidence involving both moderate and high intensity exercise protocols. 23 Furthermore, TFA is reliant on the assumption that recorded signals are approximately stationary, i.e., with relatively consistent behaviour over time. 24
Physiological measurements and equipment
Continuous recordings of cerebral blood flow, arterial blood pressure, and arterial (or end-tidal) partial pressure of carbon dioxide form the minimum acceptable data assemblage to permit robust reporting of dynamic cerebral autoregulation findings. Monitoring of both hemispheres is preferred. Intracranial pressure should be reported, if available.
As stated, dCA informs about the intrinsic characteristics of the cerebral vasculature that modulate the dynamic association between BP and CBF. As such, a base set of continuous physiological measurements is essential.13,25 Figure 1 shows a typical data acquisition arrangement for dCA assessment using spontaneous fluctuations. The most common approach to obtain estimates of CBF is the measurement of cerebral blood velocity, in both middle cerebral arteries, using transcranial Doppler ultrasound (TCD).1,7,26,27 Historically, the envelope of the TCD output has been referred to as cerebral blood flow velocity (CBFV) in the wider literature, but there is a growing consensus that using the term ‘flow’ is not appropriate, since the physical quantity that is being measured is the average speed of blood across the insonated vessel diameter, and not absolute flow. 28 For this reason, we recommend the use of CBv as the general abbreviation for cerebral blood velocity. Specifying the artery that was insonated, with the abbreviations MCAv, PCAv, or ACAv, for example, is also highly recommended. 28 With respect to BP, the majority of dCA studies use arterial volume clamping of a finger artery to obtain continuous non-invasive measurements. Importantly, good agreement exists between non-invasive arterial volume clamping and invasive (intra-arterial catheter) techniques, with the former not known to distort time-varying estimates of dCA. 29 Several alternatives are available for measuring CBF surrogates (Recommendation #22), but one must appreciate that estimates of gain, phase, and coherence can vary considerably, depending on the adopted modality.
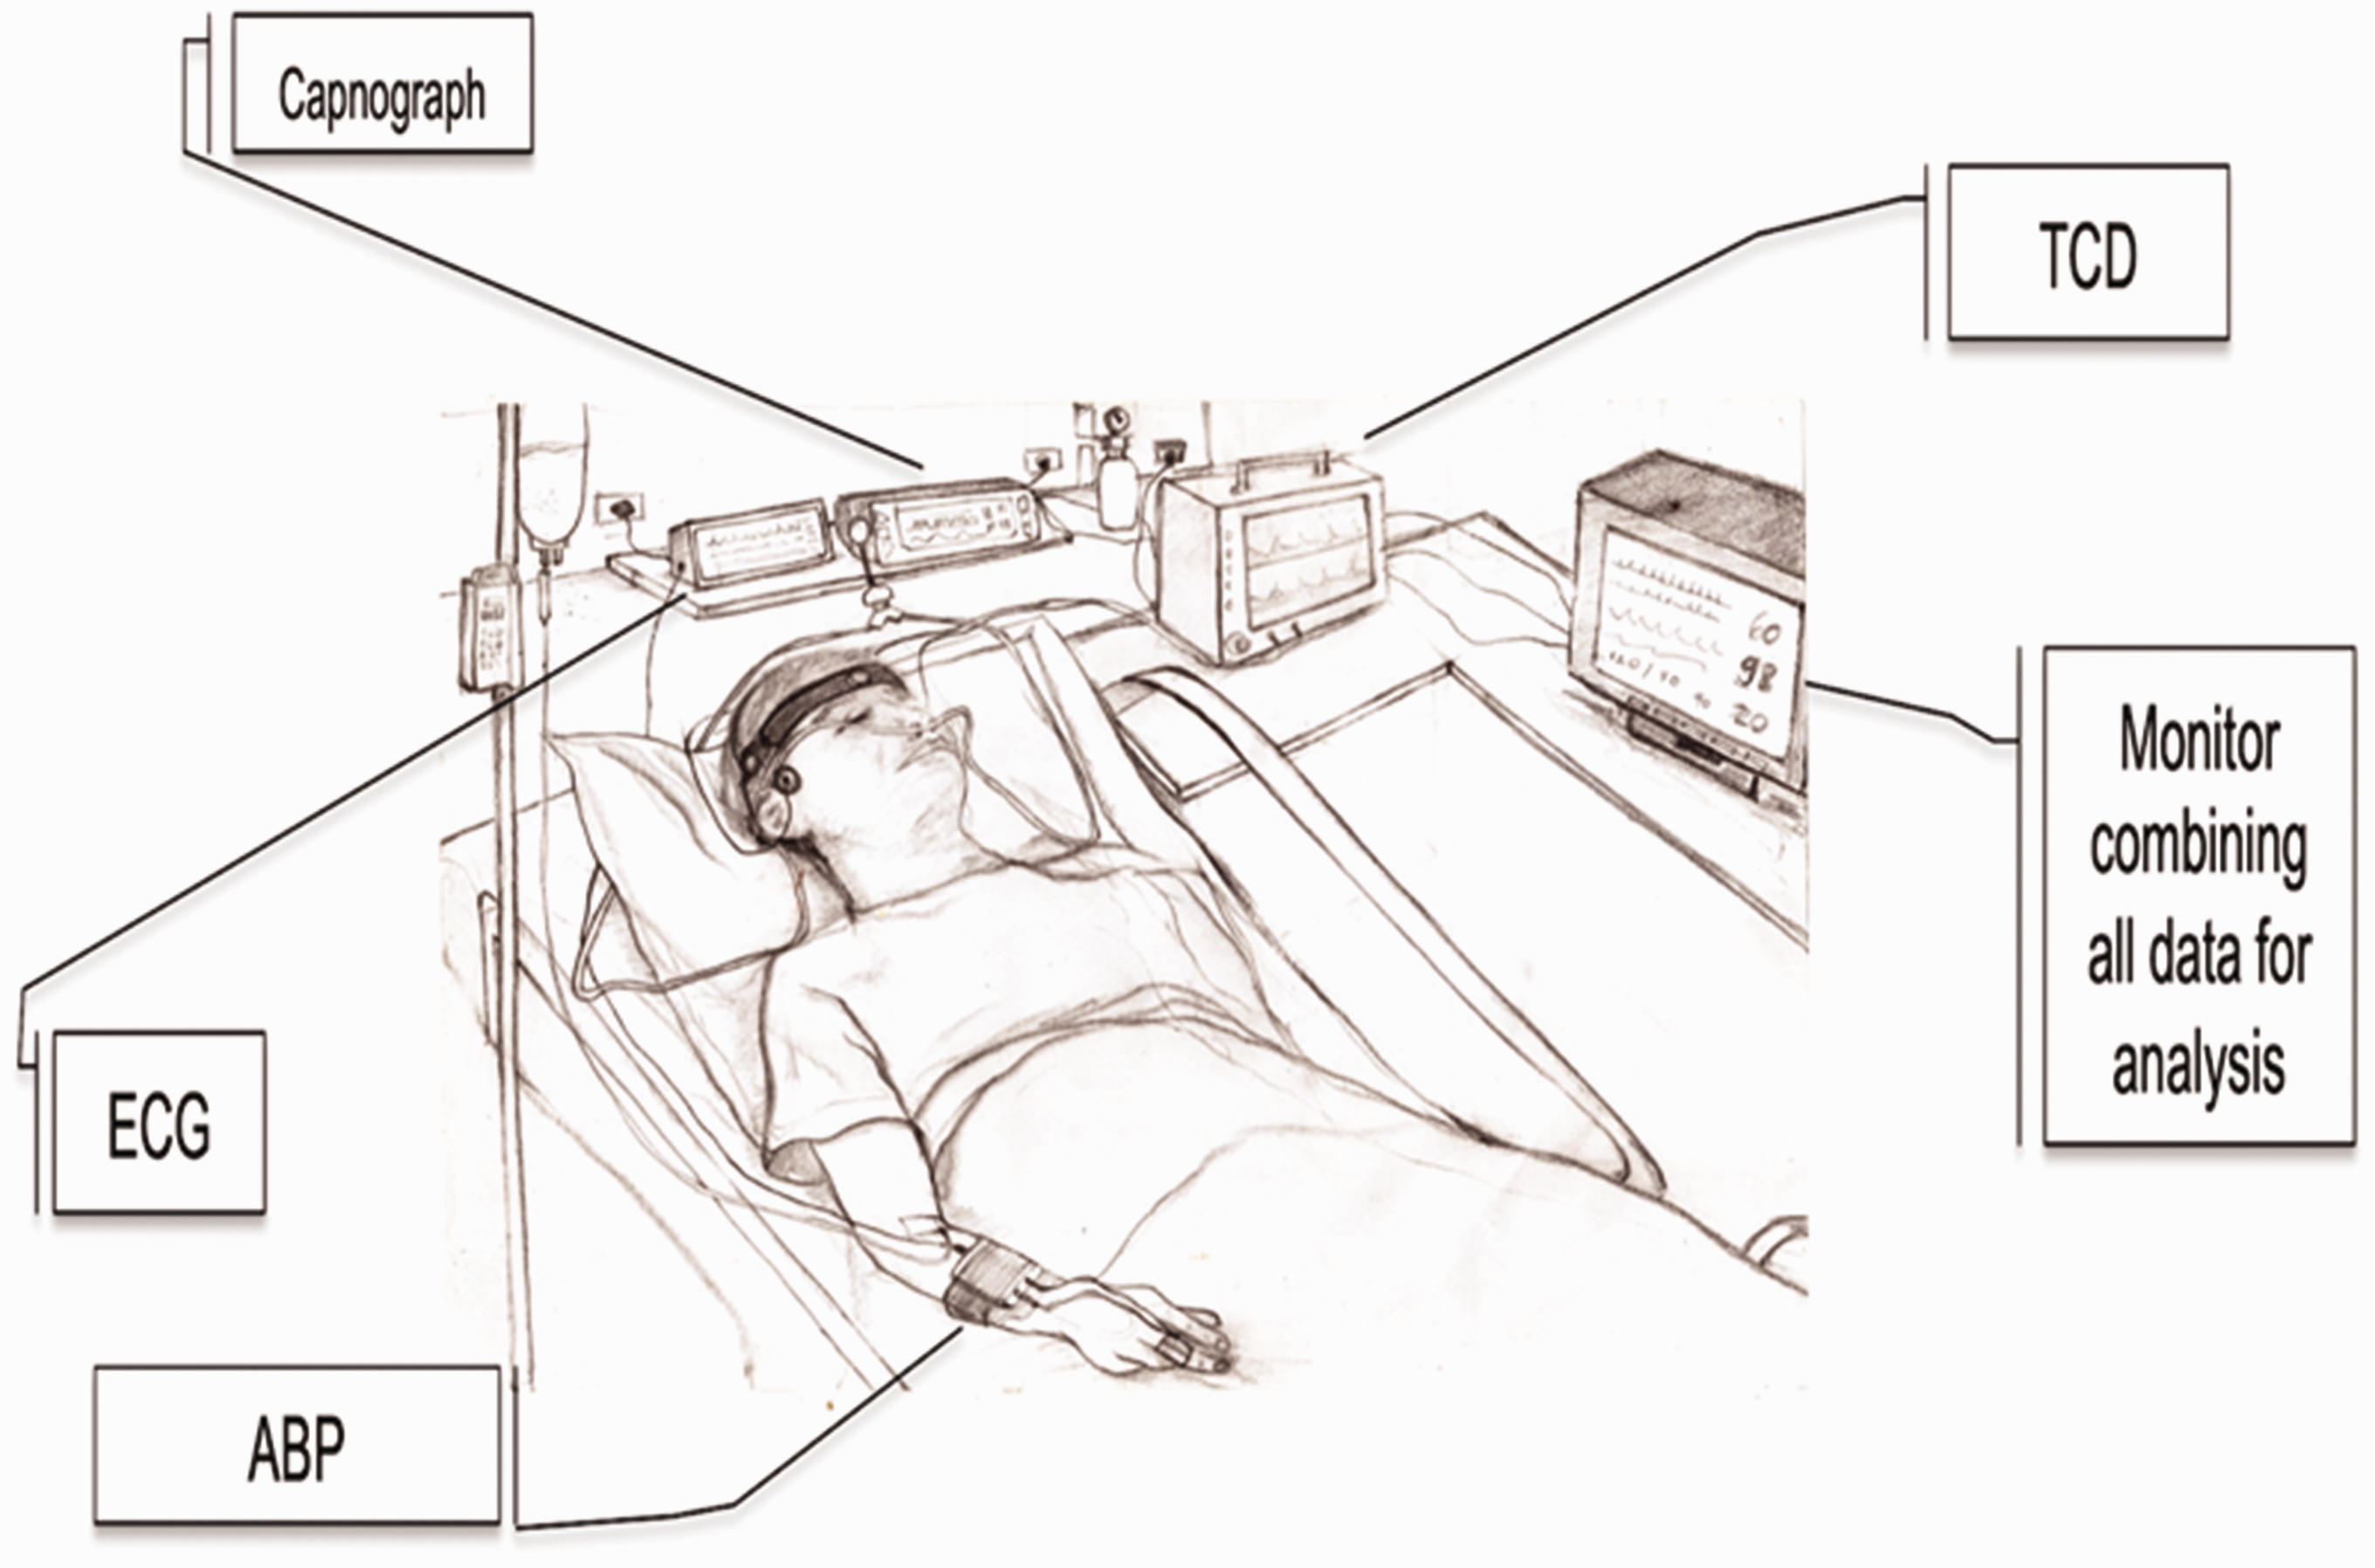
Typical set of recordings in a clinical setting. See new Recommendation 20 for details about particular aspects affecting studies of dCA in critically ill patients. TCD: transcranial Doppler ultrasound device; ECG: electrocardiograph; ABP: either non-invasive continuous arterial blood pressure (finger photoplethysmograph sensor combined with arterial volume clamping), or invasive intra-radial catheter sampling in critical care settings.
Importantly, delays which are secondary to equipment processing steps, such as the fixed 1-s output delay of the Finometer® reconstituted brachial artery BP signal, need to be considered and corrected. It is essential to take these delays into account when synchronizing BP and CBF (and other signals) prior to analysis. In addition, inaccuracies need to be considered. The accuracy of the signal output from devices providing continuous non-invasive BP measurements is often unreliable. 30 More consistent results can be obtained by recalibrating signals using systolic and diastolic readings from brachial sphygmomanometry. Non-invasive BP may also be subject to signal drift over extended-duration acquisitions, which can be minimized using a servo-controlled finger-clamp calibration at the cost of a periodic loss of data.
Cerebral and systemic haemodynamic variables, as well as markers of dCA, are strongly dependent on partial pressure of arterial carbon dioxide (PaCO2).1,31–34 Non-invasive estimates of PaCO2 are usually derived from measurements of end-tidal CO2 (EtCO2) with infra-red capnography or mass spectroscopy. Scrutiny of fluctuations in PaCO2 (or EtCO2) during continuous measurements should be exercised in all studies to account for the confounding effects of hypo- or hypercapnia, which are particularly apparent in some protocols.31,34,35 As with CBF and BP, as noted above, consideration for delays and/or inaccuracies in the capnograph output, dependent on the nature and complexity of the gas sampling system, is necessary (e.g., mouthpiece/facemask, connectors, tubing length/calibre, pump speed, processing delay). While donning a facemask tends to amplify EtCO2, as compared to nasal cannula CO2 sampling for example, this was not seen to influence TFA measures of dCA. 36 Recordings with large fluctuations or unwanted step changes in CO2 should be discarded to avoid adverse interference in TFA results (see Supplementary Material). The stability of CO2 during normo-, hyper-, or hypocapnia can be improved with the use of end-tidal forcing, but it is important to discard transient changes until a steady-state is achieved.31,37,38 Moreover, body position is also relevant, since ventilation increases in the upright position and EtCO2 will show a reduction compared to PaCO2. 39 A need remains for evidence to inform standardization of protocols and analytical methods for the study of dCA in both hypercapnic and hypocapnic states.
In certain clinical conditions (e.g., subarachnoid hemorrhage and traumatic brain injury), raised intracranial pressure (ICP) can disrupt the relationship between BP and CBF.40,41 If measured, mean ICP should be reported. While agreement between TFA parameters derived from either CPP (calculated directly as mean ICP subtracted from mean BP) or BP alone exists, 42 further investigation is warranted.
Representative recordings of CBv, BP and airway CO2 partial pressure are shown as Supplementary Material, illustrating what is considered ‘good quality data’, as well as recordings showing typical artefacts, noise or signal loss in situations where further editing can lead to acceptable data. Examples are also provided of data that cannot be accepted for further analyses.
Duration
Recordings of spontaneous fluctuations of arterial blood pressure and cerebral blood flow for transfer function analysis should last a minimum of 5 min, assuming stationary physiological conditions and uninterrupted good quality data.
A recording length of at least 5 min is required to stabilise estimates of the transfer function phase in the low-frequency band 43 and provide adequate frequency resolution. Longer recordings may not lead to further improvement. For example, dCA metrics are not altered when extending a recording to 10 min. 44 While this recommendation is a corollary of the technical specifications described in Recommendations #11 and #12 (below), the duration may be adjusted for some patient groups and/or experimental conditions (Recommendation #20). For example, in the neuro-intensive care unit, a longer duration (7 min) has been recommended, 45 whereas in patients with acute ischemic stroke (AIS), a reduction from 5 to 3 min has been shown to be acceptable when longer recordings are not achievable. 46 Consideration should be given to the stability of recordings in specific patient groups, and any reduction in duration should be accommodated by the use of windows of less than 100 s in the Welch method (Recommendation #11). 47 Recordings with a duration of <5 min have also been considered with protocols that induce dynamic changes in BP rather than relying on spontaneous fluctuations (Recommendation #19).48,49
Sampling frequency
For analog-to-digital conversion of the continuous physiological signals, a minimum sampling frequency of 50 Hz is recommended, following appropriate anti-aliasing filtering, typically with a low-pass frequency cut-off at 20 Hz.
Procedures for analog-to-digital conversion of acquired signals and treatment of cardiovascular data are well established24,50 and remain the recommended approach.
Data pre-processing
Hemodynamic signal format
Input to transfer function analysis models should be beat-to-beat data rather than raw waveforms.
The use of beat-to-beat data is less sensitive to short segments of missing data,24,50 and remains the recommended approach, subject to the considerations in the Recommendation #6.
Visual inspection and replacement
Both raw and beat-to-beat signals should always be visually inspected prior to analysis to ensure they are free from excessive noise and artefacts. Short periods (up to three beats) of large artefact, where the physiological waveforms are distorted, should be removed and replaced by interpolated values; linear interpolation is recommended. It is advisable to reject recordings with large trends that could suggest drifts in the blood pressure recording (either invasive or not), or fluctuating physiological conditions, such as transient hypercapnia or hypocapnia.
Examples of excessive noise and artefacts are provided as Supplementary Material and have also been published in the literature (Figure 2 in and Figure 4 in 51 ). Simultaneous visual inspection of BP and CBF signals is often helpful in distinguishing artefacts from true physiological signals. Interpolation through short segments of noisy data (or missing data, for example due to physical artefacts in finger arterial volume clamping BP signals) does not affect TFA parameters. 50 Ectopic beats, however, can be included in the analysis. 52 The maximum number of contaminated beats that can be reliably replaced by interpolation is not yet known. The loss of <10 s in the recording for analysis within the 0.03–0.07 Hz frequency band appears to be acceptable, whereas loss of 5 s every 50 s in the 0.07–0.5 Hz frequency band leads to unreliable results. 50 Different TFA parameters (gain, phase, coherence – see below) may exhibit different degrees of sensitivity to missing data. 50 Large artefacts in BP have been shown to lead to bias in autoregulation index (ARI) estimates; 53 comparable bias may be expected in TFA parameter estimation, though this has not yet been systematically assessed. When excessive artefacts persist for longer periods, the data segment should be excluded from analysis (see Supplementary Material).
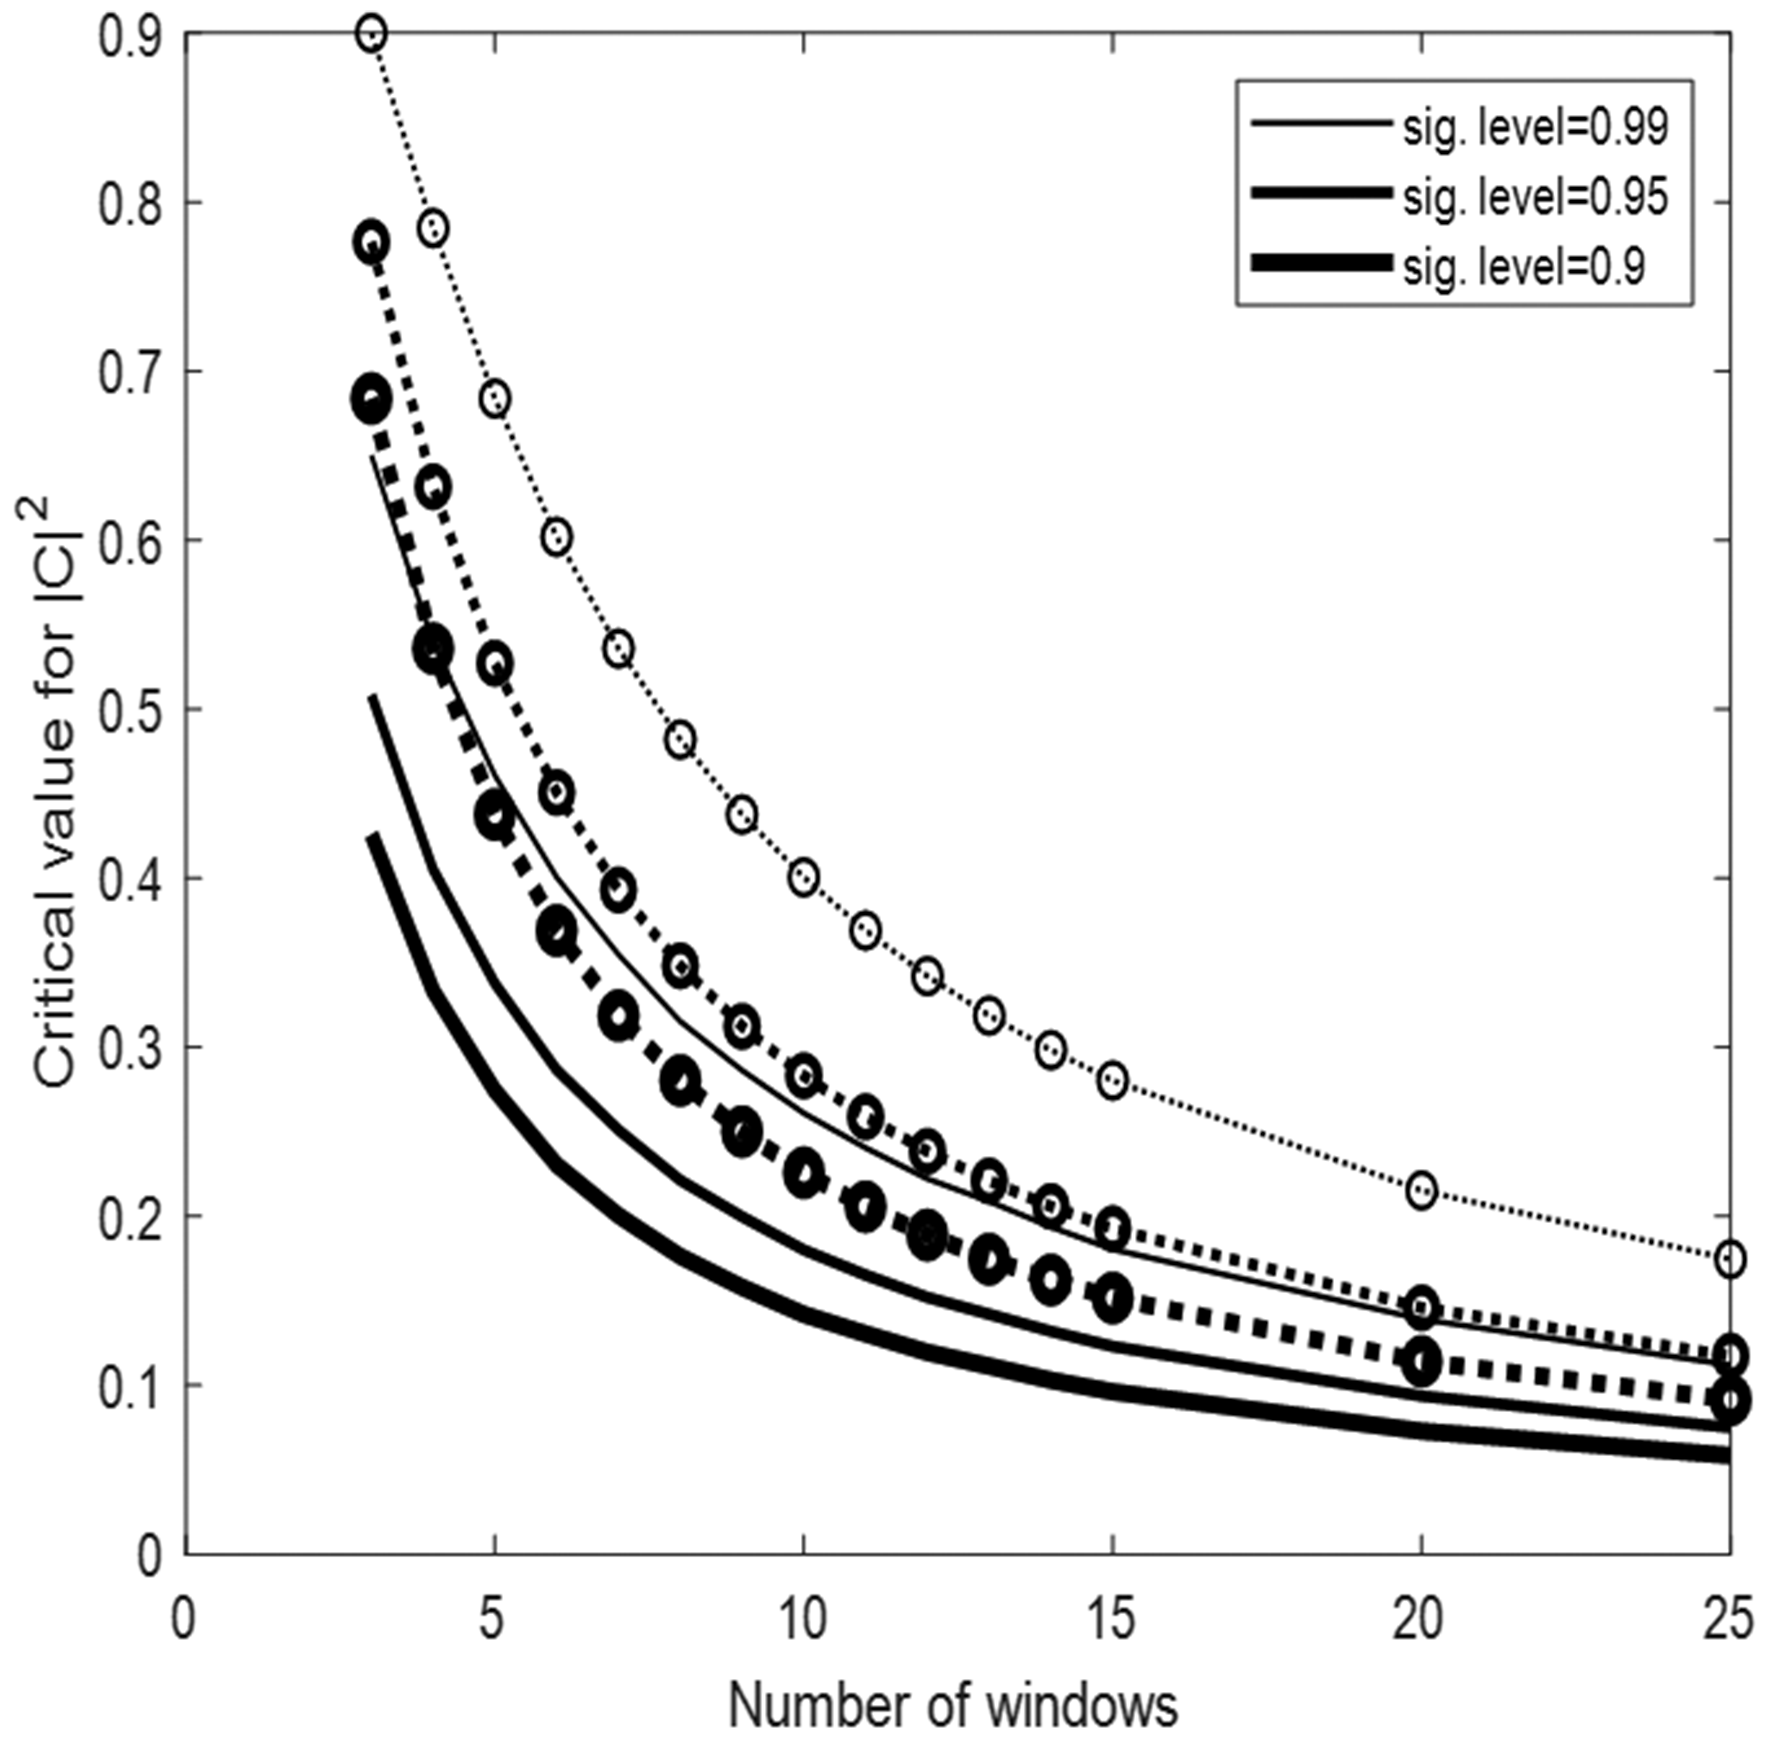
Critical values for coherence estimates at the 99%, 95% and 90% significance level for 3–25 windows. Solid lines: Monte Carlo simulation from 10,000 pairs of independent white Gaussian noise using Hanning windows with 50% overlap and spectral smoothing (see Table 2). The dotted lines give the critical values without spectral smoothing and with non-overlapping windows, calculated from theory. The line-thickness denotes the significance level.
Resampling and interpolation
Linear interpolation through beat-to-beat data should be used to create equidistant time intervals for implementation within TFA, though cubic spline interpolation is also feasible. Visual inspection of interpolated signals is strongly recommended, particularly in the case of spline interpolation which can lead to the insertion of large overshoots. For mean beat-to-beat physiological signals, the minimum re-sampling frequency should be 4 Hz.
TFA supposes equidistant data points. No differences in TFA parameters were observed when comparing different types of beat-to-beat interpolation. 13 This recommendation aims to produce greater standardization and to prevent potentially distorted results at higher heart rates.
Detrending
Detrending or high-pass filtering of signals prior to TFA should be avoided. The removal of mean values, however, is recommended to minimize spectral leakage.
This advice aims to produce greater standardization and remains the recommended approach. Detrending reduces the amount of low-frequency power by removing any linear or non-linear trends from the data. These trends may have prognostic and/or diagnostic value in clinical applications that has yet to be elucidated. While no difference in TFA outcomes was observed following multiple detrending procedures (i.e., no detrending, linear trend removal, and third-order polynomial detrending), 13 these procedures were tested using computer-generated (synthetic) data in which the input-output relationship was purely linear and no noise was present. This may explain why neither benefits nor disadvantages of detrending were observed, as may be the case for signals recorded in human subjects. Furthermore, detrending will remove very low frequencies that will primarily lie below 0.01 Hz. As it is recommended to exclude frequencies below that range for TFA (see Recommendation #13), this could explain why detrending has no clear effects on the outcome. Additional studies using synthesized data with added noise, including signal drifts, should be performed to confirm these observations.
Filtering
Low- or high-pass filtering of signals prior to TFA should be avoided.
This advice aims to produce greater standardization and remains the recommended approach.
TFA methodology
The dominant technique in the literature for calculation of the auto- and cross-spectra used for TFA is the fast Fourier transform, combined with Welch’s method 54 to improve statistical reliability. This involves averaging spectral estimates from separate data segments, which can be overlapped by variable degrees of superposition to adjust the degree of smoothing. The need for standardization of parameter settings and their accurate reporting remains paramount for reproducibility and reliability amongst TFA studies. These settings are described in Recommendations #10-16 and are summarized in Table 1.
Standardized TFA parameter settings.
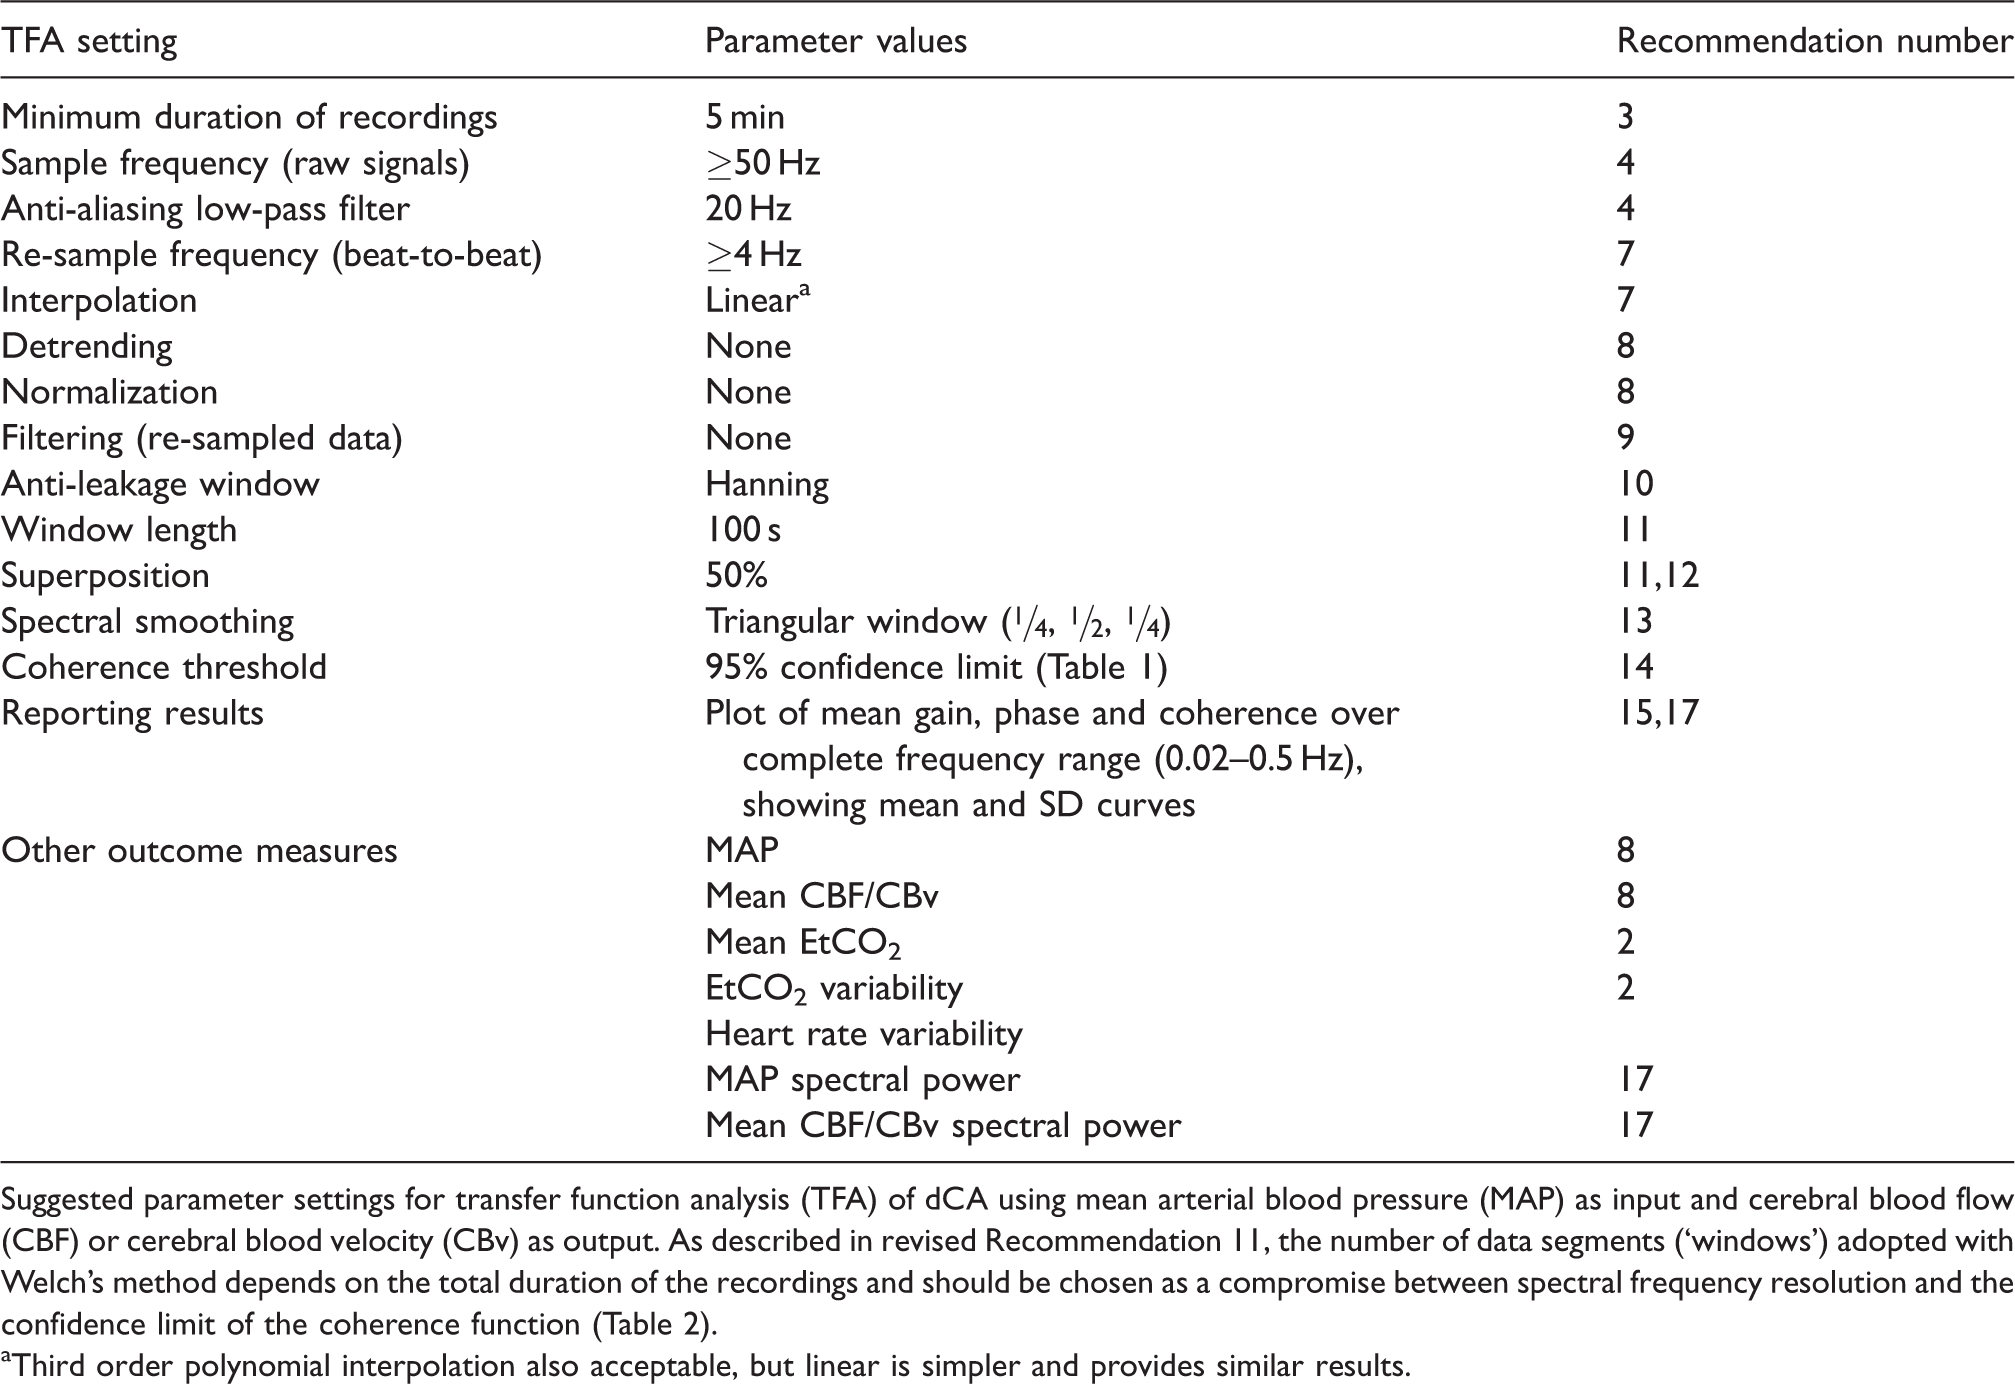
Suggested parameter settings for transfer function analysis (TFA) of dCA using mean arterial blood pressure (MAP) as input and cerebral blood flow (CBF) or cerebral blood velocity (CBv) as output. As described in revised Recommendation 11, the number of data segments (‘windows’) adopted with Welch’s method depends on the total duration of the recordings and should be chosen as a compromise between spectral frequency resolution and the confidence limit of the coherence function (Table 2).
aThird order polynomial interpolation also acceptable, but linear is simpler and provides similar results.
Windowing
The Hanning window procedure should be implemented to minimize spectral leakage and provide robust spectral estimates.
Overlapped, tapered windows (Welch method) and spectral smoothing are used to provide robust spectral estimates, while controlling spectral distortion.13,24,54 The standardized use of the Hanning window remains the recommended approach.
Window length
To allow sufficient frequency resolution, use window segments with a minimum length of 100 s. When recordings longer than 5 min are available, it is preferable to increase the number of windows, rather than the length of individual windows when using the Welch algorithm.
The frequency resolution of TFA estimates (
Number and superposition of data segments
A superposition of approximately 50% for overlapping data segments in conjunction with Welch’s method should be used.
Varying the degree of superposition, using percentages of 25, 50, and 75%, does not affect the outcomes of TFA, 13 with 50% being the most common degree of superposition reported in the literature. The use of 50% overlap remains the recommended approach.
Spectral smoothing
Both auto- and cross-spectra should be smoothed using a triangular window with coefficients [¼, ½, ¼].
This remains the recommended approach. Spectral smoothing improves the reliability of TFA-estimated parameters and reduces the threshold for statistical significance of coherence (Table 2 and Recommendation #14).
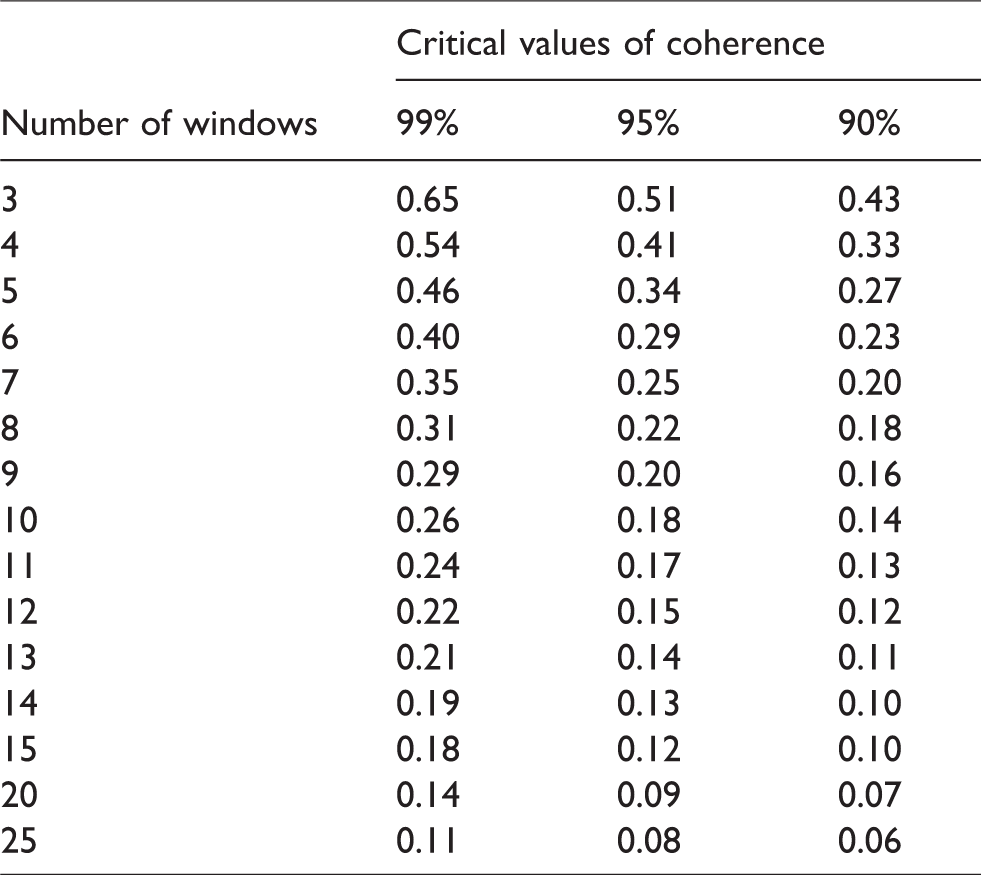
Calculated cut-off values (critical values) for coherence as a function of the number of windows adopted for data segmentation with Welch’s method at the 99%, 95% and 90% significance levels. All other settings for the Welch method followed the values suggested in revised Table 1.
TFA reporting
Coherence function
When calculating average phase and gain within different frequency bands (Recommendation #17), those frequencies in which coherence does not exceed the critical values should be excluded from averaging. Defining a threshold value for coherence to decide on subsequent rejection of data must be guided by calculation of the statistical significance of the coherence function. Table 2 provides the confidence limits (or more strictly the critical values) for coherence as a function of the number of windows. Due to the influence of the degrees of freedom, a fixed threshold for acceptance of coherence, such as 0.5 as is often seen in the literature, can lead to some frequencies being erroneously included or rejected in the analysis and should not be used. If coherence is persistently low (i.e., not significant) across all frequency bands, the recording should be excluded from analysis, as poor data quality and thus unreliable results are expected.
At each frequency, coherence expresses the fraction of output variance (usually mean CBv) that can be explained by the input variance (usually mean BP) using a linear model, similarly to the concept of a correlation coefficient. Readers who are new to TFA in studies of dCA are referred to the original white paper,
7
or more specialised literature.24,55–57 The key points to consider are:
Statistically significant coherence should be present when considering estimates of gain, phase, or other dCA parameters, such as the ARI. Significance is usually based on constructing a null-hypothesis (absence of a linear input-output relationship), with confidence limits set at the 95% level. Both theoretical analysis and simulations using surrogate data demonstrate that the distribution of coherence depends on the degrees of freedom of spectral estimates (e.g., number of window segments, amount of spectral smoothing, window overlap).12,24,56 This will subsequently be reflected in the confidence limits adopted for their acceptance. Figure 2 and Table 2 both demonstrate the effect of data segmentation for Welch’s method on critical values for coherence and provide the reader with quantitative thresholds that can be incorporated into their study. These values apply to single harmonics (individual frequency points within a frequency band). Coherence is reduced in the presence of: noise (low signal-to-noise ratio), a non-linear input-output relationship. In the very low frequency range (<0.07 Hz), the BP-CBF relationship becomes non-linear (due to large time-varying changes in arterial diameter, which dynamically modify hemodynamic resistance). Consequently, coherence values will tend to be lower, despite a strong response of CBF to changes in BP.
58
other variables influencing the output variable (e.g., changing PaCO2).
Units of measurement
The phase of TFA should be reported in either degrees or radians. Estimates of gain obtained by TFA, when included, should be expressed in both absolute units (cm · s−1 · mmHg−1) as well as percentage changes (% · mmHg−1 or %/%) to aid comparison with other published studies.
The coherence function is dimensionless and assumes values between 0 and 1. The literature shows an almost equal divide between the use of radians or degrees for phase estimates.
9
Changing from one to the other is straightforward:
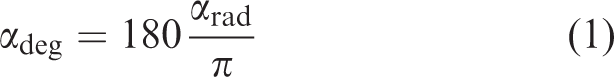
One of the major benefits of using phase or ARI to express CA efficacy (Recommendation #18), rather than gain from TFA, is that they are determined from the time-delay between BP and CBF, and thus insensitive to any amplitude scaling. This removes the risk of change in autoregulation being confounded by a change in scale of either physiological variable. A recent meta-analysis of dCA following stroke 17 showed that phase displayed stronger changes than gain, providing further evidence for this recommendation. Furthermore, several studies have calculated confidence intervals on phase estimates55,62 from individual recordings. This can aid in drawing inferences on any changes in dCA, especially when monitoring changes over time in individual patients. Phase is also less sensitive to missing data compared to gain. 50 Phase appears to be a more reliable measure of dCA than gain in clinical studies,17,27,62 although gain is extensively used. In the absence of studies comparing the clinical interpretation of the two different units of gain usually adopted, inter-centre comparisons will be facilitated by reporting gain both in units of cm · s−1 · mmHg−1 and % · mmHg−1.
Phase wrap-around
Inclusion of phase ‘wrap around’ values into averages of multiple harmonics will introduce considerable distortion and should be avoided.
This remains the recommended approach. When negative values of phase are detected for frequencies <0.1 Hz, these should be removed from any averages over the VLF or LF frequency bands. Smaller negative values of phase are to be expected for frequencies above 0.1 Hz and do not need to be removed when producing averages for the HF band. When negative values of phase <0.1 Hz are present, we advise to check the data for errors (e.g. in signal synchronisation).
Frequency bands
Presenting the complete frequency dependence of coherence, gain and phase in the range 0.02–0.5 Hz, as mean and standard deviation values, is important when reporting TFA results. Until further evidence is available, statistical analyses should be based on averaged values within the very-low-frequency (0.02–0.07 Hz), low-frequency (0.07–0.2 Hz) and high-frequency (0.2–0.5 Hz) bands.10 Ideally, the population spectral power density of BP and CBF should also be given at each frequency. Specific averaging methods such as weighting of individual values within bands should be presented separately, and the method(s) used must be reported clearly. In addition, mean values of BP and CBF and their intra-recording variability should be reported. When using forced oscillations (Recommendation #19), averaging over frequency bands should be replaced by estimates at the frequency of oscillation.
While insufficient evidence is available to justify the choice of specific frequency bands for averaging values of coherence, gain and phase, this recommendation aims to improve standardization. The recommended bands are widely adopted for the respective cut-off frequencies; however, alternative choices should not be discouraged if evidence is provided. 56 Indeed, other choices of frequency band limits exist, e.g., the upper frequency limits of dCA can range between 0.094 ± 0.040 Hz during hypercapnia, and 0.167 ± 0.036 Hz during hypocapnia. 63 Moreover, individual harmonics, which behave as independent samples, can be combined in different ways for statistical testing, but note that statistical independence will be affected by the degree of spectral smoothing.11,34 The lower cut-off frequency of 0.02 Hz was chosen because, in most cases, no reliable estimates of phase and gain between BP and CBF are possible below this frequency as the BP-CBF relationship becomes increasingly non-linear.58,64,65 If authors have data with high spectral resolution from data segments longer than 5 min, 6 and are confident that they can provide estimates for lower frequencies, these can be provided in addition.
Alternative metrics
Step response
Checking the temporal pattern of the CBF step response is recommended to improve the reliability of TFA in studies of dCA.
In addition to the use of gain and phase for individual harmonics, or averaged over selected frequency bands (Recommendation #17), the information contained in the frequency spectrum can be integrated in the form of a CBF response to a hypothetical step change in BP. Estimation of the CBF step response is usually performed with the use of the inverse fast Fourier transform, to obtain the impulse response, followed by numerical integration. 24 One advantage of the CBF step response is the ability to represent the physiological response that would be expected if BP could be changed nearly instantaneously (Figure 3); something that can only be approximated with maneuvers such as the sudden release of inflated thigh cuffs. 1 From the expected temporal pattern of the step response, it is possible to reject estimates that are not physiologically plausible, either by visual inspection, or subject to using objective criteria. 57 Examples of non-plausible responses to a positive step in BP would be cases where the step response does not show a sharp initial rise, has very large negative values, shows a continuous rise with time, or presents large oscillations in the first 10 seconds of the response. 57
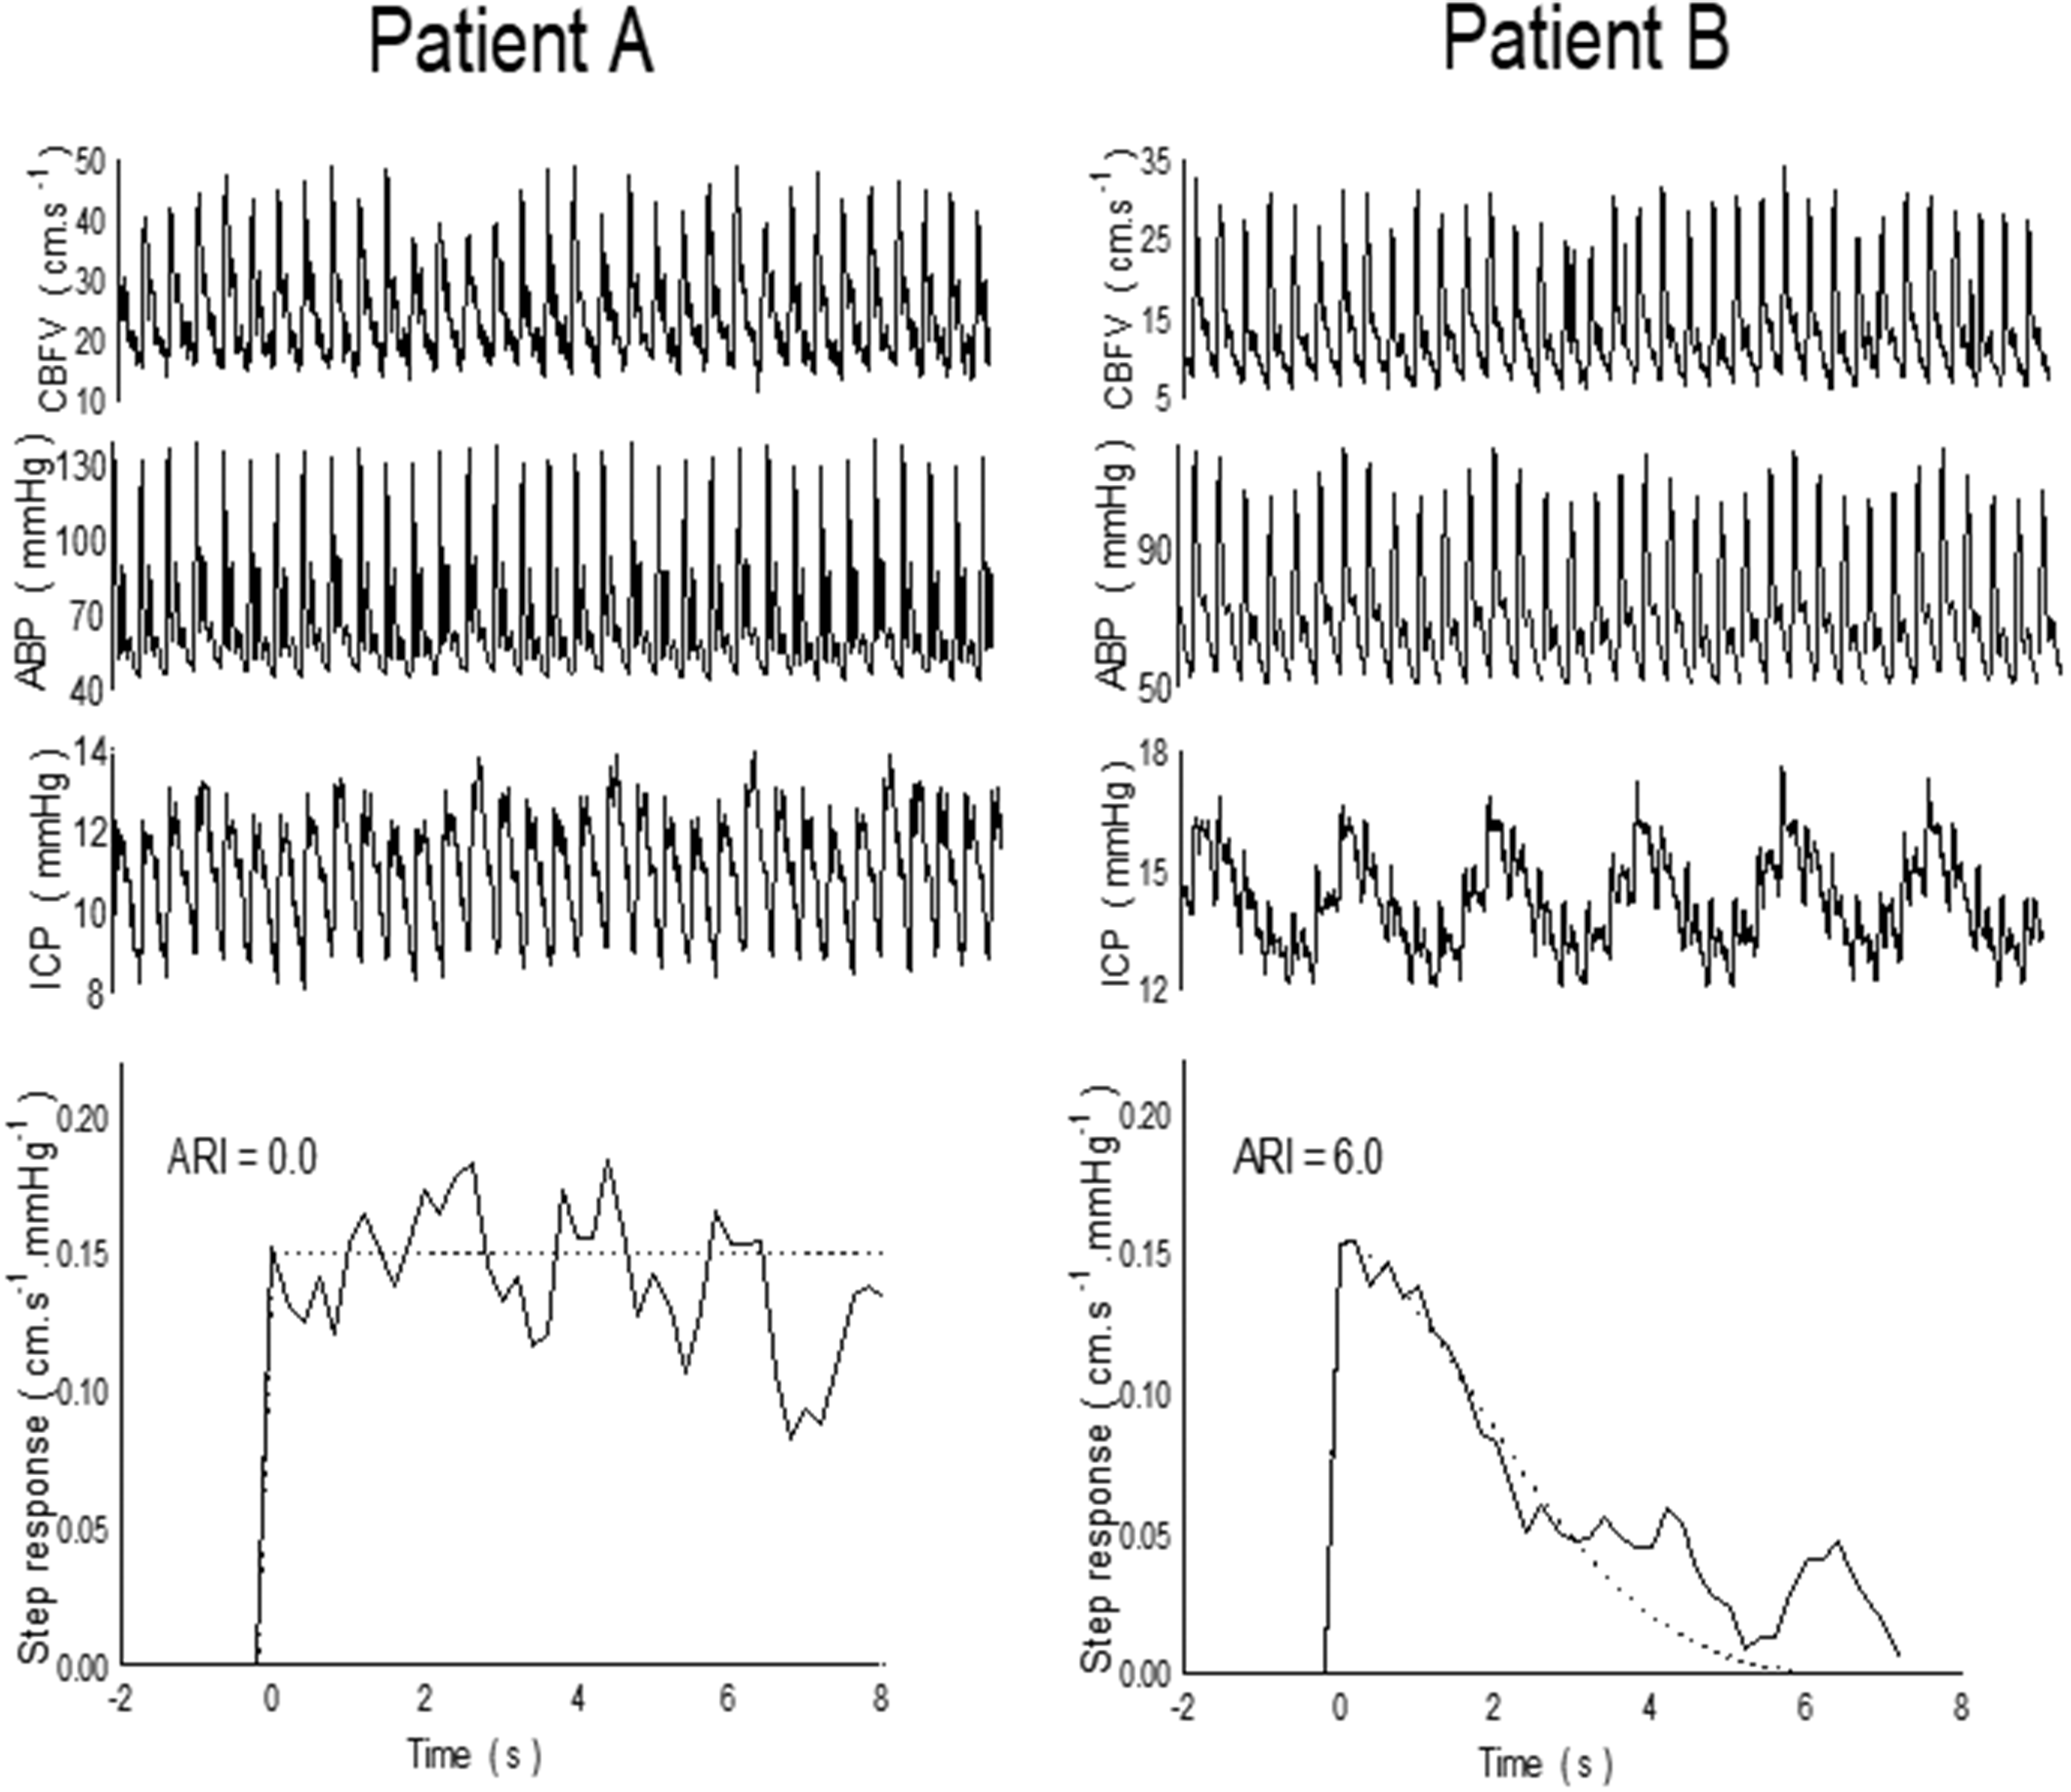
Representative spontaneous fluctuations in CBv, BP and ICP with corresponding CBv step responses from two patients with severe head injury. Patient A did not show a recovery of the step response following the sudden change in BP, with a corresponding value of ARI = 0 (absent dCA). Patient B had a working dCA, with ARI = 6. Reproduced with permission from. 108
Metrics that reflect the speed of recovery can be derived from the CBF step response, thereby expressing the dCA efficiency. Two metrics based on a derived step response include ARI and the rate of recovery (RoRc). The ARI was initially proposed to quantify dCA during a thigh cuff maneuver, 2 but it can also be derived from recordings with spontaneous BP fluctuations 68 or during other maneuvers, such as repeated squat-stands 69 or deep breathing. 70 The RoRc is an index obtained from the first three seconds of the CBF step response, 71 and several studies have demonstrated a close association between estimates of TFA phase, ARI, and RoRc.17,69,72–76 See Recommendation #20 for use of ARI and RoRc in clinical studies.
Alternative protocols
Forced oscillations
When feasible, we recommend forced oscillations in BP as the TFA input to increase the signal-to-noise ratio, compared with spontaneous fluctuations in BP. As with spontaneous recordings, forced BP oscillations should be monitored for a period of at least 5 min, discarding the first 10–30 seconds for stable oscillations to be achieved. When forcing BP oscillations at a fixed frequency, TFA coherence, gain, and phase of the forced oscillations should be sampled at the point estimate of the forced frequency (e.g. 0.05 or 0.10 Hz), instead of choosing the standard frequency bands. In such circumstances, this would supersede Recommendation #17.
In recent years, a number of protocols have been developed to increase the signal-to-noise ratio and coherence between BP and CBF for assessment of TFA phase and gain, such as repeated squat-stands (usually at 0.05 and 0.10 Hz),21,77–83 repeated sit-stands,84–86 oscillatory lower body negative pressure (OLBNP),51,87,88 respiratory-induced oscillations89,90 and passive leg raising. 91 Current evidence suggests that the optimal protocol for inducing mean BP oscillations to increase the input power and enhance the linear interpretability of the TFA parameters is the repeated squat-stand model.21,51 For studies in older adults, or participants unable to perform 5 min of squat-stands, the repeated sit-stand protocol is a good alternative.84,86 By inducing larger swings in mean BP, the OLBNP protocol does improve TFA coherence compared to spontaneous monitoring 51 and the passive leg raise maneuver, 91 and it does not alter PaCO2 if lower magnitudes of LBNP are used. 51 However, OLBNP yields lower TFA coherence values and within-day/between-day reproducibility when compared to repeated squat-stands. 51 Passive methods to force oscillations in BP (e.g. OLBNP) are particularly appealing protocols, however, in situations where repeated squat-stands or sit-stands are not feasible due to mobility impairment, disabilities, or for participant safety (dCA quantification following sympathetic nervous activity blockades). Other protocols exist to force BP in order to characterize the BP-CBF relationship (e.g. random duration squat-stands, 69 random inflation/deflation of thigh cuffs, 92 single thigh cuff deflation, 1 single sit-to-stand,81,82 head-up tilt,93,94 cold pressor test,95–97 hand grip96,98 and the Valsalva maneuver96,99,100). Sympathetic activation caused by some of these maneuvers may affect dCA and confound comparisons between results from different protocols.23,88,96 However, their inherent non-stationarity and short duration (in many cases restricted to one or two oscillations), prevent the utilization of TFA to capture the gain and phase parameters. Other methodological strategies are preferred within the broader dCA literature to quantify the outcomes of these protocols, such as the rate of regulation (RoR) 1 and ARI.2,48,92
Recordings of forced oscillations of mean BP for TFA should last for a period of at least 5 min,48,49 assuming consistent physiological conditions and continuous good quality signals, to ensure that recordings can yield robust estimates of TFA parameters, and to improve frequency resolution (Recommendation #3). Valid and reliable TFA parameters may be drawn from recordings of a shorter length (minimum 3 min), if physiological covariates (i.e., respiratory rate, PaCO2, BP, heart rate, and CBF) are controlled.48,49 Since the peak input power spectral density of BP and CBF occurs in alignment with the forced fixed frequency, the utilization of point-estimates, rather than frequency bands, will increase coherence values and improve the interpretability of the associated phase and gain metrics as shown in Fig. 4 51 . For researchers employing random durations squat-stands, 69 or selecting to alternate squat-stands of 0.05 Hz with 0.10 Hz, it may be justified to avoid the point estimates and perform narrow bands around these frequencies. However, insufficient evidence exists to recommend this to the broader community and more research is warranted. Furthermore, performing TFA across the cardiac cycle (e.g., systole and diastole) may be important for future research investigations, as dCA appears to be more effective in dampening systolic BP oscillations, compared with diastolic and mean BP oscillations (see Table 4 (mean) and Supplementary Table S.1 (systolic and diastolic)).21,23,101,102 Future research is needed to resolve questions around directional differences (responses to increases versus decreases in BP) during augmented oscillations and potential non-linearities driven by the magnitude of forced oscillations in relation to baseline BP.103–105
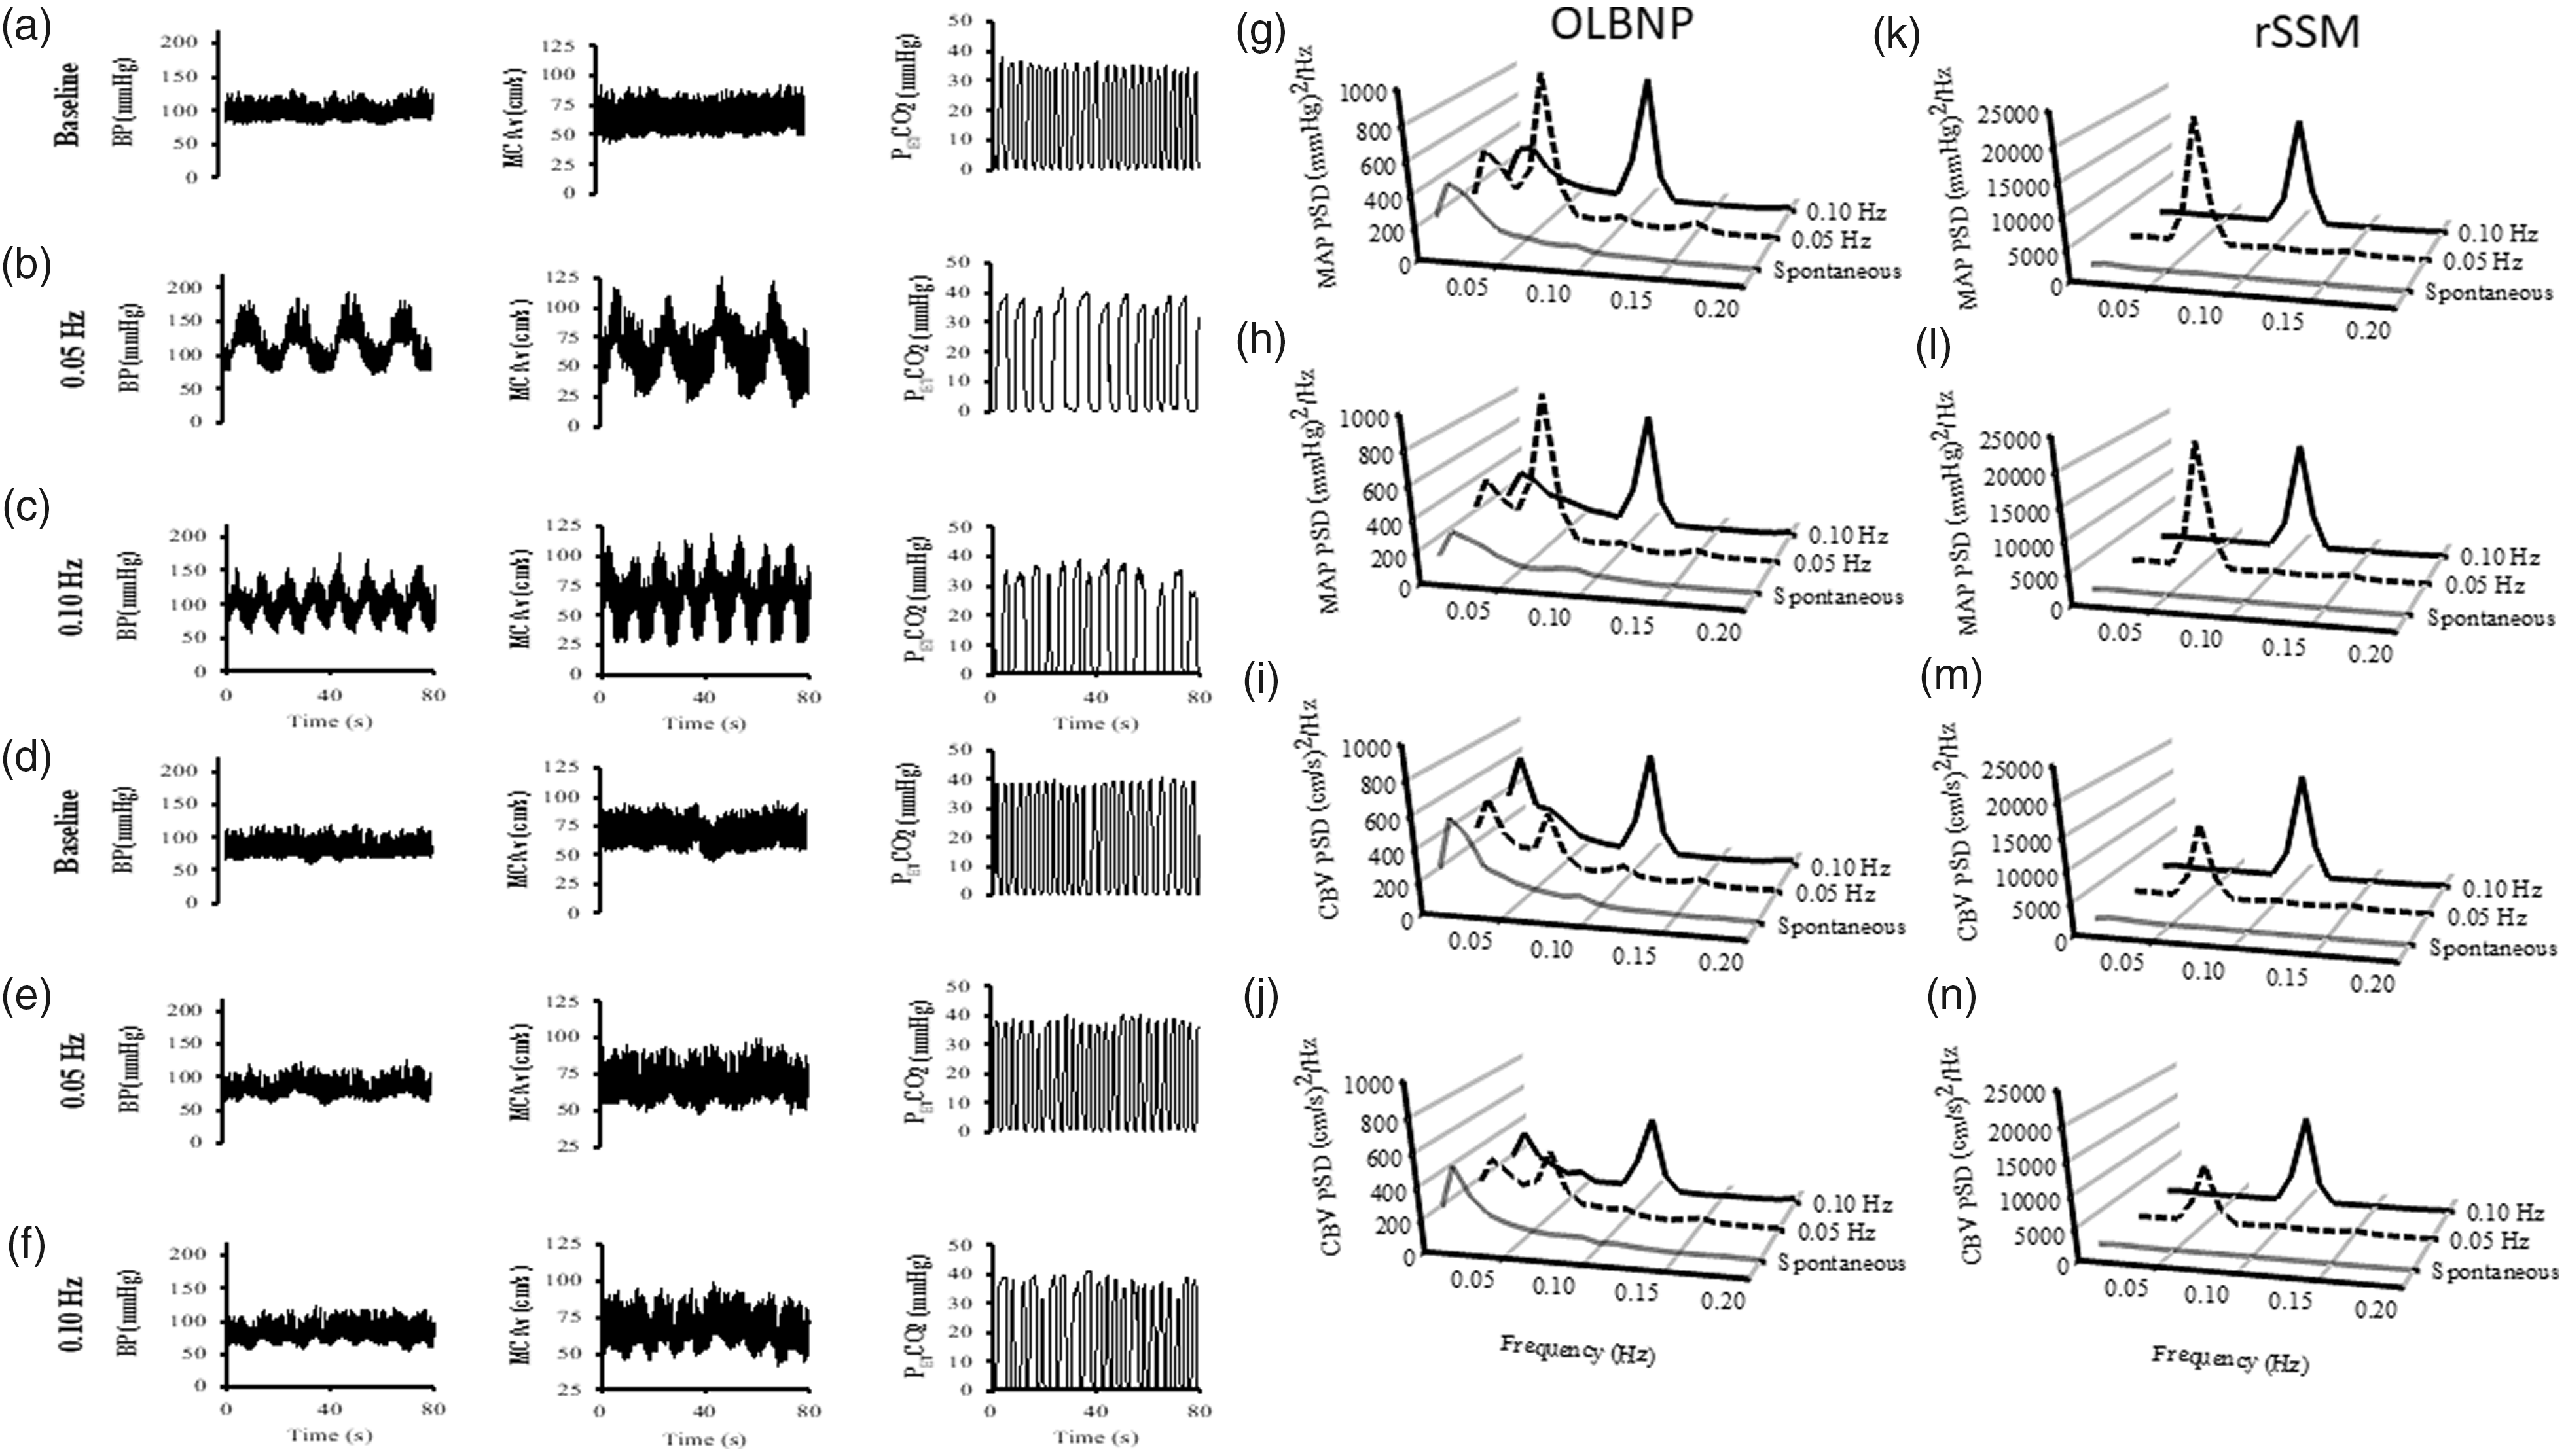
On the left side of the figure are the typical trace for blood pressure (BP), middle cerebral artery blood velocity (MCAv) and end-tidal CO2 (PETCO2) during: spontaneous upright (a), 0.05 Hz (b) and 0.10 Hz (c) repeated squat-stand maneuvers (rSSM), spontaneous supine (d), 0.05 Hz (e) and 0.10 Hz (f) oscillatory lower body negative pressure (OLBNP) maneuvers in a young healthy adult male. On the right side of the figure are the absolute values of the power spectrum densities (PSD) for the mean arterial pressure (MAP) and cerebral blood velocity (CBv) under spontaneous (grey), 0.05 Hz (dashed) and 0.10 Hz (black) conditions. The PSD during the OLBNP pressure maneuvers are represented on the left side (g–j) and rSSM are on the right side (k–n). Note the substantial increase in PSD power during the forced oscillations, with the greatest augmentation (approximately 20x higher peak PSD than OLBNP) clearly delineated for both MAP and CBv occurring during the rSSM maneuvers presented in the far-right panel. Adapted from Smirl et al. 51
Clinical studies/trials
Multicenter clinical trials are warranted to demonstrate the importance of dCA monitoring in clinical practice.
Dynamic CA has been associated with the outcome of many disorders, namely acute ischemic stroke,17,26,106 subarachnoid hemorrhage 26 and trauma tic brain injury,107,108 and has been shown to be intact or depressed in non-neurological diseases, such as hypertension27,88,116 and heart failure. 109 ARI has been shown to be reduced during hypercapnia 32 and hypoxia, 75 and in multiple cerebrovascular conditions such as intra- and extra-cranial disease, 68 vasovagal syncope, 110 acute ischemic stroke,17,106 intra-cerebral hemorrhage,41,76 small vessel disease, 72 severe head injury, 108 pre-eclampsia and eclampsia,73,109 delirium, 112 circulatory shock, 113 and right-to-left shunt.74,76,114 Thus, dCA could be helpful for evaluating individual therapeutic strategies during acute and sub-acute stages of care (e.g., during recanalization therapies 115 and active BP lowering 26 ) but more research is needed. Finally, other non-acute neurological diseases that have already been included in dCA studies are dementia3,117 and Parkinson’s disease. 118
The recommendations in this paper provide general information that should be followed including in clinical settings to guide research in this field; however, fulfilling all requisites in studies on patients with acute disease is obviously challenging. Nevertheless, attempts should be taken to optimally control the environment and minimize the occurrence of undesired stimuli (e.g., avoiding contact with personnel, use of privacy curtains, silence signs). The time of the day should be noted, as well as any conditions departing from Recommendation #1. Furthermore, recordings should be avoided when BP, heart rate and PaCO2 stability is not guaranteed. We emphasize that it is essential to have simultaneous measurements of PaCO2 for correct interpretation of dCA (Recommendation #2) and also report the ventilation status of the patient during the collection (e.g., intubated, O2 supply, pathological respiratory cycle, etc). We highly recommend the reporting of other variables of interest such as ICP (see Recommendation #2), the use of vasoactive drugs, and the existence of hypermetabolic states (e.g., infection/fever, seizures) for a correct interpretation of TFA results. In a critical care setting, it is difficult to acquire good quality measurements for long durations. When this is not possible, for example in agitated patients, shorter segments of data could be used (Recommendation #3). Also, in such populations, data will be more likely to have noise and artifacts, so special attention should be given to data pre-processing (Recommendation #6 and Supplementary Material) and to using appropriate coherence cut-off values according to the recording length (Recommendation #14). If spontaneous BP fluctuations are less pronounced, and induced BP oscillations (Recommendation #19) cannot be adopted, longer duration recordings should be collected. 16 In the presence of cardiac arrhythmia, for example atrial fibrillation, analysis of such data should be performed separately, with comparisons drawn to data collected in sinus rhythm during the same protocol.52,119 In addition, whenever possible, critical carotid stenosis should be acknowledged and included as a co-factor in the statistical analysis. When reporting the results, in addition to all the factors mentioned above, the possibility of narrowing or dilatation of insonated arteries should be noted in the discussion of results, addressing the possibility of confounding.
Alternative models
Time-domain methods
Time-domain methods should be considered as an alternative to TFA when multiple inputs are needed to model changes in CBF. In particular, adding PaCO2 as an additional input is recommended if such measurements are available.
While the use of frequency-domain methods (i.e., TFA) has been more prevalent in the context of quantifying dCA, time-domain methods have been implemented in several studies.70,120–124 Time-domain methods allow for quantification of the effect of additional physiological signals (e.g., PaCO2 or SaO2 when using NIRS)125–127 and non-stationarities. 125 Time-domain methods typically aim at estimating the parameters of a difference equation model that relates the present value of CBF to present and past values of BP using experimental time-series. The corresponding system impulse response and transfer function can be readily obtained from these coefficients. The reader is referred to18,19 for a detailed comparison of time-domain and frequency-domain methods with regards to the reproducibility of measures typically used to quantify dCA, using both simulated 18 and experimental 19 data.
Time-domain analyses have been presented using both finite impulse response (FIR) (or moving average, MA)121,124,125 models and autoregressive (AR) models with exogenous inputs (ARX).70,120,122–124 The former aim at explaining CBF fluctuations using past values of BP only, while the latter also include past CBF values. According to time-series modelling and systems identification literature, it is strictly, however, more correct to refer to models that include past CBF and BP terms as ARX, instead of ARMA. The main reason for using ARX rather than FIR models is that it typically reduces the number of the required free parameters, which can be rather high in the case of FIR (or MA) models with a long memory. On the other hand, expanding the unknown impulse response function in terms of a suitable set of basis functions (e.g., Laguerre functions 125 or principal dynamic modes 128 ) also reduces the number of free parameters in the case of FIR models and, due to this reduction, may yield more robust results in low SNR environments, as well as in the case of models with two or more inputs. Note that basis expansion models can be readily extended to non-linear models, though in this case the minimum duration of the required experimental data would likely increase, compared to what is recommended for performing linear analyses.
Selecting an appropriate model order is crucial and should be done using a statistical criterion (e.g., Akaike or Bayesian Information Criterion) or cross-validation. Previous studies that used ARX models have reported orders ranging between 1 and 2 for the AR component (number of past CBF values),70,120,123 as well as orders between 3 and 5 for the exogenous input component (number of past and present BP values).70,120,127 A wider range for both the AR (between 2 and 9) and exogenous input (between 4 and 9) orders was reported in the recent CARNet study on dCA measure reproducibility. 19 The same study reported that ARX-derived measures were the most reproducible among all examined time-domain methods, yielding similar reproducibility to TFA, even though all methods exhibited relatively low reproducibility, which was likely due to physiological variability and time-varying behavior. 19
Alternative measurement techniques
Research to further validate the use of alternative imaging approaches to that of TCD will benefit our understanding of dCA and is warranted.
When intracranial arteries cannot be insonated with TCD, mainly due to poor temporal windows, often associated with age or ethnicity,129–132 alternative methods for CBF estimation should be considered. Alternative options to TCD that have been used to date for dCA assessment have included both near infrared spectroscopy (NIRS) and magnetic resonance imaging (MRI), while longer term monitoring of dCA in patients with severe head injury has been done via the invasive monitoring of ICP and MAP.108,133 However, readers should be aware of the indirect nature of CBF outcome measures that some alternatives utilise (e.g., blood oxygenation-level dependent-MRI as an index of local blood flow 134 ), differences in waveform morphology between measured vasculature sites (i.e., TCD vs. NIRS, see 135 ), and the strengths and weaknesses of the different CBF signal acquisition modalities. 136 A new optical modality, diffuse correlation spectroscopy (DCS), is also showing considerable promise. 137
NIRS-based approaches have provided the most extensive literature currently available with respect to potential alternatives to TCD. Several studies have utilised NIRS to assess dCA and applied the TFA approach.4,135,138 However, while a recent validation study, 116 comparing NIRS- and TCD-derived markers of dCA, highlighted the potential utility of NIRS, the correlation between the two modalities was relatively low and the NIRS-derived data exhibited limited ability to discern differences between the cohorts used in this study (younger and older controls, hypertensive patients, and cognitively impaired patients). When using this modality, considerations around the effect of differences in waveform morphology and temporal characteristics between the macro- and microcirculation on TFA phase metrics in the very-low-frequency and low-frequency bands are paramount. NIRS-derived oxyhemoglobin-deoxyhemoglobin (oxyHb-HHb) estimates of dCA become more similar to TCD-derived estimates if corrected for transit time and the balance between blood flow and blood volume oscillations. 135 These correction parameters can be estimated from the oxyHb/HHb phase difference spectrum in the high-frequency band. 135 Perhaps unsurprisingly, repeated sit-to-stand transitions appear to improve the reliability of NIRS-derived estimates of dCA, with their correlation to TCD-derived dCA also becoming stronger. 116
In contrast to NIRS, the assessment of dCA using MRI remains a developing area of research. MRI-based studies of dCA based on spontaneous fluctuations of BP and CBF are problematic due to the difficulty of performing simultaneous measurements near the magnet. Instead, alternative BP perturbation protocols have been tested, with thigh cuff release the most common to date, combined with the use of the rate of return as a marker of dCA efficiency.139,140 More recently, commercial devices, e.g., the CareTaker (Biopac) 141 or a modified and shielded Finometer NOVA, 5 have been tested for the non-invasive continuous measurement of BP inside the magnet that can be assessed alongside real-time MRI-derived measures of CBF, but further studies are needed to demonstrate agreement of dCA estimates with those obtained using TCD, and to validate the accuracy of the BP measurements, for absolute BP and for detecting BP oscillations. Consequently, there are limited studies available to support any recommendations at the present time, particularly with respect to the use of TFA on spontaneous measurements. For MRI studies, the recommendation for concurrent measurement of PaCO2 (or EtCO2) (Recommendation #2) is particularly relevant, as participants may experience anxiety due to the enclosed nature of the head coil and bore of the magnet, causing spontaneous hyperventilation or irregular breathing that leads to a hypo- or hypercapnic state.
Normative data and thresholds
Studies should include a properly matched control group to compare results. In addition to variables described in Recommendations #1 and #2, the interpretation of dCA metrics should consider age, sex, cardiorespiratory fitness, and other phenotypical characteristics until more detailed population data are available.
There are insufficient data to establish reference and normative values for TFA parameters. Normative data on healthy subjects have been published,21,23,51,101,102,142,143 but these have come from only a few centers which limits the external validity of the results. Despite this limitation, the mean and standard deviation of pooled data for each of the TFA parameters and ARI are presented in Tables 3 and 4, respectively, and could be used as a preliminary reference for dCA studies.
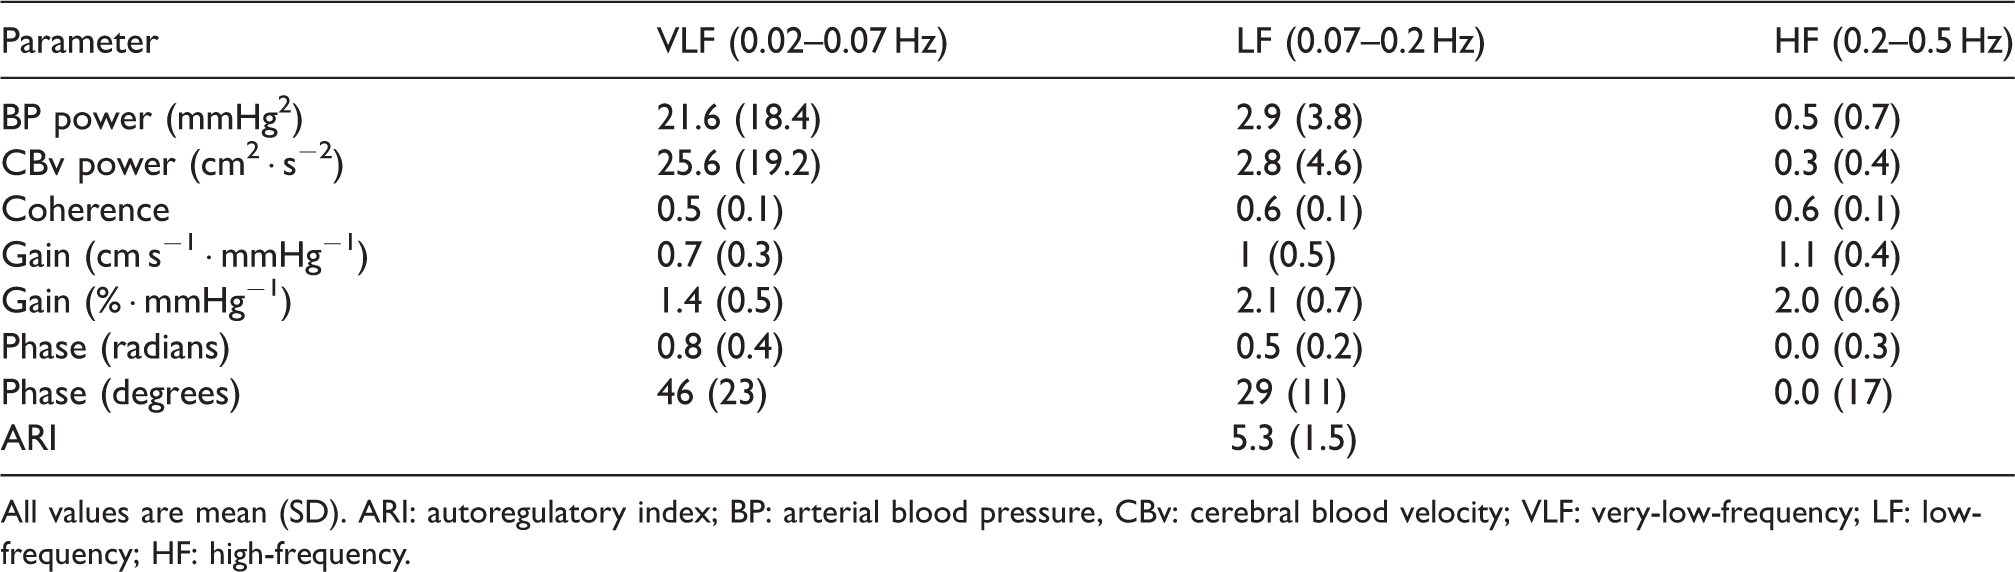
All values are mean (SD). ARI: autoregulatory index; BP: arterial blood pressure, CBv: cerebral blood velocity; VLF: very-low-frequency; LF: low-frequency; HF: high-frequency.
Normative transfer function analysis of the
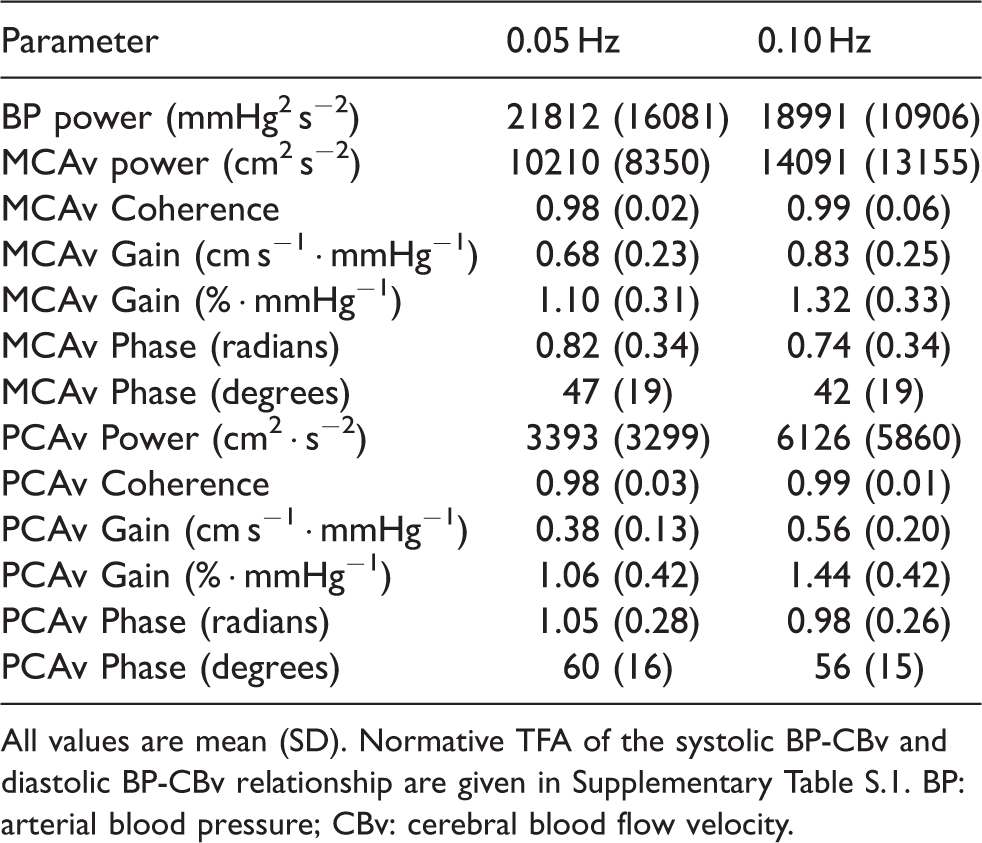
All values are mean (SD). Normative TFA of the systolic BP-CBv and diastolic BP-CBv relationship are given in Supplementary Table S.1. BP: arterial blood pressure; CBv: cerebral blood flow velocity.
The influence of age and sex on dCA metrics is equivocal. While most studies show no influence of age and sex, 144 for example using TFA phase 142 or ARI, 143 other recent evidence hints at the possible interaction of these two variables such that dCA may be impacted by increasing age in men but not women. 145 Moreover, phase and gain were shown to be reduced in older subjects when protocols that increase coherence between CBv and BP were adopted. 146 Coherence, itself, can also be affected by age. 143 In summary, datasets from cohorts with different age and sex proportions, and determined through different protocols, have detected some effect of age and sex on dCA indices but further work is necessary to quantify these effects. Additionally, cardiorespiratory fitness may confound this relationship further.80,81 Clarity of the age and sex effects on dCA within the healthy population is essential before thoughts on clinical thresholds for impaired autoregulation can be entertained.
Hitherto, difficulty to precisely delineate reference and cut-off values remains. Based on statistical criteria, an ARI < 4 57 and a very-low-frequency phase < 0.5 radians (<29 degrees) 143 have been suggested as the thresholds for abnormality, because they correspond to the 5% lower confidence limit. Some studies partly support their clinical significance109,112,115,147 but the high variability of these indices, particularly phase, precludes their widespread application. Gain is also highly variable and no clear criteria for abnormal values has been proposed. 17 Currently, no defined thresholds are recommended, and thus we should be careful in interpreting the reduced values of CA indices as impairment. Future studies on the prognostic information of these measures could reveal clinically relevant parameters and delineate their optimal cut-off values more closely.
Calibration database
Readers developing their own software to estimate TFA parameters, or using dedicated software packages for this purpose,148,149 are advised to become familiar with key steps involved in obtaining reliable results (see Supplementary Material). To confirm the accuracy of bespoke TFA software, developers and users are encouraged to engage with the procedure described in the original white paper, 7 which has not been altered.
Discussion
This updated, CARNet-endorsed, TFA white paper has enhanced many of the previous recommendations and introduced six novel recommendations that extend the application of TFA and other methods for dCA assessment into both physiological and clinical studies. In the original consensus document, a 10-point program of research was outlined, mainly focusing on areas where more evidence was needed to strengthen recommendations and improve standardization. 7 When examining the contents of this revision, it is reassuring to note the confluence of the recent research output with the original priorities that were established. Despite this progress, however, many topics are far from being concluded. Above all, the need for more clinical studies, specifically of a multicentre nature, remains a top priority. With this in mind, we expect that the novel Recommendations (notably #18, #19, #20, and #23), utilized alongside the updated recommendations (notably #3, #11 and #17), will lead to improvements in reliability, as well as the sensitivity and specificity, of TFA-derived parameters to detect pathological alterations in dCA. Indeed, the challenge that lies ahead is to bring to the fore the performance of different dCA metrics, either derived by TCD or other methods (Recommendation #22), for diagnostic and prognostic purposes. This goal will be greatly facilitated by the incorporation of the recommendations from this updated white paper into clinical studies, with the expectation that future revisions will have stronger evidence to base recommendations on the classification accuracy of different indices.
We hope that new evidence will surface in the coming years to allow more forceful recommendations, such as the potential influence of circadian rhythms on dCA. Although initial reports suggest that dCA is not affected during the daytime,21,22,150 to err on the side of caution, our recommendation is that all recordings in a study be performed the same time of the day whenever possible, particularly for a repeated measures design. More evidence is also needed on refrainment from different substances and exercise prior to measurements (Recommendation #1). A review of the literature shows considerable diversity between centres, and further evidence is needed to support more rigorous recommendations leading to further standardization. Finally, regional differences in dCA efficacy and how these are affected by physiological interventions and clinical conditions deserve greater attention. By far, the middle cerebral artery (MCA) has been the source of CBv(MCAv) measurements in studies of dCA, with a much smaller number of studies reporting results from the posterior (PCAv) or anterior cerebral arteries (ACAv). Most of the recommendations in this white paper apply equally to the MCA, PCA or ACA, but regional differences are obviously highly relevant when performing clinical studies (recommendation #20) or establishing reference values (recommendation #23). For the PCA, initial results in healthy subjects suggest that dCA metrics do not show differences from corresponding values from the MCA (Table 4)21,81 but further work is needed to improve the evidence base.
To conclude, it is important to note that the focus of this updated white paper on TFA is due to its popularity in the assessment of dCA in physiological and clinical studies. It should not be seen as a pronouncement that TFA is superior to other techniques for this purpose. More comparative, inter-method studies are needed, mainly in different clinical conditions, as stated above, to allow identification of optimal approaches for dCA assessment.
Supplemental Material
sj-pdf-1-jcb-10.1177_0271678X221119760 - Supplemental material for Transfer function analysis of dynamic cerebral autoregulation: a CARNet white paper 2022 update
Supplemental material, sj-pdf-1-jcb-10.1177_0271678X221119760 for Transfer function analysis of dynamic cerebral autoregulation: a CARNet white paper 2022 update by Ronney B Panerai, Patrice Brassard, Joel S Burma, Pedro Castro, Jurgen AHR Claassen, Johannes J van Lieshout, Jia Liu, Samuel JE Lucas, Jatinder S Minhas, Georgios D Mitsis, Ricardo C Nogueira, Shigehiko Ogoh, Stephen J Payne, Caroline A Rickards, Andrew D Robertson, Gabriel D Rodrigues, Jonathan D Smirl David M Simpson in Journal of Cerebral Blood Flow & Metabolism
Footnotes
Funding
The author(s) declared the following potential conflicts of interest with respect to the research, authorship, and/or publication of this article: Jatinder S. Minhas is funded by an NIHR Clinical Lectureship in Older People and Complex Health Needs. The views expressed in this publication are those of the author(s) and not necessarily those of the NHS, the National Institute for Health Research, or the Department of Health or the authors’ respective organisations.
Acknowledgements
The authors would like to thank the following members of CARNet for revising the final version of the white paper and providing comments that led to further improvements of the manuscript: Marcel Aries, Tony Birch, Sergio Brasil, Igor Braz, David Busch, Alexander Caicedo, Max Chacon, Heather Edgell, Kun Hu, Rehan Junejo, John Karemaker, Osian Llwyd, Vasilis Marmarelis, Vera Novak, Laura Parkes, Aaron Phillips, co-author Nhu Tran, and Rong Zhang.
Declaration of conflicting interests
The author(s) declared no potential conflicts of interest with respect to the research, authorship, and/or publication of this article.
Supplemental material
Supplemental material for this article is available online.
ORCID iDs
Abbreviations
Appendix
References
Supplementary Material
Please find the following supplemental material available below.
For Open Access articles published under a Creative Commons License, all supplemental material carries the same license as the article it is associated with.
For non-Open Access articles published, all supplemental material carries a non-exclusive license, and permission requests for re-use of supplemental material or any part of supplemental material shall be sent directly to the copyright owner as specified in the copyright notice associated with the article.