
Abstract
The cerebrovascular system continuously delivers oxygen and energy substrates to the brain, which is one of the organs with the highest basal energy requirement in mammals. Discontinuities in the delivery lead to fatal consequences for the brain tissue. A detailed understanding of the structure of the cerebrovascular system is important for a multitude of (patho-)physiological cerebral processes and many noninvasive functional imaging methods rely on a signal that originates from the vasculature. Furthermore, neurodegenerative diseases often involve the cerebrovascular system and could contribute to neuronal loss. In this review, we focus on the cortical vascular system. In the first part, we present the current knowledge of the vascular anatomy. This is followed by a theory of topology and its application to vascular biology. We then discuss possible interactions between cerebral blood flow and vascular topology, before summarizing the existing body of the literature on quantitative cerebrovascular topology.
Introduction
Brain's energy use is extraordinarily high, and due to a lack of sustainable energy storage, the transport of energy substrates and oxygen by the bloodstream has to be guaranteed at all times. The human brain receives ∼15% of the total cardiac output and this blood is transported from the trunk via four large vessels, the left and right internal carotid arteries and the left and right vertebral arteries. A profound knowledge of the cerebral vasculature is crucial for understanding the basic principles of cerebral blood flow and brain energy metabolism as well as their coupling to neural processing. Thus, it is quite surprising that quantitative data concerning cerebral blood vessels are rather sparse and more research in this direction is clearly required.
Nervous tissue is well known to be very vulnerable to discontinuities of energy substrate and oxygen delivery. The design of the cerebrovascular system has to fulfill several key requirements. First, it must be capable of perfusion at a rate in the order of 100 mL/min per 100 g of tissue. Second, cerebral blood flow must respond to the regional instantaneous energetic demand of the nervous tissue, which is dynamic in nature. Third, the vascular network must include safety measures that ensure circulation in cases of local vascular occlusions. This robustness of the cerebrovascular system is present at different tiers (Blinder et al, 2010) and is most evident at the proximal level. Before ramifying into the large feeding arteries of the brain, the vertebral arteries join into the basal artery and together with the carotid vessels form a ring-like structure called the circle of Willis. This structure introduces redundancy and serves as a precautionary measure. In case the circle itself or one of the large feeding arteries gets blocked, cerebral circulation is in many cases still preserved. The cerebral arteries originate from the circle of Willis and feed well-defined territories of the brain. Anastomoses at the level of the anterior, middle, and posterior cerebral arteries form the next stage of redundancy, followed by a pial network consisting of abundant loops (Blinder et al, 2010). At the level of the cortical arteries, several authors have reported the existence of anastomoses between arteries, between veins, and between arteries and veins.
From a historical perspective, it was recognized long ago that the vascular network topology is fundamental for understanding the mechanisms of embolic processes. Indeed, Cohnheim (1872) introduced the concept of the ‘Endarterie’ (end-artery) based on experimental observations from the frog tongue (Figure 1). Cohnheim injected small spheres to occlude vessels. He defined an artery as an ‘end-artery’ if it is not connected with any other artery, i.e., does not form an anastomosis with another artery. Hence, an occlusion of an end-artery has catastrophic effects on the feeding territory of this vessel. Cohnheim further hypothesized that whenever embolic processes lead to an infarct, then the vascular topology is based on end-arteries. Interestingly, he noticed that infarcts can also occur from occlusions of arteries that form anastomoses with other arteries. He conjectured that under physiological pressure conditions, such anastomoses cannot completely reroute the blood as required. To overcome this conceptual discrepancy, he introduced the term ‘funktionelle Endarterie’ (functional end-artery). We will show later in this review that this concept resembles the observation made by the Kleinfeld group that cortical arteries form a ‘bottleneck’ of perfusion (Nishimura et al, 2006, 2007). In the early part of the 20th century, Pfeifer (1930) investigated the cortical angioarchitecture and strongly opposed the existence of end-arteries in the brain. From his intravascular dye injections, he concluded that the vascular system is full of anastomoses within the arterial and venous vessels and also between arteries and veins on all levels. According to him, the cerebrovascular system is thus completely redundant, supporting earlier observations and concepts (Heubner, 1872).

Reproduction of Cohnheim's seminal experimental work on the embolic process in the frog tongue (fig. 1) from 1872. He introduced the concept of the end-artery, which does not form anastomoses with any other artery (figs. 4 to 6).
Clearly, stroke physiology is one of the major driving forces for research on cerebrovascular network topology. A better understanding of the cortical vascular topology might help to improve our understanding of how local disruptions of cerebral blood flow impact the local and global perfusion. Stroke pathophysiology, particularly related to lacunar infarcts, microinfarcts, and microbleeds could profit significantly from experimental and fluid modeling approaches that both rely on the exact appreciation of the vascular topology. Recent methodological advances now allow a reproducible and precisely localized disruption and concurrent monitoring of local cortical blood flow (for a review, see Shih et al, 2012). It has become increasingly evident that many of the most detrimental neurodegenerative diseases involve the cerebrovascular system. A prime example is Alzheimer's disease with its associated amyloid angiopathy, changes in vascular topology and microvascular lesions (Beckmann et al, 2003; Cordonnier and van der Flier, 2011; Meyer et al, 2008; Smith and Greenberg, 2009; Zlokovic, 2011).
Apart from diseases of the brain, there are other fields that rely on a precise understanding of brain's microvasculature. Current noninvasive functional neuroimaging techniques are largely based on the hemodynamic response to neuronal activation and collection of signals of vascular origin. Indeed, functional magnetic resonance imaging is considered to be the most important neuroscience tool to study the human brain in action. However, in recent years, researchers have started to realize that the underlying signal is complex and far from being understood (Logothetis et al, 2001; Logothetis, 2002, 2008), and that one of the most incompletely understood topics is that of structural or functional cerebrovascular biology. To provide an illustrative example, it remains unclear whether cortical columns are supplied and drained by specific and distinct vascular networks, as proposed by several authors (Cox et al, 1993; Duvernoy et al, 1981; Woolsey et al, 1996). If such distinct vascular (sub)networks exist, then hemodynamic response-based neuroimaging could in fact reach columnar resolution, even if the regulation of the vascular resistance is localized on the level of the large penetrating cortical arteries. The present review focuses on the vascular topology of the cerebral cortex. We critically assess the existing and rather limited body of the literature. Only recently have reports been published that include a quantitative description of the vascular network topology.
The appropriate mathematical representation is a fundamental prerequisite when analyzing vascular structures. The concept of weighted graphs is ideally suited to scrutinize the topology and geometry of the vasculature. We discuss the processing steps involved to transform a biological sample into a graph network. In addition, we provide a comprehensive introduction to the theory of topology, with a special focus on its application to vascular biology.
We believe that a primer in the mathematical underpinnings of topological description will prove valuable to a larger group of readers, as it is of great importance for the analysis of digital vascular anatomical data, for blood flow modeling and generally for understanding the structure and function of the cerebrovascular system. We also regard our work, in part, as an introduction to the tools either for direct applications or for further developments or simply to facilitate understanding of past and future work in the field.
Vascular anatomy of the cortex
Organization of the Cortical Vascular System
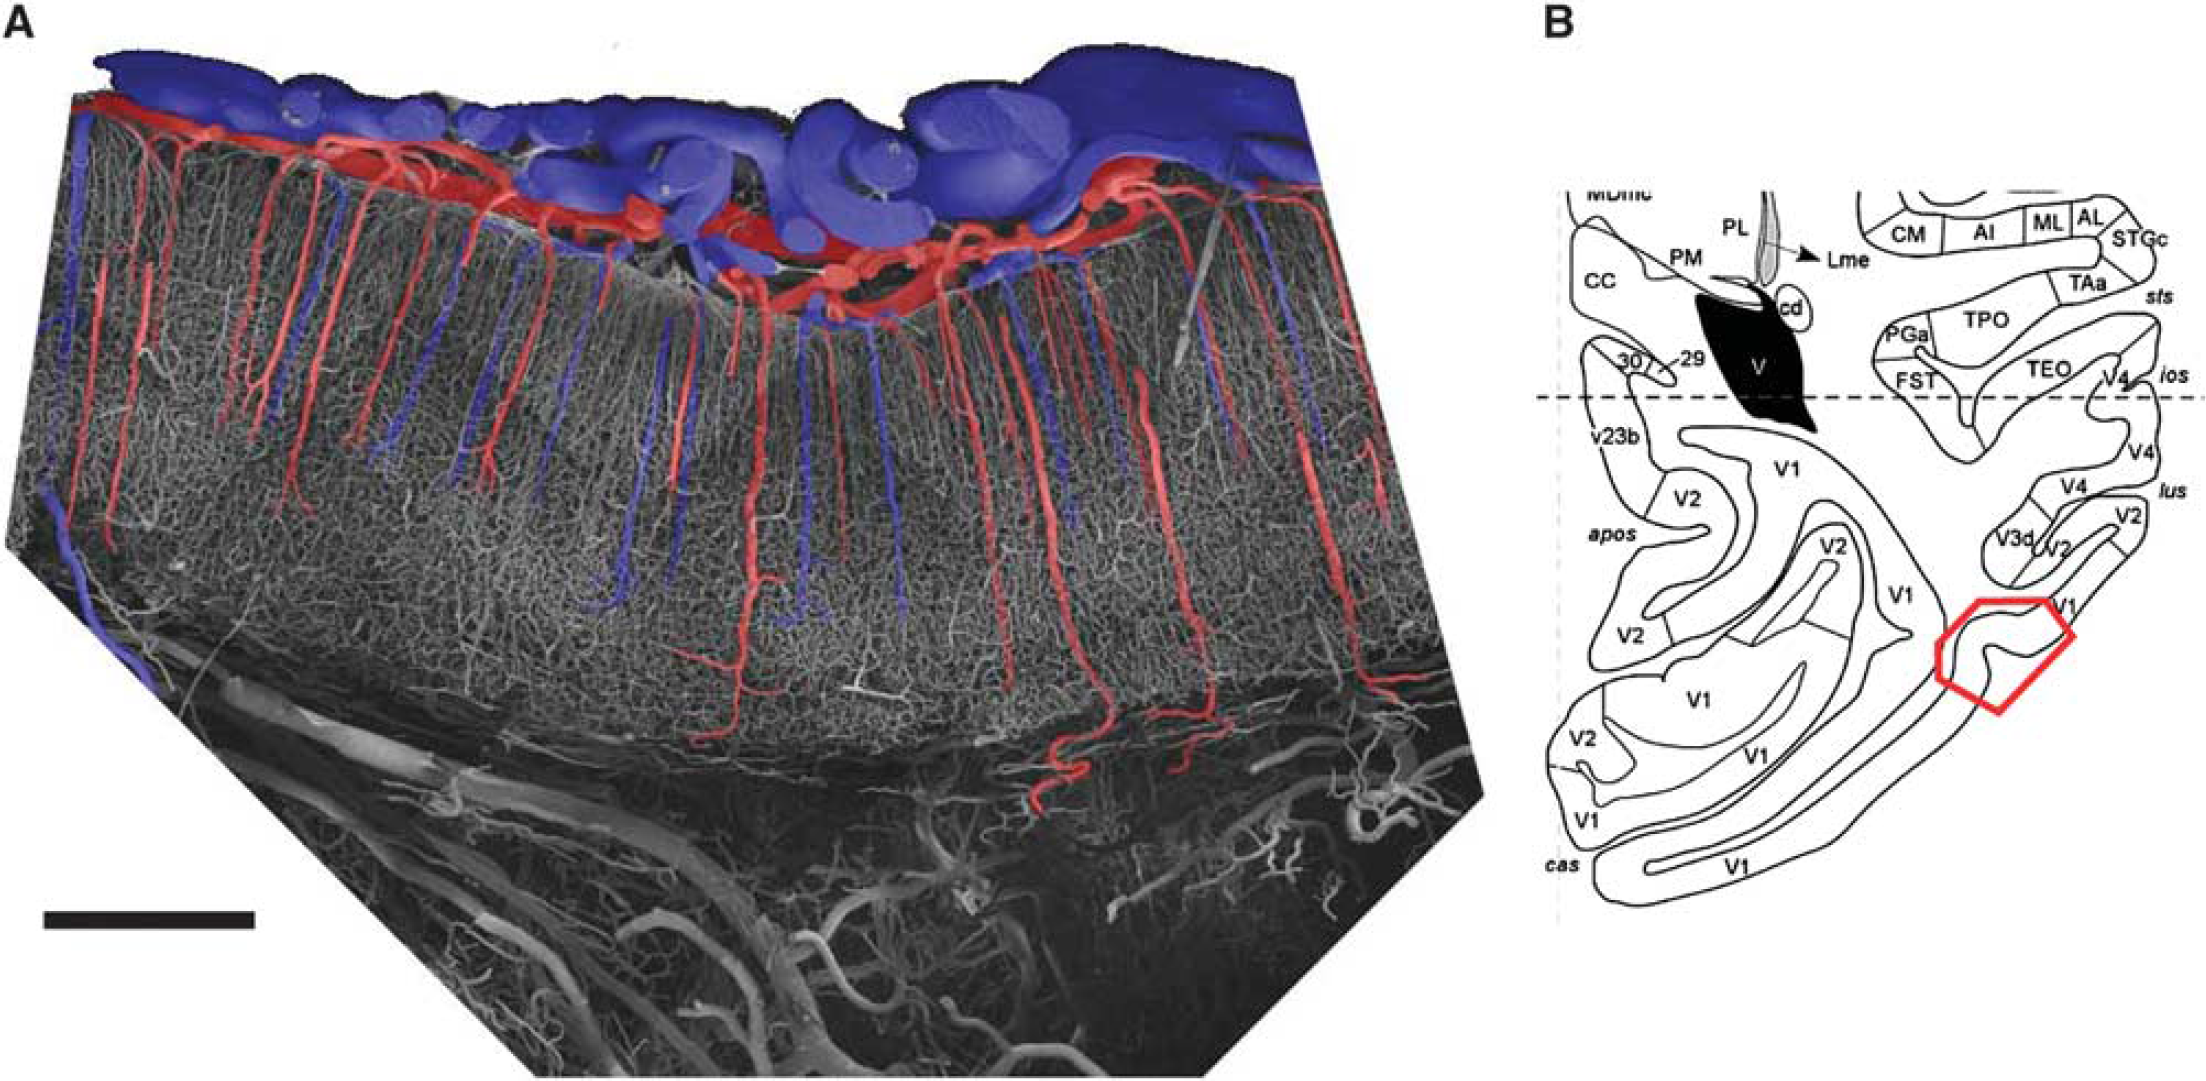
In this section, we describe the gross anatomy of the cortical vasculature, before focusing on the more specific aspects. The most comprehensive and influential work is the one by Duvernoy et al (1981), who described the vascular system of the human cortex in detail. Most of the general aspects are valid not only for the human cortex but also for many of the most widely used experimental animals, such as nonhuman primates (Fonta and Imbert, 2002; Weber et al, 2008) and rodents (Tsai et al, 2009). Figure 2 depicts a coronal section of a corrosion cast of the macaque primary visual cortex. Large vessels are localized on the surface of the brain. The descending and ascending cortical vessels plunge into the cortex in a perpendicular direction. The cortical arteries (red) branch and eventually give rise to a fine capillary network also called the capillary bed. The vascular density is markedly higher in gray than in white matter. However, within the cortex a continuous orderly pattern can be observed with only moderate changes in vascular density. The capillary bed is drained back to the cortical surface by the venous system. Cortical veins (blue) are—analogous to the cortical arteries—oriented orthogonally to the cortical surface.
(
Cortical vessels can be divided into short, intermediate, and long vessels, depending on their cortical penetration depth. Duvernoy et al (1981) have extended this classification to six groups. Group 1 vessels feed/drain cortical layers I and II, whereas group 2 vessels reach layer III. The most numerous vessels are the group 3 vessels that feed/drain cortical layer IV, as well as the lower layer III and layer V. Group 4 vessels reach layer VI and white matter. Group 5 arteries and veins vascularize the cortex as well as the adjacent white matter. Group 6 vessels are restricted to arteries that run through the cortex without branching to vascularize exclusively the white matter.
An interesting aspect is the ratio between descending cortical arteries and ascending cortical veins. We have previously estimated this (AV)ratio to be 1.6 in favor of arteries (Weber et al, 2008), a value that has been replicated more recently by Guibert et al (2010). More numerous arteries than veins could be because the network is engineered for a spatially precise feeding rather than draining system. Notably, there might be significant differences among species with regard to the AV ratio. Our own unpublished observation is that the ratio could even be reversed in rodents, a result that requires further confirmation.
Pial Network
The pial network consists of large arteries and veins. Arteries usually run on top of the veins (Duvernoy et al, 1981). However, this does not always apply and therefore cannot be used for reliable differentiation. It is well established that the pial vessels form numerous loops within the arterial and also within the venous network. Recently, Blinder et al (2010) have extensively investigated the topological characteristics of the mouse and rat pial vascular system. The authors concluded that this redundancy is the basis of a robust delivery of blood to the cortex and identified several important topological features. Most importantly, the network consists of interconnected loops that span the entire vascular territory. This feature guarantees the maintenance of blood delivery when individual branches are removed. The same group has provided evidence for this concept in an experimental model of stroke, in which occlusions of single pial vessels are compensated for by a complete redistribution of blood flow within the pial network (Schaffer et al, 2006). Whereas the existence of anastomoses within the arterial and venous network is beyond dispute, the occurrence of arterio-venous anastomoses is very unlikely (see Duvernoy et al, 1981 and references therein).
Intracortical Vascular Network
The neocortex has been intensively studied with respect to the architecture of the neuronal circuits (Douglas and Martin, 2004). Although normal information processing of neurons greatly depends on a sustained delivery of nutrients and oxygen, the cortical vasculature has been studied much less vigorously, although it is far less complex than the neuronal network.
The differences in the cortical layers with respect to the neuronal architecture are paralleled by changes in the vascular organization. A closer look at the vascular density reveals that there is a distinct laminar profile (Figure 3). For example, the primary visual cortex of the primate shows the highest vascular density in the thalamic input layer IV, with a peak in layer IVc
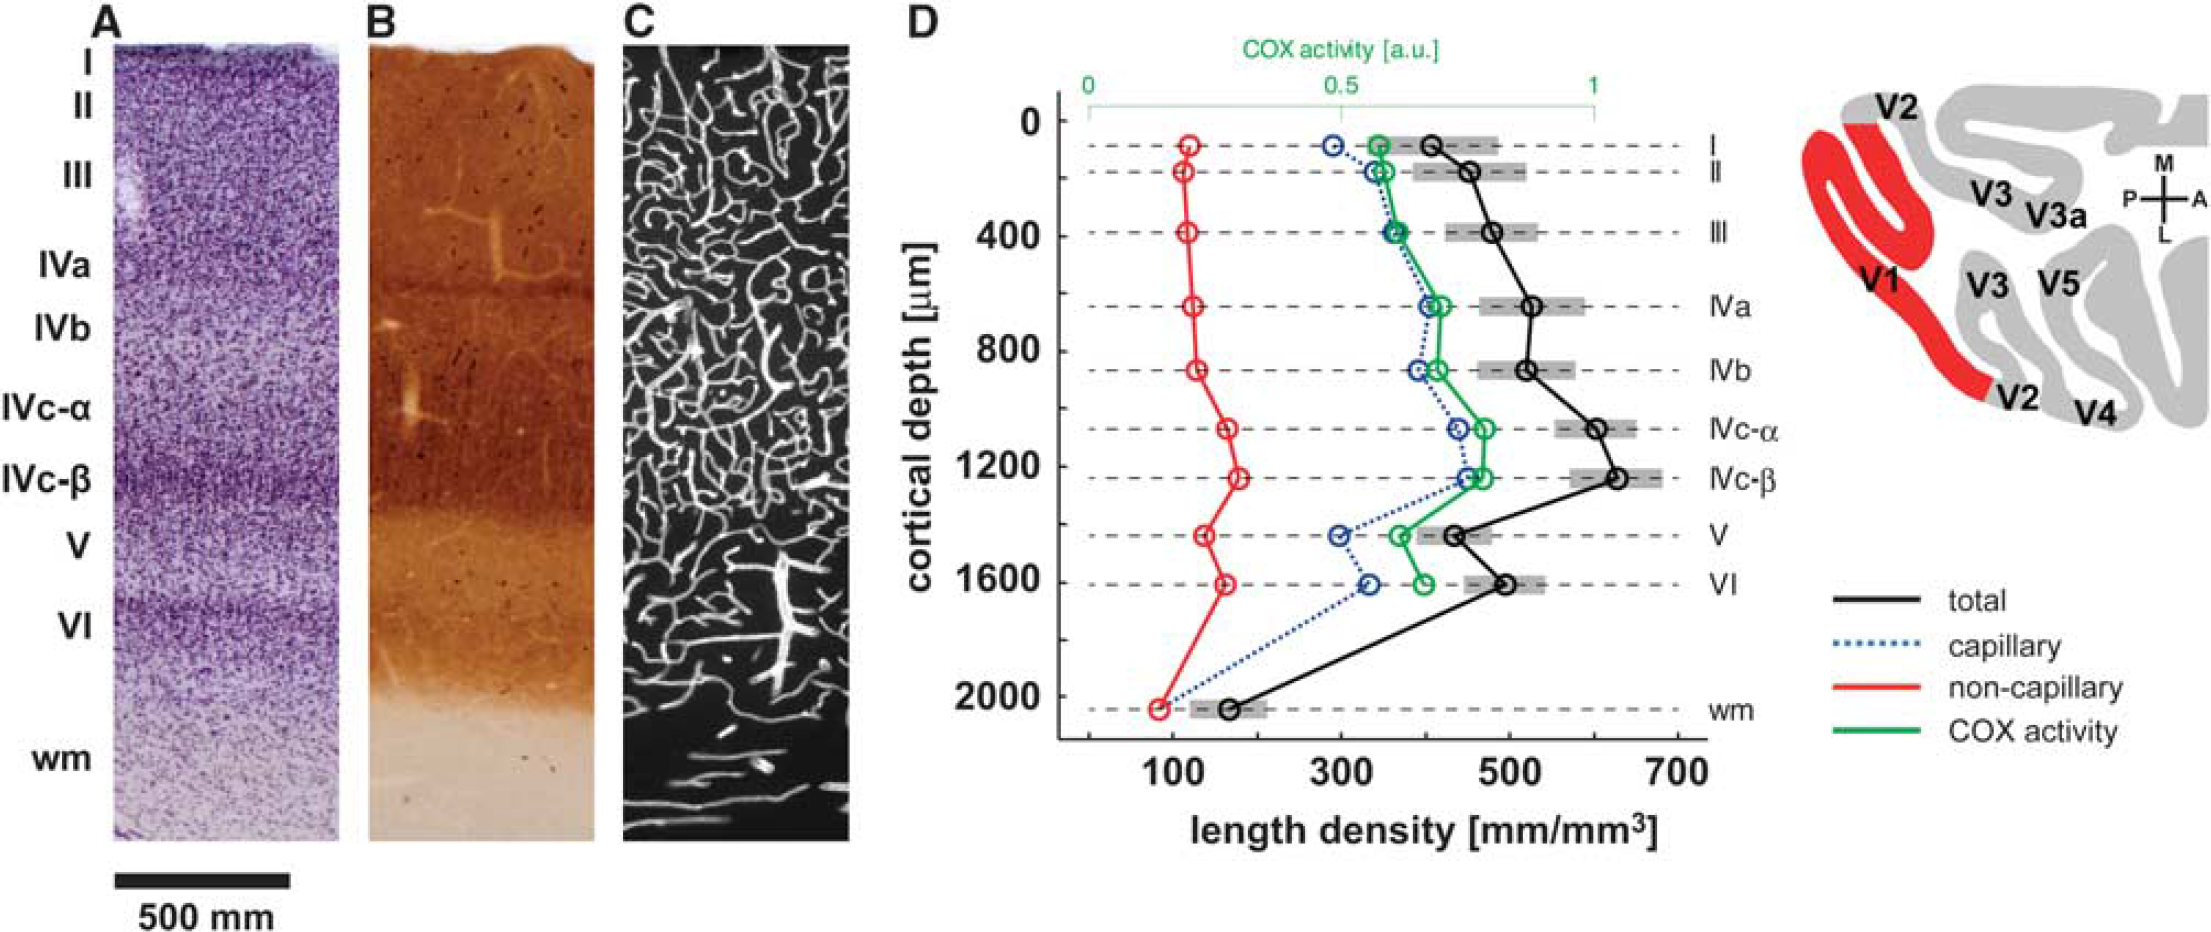
Vascular density of a microvascular system across the cortical layers and cortical depths (
Staining for COX activity can be used to map functional units of the neocortex. As an example, the primary visual cortex shows patches of increased COX activity in layers II and III, the so-called blobs described in the cat (Murphy et al, 1995), primates (Carroll and Wong-Riley, 1984; Fitzpatrick et al, 1983; Horton and Hubel, 1981), and humans (Adams et al, 2007; Horton and Hedley-Whyte, 1984). Interestingly, the vascular density is significantly increased in blobs as compared with the regions between them. In primates, this difference is of the order of 4% to 5% (Keller et al, 2011). There is also a tendency for large vessels being localized more frequently between the blobs. The group of Thomas Woolsey has extensively studied the relationship between surface vessel patterns, cortical capillary clusters, and the columnar organization of the cortex (Cox et al, 1993; Woolsey and Rovainen, 1991; Woolsey et al, 1996). A correspondence between the surface vessel domains and the underlying barrels could not be detected (Woolsey et al, 1996). However, they found a match between the barrels and capillary clusters (Cox et al, 1993), a result that remains to be replicated using state-of-the-art 3D reconstructions of the cortical vascular network and barrels (Tsai et al, 2009). More generally, the hypothesis that vascular units match functional neuronal columns is appealing. However, more research is needed in this context, including the generation and topological analysis of tomographic vascular data.
Techniques to visualize and quantify cerebrovascular networks
The majority of our knowledge regarding the cerebrovascular system is based on
Current state-of-the-art imaging modalities are capable of resolving the angioarchitecture down to capillary level using all-optical histology (Tsai et al, 2009) or synchrotron radiation-based X-ray tomographic microscopy (Heinzer et al, 2006, 2008; Plouraboue et al, 2004; Reichold et al, 2009). Although these imaging technologies are advancing rapidly, the segmentation of the angiography data remains a challenge, and in most cases the completeness and accuracy (e.g., diameter estimates) of the reconstructed network are questionable. An error estimate will provide confidence by comparing with
Topological characterization of the cerebral vasculature
Structural Description
The morphology of the blood vessel system in the cerebral cortex is highly complex and we need formal models and tools to interpret the presented volumetric data and to derive geometrical, structural, and functional properties of the system.
The basic concepts of topology originate from mathematics when investigating properties of objects that are preserved under continuous (homotopic) transformations. Figure 4 depicts three objects: the first two objects
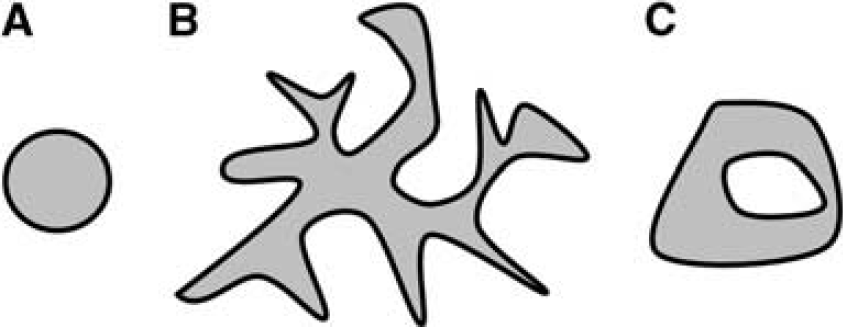
Three continuous objects: (
It is obvious that this notion cannot directly serve as a biologically meaningful description of the vascular system, where branching characteristics are of fundamental relevance. Nevertheless, the basic underlying concept can be suitably adapted and extended to cover all the practically relevant features when describing blood vessels. Most importantly, the purely connectivity-oriented view of mathematical topology has to be extended with geometry-related features, resulting in a biologically meaningful description of vessel morphology covering both the connectivity and the essential geometry of the vascular system.
Image Segmentation
Before objects can be characterized, it needs to be decided which parts of the image correspond to the object under scrutiny and which belong to the background. This task is accomplished by segmentation, where many methods are available, either purely based on actually measured image intensities or supported by prior knowledge in the form of more or less strong model assumptions. Extensive reviews on various state-of-the-art segmentation techniques in medical image processing can be found in the literature (Kerbas and Quek, 2004; Lesage et al, 2009). Many approaches are notably tailored to specific applications and modalities used for image acquisition. Rather simple methods like absolute or locally adaptive threshold are in practice regularly used due to their conceptual simplicity and computational efficiency but are a serious source of error. Especially for narrow objects, such as vessels, the differentiation of object and background remains difficult, due to limited image resolution, lack of contrast, and image noise. An inappropriate choice of threshold values can dramatically change the appearance of the vessel, leading not only to an overestimation or underestimation of the vessel lumen, but also to topological errors.
Even though more sophisticated approaches may overcome these problems to a certain extent, the segmentation remains error prone, for instance, due to inadequate parameter estimation or model limitations (tortuous vessels and bifurcations are hard to reconcile with a tubular vessel model). To overcome this problem of imperfect vessel segmentation, several techniques for automated segmentation correction have been proposed using methods such as tensor voting (Risser et al, 2007) or threshold relaxation (Kaufhold et al, 2008). Trying to eliminate undesirable vascular discontinuities, these approaches provide adequate means to substantially improve the segmentation quality. In spite of sophisticated image analysis methods, fully automatic vessel segmentation requires manual postprocessing to correct for remaining topological errors. Considering the enormous amount of data obtained from high-resolution tomography, however, the manual inspection of the results is practically impossible, unless restricting the analysis to small samples. Therefore, one should always bear in mind that further analysis might be affected by uncorrected topological errors due to imperfect vessel segmentation.
Digital Topology
When dealing with images of real-life objects, we are always confronted with a discrete spatial representation. Topology in discrete spaces is basically defined by adjacency (Rosenfeld, 1970). On a 2D raster it is usually defined in two ways. The choices to define connectivity are 4-neighborhood (4-NB, Figure 5A), where all pixels sharing an edge are neighbors and 8-neighborhood (8-NB, Figure 5B), where pixels with common corners are considered as neighbors. The neighborhood definition has immediate consequences on the object topology. The raster image in Figure 5C contains two 4-connected objects, i.e., applying 4-NB, but only one 8-connected object, i.e., applying 8-NB. Likewise, Figure 5D is an 8-connected loop or a 4-connected open arc. It is important to note that the neighborhood definitions for object and background need to be selected complementary to remain compatible with well-established concepts in continuum. One important example is the Jordan theorem (Jordan, 1887), guaranteeing that a closed curve divides the space into two parts: inside and outside of the curve. If 8-NB is selected for the object, then 4-NB describes the background topology or vice versa. In three dimensions, neighborhood definition has three straightforward options. In a 26-neighborhood, all voxels sharing a corner (or more) with the central voxel are considered as connected. The requirement that at least one edge is to be shared with the central pixel results in an 18-neighborhood. In a 6-neighborhood, voxels that share a face are regarded as connected. For a consistent connectivity in 3D, 26-NB is used for the object and 6-NB for the background or vice versa.
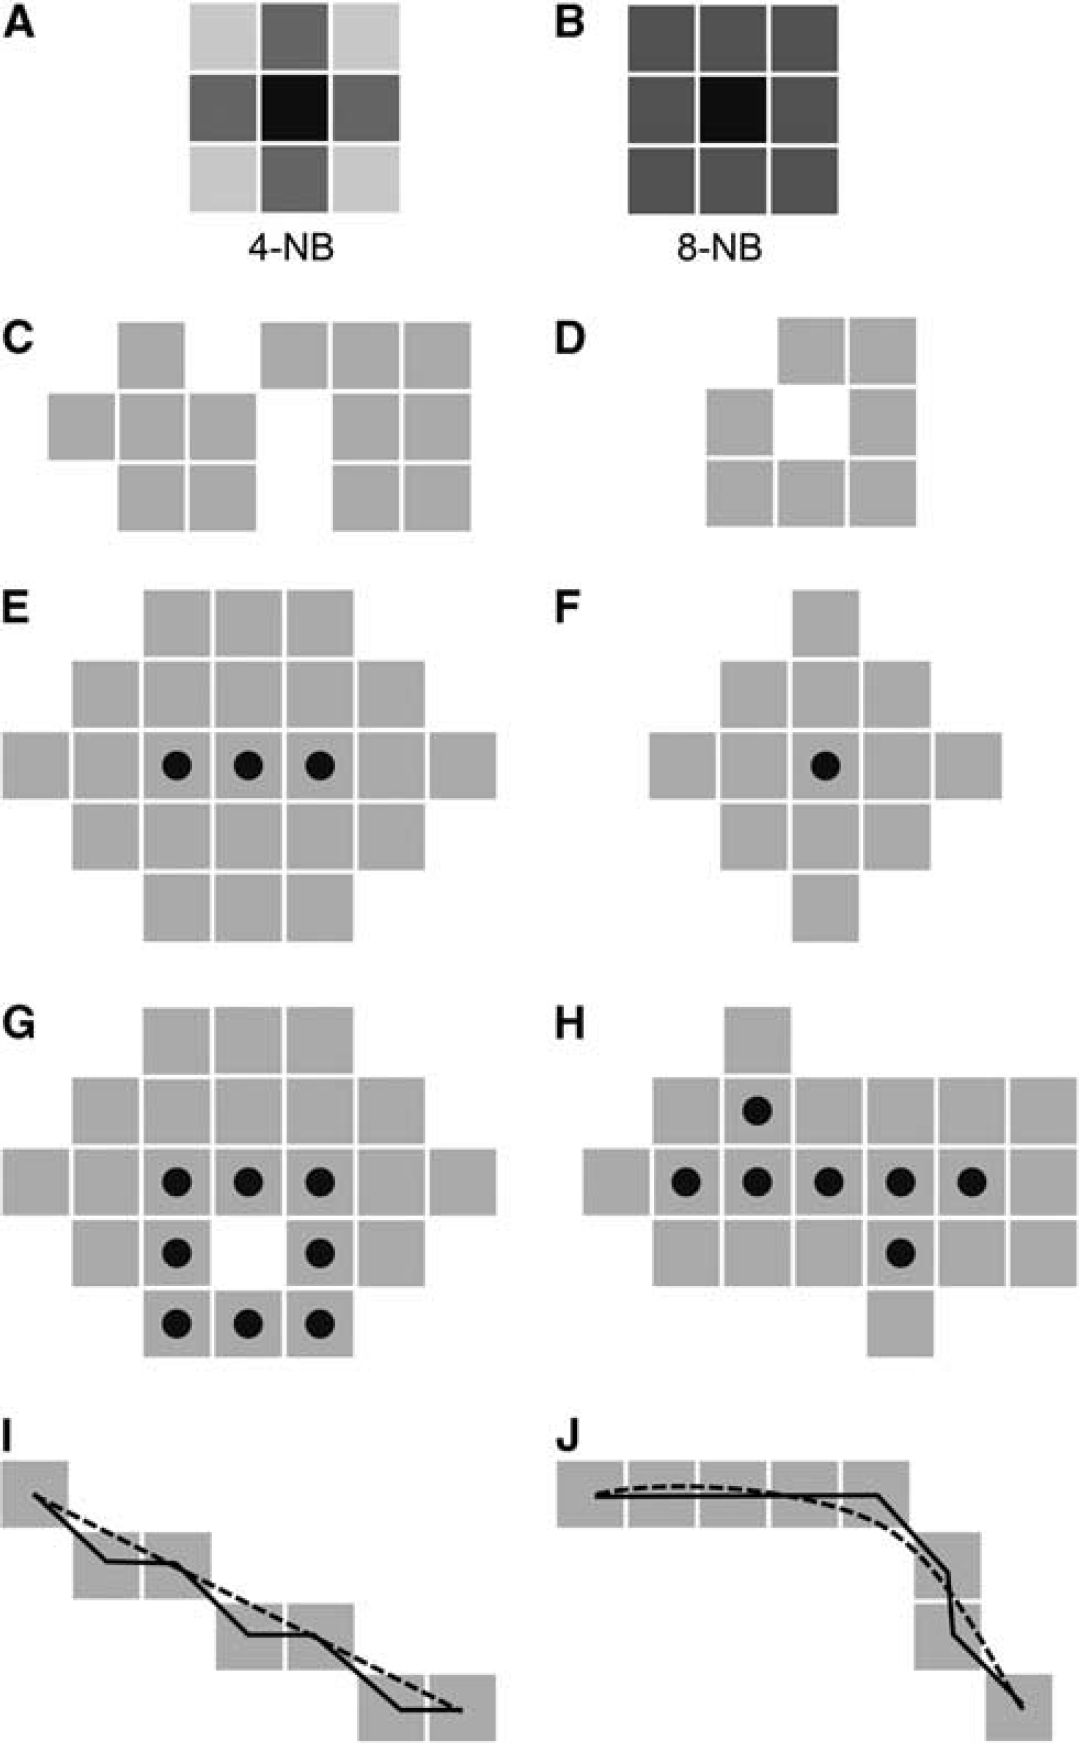
Two choices for the definition of neighborhood on the 2D image raster. The central pixel of interest is black and the neighbors are dark gray. (
Skeletonization
Blum (1967) proposed a description for irregular shapes by representing them with their medial axis function as he was ‘lacking a formulation which appears natural for the biological problem.’ The medial axis is formed by center points of maximal discs that can be inscribed into the object. The medial axis function is an idealized line representation of a 2D object and intuitively describes biological shapes. While originally conceived for continuous spaces, the concept has been extended to representing discretized objects on the image raster. Moreover, there are methods to overcome the limitations of the image raster and allow an extraction of structures on subpixel accuracy (Lesage et al, 2009). Although different methods have been proposed for discrete skeleton generation in 2D and higher dimensions (Siddiqi and Pizer, 2008), most commonly it is achieved by morphologically thinning the object (Stefanelli and Rosenfeld, 1971; Tsao and Fu, 1981). Thinning procedures iteratively erode pixels from an object until only skeletal points remain (Palagyi and Kuba, 1998). One of the major concerns during this process is maintenance of the original object topology, i.e., avoidance of the removal of pixels that would change object (or background) connectivity. If just concentrating on this aspect, a topological skeleton will be generated in full correspondence with the mathematical definition of topology. A topological skeleton is a line representation of a shape, equidistant to its boundaries. The choice is not unique. Figures 5E to 5H show topological skeletons for different objects. A hole in the object as in Figure 5G will produce a loop. Holes may occur in a vascular image due to noisy pixels or uneven distribution of contrast agent within the vessel lumen. The topological skeleton is not unique, for Figures 5E and 5F any point in the object will equally well present a topological skeleton. The identification of the medial axis requires additional constraints in the skeletonization procedure to ensure that the skeleton will be in the center of the object and that the lines corresponding to segments in a vessel tree remain preserved. Therefore, apart from the topological constraints, we need to make sure that line ends do not get successively shortened. An appropriate selection of the processing sequence of pixels during the thinning procedure (Pudney, 1998) assures that the skeleton runs through the middle of the lumen.
Clean Topological Representation
Images of biological structures will usually be of irregular shape. Image noise and visualization artifacts additionally cause image deterioration. Perturbations immediately affect the skeleton and usually lead to undesirable outcomes. In the simplest case, pixels along the boundary are erroneously classified, without causing topological changes. Skeletonization is inherently sensitive to the resulting small boundary perturbations and unwanted effects have to be removed in a postprocessing step. Single pixels at the side of a structure will leave little branches (‘stubs’) in the skeleton (see Figure 5H), which may be removed by pruning (Shaked and Bruckstein, 1998). The pruning algorithm should preserve topology, be well conditioned, and use a local significance measure to identify irrelevant skeletal branches, which should not be preserved. Such measures usually rely on the contribution of an individual branch to the object shape when reconstructing it from the skeleton. Quite often stubs are removed if they extend only slightly over the radius of the parent vessel. Where small defects are eliminated with pruning, large defects will unavoidably remain a topological feature of the object. It is often not trivial to distinguish between real features and artifacts, and so the segmentation of the raster image remains a source of error for the topological description.
If such errors are well localized (usually caused by noise during the image acquisition process), then they can be corrected for by simple postprocessing steps. A helpful strategy is morphological closing or opening (i.e., consecutive dilation and erosion steps), which can eliminate such defects without significantly changing the width of the structures (Gonzales and Woods, 2008; Haas et al, 1967). More severe defects may lead to more global effects, like creating a gap within the object. This is the case, e.g., for partial filling with contrast agent, where the vessel will be interrupted. These undesirable discontinuities can be corrected to a certain extent during the segmentation process, as discussed above. However, there are presently no computational tools available that can correct for each and every one of these errors, which is the primary reason why manual postprocessing is often required.
Measuring Raster Objects
The natural metric defined by the neighborhood (see above) is not in accordance with our usual perception, which relies on Euclidean distance. The midline length of a rasterized object can be estimated by piecewise linearization. Figure 5I shows the representation of an 8-connected straight line, where the corresponding 8-metric overestimates the actual distance. A better approach is to approximate the midline by splines, either linear or of higher order (Figure 5J). Migrating from the image raster to a continuous notion of space allows more precise geometric descriptions. This ensures that both the length of the vessel and the angles at the branch point are more realistic. Additionally, this allows for a symbolic representation of the vasculature. By adaptively choosing a representative set of supporting points based on criteria such as local deviation between the pixel- and spline-based representation or curvature-based constraints, a much more realistic path between two points can be generated.
Branching points are extracted from the skeleton by selecting the points with more than two (in the case of bifurcations exactly three) neighbors in an 8-NB sense. The radius of the vessel can be estimated by applying a distance transform (Rosenfeld and Pfaltz, 1966) to the segmented vessel lumen and averaging over the vessel centerline. More advanced options include fitting a template (like a cylinder) to the vessel segment, where it is crucial to consider the specific imaging modality used to obtain this data by including the point-spread function of the imaging system (Tsai et al, 2009).
Graphs and Flow Networks
The vessel network is represented simply by bifurcation points and the geometrical properties of the vessel segment in-between. This abstraction resembles the discrete geometrical concept of graphs (e.g., Diestel, 2010). A graph consists of vertices (i.e., bifurcation points) and interconnecting edges (i.e., vessel segments). A graph
Two graphs. (
Sometimes, it is useful to define a root in a tree. The criteria for selecting a node as root are provided by context information and as such are defined by biology. In a functional sense, a possible root choice is the connecting node between a network and a tree, or the highest upstream node in the vessel hierarchy.
In a directed graph (digraph), each edge has a defined direction. This defines possible trajectories (paths and cycles) across the graph along the edges. In an arborescence, all edges point away from the root node toward the leaves. It is a directed graph in which the root and any other node can be connected by exactly one directed path. The arborescence is a good model for the feeding arteries, whereas the capillary bed is best described by a general network graph.
As mentioned earlier, the graph
Geometrical Properties
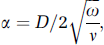
Bifurcations can be characterized by the direction and radius of the branching vessels. The estimation of geometrical properties on the image raster is not straightforward, as we learned before when discussing skeleton generation. Once the determination of angle and length is solved to satisfaction, one may generate statistics over selected tissue regions. Branching angles and asymmetry, branching lengths between bifurcations, Murray's exponent, total vessel length density, vessel volume density, or frequency distribution of diameters are regularly used in the literature. According to the seminal work of Murray (1926), the radii of the parent branch
Topological Properties
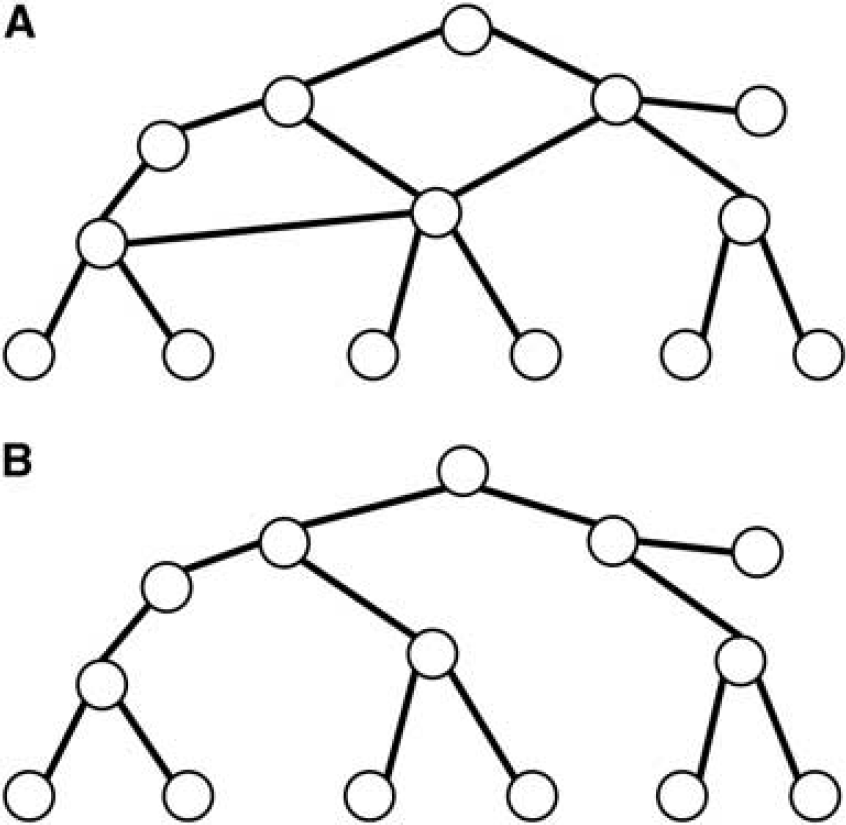
The graph representation is ideally suited for analyzing the structural properties of networks as it can handle them in a very efficient manner. Vascular systems can be regarded as being binary and containing only bifurcations, as higher degree nodes can be separated into immediately consecutive bifurcations. Generally, a vessel system is a connected component of both tree-like and network-like structures. Figure 7 shows how the intracortical vessel system can be decomposed into tree and network structures simply by imposing a diameter threshold.
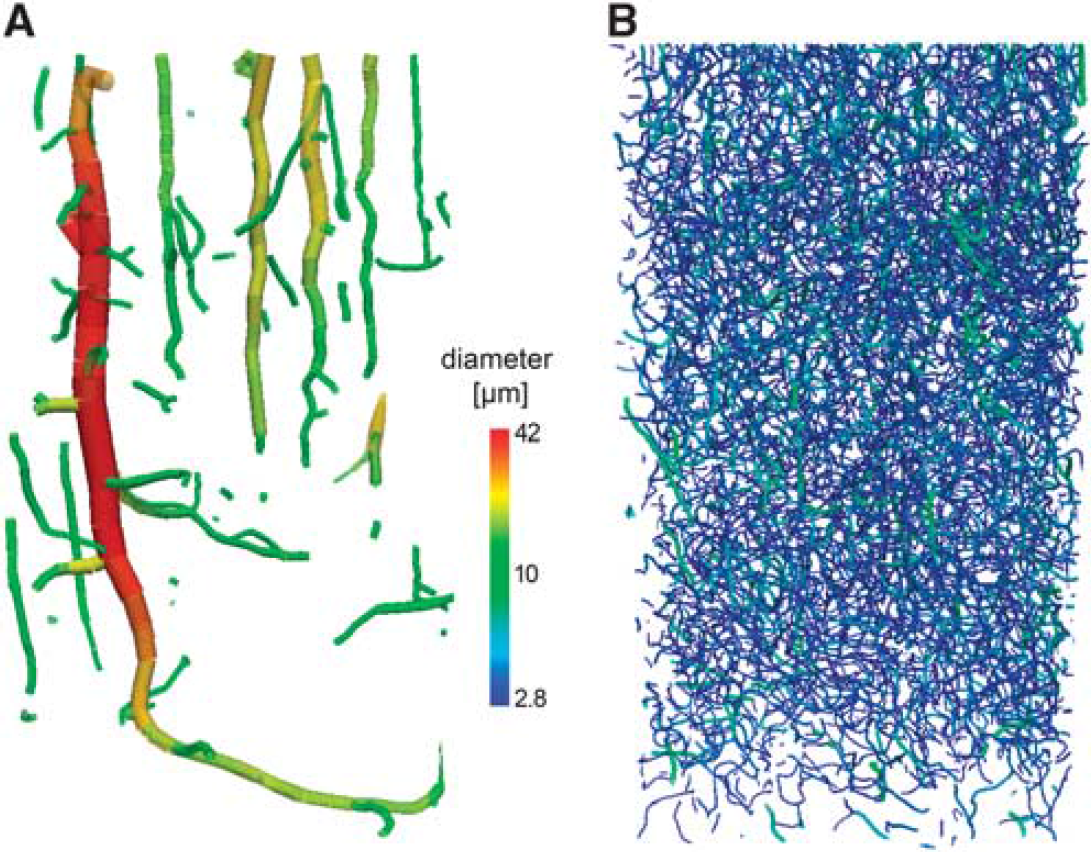
Extracted vessels from the rat somatosensory cortex retrieved from synchrotron radiation-based micro-CT with a resolution of 700 nm3. The network has been extracted by a standard procedure with skeletonization and subsequent distance transform to estimate the local radius. The vessels are color coded (log scale) according to their radius. (
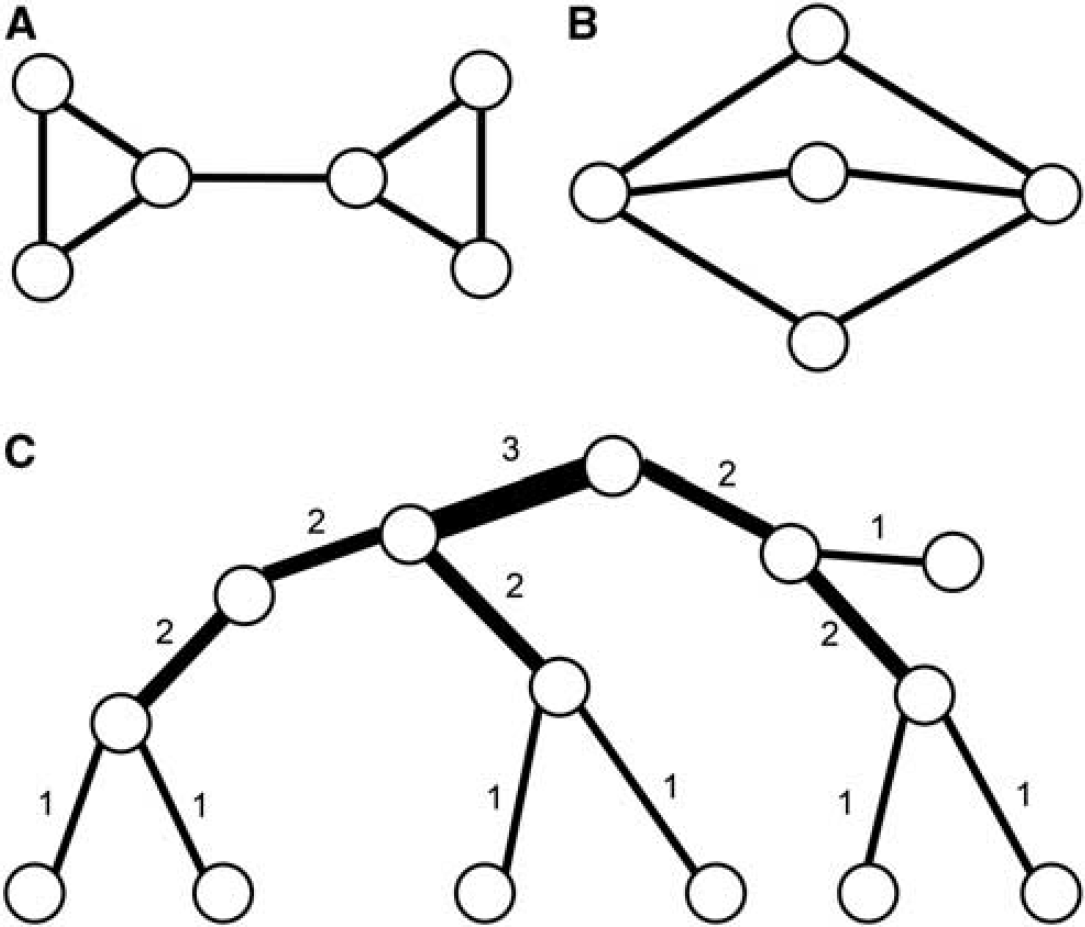
It is straightforward to reduce a graph by successively cutting single-ended nodes and eliminating transition nodes. In the general case, this will result in loop structures (containing only edges which are part of a loop) connected by single edges (bridges). Deleting a bridge splits the graph and consequently the bridge is not part of a loop. Figure 8A consists of two loops connected by a bridge. If all bridges are removed from the network, then only loop structures of higher connectivity remain (Tarjan, 1974). Loop structures are somewhat difficult to assess, as multiple paths between two nodes are possible, as well as multiple passes through the same loop. They can be quantitatively characterized by the edge connectivity of a graph, which is defined as the minimal number of cuts (i.e., elimination of an edge) that will split the graph. The number is characteristic, but the individual cuts are not.
(
The number of generating loops in a loop structure is one less than its edge connectivity. For example, the loop structure in Figure 8B contains three loops, while it can be constructed just from any two.
Generally, trees are much more accessible to topological analysis than networks. On tree graphs, the definition of hierarchies makes sense, as only one path connects two nodes. One possible way to characterize the hierarchy of a tree is the Horton-Strahler taxonomy (Horton, 1945; Strahler, 1957). The Strahler number (Figure 8C) characterizes the hierarchical level of a vessel segment (edge) in a rooted binary tree. Originally developed to describe hierarchies in river systems, it has proven useful in physiological applications (Burrowes et al, 2005; Huang et al, 1996; Lapi et al, 2008). The orders of the edges are determined in a bottom-up manner, the edges of the leaf nodes being of order one (the root is by definition not a leaf). If two children of order
Arterial and venous trees of the microvasculature are characterized by comparing the cumulative dimensions (length and volume) of downstream subgraphs in a stem-crown manner (Cassot et al, 2009; Kassab, 2006) to extract scaling laws. For complete or partial vascular structures, it is further possible to extract the fractal dimension by sandbox/box-counting approaches (Gazit et al, 1997) or by spectral analysis of the intervascular distance map (Lorthois and Cassot, 2010; Risser et al, 2007). Fractal analysis describes the self-similarity of the vessel system, and is thought to reveal information on the formative process and distinguish between local, diffusion-limited, and compact growth processes. The authors claim that the fractal dimension of the vascular network under study can help to differentiate normal from pathological tissue and has the potential to be used to stage tumorous tissue (Lorthois and Cassot, 2010).
Topological features of cortical vessels and the capillary network
Analysis of the organization of the vasculature beyond pure geometry has only recently been reflected in the literature. The reason for this is clearly the challenges encountered in acquiring a reasonably large volume with high resolution. There is only a limited availability of data sets that meet the necessary requirements (field of view and spatial resolution) to allow for a robust statistical analysis of the cortical vasculature. Studies investigating other tissues using either small fields of view or lower resolution (reviewed by Lorthois and Cassot, 2010) have tested the fractal nature of the vasculature.
Risser et al (2007) acquired high-resolution synchrotron radiation-based X-ray tomographic microscopy of both the rat and monkey cortical vasculature. Their main goal was to differentiate tumorous and normal brain vascular networks. With the sandbox/box-counting method and spectral analysis (autocorrelation), they found a quasi-fractal organization of the capillary network and a homogeneous structure for the tree. Their conclusions are in contradiction to earlier findings that assumed a tree-like feeding structure and a net-like capillary bed, but have been challenged by a recent work (Lorthois and Cassot, 2010) (see below). Interestingly, both tumor and healthy vasculature showed similar global features, whereas the local organization in tumors was much more heterogeneous than in normal tissue. A stem-crown decomposition (Cassot et al, 2009) confirmed the allometric equation between mass and metabolic rate. The authors showed that scaling laws govern the relationships between integrated parameters, such as distal cumulative length, volume, or normalized flow. The power law model did not match the relationships between local parameters. They found a large variation in Murray's law and a high average exponent (
In an elegant series of experiments, the group of Kleinfeld has investigated the effect of single vessel occlusions on different levels of the vascular system (Nishimura et al, 2006, 2007; Schaffer et al, 2006). As described above, the occlusion of vessels in the pial network does not lead to a major breakdown of the downstream blood supply, because the blood can be rerouted in the redundant vascular network. Contrarily, descending cortical arteries can be regarded as a bottleneck, as occlusions lead to a significant perfusion loss in the cortical region normally supplied by the occluded vessel. The region of influence of an occluded penetrating arteriole was found to be in the range of 350
As mentioned above, Lorthois and Cassot (2010) have challenged the findings of Risser et al (2007), having argued them to be artifacts of the multiscale assessment tools. They generated different artificial vascular networks that resembled quasi-fractal or random behavior and were able to show that the analysis outcome is misleading if the tree and network parts are not separated before analysis. They concluded that the intracortical vasculature is a union of a random homogeneous capillary mesh and of quasi-fractal arterial and venous trees, which is in accordance with earlier findings of their group (Cassot et al, 2006; Lauwers et al, 2008).
Relationship between vascular topology and blood flow
In this section, we discuss the implications of vascular topology on blood flow. A look at the relevant nondimensional parameters reveals that flow in the cortical microvasculature is generally laminar, of blunted parabolic cross-sectional profile and free of inertia effects. Each vessel has a specific resistance to fluid flow, based on its geometry. The resistance of the total vascular network depends on how the individual vessels connect to each other. An additional level of complexity is introduced by the presence of red blood cells (RBCs), which increase the resistance of the vessels in which they reside. The topology has an influence on how the RBCs are distributed within the network. The degree to which this is the case depends on the size of the blood vessels. Finally, blood flow may also play a role in the development of vascular topology. Each point is discussed in more detail below.
Impact of Topology on Flow and Hematocrit Distribution
In fluid dynamics, dimensionless numbers are used extensively for characterization and comparison purposes. The most important dimensionless quantities for blood flow in vascular networks are the Reynolds (Re), Dean (De), and Womersley (

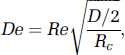
respectively. Here,
The Reynolds number relates inertial to viscous forces. For blood plasma flow, assuming a dynamic viscosity
The Dean number is particularly important for tortuous vessels. It is the ratio of the (geometric) mean of inertial and centripetal forces. The Dean number for cortical microvessels is small (as are the Reynolds and Womersley numbers) and secondary flow phenomena are therefore uncommon. It should be noted, however, that in principle (given specific vascular geometries), flow detachment may occur even in this flow regime (Leneweit and Auerbach, 1999).
The Womersley number characterizes pulsatile blood flow by relating oscillatory inertial forces to viscous forces. For Womersley numbers 1, the small inertia-viscosity ratio allows for a parabolic velocity profile to develop during each cycle and the flow may be approximated sufficiently well by the Hagen-Poiseuille law. In the pial vessels, the cardiac pulsation is still present and peak velocity exceeds the temporal mean by up to 50% (Seki et al, 2006). Their measurements also confirm that the cross-sectional flow profile remains parabolic throughout the cardiac cycle, justifying the assumption of
In summary, the low Reynolds, Dean, and Womersley numbers of the cortical microcirculation allow modeling of the cerebral blood flow by the steady (time independent) Stokes equation, rather than the full Navier-Stokes equations. The flow is entirely laminar (transition to turbulence is at
Plasma Flow
Each blood vessel has a specific resistance to flow. In the Newtonian case of pure plasma flow, this resistance is fully determined by the vessel geometry. Assuming a Hagen-Poiseuille flow profile, nominal resistance
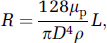
where
Red Blood Cell-Seeded Plasma Flow
Blood is a suspension of cells—predominantly RBCs—in plasma, rather than a pure fluid. As a consequence, the resistance of a vessel to blood flow depends not only on its geometry, but also on the composition of the blood that it carries. We speak of an effective resistance

This is the nominal resistance based on blood plasma flow
Therefore, the distribution of RBCs within a vessel network directly modifies the value of the individual resistors of the circuitry. This distribution is determined by the behavior of RBCs at vascular bifurcations, which in turn is influenced by the network topology. For example, a configuration of a main blood vessel with a small side branch usually results in the main vessel receiving the higher RBC volume fraction. As RBCs have a tendency to laterally migrate toward the midline of a vessel, a cell-depleted region near the vessel wall forms, further enhanced by an intraluminal lining of macromolecules known as the endothelial surface layer (Pries et al, 2000; Pries and Kubler, 2006; Pries and Secomb, 2008; Reitsma et al, 2007). Consequently, flow channeled from the near-wall region into small side branches carries fewer RBCs, an effect known as
Even at bifurcations with more equally sized daughter branches, phase separation generally occurs. That is, both plasma and RBC flow are divided unequally between the daughter branches and the two flow fractions do not match, leading to an increase in the hematocrit in one branch (compared with the parent vessel) and a decrease in the other. Usually, RBC volume fraction is increased in the branch with the higher flow (Pries et al, 1989). This behavior can be further modified by a nonsymmetric red cell distribution resulting from an upstream bifurcation.
Note that at diverging capillary bifurcations, the topology does not play a leading role. As the capillary lumen is comparable to red cells in size, the RBCs arrive along the midline of the vessel. On reaching a bifurcation, the cells are thought to follow the path of the steepest pressure gradient (Obrist et al, 2010).
Hematocrit Distribution - Possible Impact on Topology
As discussed in the previous section, the vascular topology strongly influences the hematocrit distribution within the blood vessel network. Conversely, the RBCs may have a role in defining the topological design. Numerical simulations performed by Obrist et al (2010) show that in artificial capillary networks, there often exist regions that are clogged with slow moving RBCs. The transit time of red cells negotiating these regions is markedly increased, which severely reduces their efficacy in terms of oxygen delivery.
Outlook
Although the field of cerebrovascular anatomy has grown considerably and has produced a number of important novel findings, there is a need for further developments to deliver answers that are required in many aspects related to cerebrovascular biology.
Recent technical advances have enabled researchers to acquire vascular network data from relatively large fields of view with a spatial resolution that is sufficient to resolve all vessels down to the capillaries. However, for many applications it is desirable to increase the field of view. It is very likely that state-of-the-art synchrotron radiation-based X-ray tomographic microscopy technology and postprocessing are capable of delivering a complete cerebrovascular reconstruction in a small experimental animal in the near future. Whole brain vascular reconstructions will be of utmost importance to increase the potential of cerebral blood flow modeling that is presently still limited by the problem of boundary conditions that have to be set (Lorthois et al, 2011; Reichold et al, 2009). Increasing the size of the reconstructed networks will also greatly enhance the statistical data on the different classes of vessels (cortical arteries and veins, capillary network) needed to more reliably extract and understand their topological features. In parallel, work on other species, including primate and human samples, should be continued. Eventually, a better understanding of the cerebrovascular topology will be the basis of creating algorithms to generate realistic artificial networks (Schneider et al, 2011) that could be used by researchers that do not have access to reconstructed vascular data sets. Another fast growing approach is the
Footnotes
Acknowledgements
The authors thank Anna Lena Keller for preparing brain samples and scanning electron microscopy. Furthermore, the authors thank her and Marco Stampanoni for their work at the tomography beamline TOMCAT of the Swiss Light Source and Anna Devor and Thomas Woolsey for important discussions.
Disclosure/conflict of interest
The authors declare no conflict of interest.