
Abstract
In patients with steno-occlusive disease of the internal carotid artery (ICA), cerebral blood flow may be maintained by autoregulatory increases in arterial cerebral blood volume (aCBV). Therefore, characterizing aCBV may be useful for understanding hemodynamic compensation strategies. A new ‘inflow vascular-space-occupancy with dynamic subtraction (iVASO-DS)’ MRI approach is presented where aCBV (mL blood/100 mL parenchyma) is quantified without contrast agents using the difference between images with and without inflowing blood water signal. The iVASO-DS contrast mechanism is investigated (3.0 T, spatial resolution=2.4 × 2.4 × 5 mm3) in healthy volunteers (
Introduction
Arterial dilation is facilitated by microvascular smooth muscle cells and is closely linked to cerebral blood flow (CBF) regulation (Hillman et al, 2007; Rapela and Green, 1964). Autoregulatory increases in arterial cerebral blood volume (aCBV) may have a role in maintaining sufficient CBF in patients with reduced cerebral perfusion pressure and early-stage steno-occlusive disease of the internal carotid artery (ICA) (Boysen, 1973; Derdeyn et al, 2002). In such patients, alterations in aCBV may precede alterations in CBF or oxygen extraction fraction and could provide an early indication of hemodynamic impairment and possible stroke risk (Derdeyn et al, 2002). However, such autoregulatory effects are not always detectable with current imaging techniques (Schumann et al, 1998; Zaharchuk et al, 1999) and it is unclear how aCBV should be interpreted for clinical management of patients with ICA steno-occlusive disease.
Total CBV quantification in humans is possible using invasive contrast agents and MRI (Ostergaard et al, 1998; Villringer et al, 1988), positron emission tomography (Powers and Raichle, 1985), computed tomography (Steiger et al, 1993) and single photon emission computed tomography (Sakai et al, 1985). However, noninvasive approaches for measuring CBV in humans would be useful for performing longitudinal studies of CBV regulation and for patients with contraindications to contrast agents. Noninvasive MRI approaches for measuring total (Lu et al, 2003) and venous (Stefanovic and Pike, 2005) CBV response to neuronal stimulation have been proposed and arterial spin labeling (ASL) MRI approaches have been modified to allow for aCBV estimation by comparing images with and without gradient-induced dephasing of blood water (Kim and Kim, 2005; Petersen et al, 2006). Spin labeling approaches can provide reproducible (Petersen et al, 2009) and comparable results to contrast agent-based techniques (Knutsson et al, 2010) and have promise for clinical imaging of steno-occlusive disease (Hendrikse et al, 2004).
Here, we introduce a modification to the recently proposed inflow vascular-space-occupancy (iVASO) MRI approach (Hua et al, 2009a) that enables quantification of aCBV in units of mL blood/100mL parenchyma. This proposed ‘iVASO with dynamic subtraction’ (iVASO-DS) sequence is similar to spin labeling approaches and involves subtraction of images with and without signal contribution from inflowing blood water. However, here we use the VASO principle of longitudinal blood water magnetization nulling to generate the aCBV-weighted contrast. The purpose of this study is threefold: (1) to present the iVASO-DS theory and show the contrast mechanism in healthy volunteers, (2) to apply this approach to patients with stenotic artery disease and to compare iVASO-DS with industry standard dynamic susceptibility contrast (DSC) CBV imaging, and (3) to assess the potential and limitations of the technique in the clinical context of patients with vascular disease. This work has been previously partially published in abstract form (Donahue et al, 2009c).
Materials and methods
Measuring CBV Changes With VASO MRI
VASO MRI has been used to measure CBV adjustments associated with increased neuronal activity (Lu et al, 2003). In VASO, blood water signal is nulled and the resulting image is anticipated to contain signal only from extravascular tissue. Reductions in the measured tissue signal are then used to quantify increases in the vascular compartment volume that accompanies neuronal activity. The VASO contrast mechanism has been investigated and information regarding signal changes (Donahue et al, 2006; Gu et al, 2006; Scouten and Constable, 2008), cerebrospinal fluid (CSF) contamination (Scouten and Constable, 2008), consistency with other CBV-weighted (CBVw) approaches (Jin and Kim, 2006), blood inflow (Donahue et al, 2009b), blood T1 variation (Donahue et al, 2009d; Wu et al, 2007), and clinical feasibility (Donahue et al, 2008; Uh et al, 2009) has been investigated.
One limitation of VASO is that the contrast mechanism is generally not designed to measure CBV in absolute units. Instead, VASO is used for assessing relative changes in CBV in response to neuronal tasks. This significantly limits the clinical potential of VASO and therefore it is desirable to extend the VASO approach for absolute CBV determination.
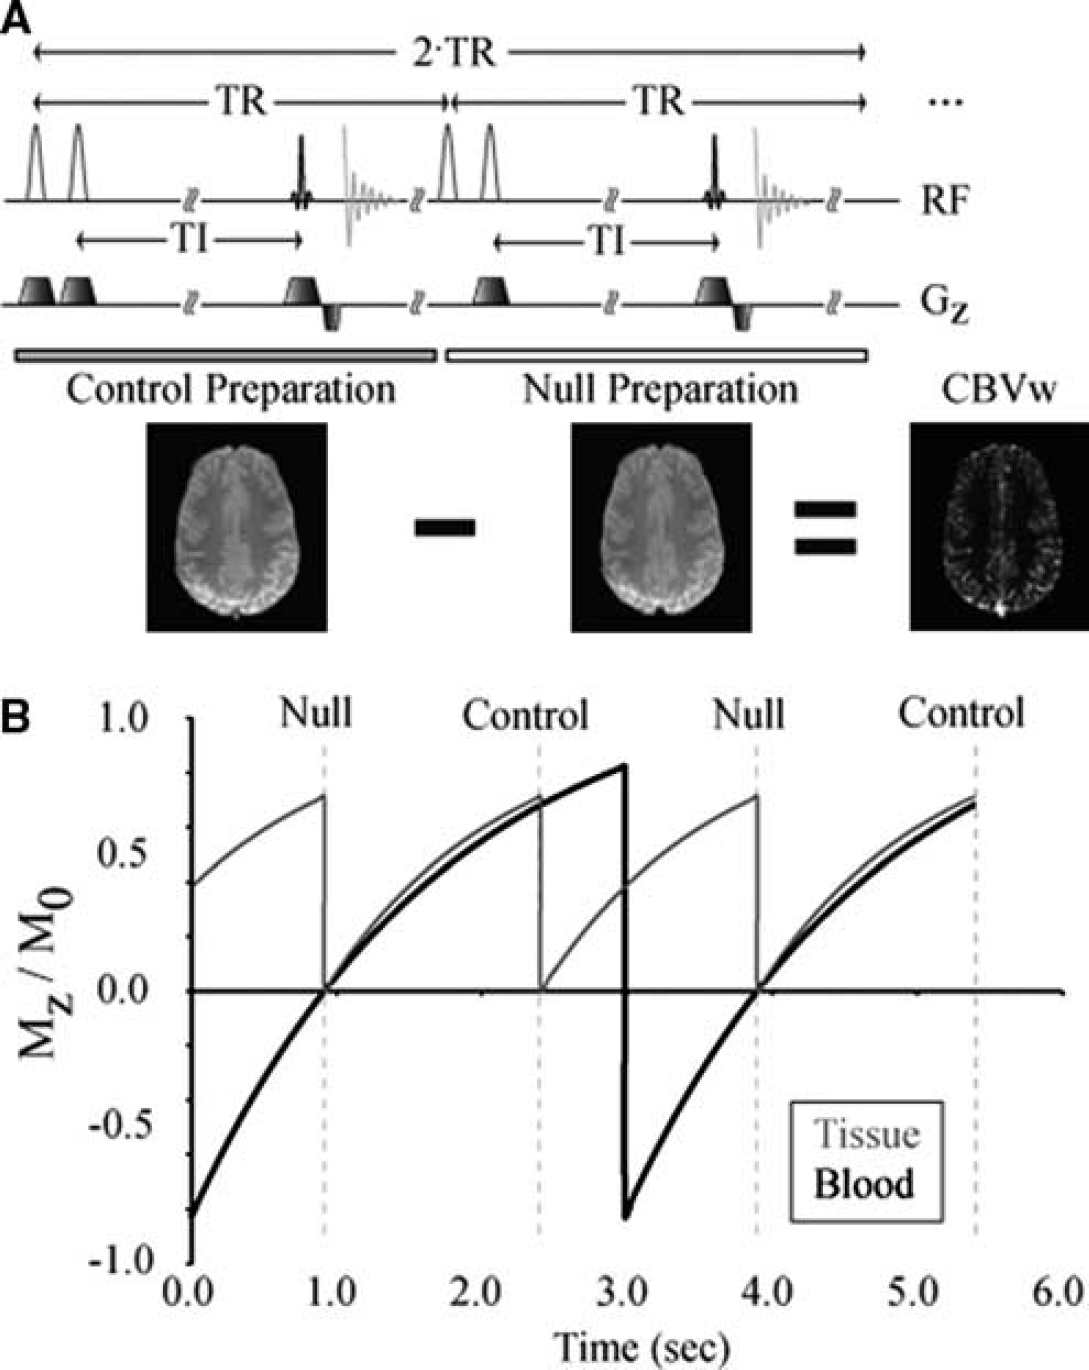
iVASO-DS Pulse Sequence
Recently, a modification has been introduced to the VASO sequence in which only blood water below the imaging volume is nulled. This iVASO approach increases the signal-to-noise ratio (SNR) over conventional VASO and is primarily sensitive to aCBV adjustments (Hua et al, 2009a). We propose an additional improvement to the iVASO technique to allow absolute aCBV to be quantified. This approach, termed iVASO with dynamic subtraction (iVASO-DS), uses the difference between a consecutively acquired
(
Null Acquisition
The null acquisition is in principle equivalent to iVASO, whereby inflowing blood water signal is nulled and the tissue signal in the imaging slice is unaltered. To accomplish this, a nonselective adiabatic radiofrequency (RF) inversion pulse is applied (RF = 180y ns), which is immediately followed by a slice-selective inversion of the imaging slice (RF = 180y ss). Therefore, blood water outside the imaging slice is inverted whereas blood water within the imaging slice is unaltered. After an inversion time (TI), an image is acquired. The TI is chosen to correspond to the time when the longitudinal magnetization (
Control Acquisition:
The inflowing blood water is not inverted, and is therefore nonzero, and the tissue signal is prepared identically to the case of the
Difference Image:
The tissue magnetization is identical in both
The subtraction procedure is similar to the increasingly used CBF-weighted ASL experiment, except that instead of tagging the blood, as is performed in ASL, blood water signal is nulled by choosing the TI to correspond to the blood water null time. Therefore, the iVASO-DS sequence is a combination of ASL and iVASO. Furthermore, as the TI needed for blood nulling is approximately on the order of the expected arterial-to-capillary transit times (700 to 1,100 ms), the CBV sensitivity is precapillary (as any tissue or venous contribution would require an additional transit time of 500 to 2,000 ms).
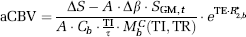
aCBV Quantification
The total gray matter (GM) parenchyma signal (

and
where
Tissue signal is ideally identical in the

The β terms in equation (3) have been introduced to account for possible imperfect tissue flip back efficiency (with
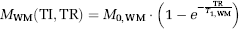
The blood water signal can be expanded in terms of the blood water density, aCBV (units = mL blood/100 mL parenchyma), longitudinal blood water magnetization (

TI/τ is approximately the fraction of blood present in the arterial compartment and assumes that blood from the labeling bolus begins arriving in the imaging slice immediately (see Discussion). The steady-state

During the control acquisitions inflowing blood water magnetization is given by
By choosing TI and TR such that equation (5) is satisfied, it is possible to obtain the null weighting desired. Table 1 shows different TR and TI combinations that satisfy this constraint for a 3.0T arterial
Methodological study
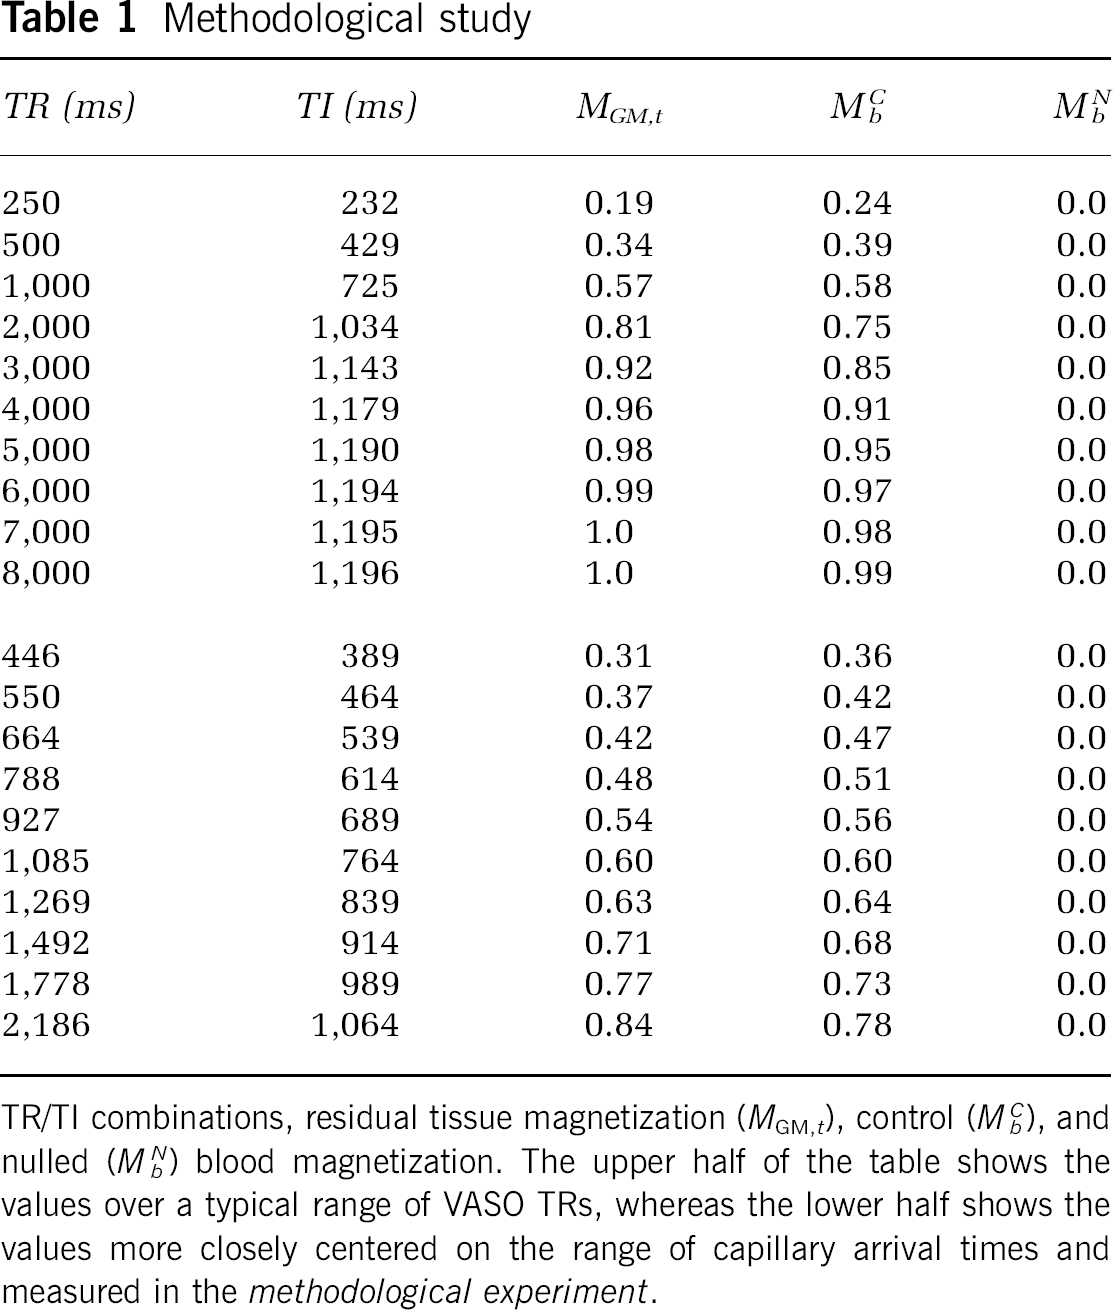
TR/TI combinations, residual tissue magnetization (
Using equations (3 to 6), aCBV can be quantified from Δ
The remaining unknowns are the scaling factor
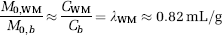
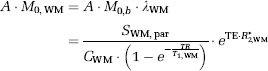
Calculating A and M 0,b
There are several ways of calculating

where
where
Incorporating equation (9):
Estimating Residual Tissue Signal
The residual tissue signal owing to differences in flip back efficiency in control and null acquisitions was measured by performing short TI = 389 ms iVASO-DS experiments and recording residual WM signal (Δ
where
Experiment
All study participants provided informed, written consent in accordance with the Oxfordshire Research Ethics Committee. Three separate sets of experiments were conducted to understand the nature of the iVASO-DS contrast mechanism. First, a
Experiments were performed at 3.0 T (Siemens, Erlangen, Germany). Common iVASO-DS experimental parameters for all experiments were FOV = 240 × 240 mm2, spatial resolution = 2.4 × 2.4 × 5 mm3, body coil transmit, 12-channel head coil receive, parallel imaging using GeneRalized Autocalibrating Partially Parallel Acquisitions (GRAPPA) (Griswold et al, 2002) with acceleration factor = 2.0, TE = 18 ms, gradient echo single-shot echo planar image, 1 slice (flip angle = 90°) centered 5 mm above the top of the corpus callosum with anterior commissure-posterior commissure orientation, and 10 difference image averages. In all experiments, an inversion recovery image (TR/TI = 5,000/1,054 ms) with identical spatial resolution and readout as the iVASO-DS acquisition was used for purposes of generating a GM mask.
Methodological Experiment:
Ten TR and TI combinations were investigated to understand how the iVASO-DS contrast was influenced by inflow time. The TI choices were chosen in 75 ms increments to span the approximate range of known capillary arrival times (389 to 1,064 ms); values are shown in Table 1 (lower). TR was adjusted for each TI to keep
Healthy Control Experiment:
On the basis of the results of the
Steno-Occlusive Disease Experiment:
The same TR/TI combination and iVASO-DS parameters as in the
Analysis
First, all data were corrected for motion with Motion Correction using FMRIB's Linear Image Registration Tool (MCFLIRT) (Jenkinson et al, 2002). Second, coil sensitivity will vary over the 12-channel head coil and this will introduce a spatial dependence in the
A GM mask was overlaid on the iVASO-DS CBV maps. The GM mask was generated from an inversion recovery image with identical spatial resolution and readout modality as the iVASO-DS acquisition. The scalp was removed from the inversion recovery image and a signal intensity threshold, based on a histogram of all values in the image, was used to generate the mask. Only aCBV within this mask was evaluated, according to the above model, separately for left and right hemispheres. For the
For DSC analysis in the steno-occlusive disease experiment, PErfusioN Graphical User Interface (Penguin) software with a singular value decomposition was applied to calculate CBF, CBV, and MTT (www.cfin.au.dk/software). Spatial smoothing (full width half max (FWHM)= 6 mm) was applied to DSC and iVASO-DS data in the steno-occlusive study. DSC quantification is sensitive to arterial input function choice; automated arterial input function detection available in the software was used; all maps are reported in arbitrary units (a.u.) and only contralateral-to-ipsilateral ratios are quantified, separately for DSC-CBF, DSC-CBV, and DSC-MTT. Additionally, we attempt to account for capillary arrival time asymmetries in the iVASO-DS data by using the DSC-measured MTT, which in the absence of collateral flow would be expected to be proportional to flow velocity and hence to the capillary arrival time. Therefore, a new corrected contralateral-to-ipsilateral iVASO-DS ratio was calculated in patients,
SNR was calculated in the iVASO-DS data as [mean Δ
Results
Figures 2A and 2B show simulations depicting how iVASO-DS is influenced by the capillary arrival time (τ) and aCBV. In Figure 2A, simulated iVASO-DS signal is plotted against a range of τ values assuming a constant aCBV = 1.5 mL/100mL and TI = 989 ms. This model assumes an infinite blood water tagging volume, which is approximately correct for this range of τ given that the inversion pulse is nonselective. For short τ, the difference signal is large owing to blood having completely filled the vascular compartment at TI. For long τ, the magnetic resonance (MR) signal difference is reduced as insufficient time has elapsed for blood to reach capillaries. Figure 2B shows the expected iVASO-DS signal versus aCBV for possible τ = 689, 989, and 1,289 ms. An imaging TI = 989 ms is assumed. Signal is linear with aCBV; the slope increases with decreasing τ. Therefore, for constant τ, the iVASO-DS Δ
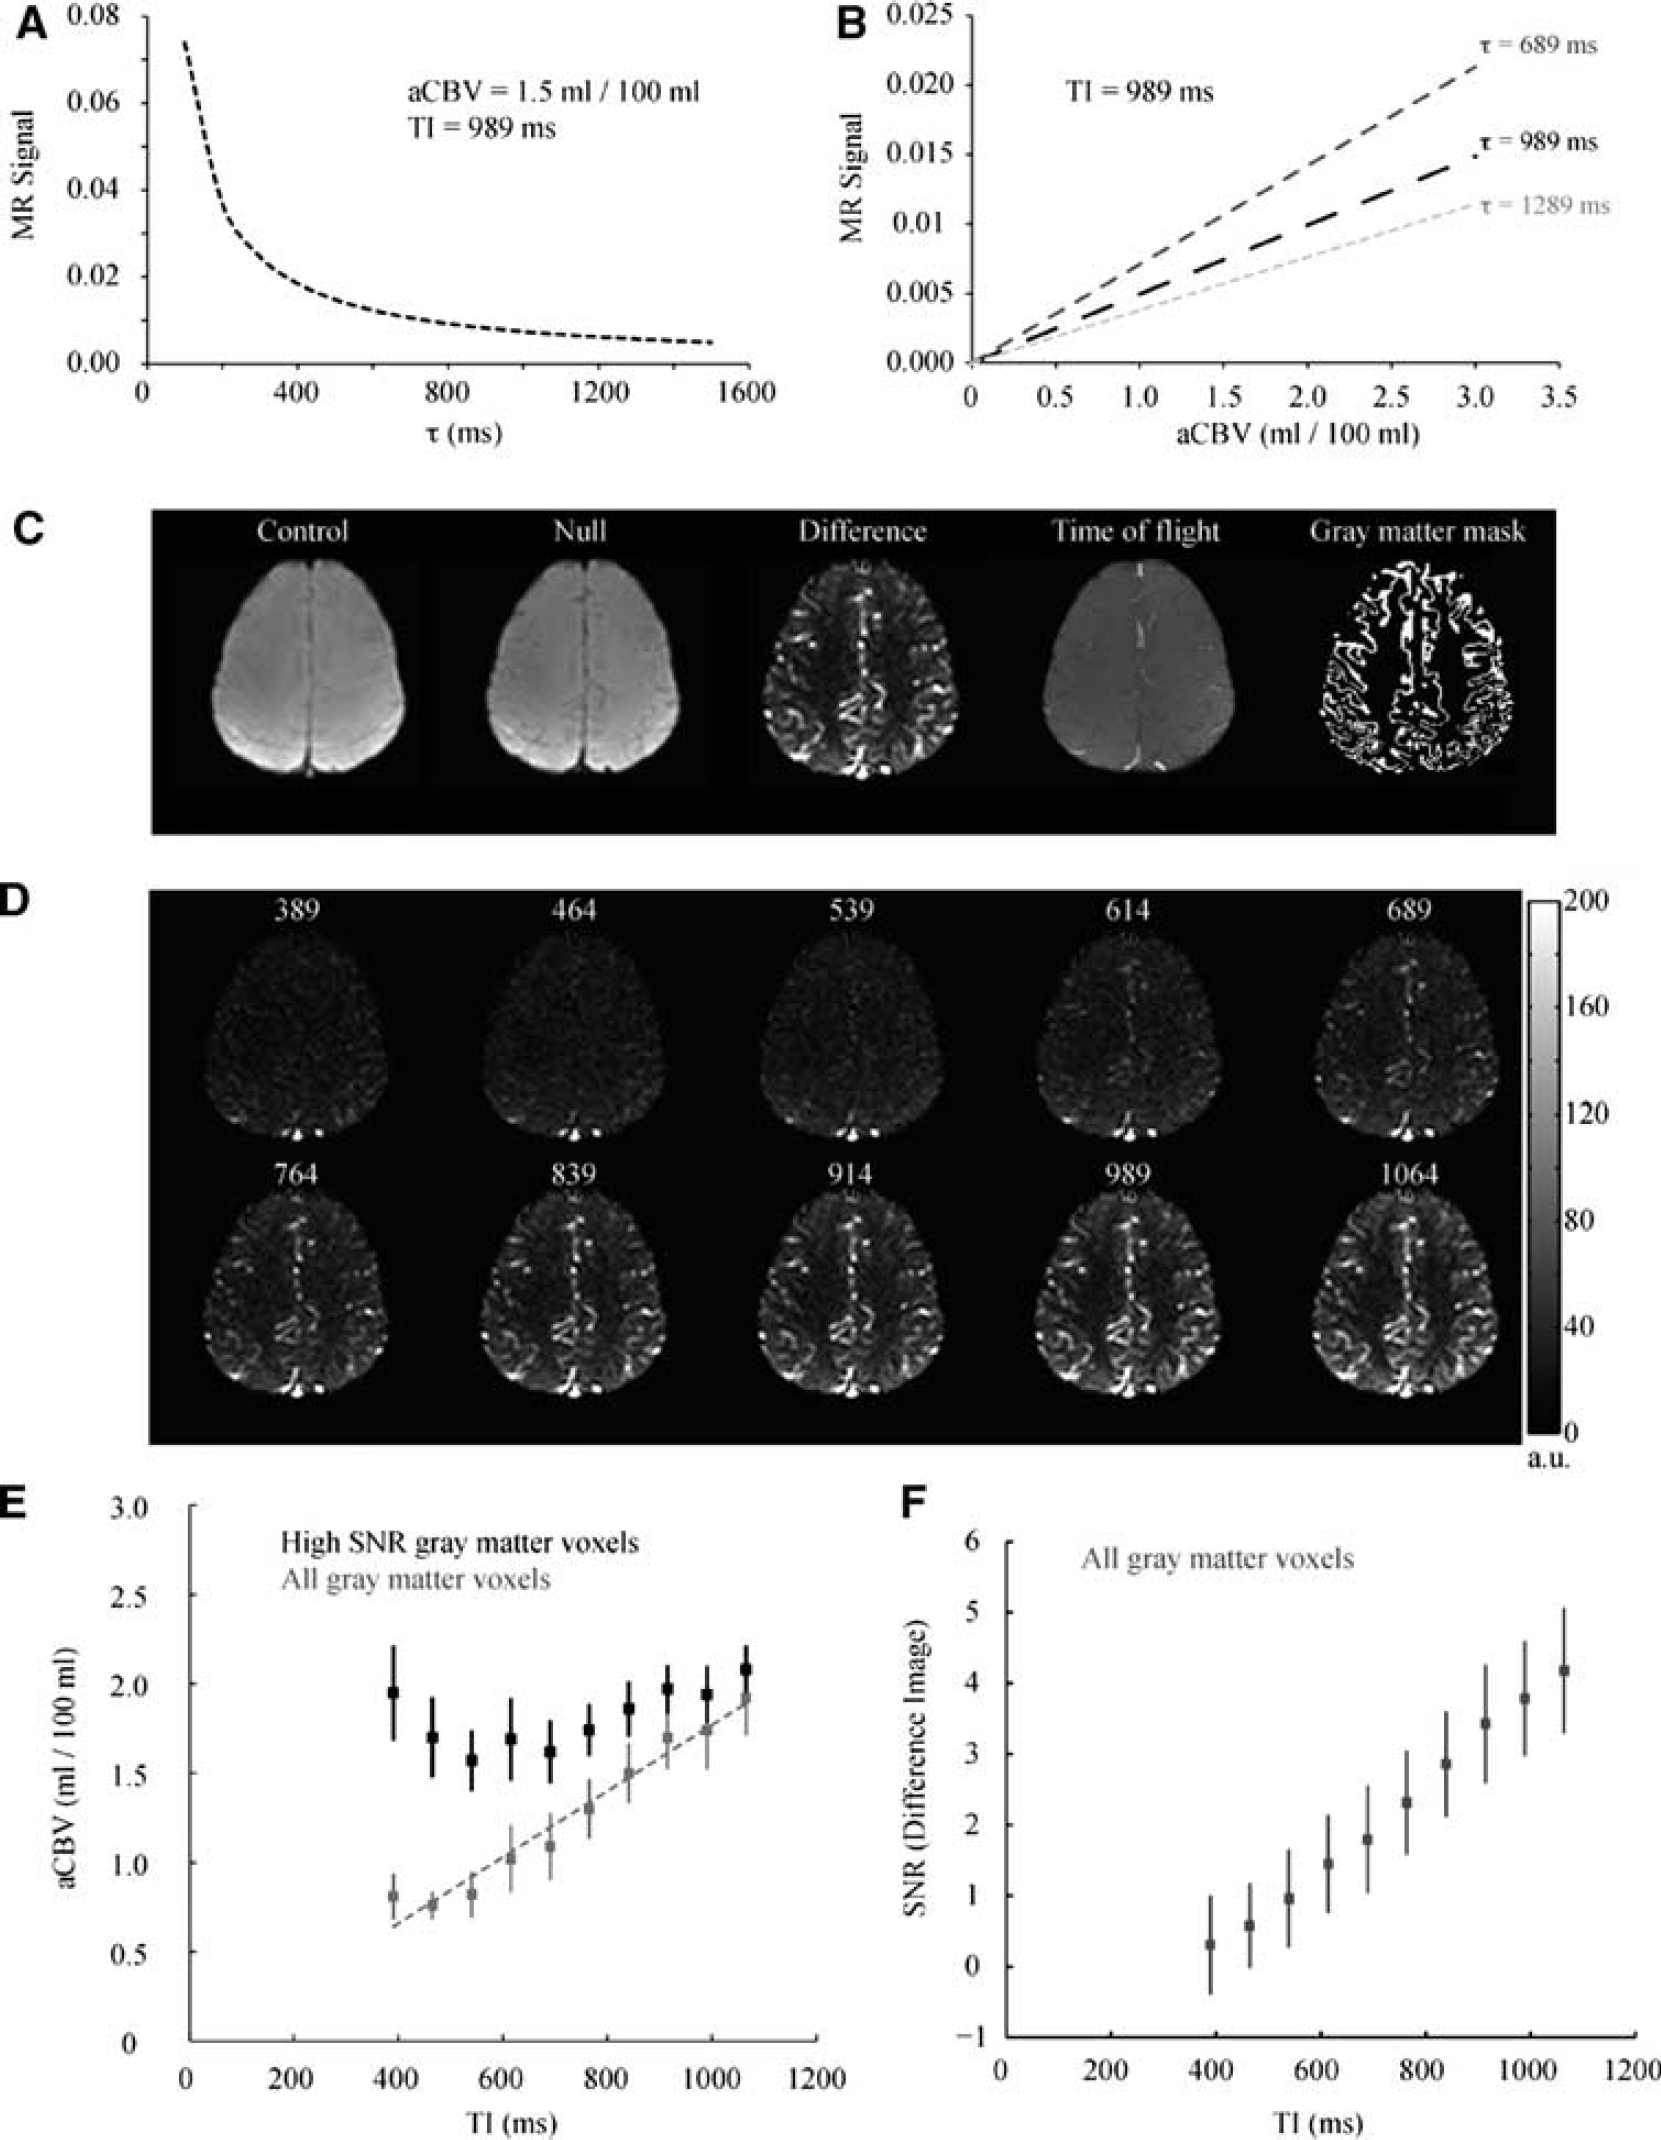
Methodological study. Simulations demonstrating the effect of capillary arrival time (τ) and aCBV on iVASO-DS MR signal. (
Figures 2C to 2F show the results of the
For short TI < 614 ms, signal is predominately uniform, however small hyperintensities can be seen in posterior regions where large vessels are present. For TI≥614 ms, blood water from the bolus begins to enter the smaller vessels. The quantified aCBV is shown in Figure 2E for both an ROI containing only voxels with high SNR (black) and within an ROI containing all GM (gray). The SNR threshold was chosen as 1 s.d. below the mean of the SNR in the TI = 1,064 ms image. SNR was 4.2 ± 0.74 (
Table 2 shows the results from the
Healthy control study
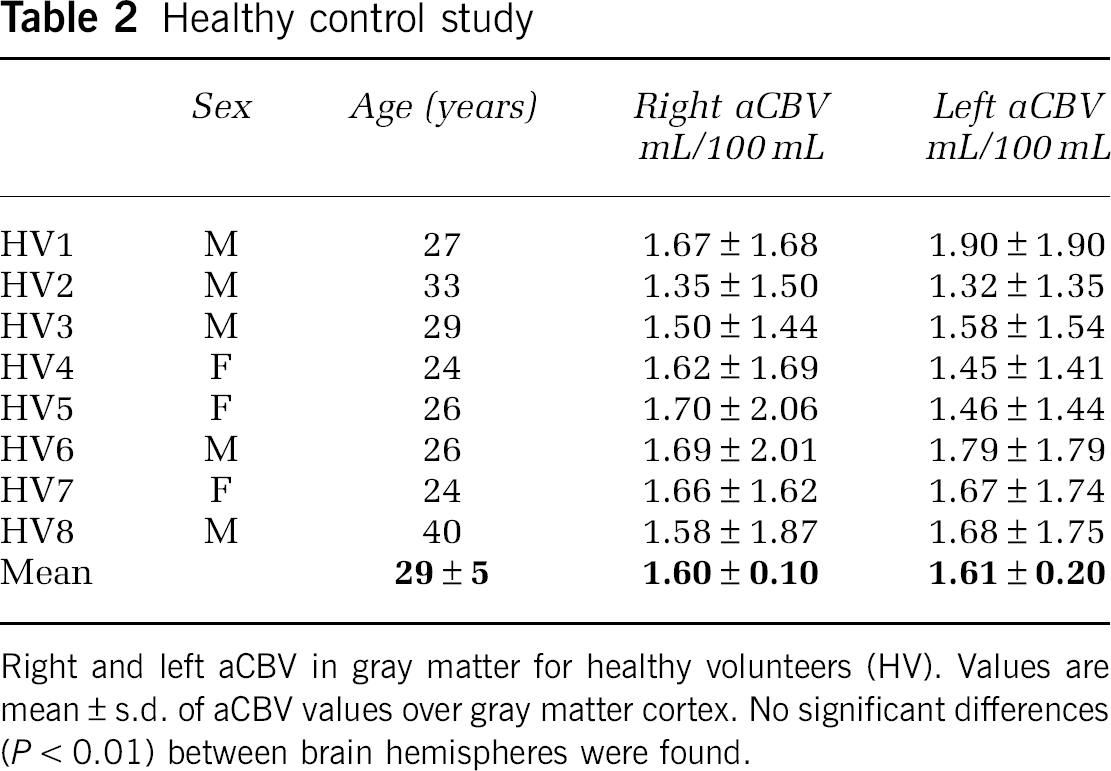
Right and left aCBV in gray matter for healthy volunteers (HV). Values are mean ± s.d. of aCBV values over gray matter cortex. No significant differences (
Table 3 shows the results from the
Steno-occlusive disease study
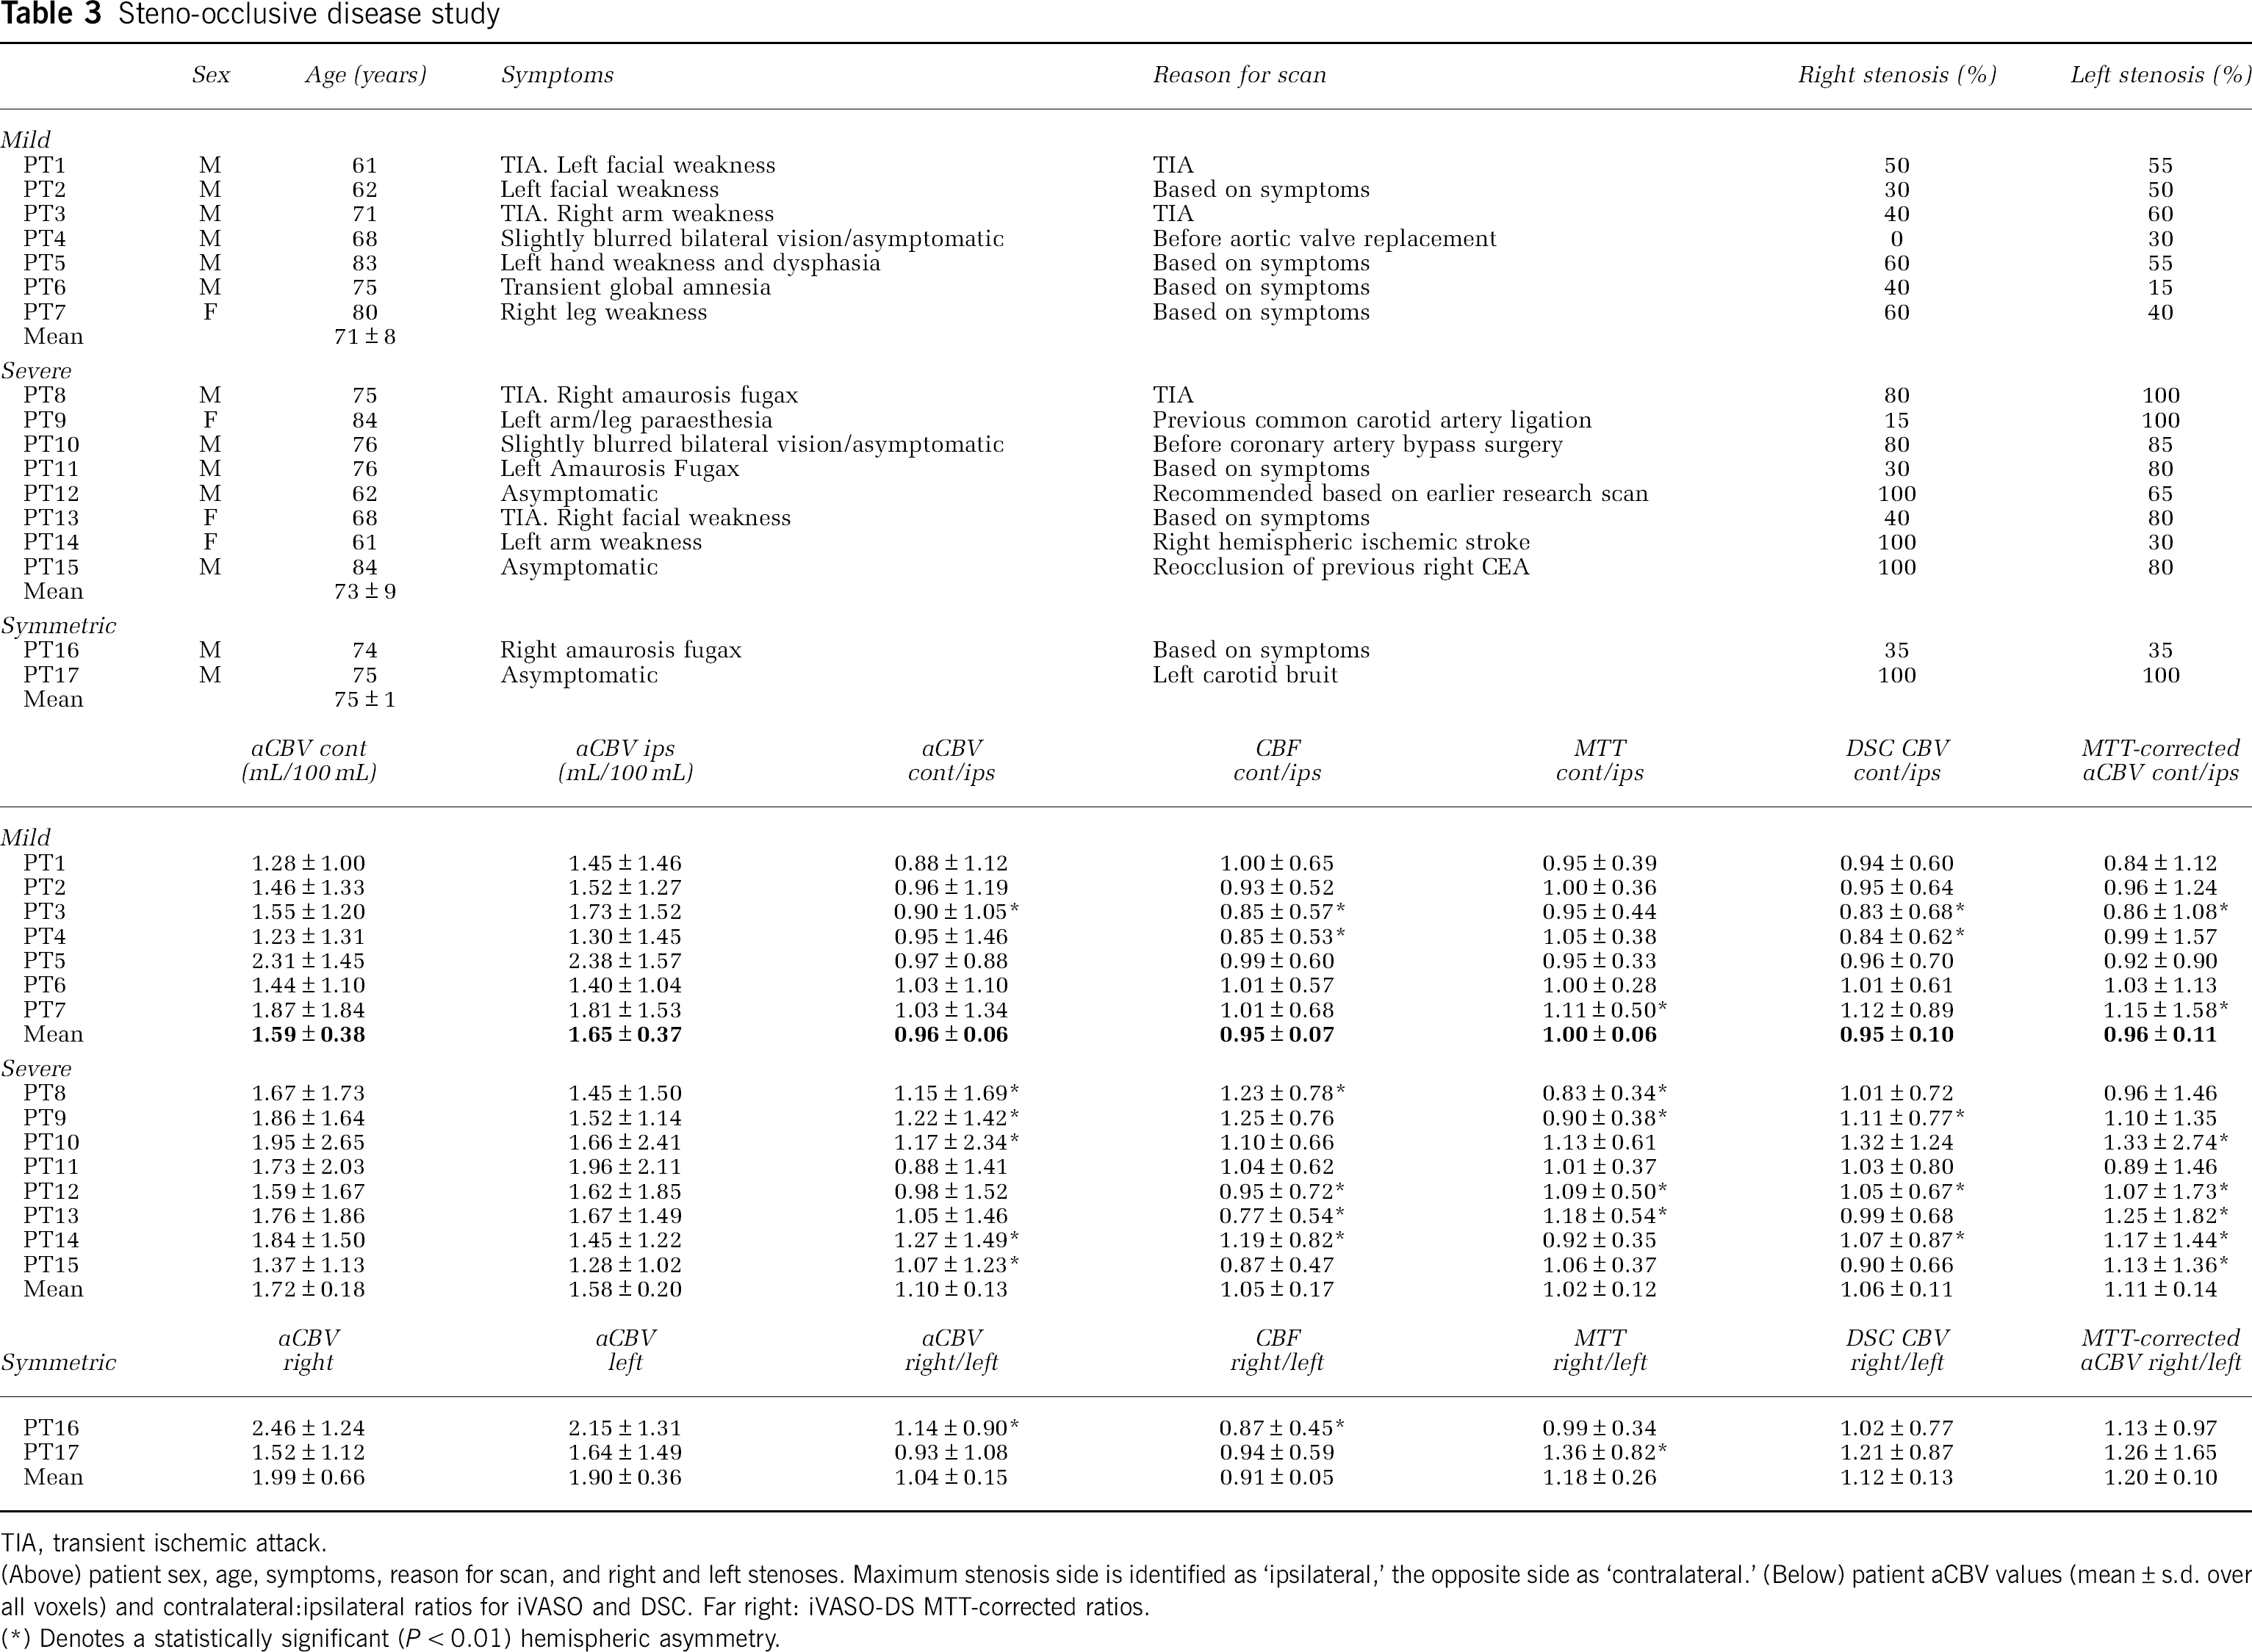
TIA, transient ischemic attack.
(Above) patient sex, age, symptoms, reason for scan, and right and left stenoses. Maximum stenosis side is identified as ‘ipsilateral,’ the opposite side as ‘contralateral.’ (Below) patient aCBV values (mean ± s.d. over all voxels) and contralateral:ipsilateral ratios for iVASO and DSC. Far right: iVASO-DS MTT-corrected ratios.
(*) Denotes a statistically significant (
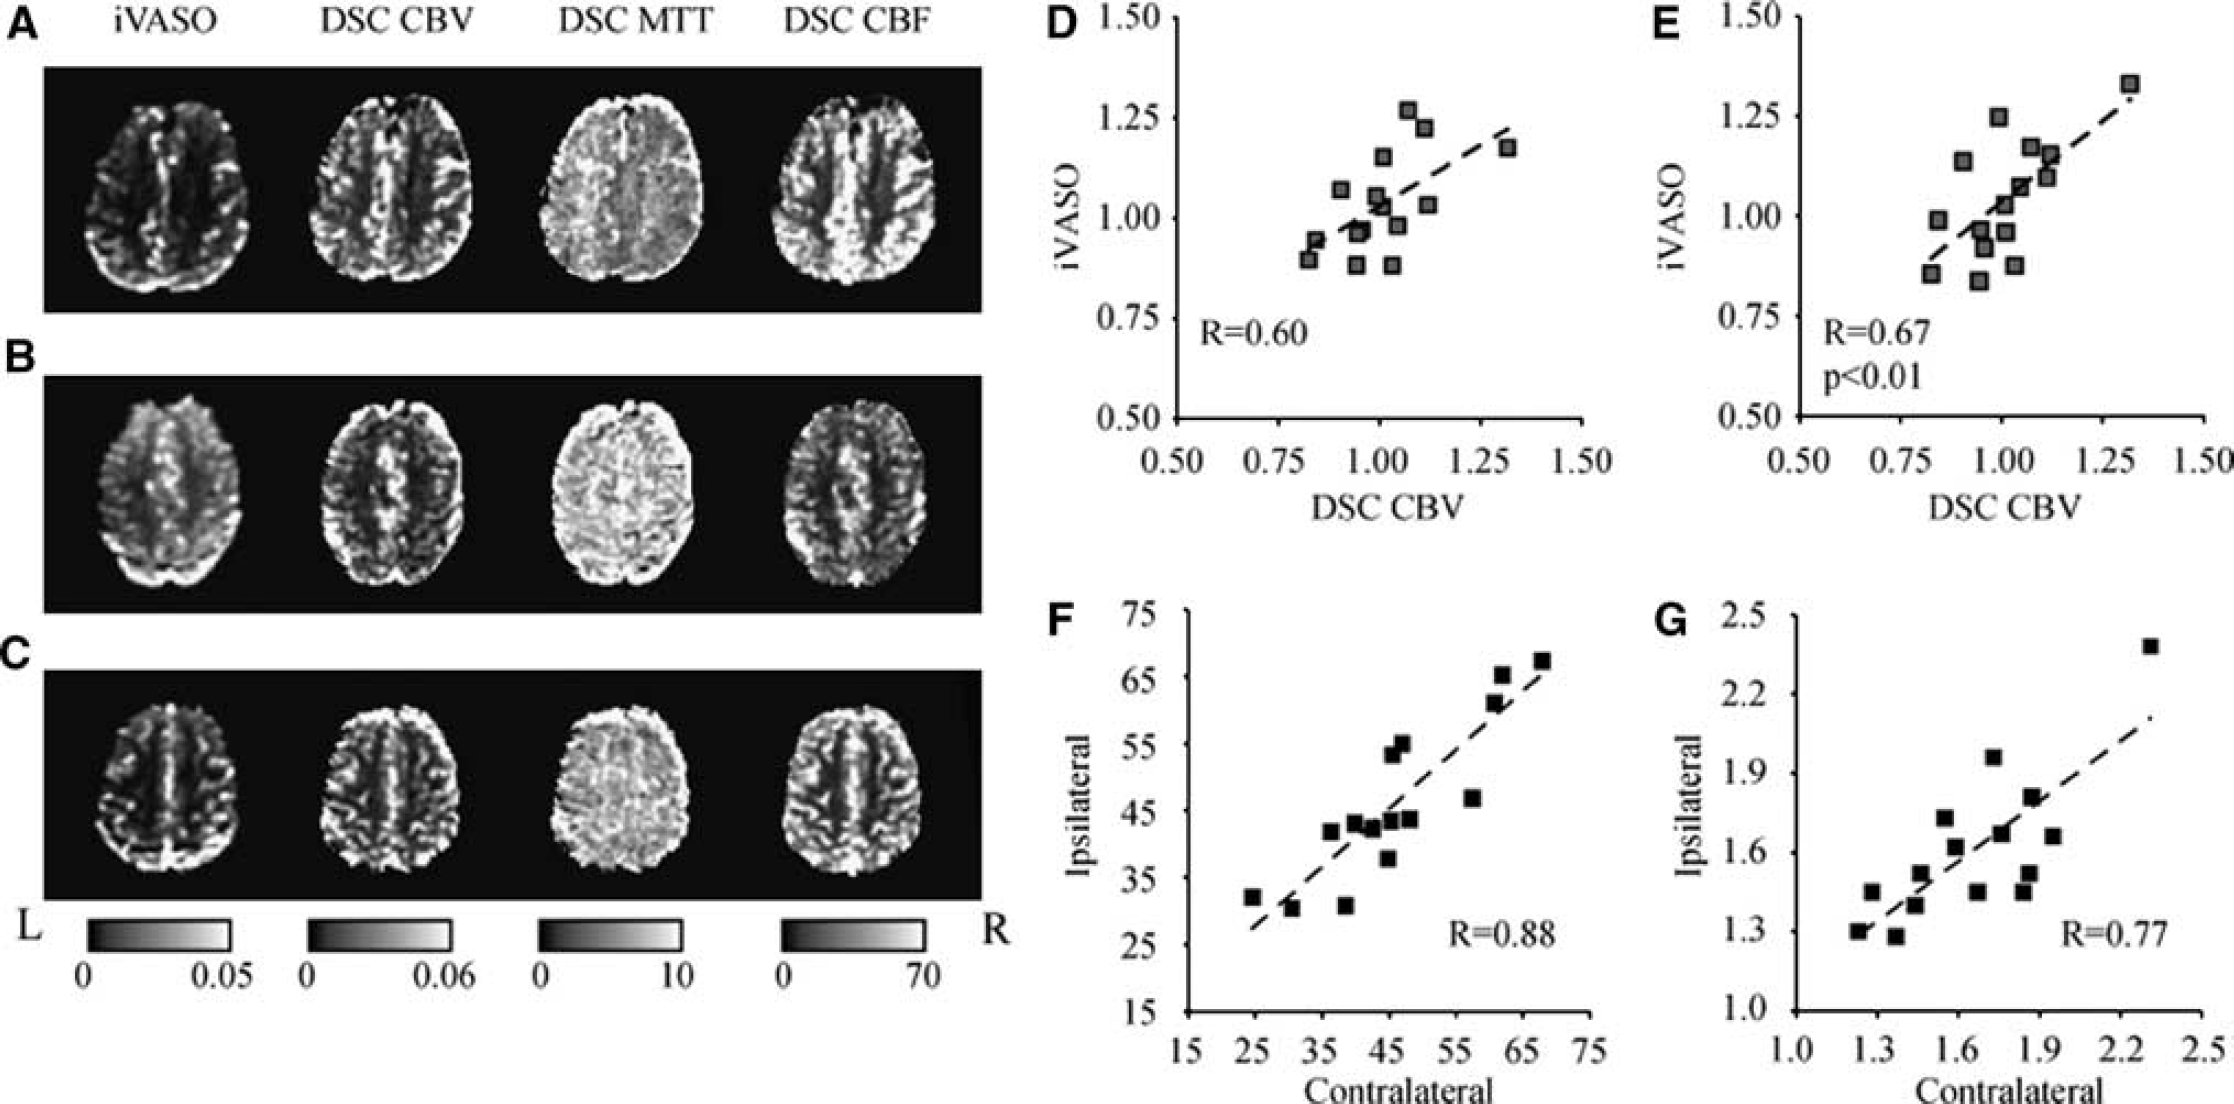
Representative iVASO difference images and DSC-computed CBV, MTT, and CBF maps for three representative patients: PT8 (
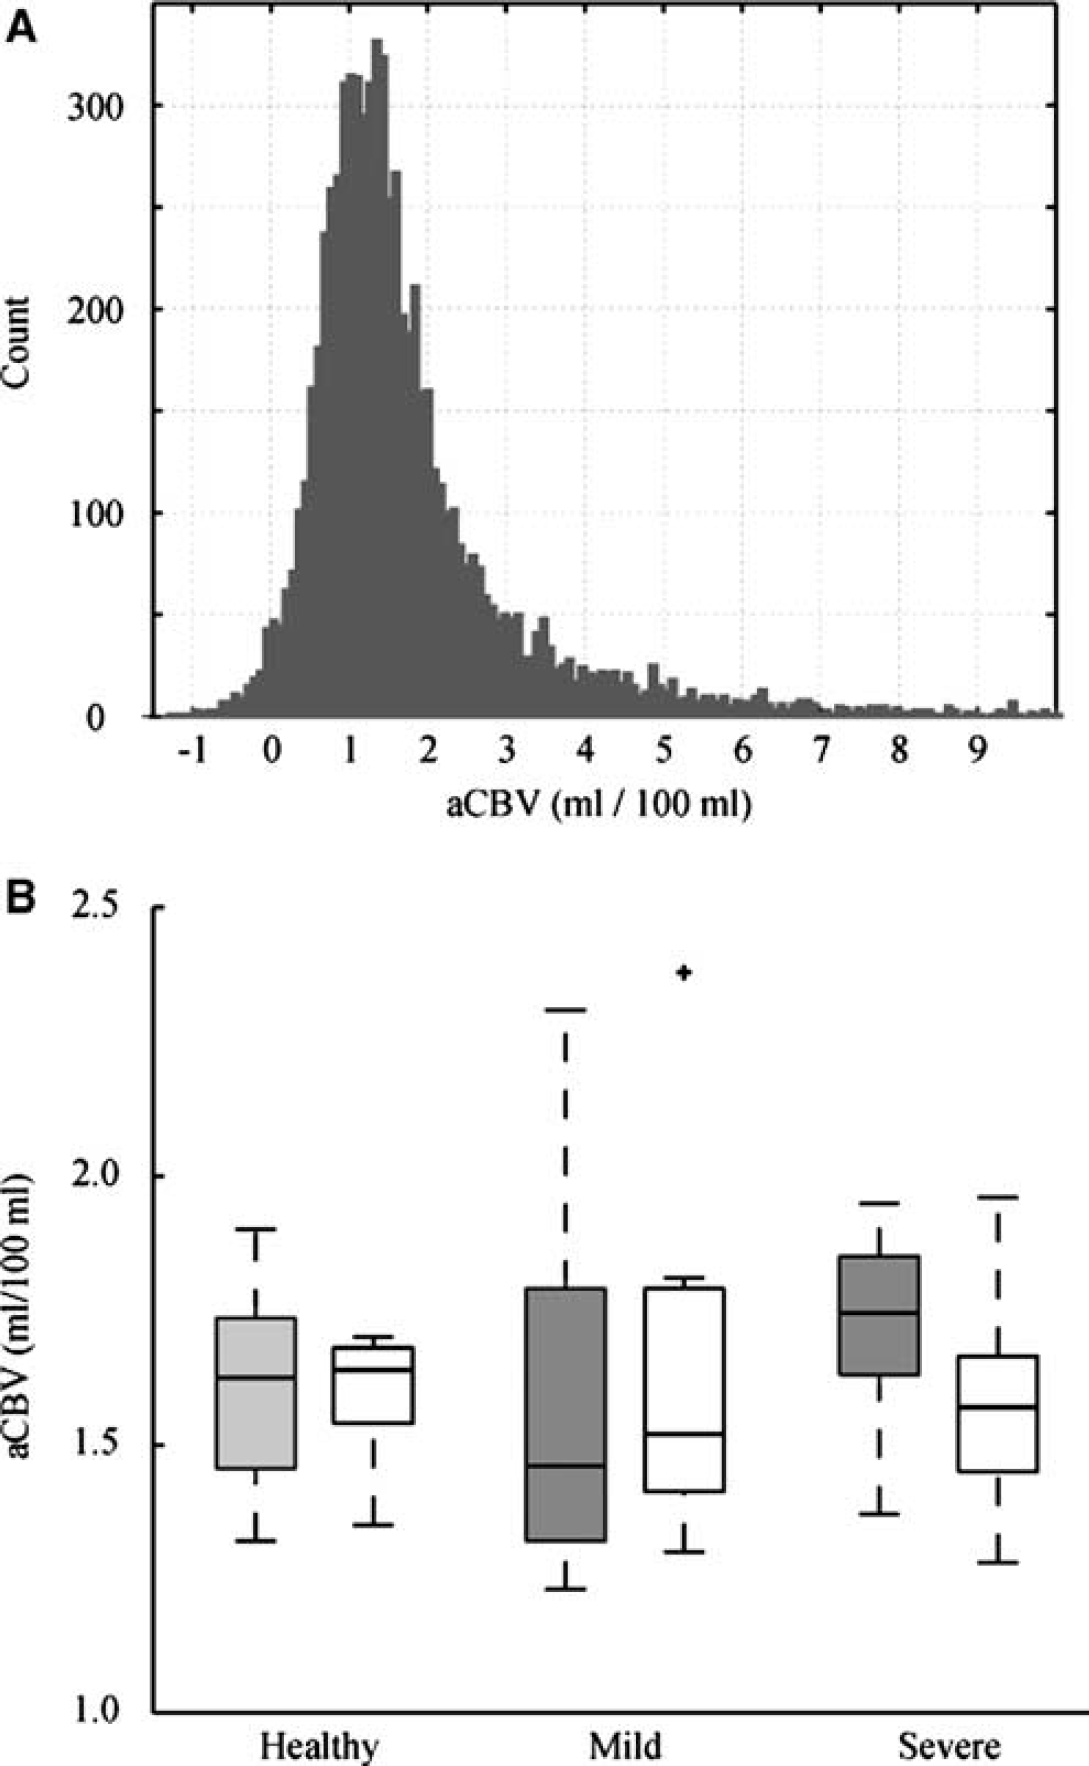
Figure 4 shows a summary of aCBV values. In Figure 4A, a histogram of all GM aCBV values for the healthy volunteer group is shown. There is a range of values with a peak at 1.0 to 1.5 mL/100 mL. The large spread in GM aCBV is likely attributable to different partial volume effects with small and large vessels, as well as possibly WM and CSF, and is the source of the large standard deviations in Tables 2 and 3. In Figure 4B, a box plot is shown summarizing the values for the healthy volunteers, patients with mild stenosis, and patients with severe stenosis. On average, aCBV values were not different between the control groups and any of the patient groups. However, a trend for significance was found between the contralateral hemisphere to maximum stenosis burden in severe stenosis patients and the healthy control group (Student's
(
Discussion
We show the feasibility of a new noninvasive MRI technique for measuring absolute aCBV. In this iVASO-DS approach, an image with and without inflowing blood signal is obtained, and the difference image is used to quantify aCBV in units of mL blood/100mL parenchyma. Experiments were conducted at multiple inflow times, followed by an investigation of how aCBV in healthy volunteers compared with aCBV in patients with ICA steno-occlusive disease. First, simulations suggested that iVASO-DS contrast should vary linearly with aCBV (Figure 2B) for constant capillary arrival time, which was subsequently validated experimentally (Figure 2E). However, for 839 ms < TI < 1,064 ms, aCBV plateaus
Arterial Cerebral Blood Volume
The aCBV values obtained are consistent with expected values from the literature, however varied over a physiologically expected range. Depending on the imaging modality used and region studied, total GM CBV is generally reported as 4.7 to 5.5 mL/100 mL (Giovacchini et al, 2002; Leenders et al, 1990; Lu et al, 2005). In addition, healthy precapillary CBV is commonly approximated as 20% to 30% of total CBV (An and Lin, 2002; van Zijl et al, 1998). This would lead to an expected GM aCBV of 0.94 to 1.65 mL/100mL, which is in the range of the healthy aCBV measured here.
Recently, GM aCBV was estimated using ASL MRI and values were reported to be slightly lower: 0.93 ± 0.06 mL/100 mL (Petersen et al, 2006). This lower value, which is also approximately within the range of expected aCBV, could be due to differences in brain location or spatial resolution (3.75 × 3.75 × 7 mm3 versus 2.4 × 2.4 × 5 mm3 used here). As larger voxels will partial volume with WM, which has a lower aCBV than GM, the larger voxel volume in the ASL study could account for some of the disparity. In addition, using MRI with modulation of tissue and vessel (MOTIVE) signals in isoflurane-anesthetized rats at 9.4 T, it was estimated that aCBV = 1.1 ± 0.5 mL/100mL in cerebral cortex (Kim and Kim, 2005). Although these results are slightly lower than the numbers we report here, they are within error of our results and of the physiologically expected range as well. Any remaining discrepancy could be explained by variations in spatial resolution, species, age, region of brain analyzed, and presence or absence of anesthesia.
Technical Considerations in iVASO-DS
We investigated the iVASO-DS contrast mechanism by qualitatively comparing iVASO-DS images acquired at multiple TIs with arterial TOF images and quantifying GM aCBV at each TI. It was found that aCBV varied linearly with TI in all GM voxels. However, when only voxels with high SNR were analyzed the aCBV reached a plateau for TI ≥ 839 ms. This TI corresponds approximately to arterial transit times and indicates that at this inversion time, blood water may begin reaching the capillary bed. Once the bolus reaches the capillary bed, exchange between blood water protons and tissue water protons will influence the iVASO-DS map. However, we observed no such perfusion effects on the time scale of our TI experiments and therefore it is likely that exchange effects do not become significant until longer TI. Single TI ASL experiments are designed to capture these exchange effects for perfusion quantification and therefore use TI ≈ 1,500 ms, which is much longer than the TI range here. On the basis of these results, TI = 839 to 1,064 ms is likely a promising window for aCBV quantification in iVASO-DS. In the case of patients with delayed capillary arrival times, a TI < capillary arrival time will lead to insufficient time for blood water to fill arteries + arterioles and an underestimation of aCBV. We have attempted to correct for this issue by incorporating MTT measures into our quantification procedure, however future work will benefit from individual subject capillary arrival time estimations, as can be achieved using the multi-TR/TI protocol from the methodological study here. Additionally, it is likely that sensitivity for microvasculature can be improved by incorporating bipolar flow-dephasing gradients with low
Measuring the capillary arrival time, which is defined here as the time for the labeled blood water bolus to move through the entire arterial + arteriolar space to the capillary exchange site, is an important next step for regional quantification of aCBV using iVASO-DS. Here, we compare only left and right brain hemispheres, which are expected to have similar mean τ values in healthy subjects. We observed a MTT asymmetry in 5/17 patients, and account for this asymmetry in the iVASO-DS analysis. When aCBV values were corrected for hemispheric MTT differences, the iVASO-DS contrast correlated significantly with DSC-measured CBV contrast. However, two issues should be noted. First, MTT is not a measure of the capillary arrival time, but instead the mean time for the bolus to pass through tissue given an instantaneous arterial input function. In addition, iVASO-DS measures primarily precapillary CBV whereas DSC is sensitive to total CBV. Therefore, a one-to-one correlation may not be expected. However, the significant correlation between the two approaches does indicate that iVASO-DS is sensitive to a blood volume metric.
The model introduced here assumes that blood water outside the imaging slice is in a nulled steady state in the null experiments, whereas tissue and blood magnetization are both nonzero and unchanging in control experiments. Conditions may exist in which, especially at short TI, blood water enters the imaging slice during one TR and remains in the imaging slice in the next TR. Here, such blood water would experience a different RF history than the inflowing blood water (Figure 1B). This is likely only a problem at extremely short TI where blood water does not have sufficient time to leave the slice (5 mm) after excitation. In addition, for blood water remaining in the slice in subsequent TRs, the RF effects will be identical in control and null acquisitions (inversion + flip back). Such blood water will likely be traversing different vascular compartments, with the signal in the capillaries and veins in later TRs. This blood water will experience a new steady state in which the magnetization is identical in control and null acquisitions. Therefore, this signal should cancel during the subtraction procedure. Thus, the only blood water that is likely contributing to the iVASO-DS signal is the inflowing blood water, which is consistent with the hypothesis that iVASO-DS is primarily precapillary weighted.
The iVASO-DS implementation here was only a single-slice acquisition, which prevented a more systematic regional analysis of aCBV asymmetries. To acquire one slice, we performed 20 image acquisitions (10 control and 10 null), which took ∼36 secs. Therefore, a series of 10 slices (∼50 mm coverage) could be obtained in 6 mins by performing each acquisition in a separate TR. A steno-occlusive disease study with larger volume coverage would be important for studying regional aCBV effects in different perfusion territories.
We only compartmentalize the voxel into extravascular GM tissue and blood, however even in the GM mask regions analyzed here, it is anticipated that some partial volume contributions from CSF and WM may be present. Future iVASO-DS models will likely benefit by inclusion of the contributions from these other compartments, and, by adapting existing multicompartment VASO models (Donahue et al, 2006) this should be possible. It has also been observed that when certain 3D readouts are used with traditional VASO imaging, such as 3D Gradient and Spin Echo (3D GRASE), a sensitivity improvement is found for nulling both blood water and CSF water simultaneously (Donahue et al, 2009a). This improvement is most noticeable with the 3D GRASE readout, and less so when a more typical 2D echo planar image readout is used, as is here. Future investigations should, however, be aimed at understanding contributions from CSF in the iVASO-DS signal, and also whether these contributions can be minimized with CSF signal nulling. This will be especially beneficial in patient studies where tissue atrophy may lead to additional CSF in the ROI. In this study, we observed no DWI lesions in the GM masks analyzed, although it is anticipated that in many patients, especially those with previous strokes, tissue atrophy, and lesions could lead to considerable partial volume effects and accurate aCBV quantification will need to account for this.
It should be noted that the iVASO-DS pulse sequence is similar to ASL as both sequences require RF manipulation of blood outside an imaging volume and a subtraction process. However, the contrast mechanism in iVASO-DS is fundamentally different than in ASL, as in iVASO-DS blood water is imaged before exchange with tissue water. This considerably simplifies certain aspects of the quantification process, but also reflects a different physiologic process (aCBV versus CBF). Therefore, though the pulse sequence is similar to an ASL sequence, the choice of TI = blood nulling generates a unique contrast. Moreover, it should be noted that iVASO-DS differs from a recently proposed ASL technique that measures CBF and aCBV (Petersen et al, 2006). aCBV is estimated by comparing images with and without blood water signal where bipolar gradients are used to dephase blood water signal as opposed to the VASO blood longitudinal magnetization nulling. This approach is also promising, however dephasing of blood water signal depends on the prescription of the gradient strength and direction. Similarly, with iVASO-DS, some blood water signal may not be nulled depending on which TI is used, and the corresponding blood water
The SNR of iVASO-DS is expected to be comparable to ASL SNR. It is possible that iVASO-DS SNR may be slightly higher owing to the contrast mechanism being derived from blood water signal in vasculature, as opposed to smaller
Finally, a slightly modified iVASO subtraction approach, similar to the approach presented here, has been suggested by Hua
Physiologic Observations and Clinical Potential
We found no significant difference in mean aCBV in right (1.60 ± 0.10 mL/100 mL) versus left (1.61 ± 0.20 mL/100 mL) hemispheres in healthy controls. However, we did find a large intervoxel variation in aCBV within hemisphere ROIs for individual subjects (Table 2; Figure 4A). This suggests that aCBV will vary significantly with voxel location and according to what extent the voxel partial volumes with large vessels.
The aCBV values from the healthy volunteers were compared against values in patients with steno-occlusive disease of the ICA. Unlike in the
As most CBV measurements require contrast agent injection, it is difficult to track patient progression over time because of regulations on dose and general patient comfort issues. Therefore, noninvasive approaches would be useful for understanding the role of autoregulatory vasodilation on symptom progression, CBF, and reduced cerebral perfusion pressure. In addition, in acute stroke, aCBV may be an important parameter in identifying vessel compliance and ischemic tissue at risk of infarction. Patients with elevated aCBV may respond more positively to thrombolysis treatment than patients with reduced aCBV, and thus aCBV may provide a useful measure to complement standard DWI and DSC imaging. Measurement of aCBV may have a role in identifying asymptomatic patients with carotid atherosclerotic disease that are most likely to benefit from carotid endarterectomy. For instance, elevated aCBV may signify those patients with limited hemodynamic reserve and increased risk of stroke. This subgroup of asymptomatic patients may warrant the risk of carotid endarterectomy as they may gain the most benefit. This is an avenue for clinical research but at present an unanswered question.
Conclusions
We propose the new iVASO-DS method for generating absolute aCBV maps. The pulse sequence for iVASO-DS is similar to a combination of the ASL and iVASO sequences, and involves the subtraction of an image where the blood magnetization is nulled from an image where the blood magnetization is nonzero. It is found that this approach generates physiologically expected aCBV values over 839 ms < TI < 1,064ms in high SNR voxels and corresponds with industry standard DSC-CBV imaging. In addition, aCBV was frequently elevated and more asymmetric in patients with severe steno-occlusive disease of the ICA, relative to controls. On the basis of these results, iVASO-DS may be a promising tool for probing autoregulatory aCBV and CBF compensation strategies, without the use of contrast agents, in patients with large vessel ischemic disease.
Footnotes
Acknowledgements
We are grateful to Steven Knight for experimental assistance and to all patients for their participation in this research study. This work was made possible by a grant from the Dunhill Medical Trust and the Oxford NIHR Biomedical Research Centre. This study was supported by the Dunhill Medical Trust, Heart and Stroke Foundation of Canada, National Institute of Health Research—Oxford Biomedical Research Centre.
The authors declare no conflict of interest.