
Abstract
Traumatic brain injury (TBI) is often exacerbated by events that lead to secondary brain injury, and represent potentially modifiable causes of mortality and morbidity. Diffusion tensor imaging was used to characterize tissue at-risk in a group of 35 patients scanned at a median of 50 hours after injury. Injury progression was assessed in a subset of 16 patients with two scans. All contusions within the first few days of injury showed a core of restricted diffusion, surrounded by an area of raised apparent diffusion coefficient (ADC). In addition to these two well-defined regions, a thinner rim of reduced ADC was observed surrounding the region of increased ADC in 91% of patients scanned within the first 3 days after injury. In patients who underwent serial imaging, the rim of ADC hypointensity was subsumed into the high ADC region as the contusion enlarged. Overall contusion enlargement tended to be more frequent with early lesions, but its extent was unrelated to the time of initial imaging, initial contusion size, or the presence of hemostatic abnormalities. This rim of hypointensity may characterize a region of microvascular failure resulting in cytotoxic edema, and may represent a ‘traumatic penumbra’ which may be rescued by effective therapy.
INTRODUCTION
Traumatic brain injury (TBI) is often exacerbated by events that lead to secondary brain injury, and represent potentially modifiable cause of mortality and morbidity. Such secondary injury results from activation of a cascade of metabolic, immunological, and biochemical changes that ultimately result in irreversible cell damage. Clinical therapy aims to prevent or minimize the burden of secondary injury. However, demonstration of the benefit of individual interventions is difficult, and is hampered by clinical heterogeneity and the fact that most outcome measures are assessed months after the intervention, and may hence be confounded by multiple factors.
To date, clinical trials have been unable to show efficacy in improving the clinical outcome of such patients, perhaps because the translation from experimental therapies to clinical trials has been undertaken without adequate refinement of the interventions tested. 1 One potential means of improving such translation is to characterize tissue at-risk using early imaging studies, and define markers of injury progression in these tissue compartments. The modulation of such injury progression could then provide an imaging biomarker of intervention efficacy in the clinical setting. In principle, this approach proposes that, like the ischemic penumbra in stroke, there may be a ‘traumatic penumbra’ 2 of at-risk tissue after TBI, which may be rescued by effective therapy. However, this area(s) is difficult to localize, as injury in TBI does not conform to vascular territories or anatomical boundaries. The only exception to this is pericontusional tissue, which is often absorbed into the contusion core over time. Indeed, microdialysis studies have identified an area of metabolically compromised tissue surrounding contusions, which may have the capacity to regain a normal metabolic pattern but also appears to have an increased vulnerability to secondary insults. 3 Progression of contusions is commonly seen on X-ray computed tomography.4–7 Some studies report that up to 65% of lesions increase in size within the first 24 hours, and that such lesion growth may be related to the presence of coagulopathy. 4 This progression may lead to raised intracranial pressure, neurological deterioration, and/or require surgical intervention; and, in itself, has been associated with unfavorable outcome including death.4,5 While the underlying biology of this phenomenon remains unclear in human TBI, data from experimental models of TBI indicate that contusion expansion into the penumbral region may be preceded by marked reductions in cerebral blood flow (CBF), 8 and incorporates a phenomenon that has been described as microvascular failure. 9
While conventional magnetic resonance imaging (MRI) can show such lesion growth, it provides limited insights into the underlying pathophysiology and its modification by therapy.
Diffusion tensor MR imaging (DTI) may provide better characterization of such pathophysiology and allow contusion growth to be used as an imaging biomarker of treatment efficacy in the early drug development. This technique characterizes the diffusion of water molecules in tissue environments, which is influenced by the microstructural organization of tissues and their constituent cells, and can provide unique insights into pathophysiology, particularly in white matter. The diffusion tensor can be used to represent the magnitude of water diffusion (quantified as the apparent diffusion coefficient, ADC), describe whether such diffusion is directionally non-uniform (anisotropy), and characterize the orientation of that direction (eigenvectors/eigenvalues). Experience from both human experimental and clinical studies, particularly in ischemic stroke, suggest that ischemic cytotoxic edema is associated with restricted diffusion (low intensity on ADC maps), while vasogenic edema is associated with increased diffusion (high intensity on ADC maps). The use of ADC maps for such characterization, rather than diffusion-weighted images (DWIs), allows the isolation of diffusion properties of tissue water from changes in T2 behavior—which result in high T2 lesions ‘shining through’ on DWIs even when there is no change in ADC.
Experimental data indicate that DTI may be of use in characterizing focal tissue damage in models of TBI10,11 and in differentiating ischemic and traumatized tissue. 12 These data also indicate that both vasogenic and cytotoxic edema can occur after trauma. 13 However, despite these data, most human studies focus on detecting diffuse injury away from contusions in the chronic phase of injury, a context in which DWI is clearly a promising technique.14–17 There are few clinical studies describing DWI changes around traumatic contusions in human TBI,18–21 with two reporting the presence of a mixed picture of vasogenic and cytotoxic edema.20,21
This study aimed to use DTI to further characterize pathology in pericontusional tissue, and define its temporal evolution to help inform the development of imaging biomarkers of acute pathophysiology, tissue fate, and intervention efficacy.
MATERIALS AND METHODS
Thirty-five patients (29 male, 6 female, mean age 35.2(s.d. ± 12.6) years with moderate-to-severe TBI underwent MR imaging using a 3 Tesla Siemens Magnetom Total Imaging Matrix (TIM) Trio (Siemens AG, Wittelsbacherplatz, Munich, Germany). All patients were admitted to the Neuroscience Critical Care Unit and required sedation and mechanical ventilation. All patients were treated with protocol-driven therapy aimed at keeping the intracranial pressure <20 mm Hg and a cerebral perfusion pressure of 60–70 mm Hg.
22
Sixteen patients underwent two scans while still receiving treatment in the intensive care unit, and sixteen (
The imaging protocol included DTI, a 3D T1-weighted structural sequence (magnetization-prepared rapid gradient echo), a fluid-attenuated inversion recovery sequence, a gradient echo sequence, and a dual-spin echo (proton density/T2 weighted) sequence. The DTI parameters were as follows: 12 non-collinear directions, 5
In four patients 15O PET imaging was performed within 72 hours of patients’ admission to the Neurosciences Critical Care Unit, on a General Electric Advance scanner (GE Medical Systems, Milwaukee, WI, USA). A transmission scan, using two rotating germanium-68 rods, was performed for all patients, and used to correct the emission data for photon attenuation. Emission data were acquired in three-dimensional mode during a 20-minute steady-state infusion of 800 MBq of H215O, after a 60-second inhalation of 300 MBq C15O, and in two-dimensional mode during a 20-minute steady-state inhalation of 7200 MBq of 15O2. Images were reconstructed using PROMIS 3D filtered back projection algorithm, with corrections applied for attenuation, scatter, randoms, and dead time. From radioactivity concentrations in the brain and arterial blood, parametric maps of CBF, oxygen utilization (CMRO2), cerebral blood volume (CBV), and OEF were calculated as described by our group previously. 24
Coagulation status was documented in all patients, and included the highest prothrombin time, highest activated partial thromboplastin time, and lowest platelet count for both the first 24 hours of admission and for those who had two scans, during the period until the second scan.
Image Analysis
Diffusion tensor MR imaging data were processed using the Oxford Centre for fMRI of the Brain Diffusion Toolbox, and all the
(
Ten contusions were drawn twice by one investigator (VN) and twice by two others (HR, LM) to test for intra and interobserver reliability. In patients who were scanned twice, the ROIs from the first scan were coregistered to the second scan using the vtkCISG normalized mutual information algorithm to assess any change in that particular ROI over time. Mean ADC, axial diffusivity (major eigenvalue), and radial diffusivity (defined as the average of the smaller two eigenvalues) were defined for each ROI using in-house software (GBW).
Positron emission tomography (PET) images were analyzed using custom-designed automated software (Petan) 25 incorporating elements of statistical Parametric Mapping (SPM2002, Wellcome Department of Cognitive Neurology, London, UK, http://fil.ion.ucl.ac.uk/spm), Matalb 6 (MathWorks, Natick, MD, USA), and Analyze 7.0 (AnalyzeDirect, Lenexa, KS, USA). Corrected maps of CBF, CBV, CMRO2, and OEF were generated. They were coregistered to the diffusion space using the vtkCISG normalized mutual information algorithm, and ROIs overlaid to allow qualitative assessment of the metabolic maps with the diffusion maps. As there were only four patients, no statistical comparisons were performed but the images were visually inspected to see qualitatively how the PET parameters corresponded to the ADC maps.
Statistical analyses were conducted using SPSS (SPSS 18.0, Chicago, IL, USA, http://www.spss.com). Following assessment of the data for normality, parametric and non-parametric comparisons were performed where appropriate. Mann–Whitney
RESULTS
The patient demographic details are summarized in Table 1, and in more detail in Supplementary Table 1. Four of the control subjects were not used in the analysis because of excess movement artifact, leaving 32 healthy volunteers in the analysis. As all patients were sedated and ventilated for their early scans movement artifact was not observed. There were no significant differences in age between the controls and the patients, including the subgroup with two scans, and no significant difference between the group of patients scanned once vs. those scanned twice in any of the demographic or clinical details (including time to first scan). For all ROIs, the intra and interclass correlation coefficients were above 0.80, indicating strong agreement within and between observers.
Summary of demographic and clinical characteristics of the controls and patients
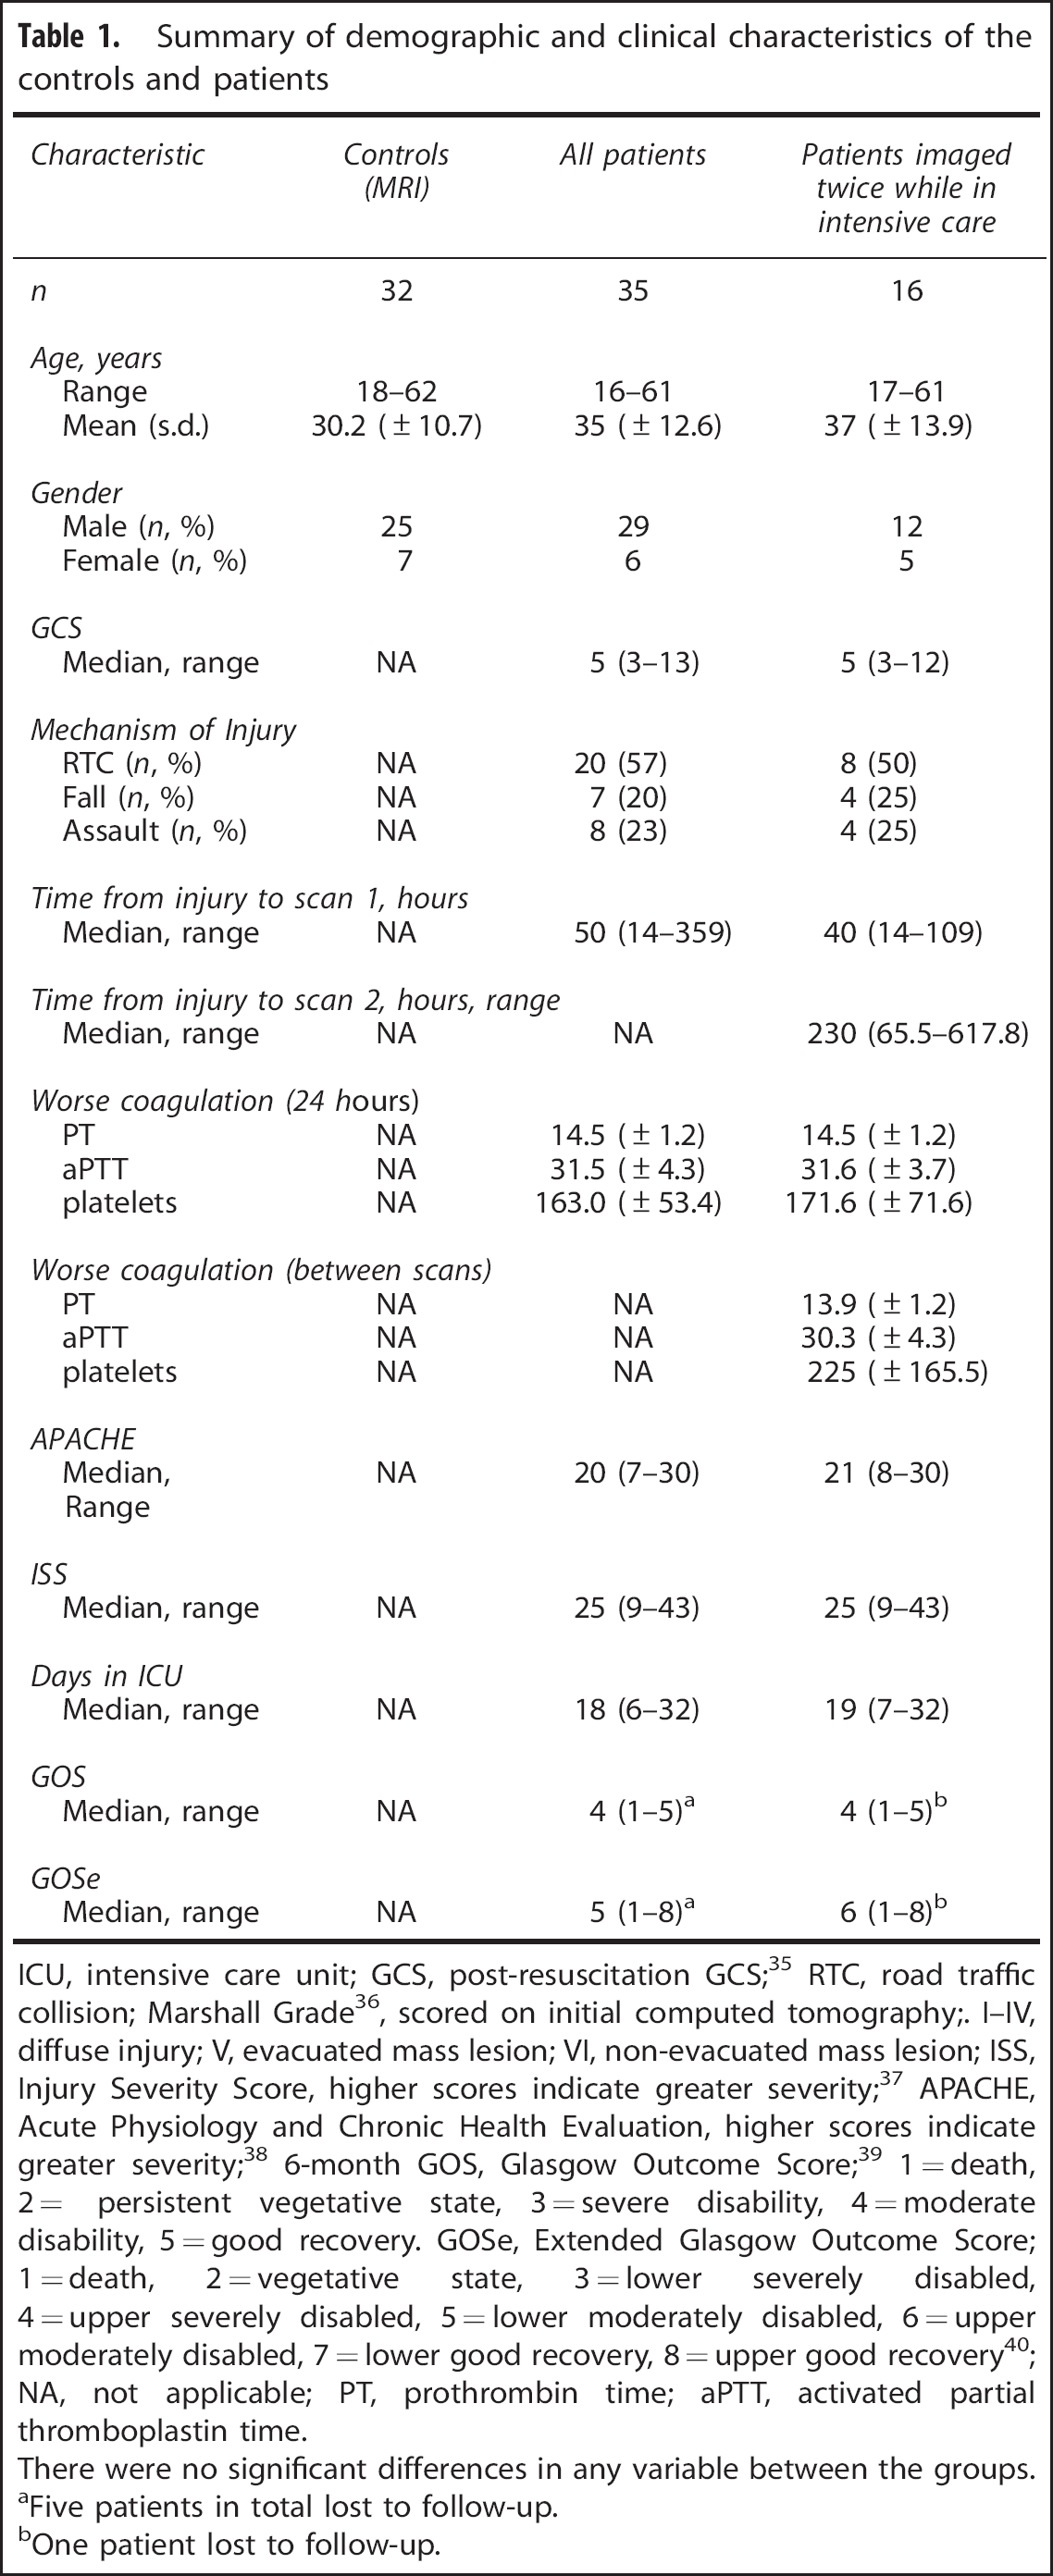
ICU, intensive care unit; GCS, post-resuscitation GCS; 35 RTC, road traffic collision; Marshall Grade 36 , scored on initial computed tomography;. I–IV, diffuse injury; V, evacuated mass lesion; VI, non-evacuated mass lesion; ISS, Injury Severity Score, higher scores indicate greater severity; 37 APACHE, Acute Physiology and Chronic Health Evaluation, higher scores indicate greater severity; 38 6-month GOS, Glasgow Outcome Score; 39 1 = death, 2 = persistent vegetative state, 3 = severe disability, 4 = moderate disability, 5 = good recovery. GOSe, Extended Glasgow Outcome Score; 1 = death, 2 = vegetative state, 3 = lower severely disabled, 4 = upper severely disabled, 5 = lower moderately disabled, 6 = upper moderately disabled, 7 = lower good recovery, 8 = upper good recovery 40 ; NA, not applicable; PT, prothrombin time; aPTT, activated partial thromboplastin time.
There were no significant differences in any variable between the groups.
aFive patients in total lost to follow-up.
bOne patient lost to follow-up.
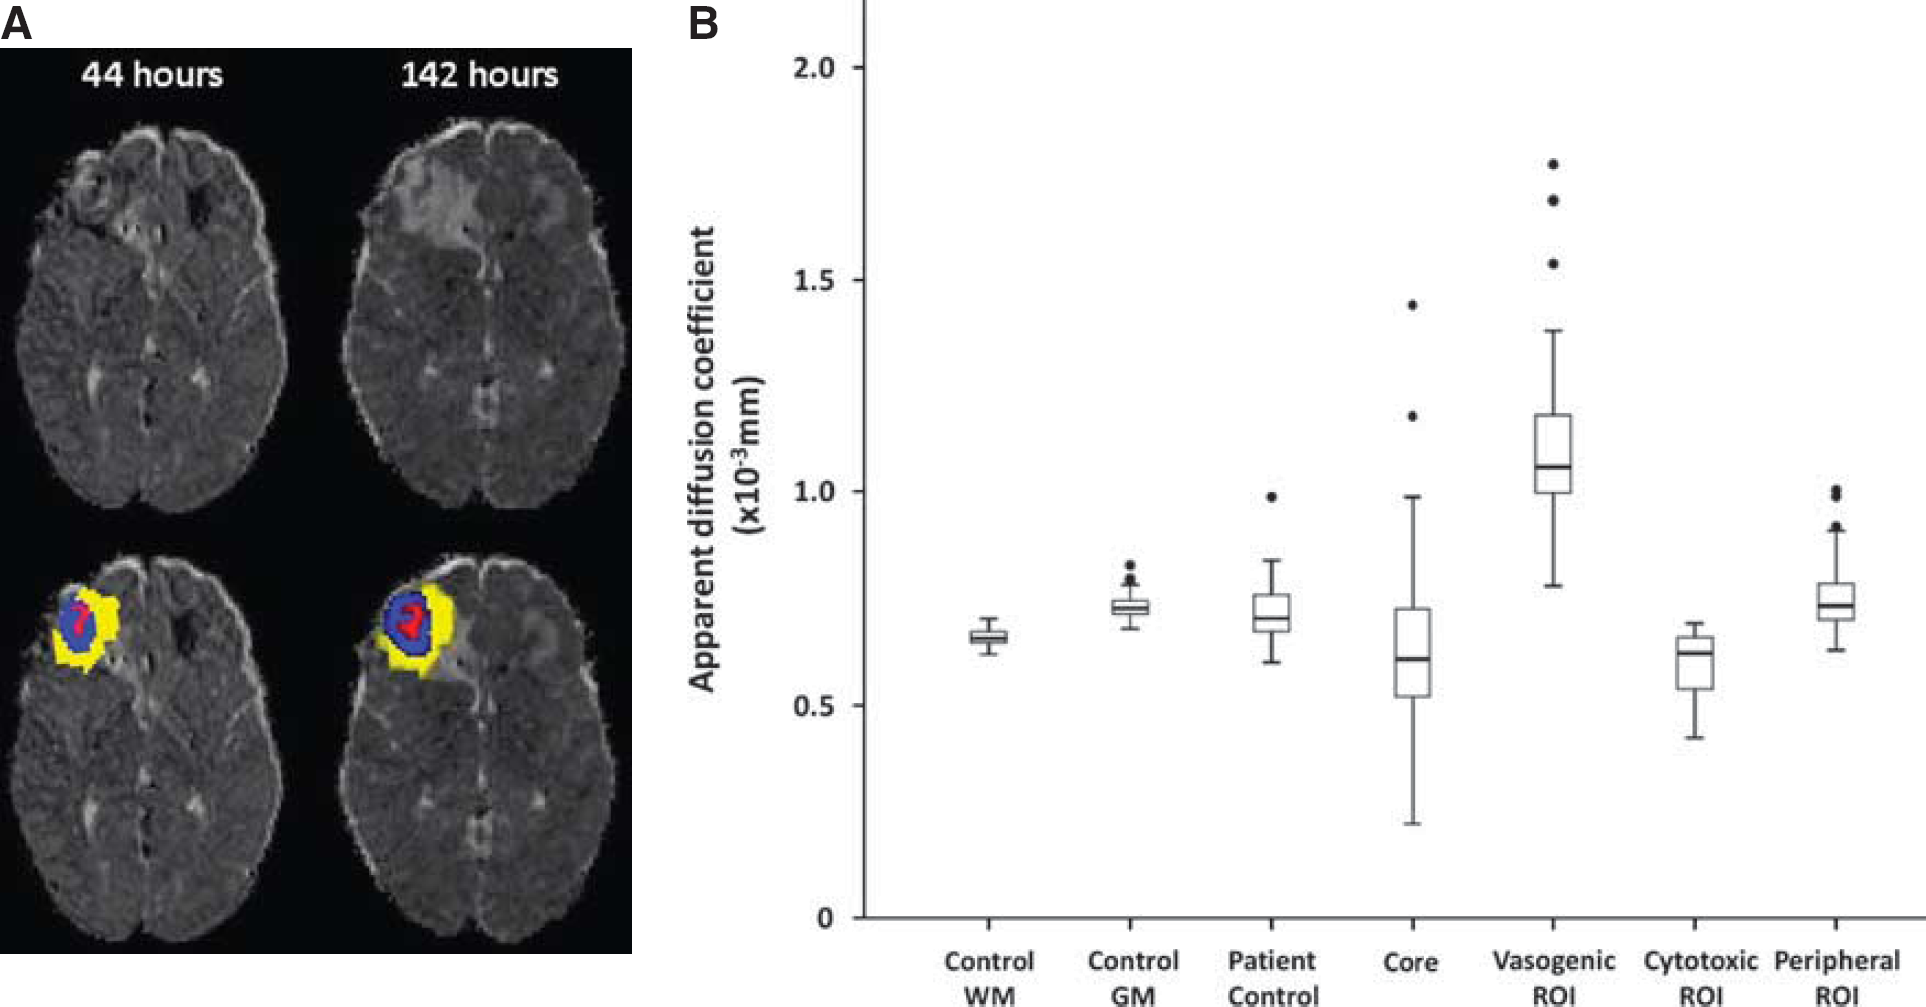
All contusions within the first few days of injury showed two main regions; a core of restricted diffusion surrounded by an area of raised ADC (Figure 1). While some lesions showed these regions more clearly than others, this pattern was universal. In addition to these two well-defined regions, a thinner rim of hypointensity was observed surrounding the region of increased ADC in 20 of 22 (91%) patients scanned within the first 3 days after injury. The longest injury to scan interval showing this finding was 63 hours.
Consistent with previous studies from our group, 24 contemporaneous PET studies in four patients showed reductions in CBF, CBV, oxygen ultilization and oxygen extraction fraction surrounding contusions. This extended past the pericontusional cuff of vasogenic edema to include the areas of presumed cytotoxic edema represented by a reduction in ADC (Figure 2).
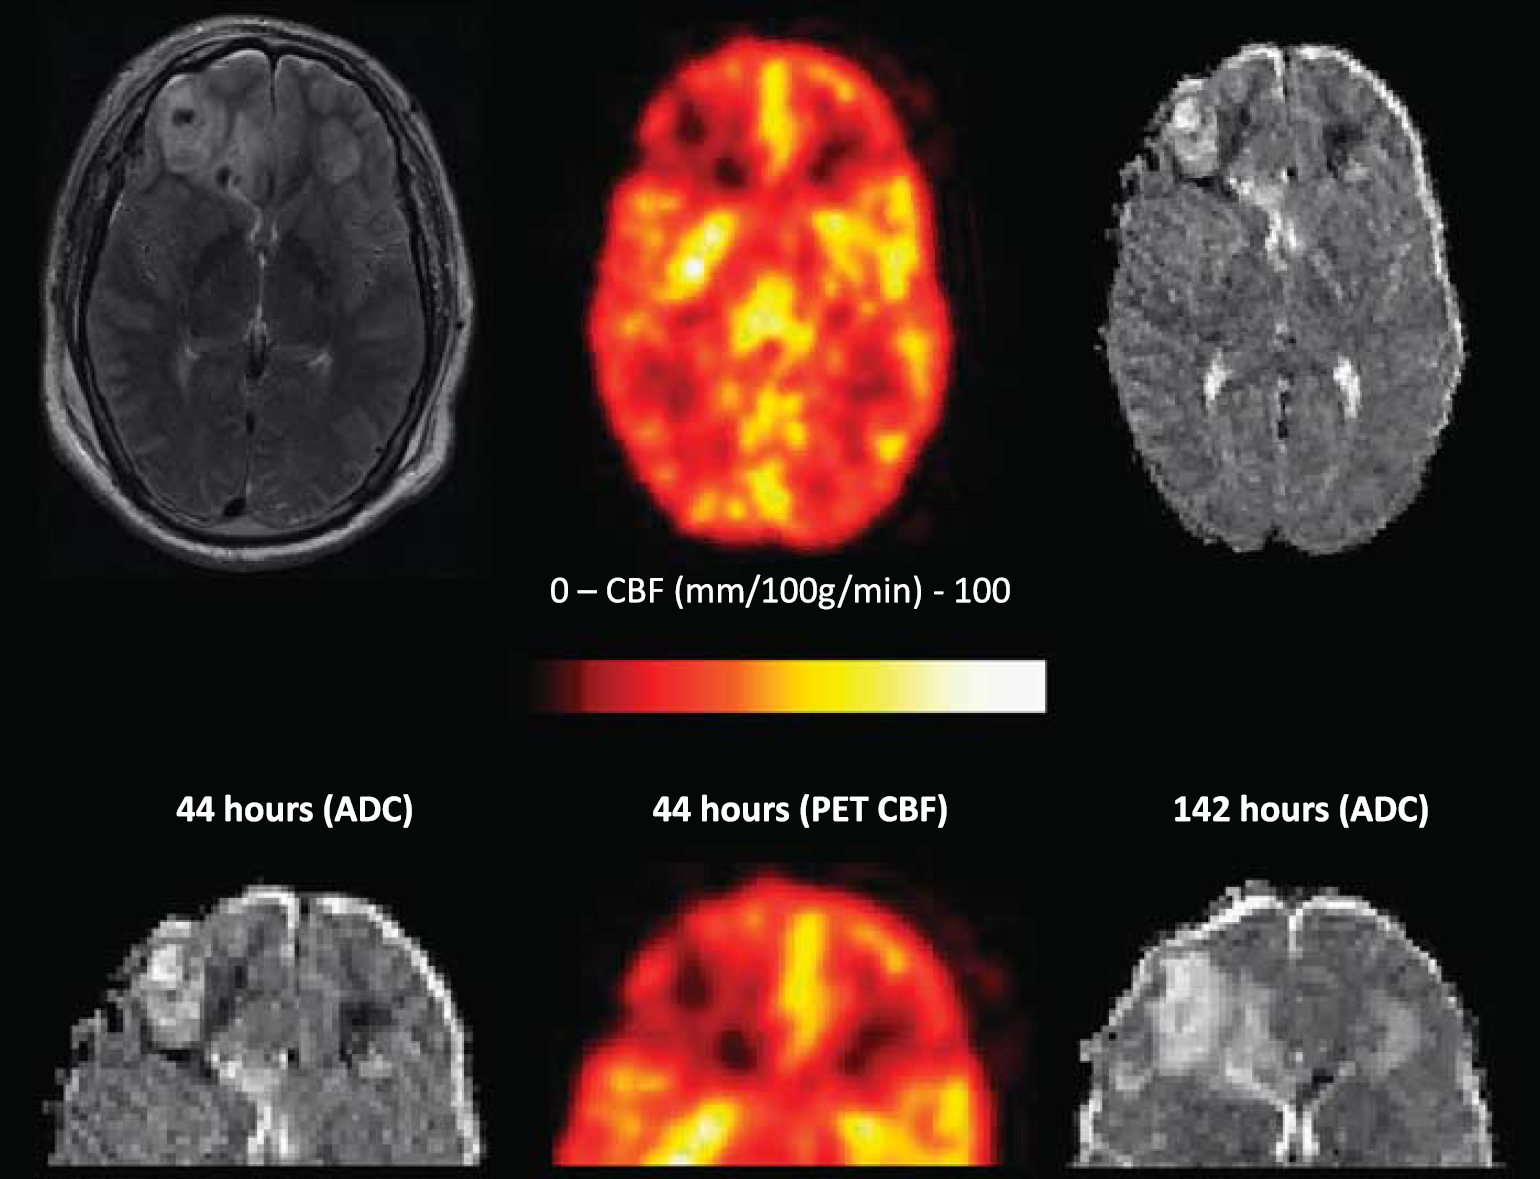
Heterogeneity in the cerebral pathophysiology after head injury. The top panel shows T2, Positron emission tomography (PET) regional cerebral blood flow (rCBF), and apparent diffusion coefficient (ADC) maps obtained at 44 hours after traumatic brain injury (TBI). The lower panel shows a detail of these images, and a follow-up image at 144 hours (5.9 days) after TBI. There is a reduction in rCBF around both frontal contusions, peripheral to the pericontusional cuff of vasogenic edema, and associated with a reduction in ADC, characteristic of cytotoxic edema. The lower images (fluid-attenuated inversion recovery sequence (FLAIR), ADC map, and PET CBF at 14 hours, with FLAIR at 6.5 days) illustrate how the rim of vasogenic edema extends to include the rim of cytotoxic edema seen at the early time point.
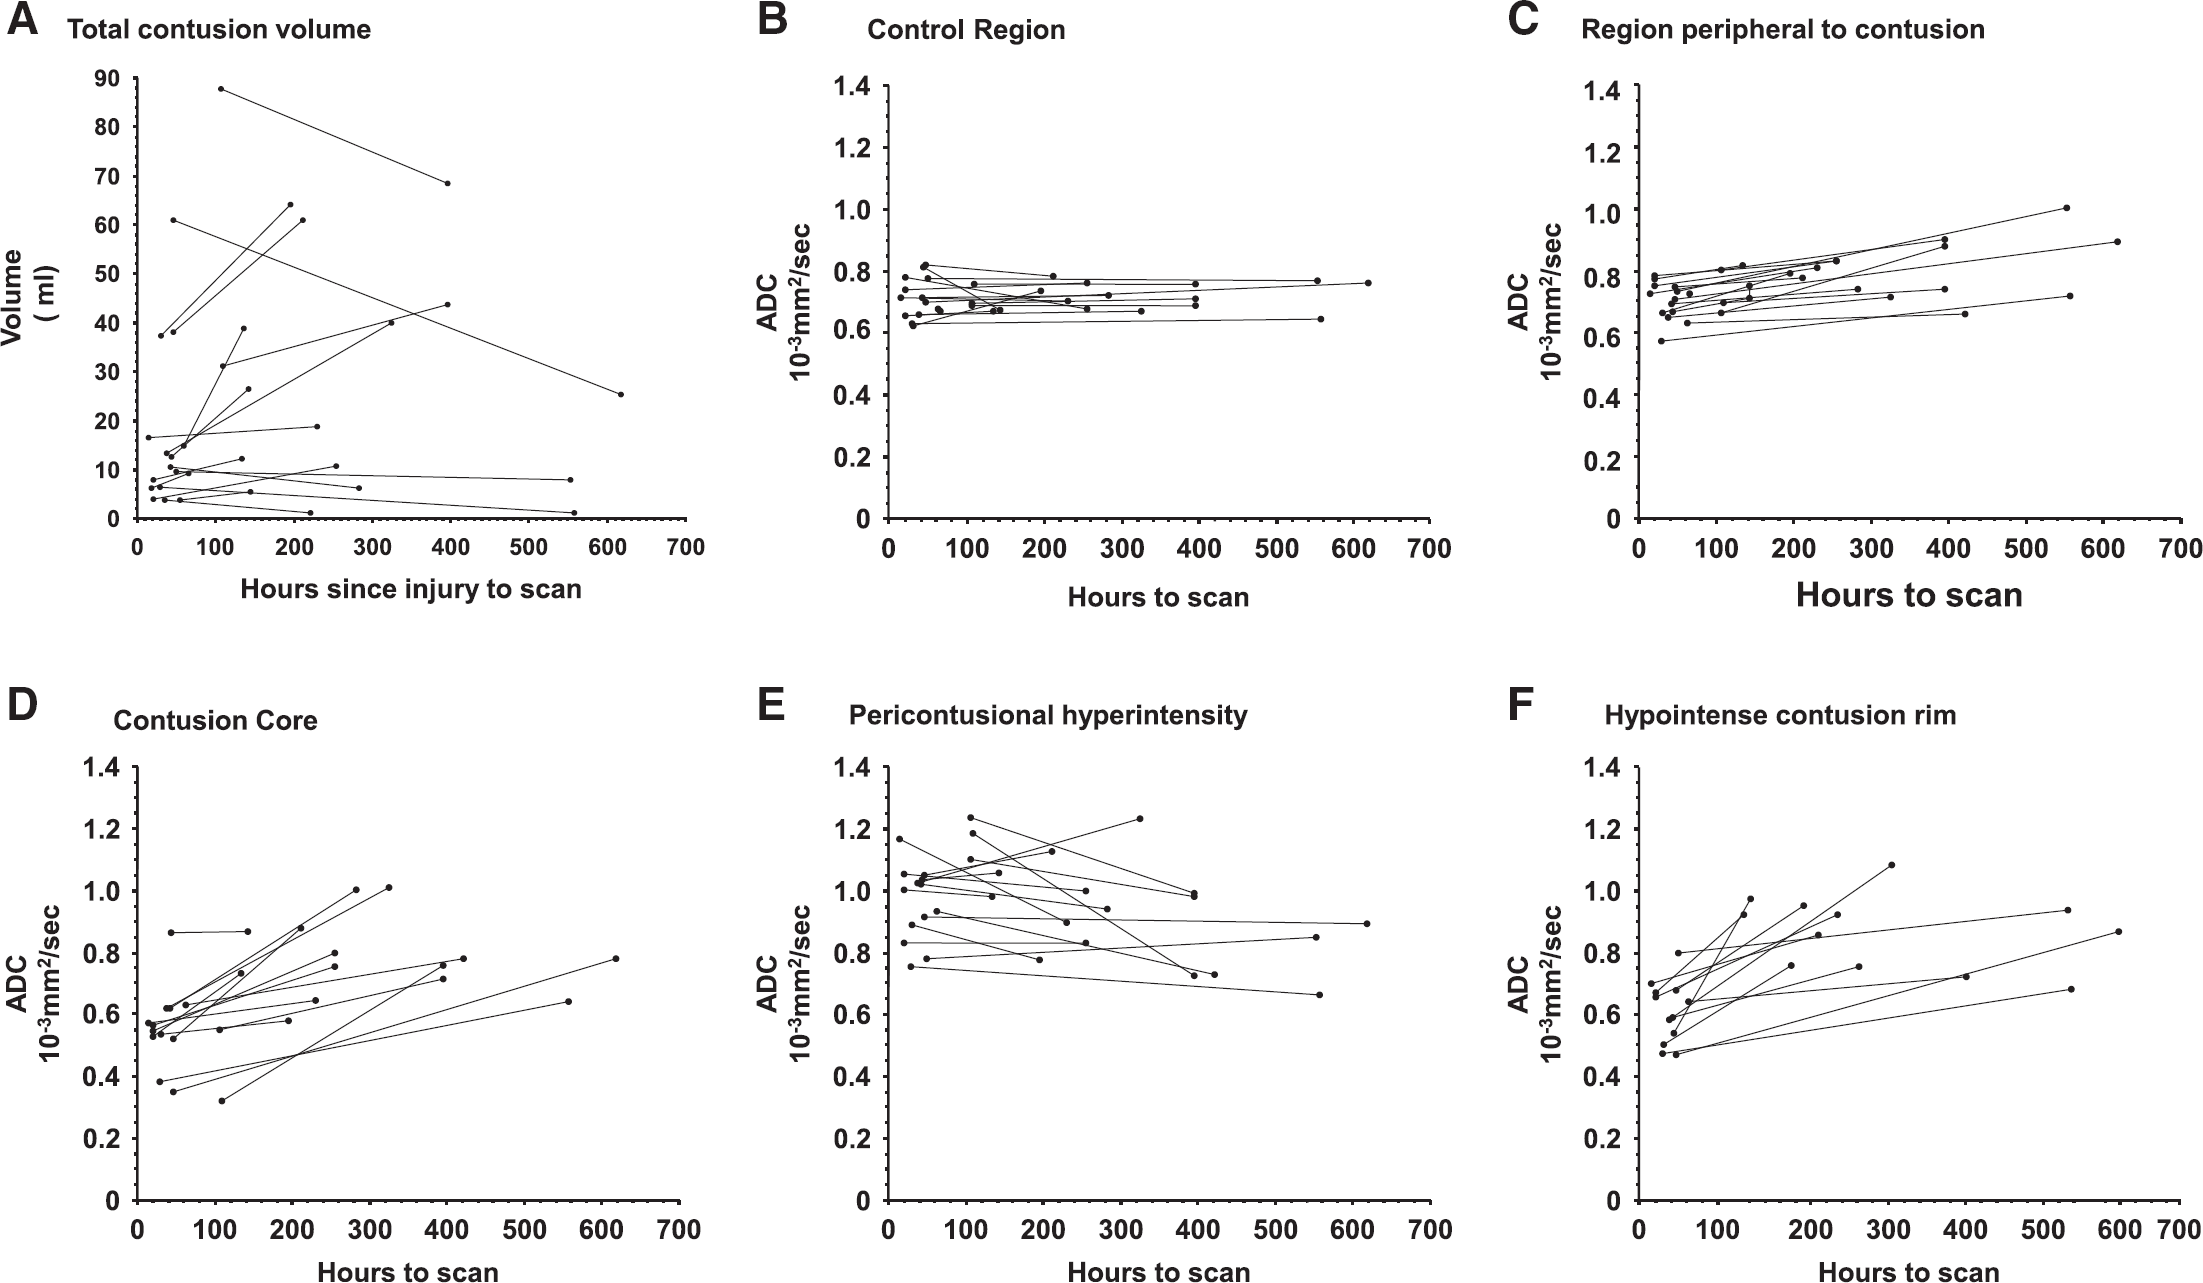
Table 2 shows the volume of the contusion areas. The presence or absence of growth in the contusion core over time was unrelated to initial core size, coagulation status, or time between imaging sessions (Spearman's Rho,
Graph
Volume of lesion components over time (median, range)
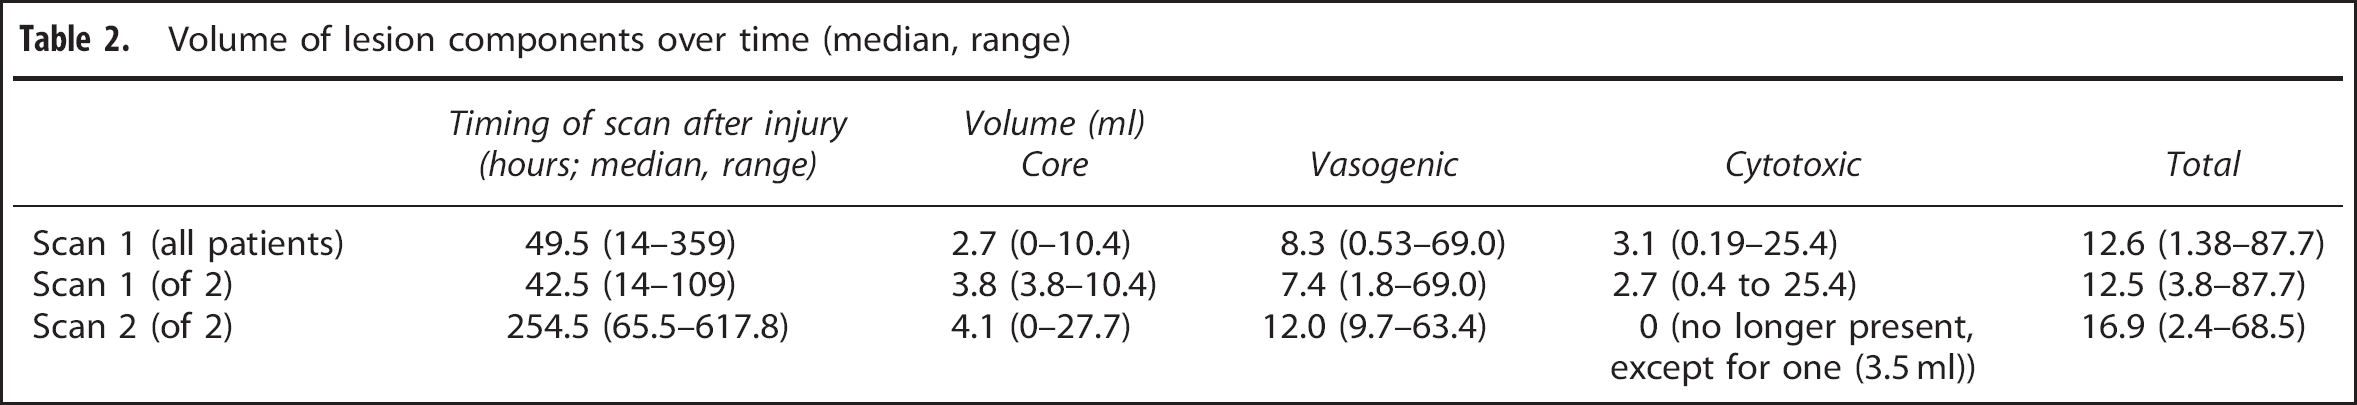
The outer hypointense rim volume was not identifiable on scans obtained more than 3 days after TBI, but was still present on the second scan for the one patient who had a repeat scan within that period. Both the original core ROI and original outer hypointense rim showed an increase in ADC at the second scan, which was driven by predominantly by increases in radial diffusivity (Figure 3, Supplementary Figures 1 and 2). The corresponding change for the ROI with increased ADC was more variable.
To determine the pathophysiology underlying the rim of restricted diffusion (Region 3) we examined its imaging characteristics using other MR contrasts (Figure 4). In particular, we sought correlations on the
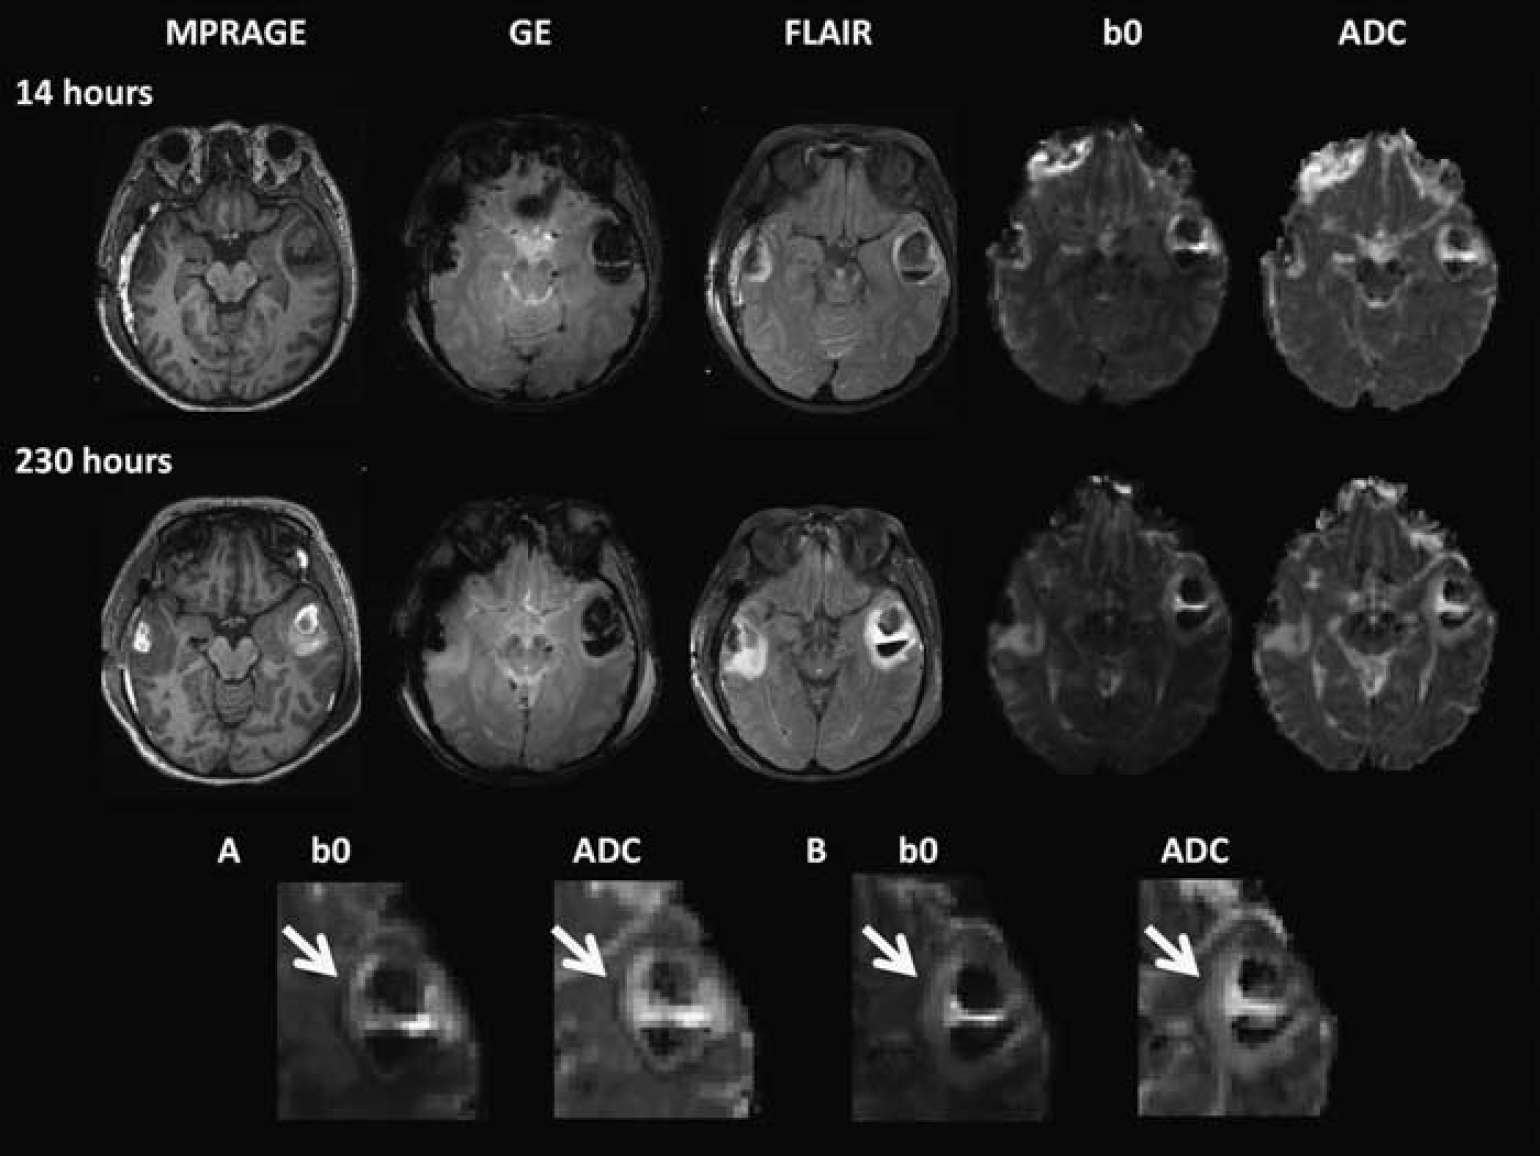
Example of change in a contusion over time in a 49-year-old female with severe traumatic brain injury (TBI) (GCS 5) after a road traffic collision. The T1-weighted image (magnetization-prepared rapid gradient echo, MPRAGE), gradient echo (GE), fluid-attenuated inversion recovery sequence (FLAIR), T2∗ (b0), and apparent diffusion coefficient (ADC) maps for each time point are shown. The top two panels illustrate progression of contusions from approximately 14 hours after injury (top) to 230 hours after injury (second panel), respectively. Overall contusion growth and increase in the volume of the bright ‘vasogenic’ rim on the ADC map can be seen. Magnified views of the T2∗ (b0) and ADC maps are shown in the bottom panel (A and B). At the earlier scan (at 14 hours, A), a vasogenic rim is surrounded by a hypointense rim that can clearly be seen on the ADC map (white arrow). The hypointense area corresponds to an area of low-signal intensity on the T2∗ (b0) map, which does not correspond to the presence of blood degradation products on the gradient echo. Classical cytoxic edema is bright on DWI (T2 shine through) and hypointense in parametric ADC maps. The discordance seen here may be secondary to hemoglobin desaturation in ischemic tissue, which is the consequence of reductions in blood flow before it evolves to infarcted tissue.
Sixteen patients had follow-up imaging 6 months or more after injury. In 14 of these the peripherally placed contusions had all been replaced by CSF, denoting encephalomalacia (Figure 5). In two, who had more deeply placed lesions (in the basal ganglia and deep white matter), there was evidence of hemosiderin deposition but no encephalomalacia.
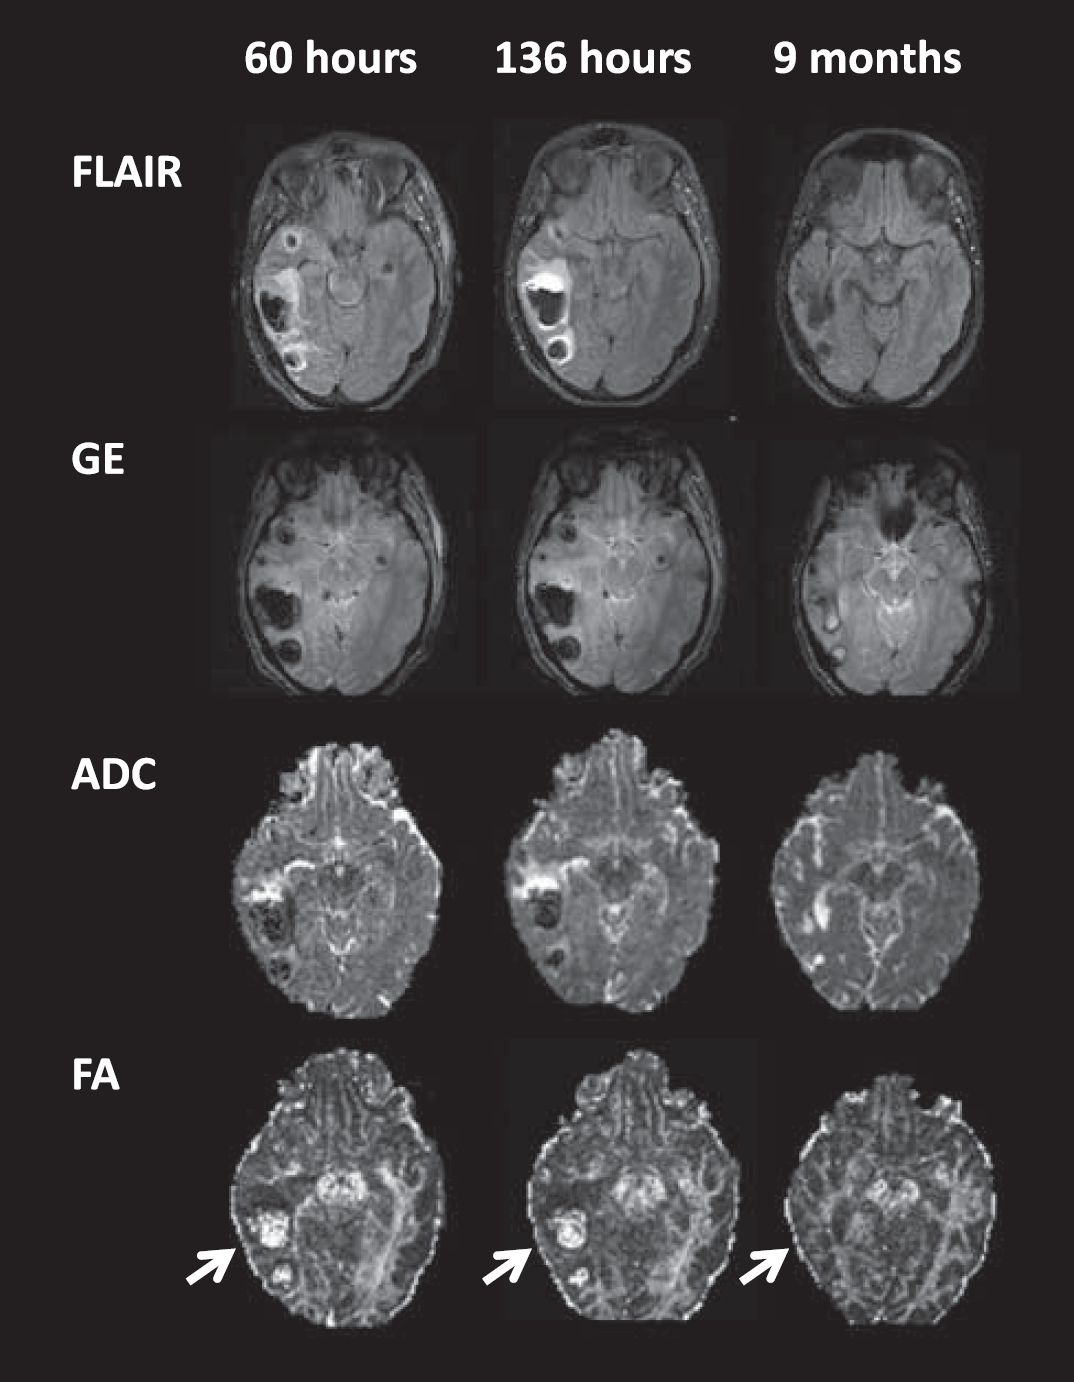
Long-term changes of contusions illustrating their evolution. Vasogenic (and cytoxic edema in the earliest scan) is clearly seen with gliosis in the late scan. The resolution of edema and contusion core allows white matter tracts to be more clearly identified on the FA maps, which appear thinner than the contralateral side (arrows). ADC, apparent diffusion coefficient; FA, fractional anisotropy; FLAIR, fluid-attenuated inversion recovery sequence; GE, gradient echo.
DISCUSSION
The pericontusional region is a well-recognized location of traumatic penumbral tissue. Prevention of contusion growth represents a potential therapeutic target in the prevention of secondary injury in TBI. However, it has been difficult to characterize such target tissue in the past. This study shows that DTI can detect three distinct regions within traumatic contusions in the majority of patients imaged within the first 3 days after injury: a core, an area of raised ADC around the core, and a thin rim of hypointensity. It is likely the areas of increased ADC represent vasogenic edema, while the area of decreased ADC represents cytotoxic edema. The heterogeneity of contusion growth is illustrated by the differing slopes of contusion volume change in Figure 2, and the large coefficients of variation for volume change suggests that individual patients have different drivers of contusion growth. These findings provide important insights into the heterogeneity of pathophysiology and its evolution in and around contusions.
The rim of vasogenic edema that surrounds such contusions is thought to be because of either a transient breakdown in the blood–brain barrier 26 and/or the presence of hydrostatic and oncotic pressure gradients between the hematoma and surrounding tissue. 27 The resulting increase in extracellular water content leads to an increase in water diffusion, therefore causing a reduction in signal on the raw DWIs and increased signal on ADC maps.
Animal studies have shown that the area surrounding the contusion core is critically ischemic, 8 and that a decrease in ADC seen after experimental contusion is associated with cytotoxic edema.28,29 Cytotoxic edema typically results from the intracellular accumulation of extracellular Na+ and other cations in neurons and astroctyes secondary to the failure of energy-dependent mechanisms of extrusion. 30 This drives an intracellular influx of anions to maintain intracellular neutrality, which in turn drives an influx of water, resulting in an osmotic expansion of the cell (cytotoxic edema). 30 The greater proportion of water inside the cell, where diffusion is relatively restricted, leads to increased signal on DWI maps and low intensity on ADC maps. Perfusion imaging in human TBI shows reductions in CBF around contusions. While conventional imaging with both computed tomography and MRI cannot characterize the consequences of such CBF reduction at an early stage, the hypointense rim on ADC images may represent an area of cytotoxic edema, because of critical ischemia, resulting from microvascular changes.8,24
In all patients, the area of vasogenic edema increased in size, and in patients with the cytotoxic rim this area was subsumed by the vasogenic edema. In a hetrogenous group of 12 patients with focal and/or TAI, Pasco and colleagues 21 also noted the presence of a rim of perilesional cytotoxic edema in some patients.
One critical issue is whether pericontusional tissue that exhibits low ADC values represents tissue that is irreversibly compromised. In cytotoxic edema secondary to stroke, ADC is reduced in hyperacute stage, reaching a nadir several hours later, pseudonormalizing after ~1 week and finally becoming elevated. Significant hyperintensities on T2-weighted imaging do not appear until ~6 hours after ictus. 31 ADC in such lesions decreases below control values, despite CBF values that are above the threshold for energy failure. 32 While perfusion–diffusion mismatch is classically thought to characterize salvageable tissue in acute stroke, not all of the tissue showing low ADC values (and hence sometimes operationally defined as the infract core) proceeds to infarction on follow-up studies.33,34 The cytotoxic region seen in pericontusional tissue may therefore represent a potentially salvageable region of tissue, the ‘traumatic penumbra’. This finding is consistent with microdialysis studies, which have identified an area of metabolically compromised tissue surrounding contusions. In these studies, while the tissue has the capacity to regain a normal metabolic pattern, it also appears to have an increased vulnerability to secondary insults. 3
In a few of patients, we noted areas surrounding early traumatic contusions with little or no increase in intensity on the raw DWI in regions where there is a concurrent reduction in ADC, and perfusion imaging with PET showed perilesional hypoperfusion (Figures 3 and 5). This discordance requires explanation, as classical cytotoxic edema should be bright on DWI and hypointense on parametric ADC maps. The observed discrepancy may be because of ischemia or to microhemorrhages that are too small to be recognized on structural imaging. However, unlike the core that commonly exhibits a decrease in T2∗ in the acute phase because of the presence of blood degradation products, no blood products could be visualized on gradient echo imaging in the rim of reduced ADC. An alternative explanation for the discordance is provided by hemoglobin desaturation in ischemic tissue, which is the consequence of reductions in blood flow. When such ischemia evolved to complete infarction, oxygen extraction fraction decreases. However, while such evolution is underway, physiological heterogeneity may result in islands of critically ischemic, but viable tissue associated with high oxygen extraction fraction and low T2∗ values, resulting in reduced signal intensity on DWIs (which are intrinsically heavily T2∗ weighted), despite the presence of low ADC values on parametric maps. This contrast mechanism, which we term ‘T2∗ shade back’, may be best thought of as a converse of ‘T2 shine through’ where regions of high T2 are bright on DWIs, without a corresponding reduction in ADC.
The mechanisms that underlie these imaging findings are not fully defined, but comparisons with animal studies suggest that the rim of cytotoxic edema may represent tissue experiencing microvascular failure. 2 This finding is supported by our limited PET data, which shows reduced CBF, CBV, and CMRO2 in this tissue compartment, and also in the immediately adjacent tissue. These appearances suggest a continuum of tissue viability, with nonviable necrotic tissue in the contusion core, recently (but irreversibly) injured tissue in the region of vasogenic edema, critically ischemic tissue proceeding to infarction in the cytotoxic rim, and at-risk tissue with reduced blood flow in the region beyond. This conceptualization of pericontusional physiology also provides insights into possible mechanisms of contusion expansion, and suggests that interventions aimed at maintaining microvascular integrity may be useful in this setting. The large unexplained variability in the extent of contusion expansion suggests that (as yet unidentified) treatment or host factors may be important in determining the extent of lesion progression. Potential factors include hypotension (which could worsen ischemic insults) or hypertension (which could increase vasogenic edema), or the inflammatory insult provided by extracranial inflammation. In addition, this variability in incremental phenotype may be at least partly driven by functional polymorphisms in genes that govern inflammation, vascular biology, or hemostasis.
Future studies of larger number of patients with more imaging time points would provide useful corroboration of our findings. While we showed good intra and interobserver correlation for delineating these tissue compartments, analyses using hand-drawn ROIs are time consuming. If changes in contusion characteristics are to be used as biomarkers for clinical trials, automated lesion detection and segmentation may be of benefit. The frequent occurrence of multiple heterogeneous lesions, often mixed with TAI, mean that the development of such automated analysis techniques is challenging.
A more complete understanding of contusions, particularly the potentially reversible ‘traumatic penumbra’ around such lesions may allow MR (including DTI) to be used as
DISCLOSURE/CONFLICT OF INTEREST
The authors declare no conflict of interest.
Supplementary Information accompanies the paper on the Journal of Cerebral Blood Flow & Metabolism website (http://www.nature.com/jcbfm)
References
Supplementary Material
Please find the following supplemental material available below.
For Open Access articles published under a Creative Commons License, all supplemental material carries the same license as the article it is associated with.
For non-Open Access articles published, all supplemental material carries a non-exclusive license, and permission requests for re-use of supplemental material or any part of supplemental material shall be sent directly to the copyright owner as specified in the copyright notice associated with the article.