
Abstract
Diffusion tensor imaging can be used in vivo to assess the longitudinal and regional microstructural changes occurring after middle cerebral artery (MCA) infarcts in humans. Nine patients were investigated 1 week (D7), 1 (M1), 3 (M3), and 6 months (M6) after the occurrence of an isolated MCA infarction. First, an overall analysis was performed using histograms of mean diffusivity (MD) and fractional anisotropy (FA) in each hemisphere. Thereafter, the regional pattern of diffusion changes was investigated voxel by voxel with statistical parametric mapping 99. In the hemisphere ipsilateral to the infarction, histogram analysis revealed a significant decrease in FA between D7 and M6 associated with a progressive increase in MD from D7 to M3. Remote from the MCA territory, the voxel by voxel analyses detected a significant increase in MD within the thalamus at M3 and M6 and a reduction in FA along the pyramidal tract at M6. In the contralateral hemisphere, between D7 and M6, a significant hemispheric atrophy was observed in association with a global reduction in anisotropy, in the absence of distinctive regional diffusion changes. These results suggest that micro- and macrostructural tissue modifications can be detected with diffusion tensor imaging in regions remote from the ischemic area in both hemispheres.
Introduction
Focal cerebral infarcts are responsible for histological damage or functional alterations remote from the ischemic lesion, but the progression and intensity of these processes remain largely unknown (Von Monakow, 1914). Pathological studies have shown that focal cerebral infarcts can lead to remote tissue alterations within connected regions related to wallerian degeneration and cortical deafferentation. These secondary degenerative processes are usually detected within the ipsilateral hemisphere to the lesion. Neuronal degeneration has been particularly detected within the ipsilateral thalamus and the substantia nigra both in rats and in humans after middle cerebral artery (MCA) occlusion (Dihne et al, 2002; Ogawa et al, 1997a, 1997b; Tamura et al, 1990). Together, the ischemic lesion and these remote degenerative processes can lead to a progressive atrophy of the hemisphere ipsilateral to the lesion (Persson et al, 1989; Skriver et al, 1990).
Within the unaffected hemisphere, only functional abnormalities have been identified in humans, although Meguro et al (2000) already suggested that structural changes are likely to occur on this side because of the frequent atrophy of the corpus callosum. Modifications of the electrical activity (Buchkremer-Ratzmann et al, 1996; Meyer et al, 1970; Witte and Stoll, 1997), cerebral blood flow (Andrews, 1991; Dobkin et al, 1989), and/or metabolism (Andrews, 1991; Kuhl et al, 1980) have been reported at the cortical level (diaschisis), mainly within areas mirror to the lesion. In animal models of cerebral ischemia, Izumi et al (2002) recently reported a progressive edema in both hemispheres within the first few hours after MCA occlusion in rats. Likewise, transient changes of cholin, creatin, and N-acetylaspartate have been detected within the unaffected hemisphere during the first 12 h in a similar experimental model (Abe et al, 2000). Kataoka et al (1989) confirmed the presence of neuronal degeneration in several cortical areas of the contralateral hemisphere, 5 days after the onset.
In vivo, conventional MRI (T1- and T2-weighted sequences) is weakly sensitive to these degenerative processes and mainly reveals late and global volumetric changes related to cerebral atrophy. Diffusion tensor imaging is a new MRI modality based on the measurements of the random motion of water molecules (Basser and Jones, 2002; Basser and Pierpaoli, 1996; Le Bihan, 1995; Le Bihan et al, 2001; Le Bihan and van Zijl, 2002; Pierpaoli et al, 1993, 1996). Water molecules interact with many tissue components such as cell membranes, myelin, and macromolecules, which provides unique clues to the tissue architecture at the microscopic level. In the white matter, the restriction of water diffusion in specific directions due to the presence of axonal membranes and myelin leads to anisotropic diffusion. Pathological processes responsible for microstructural tissue changes, such as neuronal swelling or shrinkage, increased or decreased extracellular space, and modifications of the tissue organization can result in significant changes of water diffusivity and/or anisotropy (Lim and Helpern, 2002).
The purpose of this longitudinal study was to quantify and locate the microstructural tissue changes occurring in both hemispheres in regions remote from a recent MCA infarction. Both the mean diffusivity (MD), an average of the magnitude of water motion, and the fractional anisotropy (FA), a measure of directional bias in the diffusion profile, were calculated at the voxel level in 9 patients who were investigated 4 times from 7 days to 6 months after the ischemic event.
Materials and methods
Subjects
Nine patients (mean age±standard deviation: 54.7±18.2 years, range: 23 to 78) were included in the study using the following criteria: (1) brain infarction with clinical onset <7 days within the territory of the right or left MCA, (2) no cerebral bleeding, (3) no signal abnormality on both T1- and T2-weighted images (WI) in other cerebral regions. They were investigated with DTI-, T1-, T2-, and FLAIR-weighted MRI 1 week (D7), 1 month (M1), 3 months (M3), and 6 months (M6) after the stroke onset. Diffusion data obtained at the early onset of the ischemic stroke (at days 1 and 2) were not used in the present study because they were obtained in different centers with different imaging parameters.
Information on demographic characteristics and vascular risk factors were collected in each patient. One patient had both hypertension and hypercholesterolemia before admission, three had hypertension only, two were current smokers, and one had an isolated hypercholesterolemia.
All subjects had a detailed neurological examination 2 h before each MRI examination, including an evaluation of cognitive deficit with the Mini-Mental State Examination (MMSE), neurological deficit with the NIH Stroke Scale, and degree of handicap with the Rankin Scale. In the patients group, the mean NIHSS score in patient was 5.5 at day 7 (range: 2 to 9). At 6 months, the averaged Rankin score was 1.62 (range: 1 to 2) and MMSE score was 26.6 (range: 22 to 30). The diagnostic workup allowed to identify the origin of the MCA occlusion in 6/9 cases: dissection of the ipsilateral internal carotid artery (n=2), cardio embolism (n=2), and atherothrombosis (n=2).
Eight healthy volunteers with a mean age of 49±11.7 years (range: 29 to 66) were investigated once during the study period using the same MRI protocol.
The study protocol was approved by an independent institutional ethic committee (CCPPRB Bicêtre 9724), and written informed consent was obtained from each subject.
Magnetic Resonance Imaging
T1, T2, FLAIR, and diffusion-WI were acquired with the use of a 1.5 T MRI system (Signa General Electric Medical Systems) equipped with gradient hardware allowing up to 22 mT/m. A standard quadrature head coil was used for radio frequency transmission and reception of the MR signal. Reduction of head motion was achieved with pillows placed on either side of the participant's head and a fixed strap positioned around the forehead.
T1-WI (inversion recovery) were acquired first in the axial plane with a spoiled gradient echo sequence (124 slices, 1.4-mm thick, repetition time 10.4 ms, echo time 2.2 ms, inversion time 600 ms) and 24 × 18 cm2 field of view (resolution of 0.9375 × 0.9375 × 1.4 mm3). FLAIR images were obtained using the following parameters: 2.8-mm thick, field of view 24 × 24 cm2, resolution of 0.9375 × 0.9375 mm2, TR=10,002 ms, and TE=148 ms.
Diffusion-WI (2.8-mm thick) were obtained with an echo-planar imaging sequence (single shot) sensitized to diffusion by application of gradient pulses on either side of the refocusing radio frequency pulse, in the axial plane, at 48 slice locations. For each slice location, T2-WI with no diffusion sensitization (b=0), followed by five b values (incremented linearly to a maximum value of 1000 s/mm2), were obtained in six noncollinear directions (x, y, z, x–y, x–z, y–z) using one repetition so as to increase signal-to-noise ratio. The field of view was 24 × 24 cm2 (resolution of 1.875 × 1.875 mm2), echo time 81.4 ms, and repetition time 2500 ms.
Image Postprocessing
Before the tensor estimation was performed, an unwrapping algorithm was applied to the diffusion-weighted data set to correct for distortions related to eddy currents induced by large diffusion-sensitizing gradients (Poupon et al, 2000). After this correction, the diffusion tensor parameters were calculated on a pixel-by-pixel basis. Mean diffusivity (trace (D) of the tensor divided by 3) and FA were investigated (Basser et al, 1994).
Image Analysis
Histogram analyses
We first used a global approach to investigate global diffusion changes in both hemispheres. In all participants, a single examiner delineated a mask of each hemisphere on each slice of MD images using a semiautomatic software (Anatomist, SHFJ, Orsay, France) (Rivière et al, 2000). In the hemisphere contralateral to the infarction, this mask was drawn using a threshold value at 1.33 × 10⁻⁹ m2/sec to remove the voxels corresponding to the cerebrospinal fluid (CSF). Thereafter, a visual correction was performed slice by slice on FA maps to remove the residual artifacts mostly related to eddy currents (Basser and Jones, 2002). In the affected hemisphere, the same protocol was used with a threshold fixed at 3.3 × 10⁻⁹ m2/sec to include the infarcted area. Subsequently, the remaining voxels containing the CSF from the ventricles were excluded manually on each slice. Finally, the ipsi- and contralateral regions obtained in this way were used to calculate MD and FA histograms to represent the rate of voxels contained within different intervals of given values of MD or FA. Histograms were computed for each subject using a bin width equal to 0.027 × 10⁻⁹ m2/sec for MD and 0.025 for FA. The following parameters were derived from FA and MD histograms for each examination: mean value, peak location (the most common value), and peak height (the fraction of voxels at the most common value).
Voxel-by-voxel analyses
We used statistical parametric mapping (SPM 99, MRC, London) to make voxel-by-voxel comparisons between patients and controls (Friston et al, 1995). To correct for the variations of brain positioning between each session, all diffusion-WI were first coregistered to the diffusion data obtained at 6 months. T1-WI were similarly coregistered to the T1-WI obtained at M6. Finally, all diffusion data were coregistered to T1-WI in each patient. Thereafter, T1-WI were spatially normalized to the standard template of SPM (average of 152 brains) to decrease the overall variability in size and shape of the different brains. This spatial normalization was applied to the corresponding diffusion maps to obtain for each voxel (size 3 × 3 × 3 mm3) precise coordinates in a universal space (Talairach and Tournoux, 1988), the origin of which was set to the anterior commissure. A smoothing (convolution with a Gaussian kernel) of normalized maps was used to improve the signal-to-noise ratio, and to increase the validity of parametric statistical inferences (8- and 6-mm isotropic Gaussian kernel, respectively, for the group and individual analyses). An axial rotation of the data was performed subsequently in patients with right-sided lesions (four patients) to perform the group analysis on the whole data between each session (Good et al, 2001). Individual analysis was obtained without the axial transformation by comparing individual data to the whole data obtained in controls only at M6.
Volumetry
The segmentation of healthy hemispheres was achieved using an automatic algorithm based on gray-level contrasts on T1-WI using an automatic software (Brainvisa, SHFJ, CEA, Orsay, France, http://brainvisa.free.fr) (Cointepas et al, 2001). The hemispheric volume was then calculated in each patient for each session. In each patient, the volume of the infarcted area was measured after delineation of the hyperintense area on T2-WI at M3.
Statistical Analyses
Parameters derived from histograms obtained in patients for both hemispheres (mean, peak height, and peak location of MD and FA) were compared at each time point using paired Wilcoxon tests. Nonparametric tests were chosen because the distribution of FA values was non-Gaussian. Hochberg's (1988) procedure for multiple testing was used to account for repeated tests of significance. The association between the variation of MD and FA between D7 and M6 and the size of the infarction was tested using Spearman correlation coefficients in each hemisphere.
Moreover, results obtained for patients at D7 in the contralateral hemisphere were compared with that of controls, paired within 10-years age categories, using the same test procedure as described above.
Diffusion maps were compared between patients (at D7, M1, M3, and M6) and controls using a voxel-by-voxel analysis of variance (ANOVA) for each hemisphere and the whole brain using SPM 99. A voxel-by-voxel analysis using paired t-tests was performed to compare, within patients, the diffusions maps obtained at M1, M3, and M6 to that obtained at D7. Additionally, each patient was compared with the group of controls at M6 in a voxel-by-voxel individual analysis. In all these analyses, two contrasts were used to detect whether each voxel had a higher or lower anisotropy or diffusivity. Significant diffusion modifications (increase or decrease) were detected using an individual voxel threshold at P<0.005. To correct for multiple comparisons, the resulting foci were characterized in terms of spatial extent with a corrected P-value <0.05.
Hemispheric volumes were compared at the different times using a mixed model ANOVA. In this model, time (D7, M1, M3, and M6) was regarded as a fixed effect, whereas a random subject effect was added to take into account the correlation between measurements obtained in the same patient. Post hoc two-by-two time point comparisons were based on least-squares means with Tukey–Kramer correction for multiple testing. The tests used in the histogram and volumetry analyses were two-sided, with a significance level of 0.05. These analyses were performed using SAS v8.2 (SAS Institute, Cary, NC, USA) and S-Plus 2000 (MathSoft Inc., Seattle, WA, USA) statistical softwares.
Results
The location of infarcts is summarized in Table 1.
Location of MCA infarcts
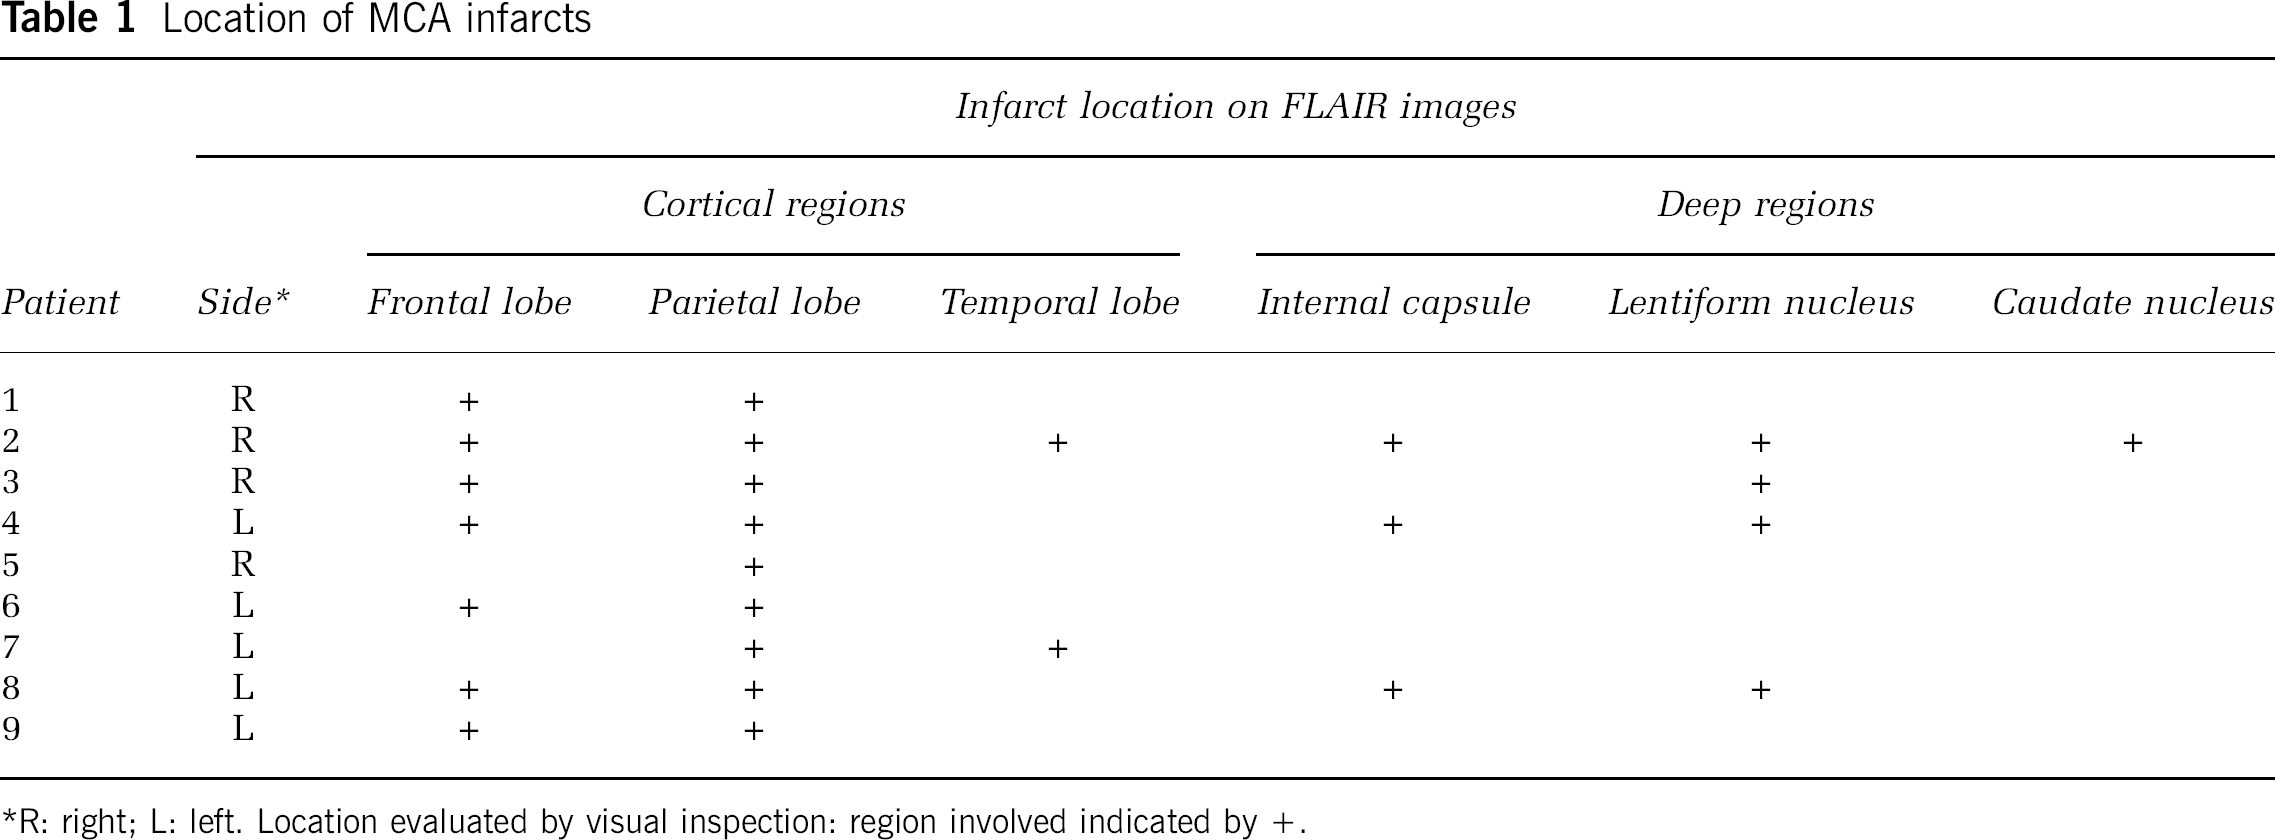
R: right; L: left. Location evaluated by visual inspection: region involved indicated by +.
Histogram Analyses
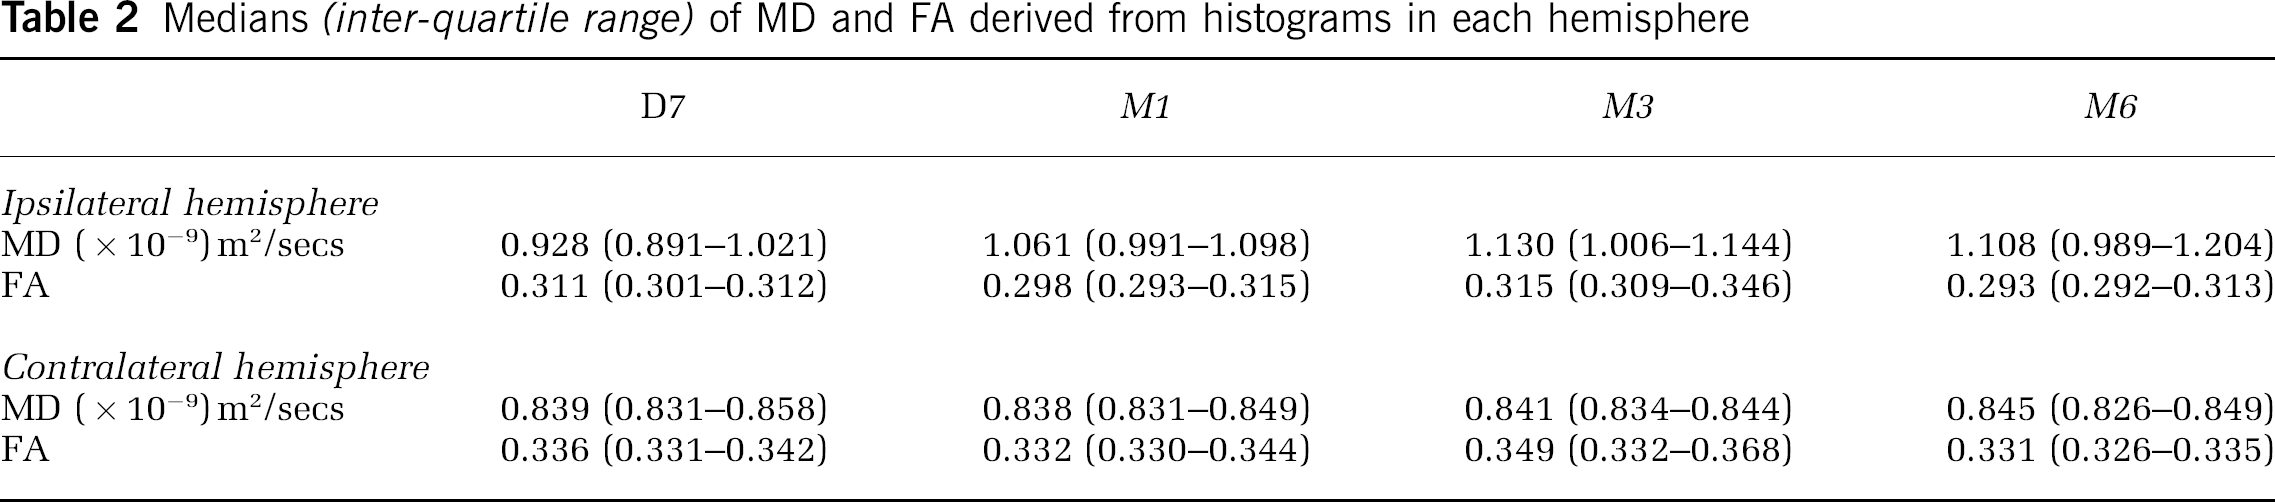
Averaged histograms and the median values of MD and FA are, respectively, shown in Figure 1 and Table 2.
Medians (inter-quartile range) of MD and FA derived from histograms in each hemisphere
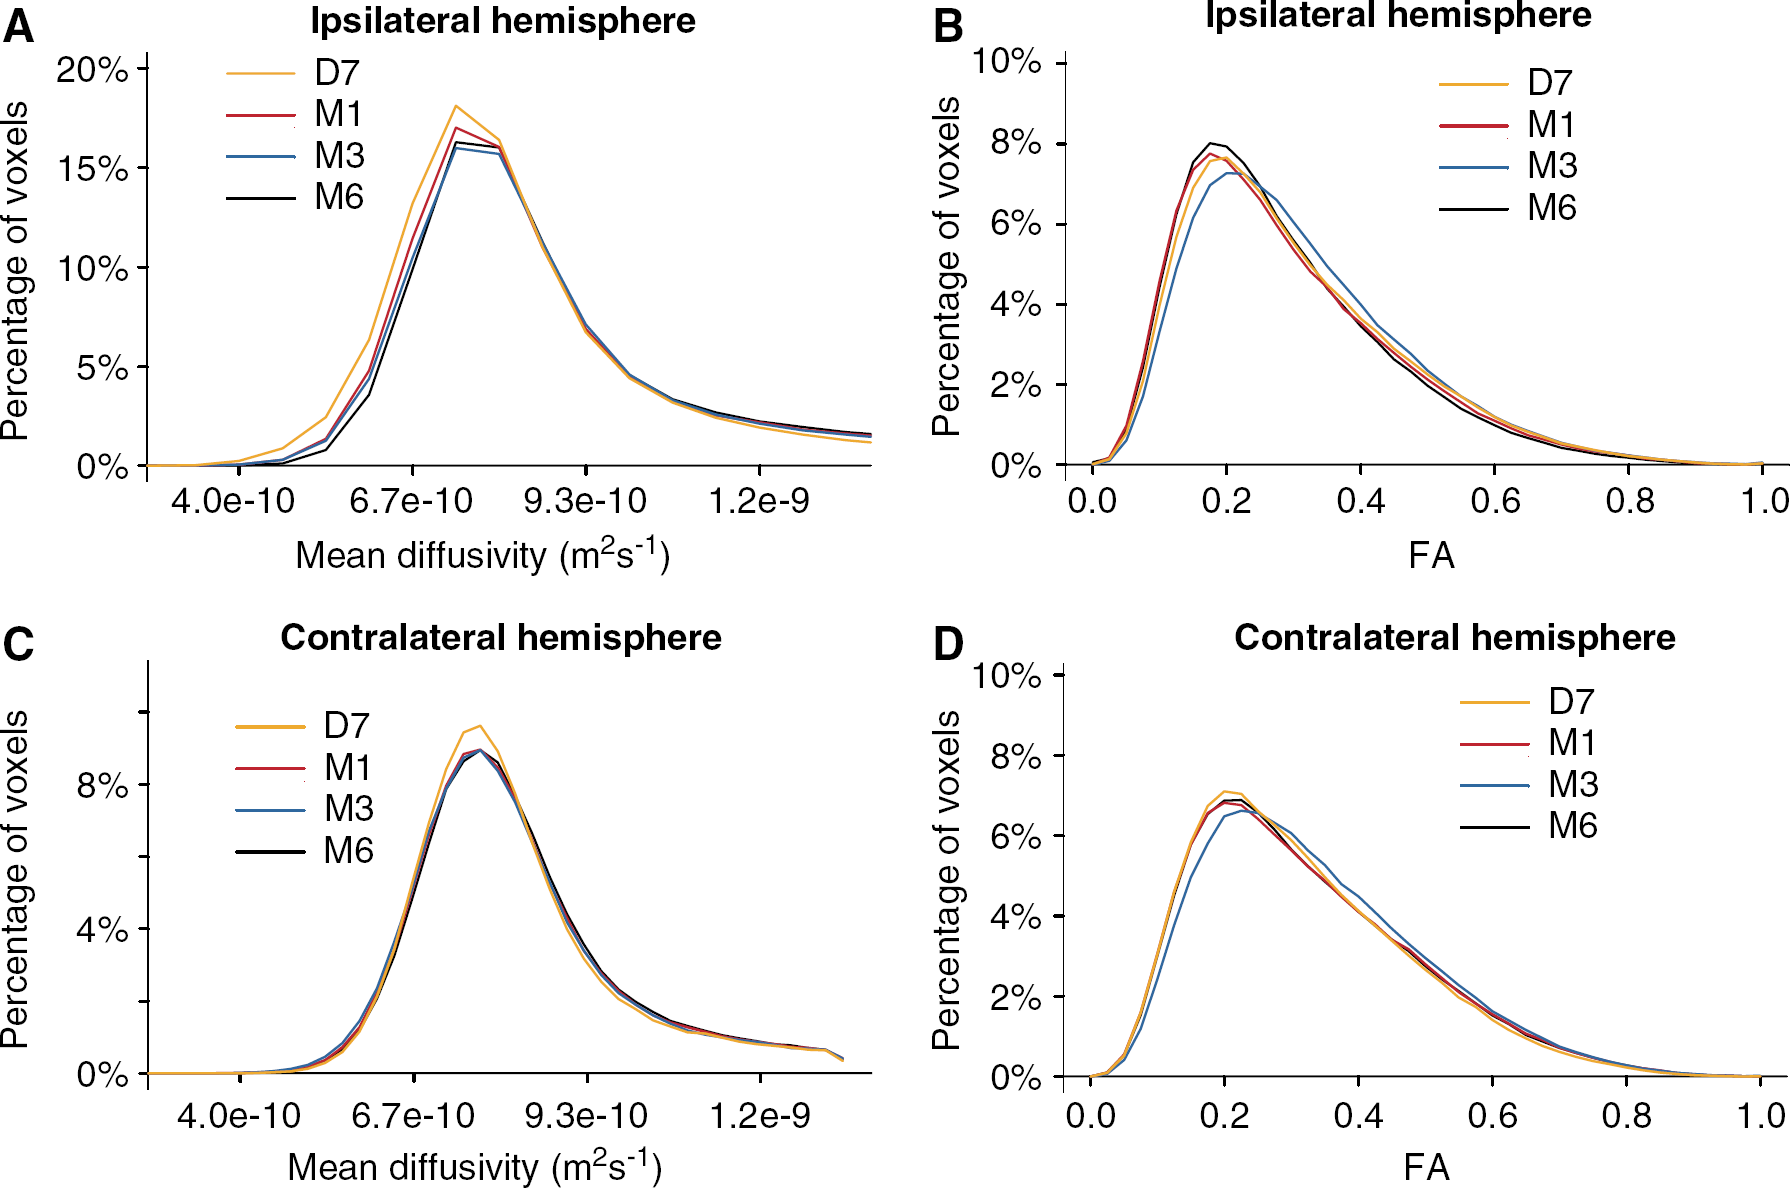
Averaged histograms of MD and FA obtained in patients.
Ipsilateral hemisphere
A progressive increase in the mean of MD was observed in the ipsilateral hemisphere between D7 and M1 (P=0.012), M1 and M3 (P=0.0039), D7 and M3 (P=0.0039), D7 and M6 (P=0.0078), M1 and M6 (P=0.0078) (Figure 2A). For the anisotropy of diffusion, a significant decrease of the mean of FA was detected between D7 and M6 (P=0.0078) with a transient increase between M1 and M3 (P=0.0039) (Figure 2B). This was observed in association with a reduction in the peak height of the FA histogram between M1 and M3 (median values: 0.0786 versus 0.0760, P=0.0039). No significant difference was detected for the peak location of MD or FA histograms between each time point. The increase in the mean of MD and the decrease of FA between D7 and M6 were correlated to the size of the infarction (volume range of infarctions: 5463 to 102,414 mm3; Spearman correlation coefficients: MD: ρ=0.98, P=0.0058 and FA: ρ=−0.810, P=0.030).
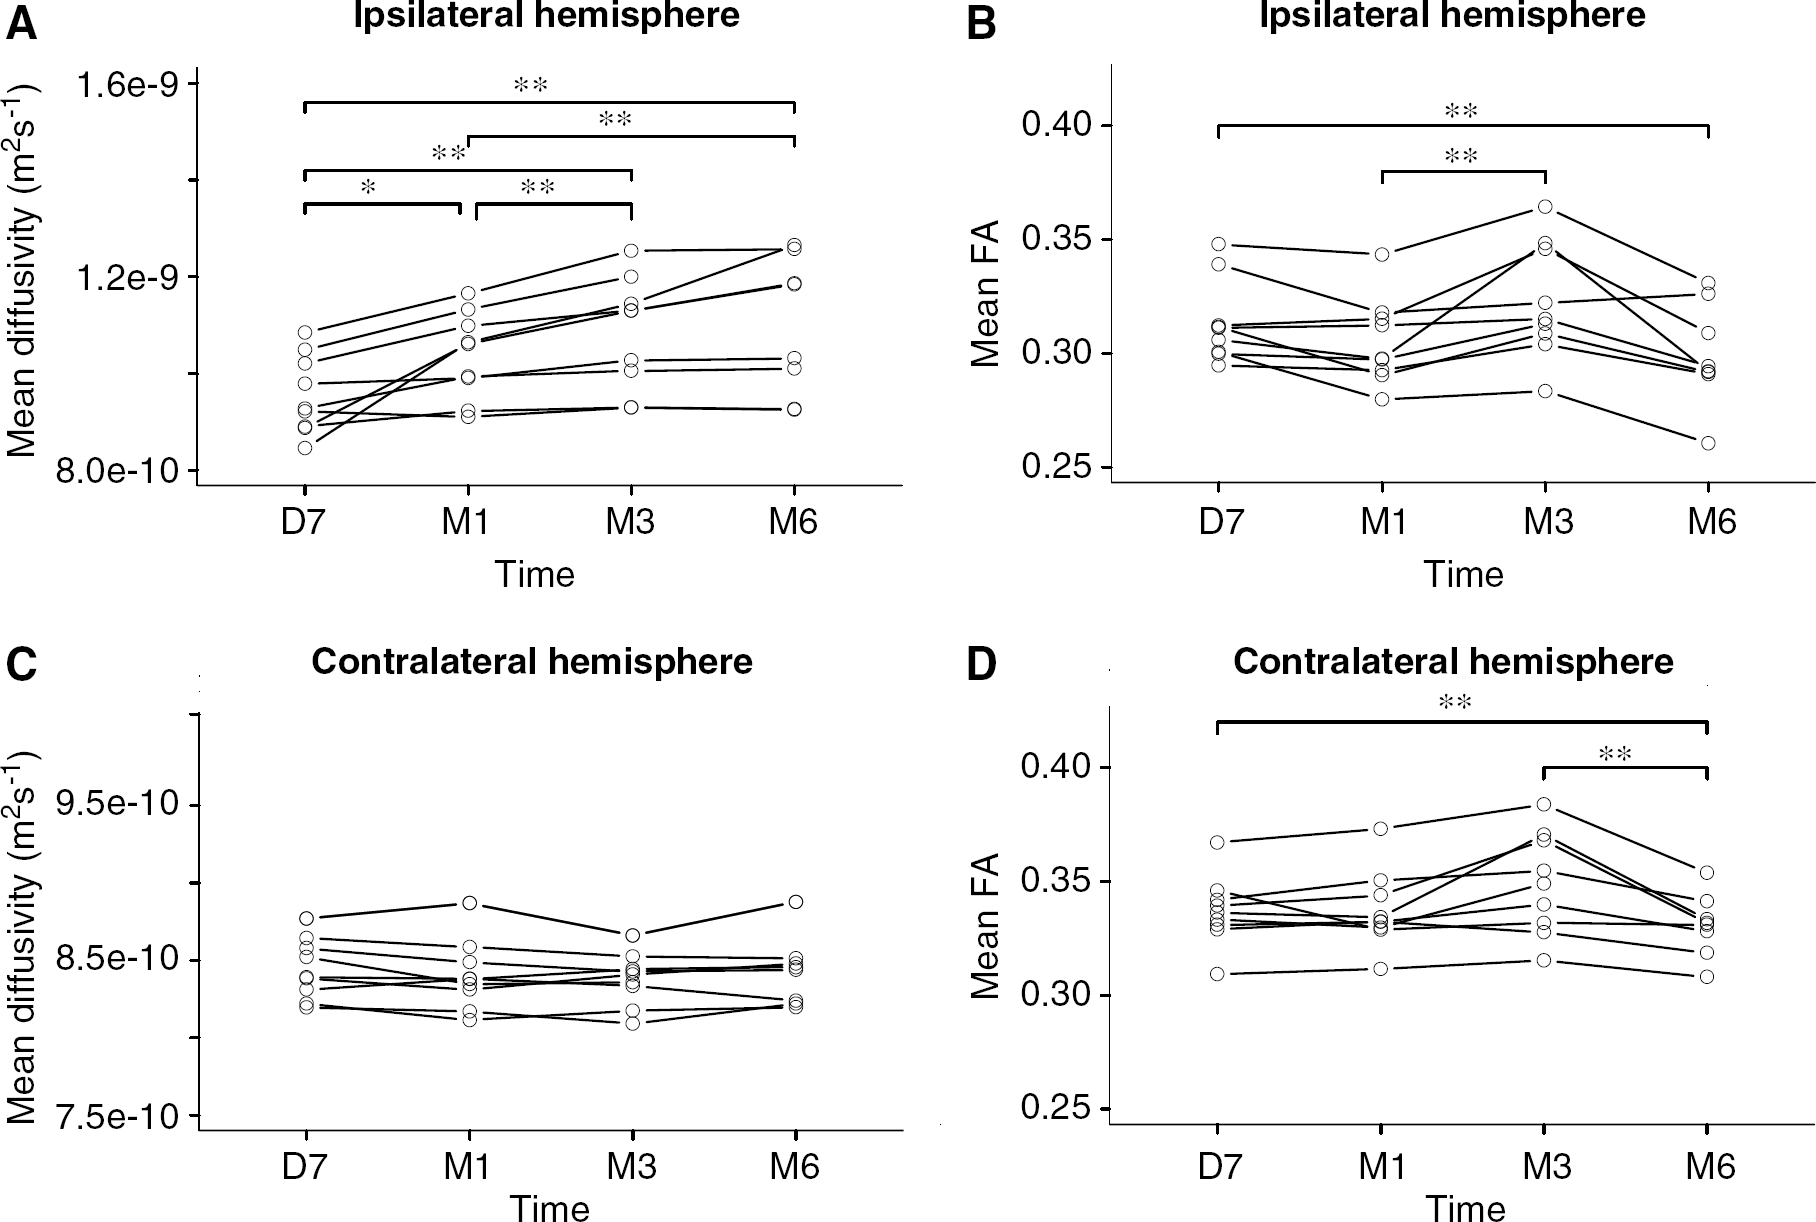
Time course of the mean values of MD and FA derived from individual histograms from D7 to M6. Significant differences between the different sessions are shown using black stars (*P<0.05; **P<0.01). Note the significant increase in MD and loss of anisotropy detected at the individual level in the ipsilateral hemisphere, the significant increase in FA detected at M3 on the same side and the significant reduction of anisotropy between D7 and M6 in the contralateral hemisphere.
Contralateral hemisphere
Except for the peak height of MD that was found to be lower in patients than in controls (respective medians: 0.090 and 0.104, P=0.016), no other significant difference was detected for the parameters derived from MD and FA histograms at D7.
No significant variation with time was detected between each session for parameters derived from MD histograms in patients (Figure 2C). In contrast, a significant decrease of the mean FA was observed between D7 and M6 (P=0.0078), and between M3 and M6 (P=0.0078) (Figure 2D). The peak height of FA histograms at M6 was higher than that obtained at D7, M1, or M3.
The decrease in the mean FA between D7 and M6 was not correlated with the size of the infarction (Spearman correlation coefficient ρ=0.21, P=0.59).
Voxel-by-Voxel Analyses
Ipsilateral hemisphere
The individual voxel-by-voxel analysis (versus controls) disclosed large clusters of voxels with a significant increase of MD at M3 and M6 (Figure 3A) and a reduction of anisotropy at M6 within the ischemic area in all patients (Figure 3B). In only two patients, voxels with a significant increase of FA were detected in the ipsilateral anterior corpus callosum at M6.
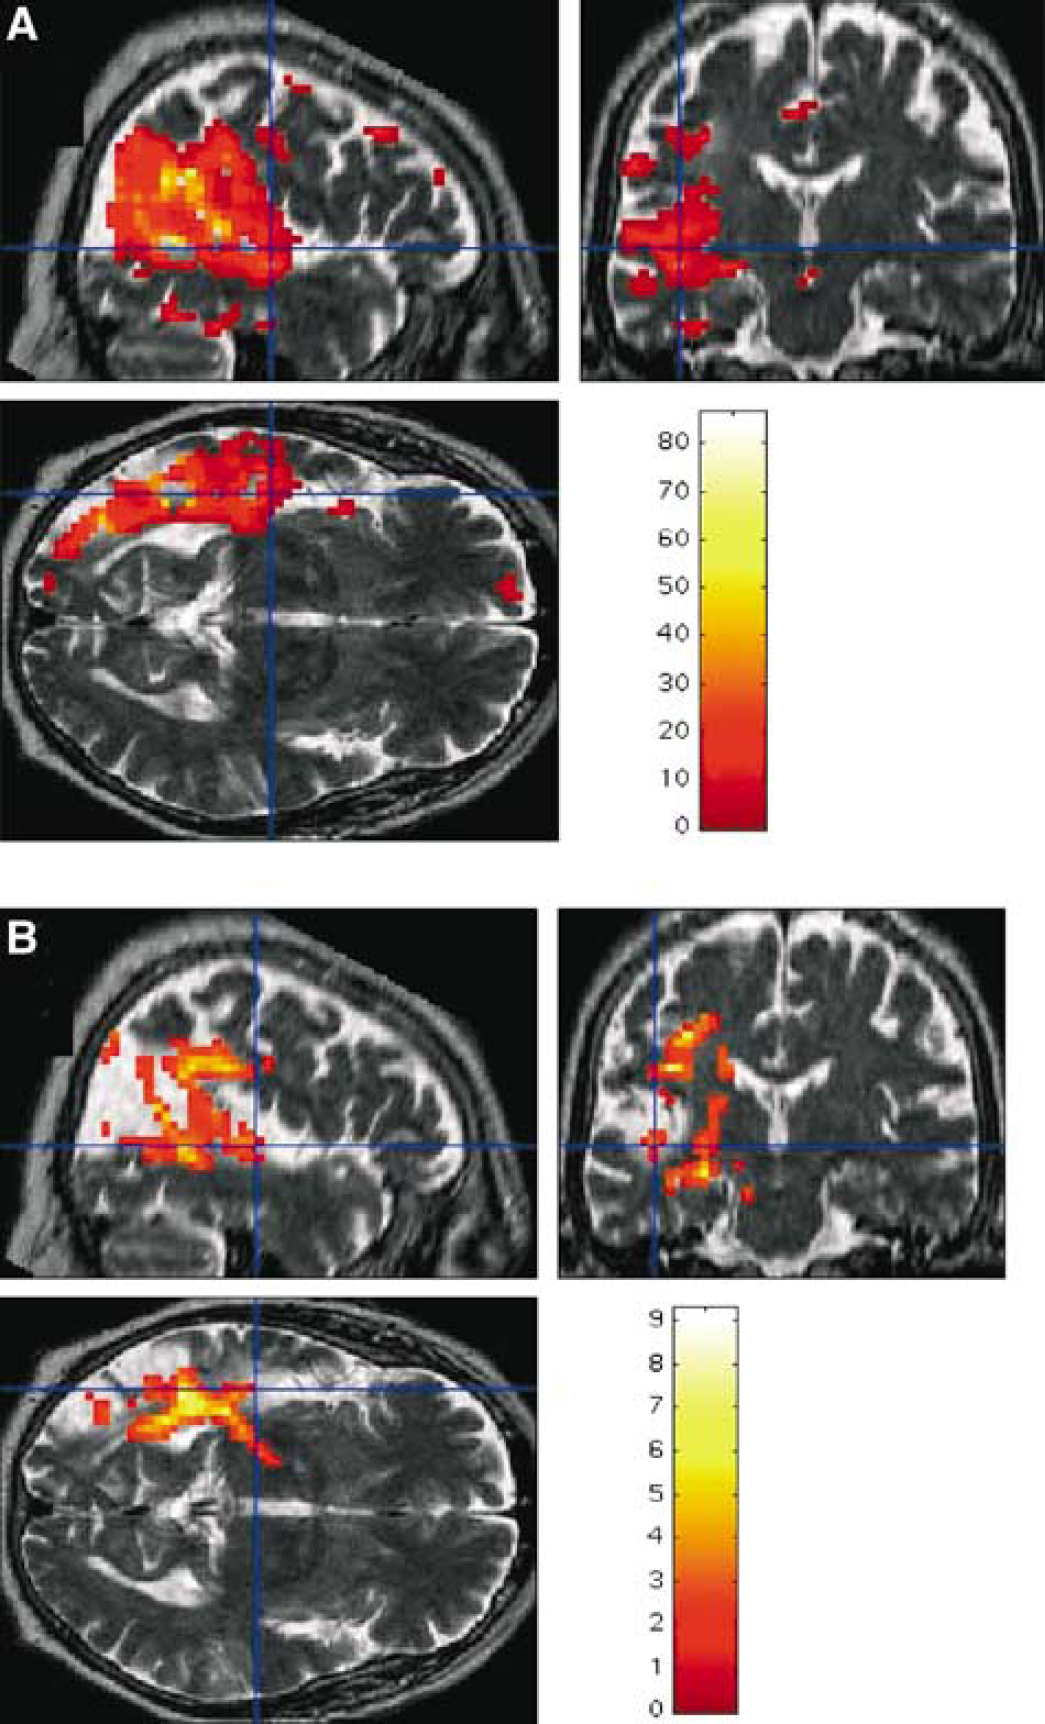
Voxel-by-voxel analysis for MD (
Outside the ischemic area, the two types of group analyses revealed a cluster of voxels with increased MD values in the thalamus ipsilateral to the lesion at M3 and M6 (Figure 4). These analyses applied to FA maps also showed a large cluster of voxels with reduced anisotropy along the ipsilateral pyramidal tract up to the midbrain only at M6 (Figure 5).
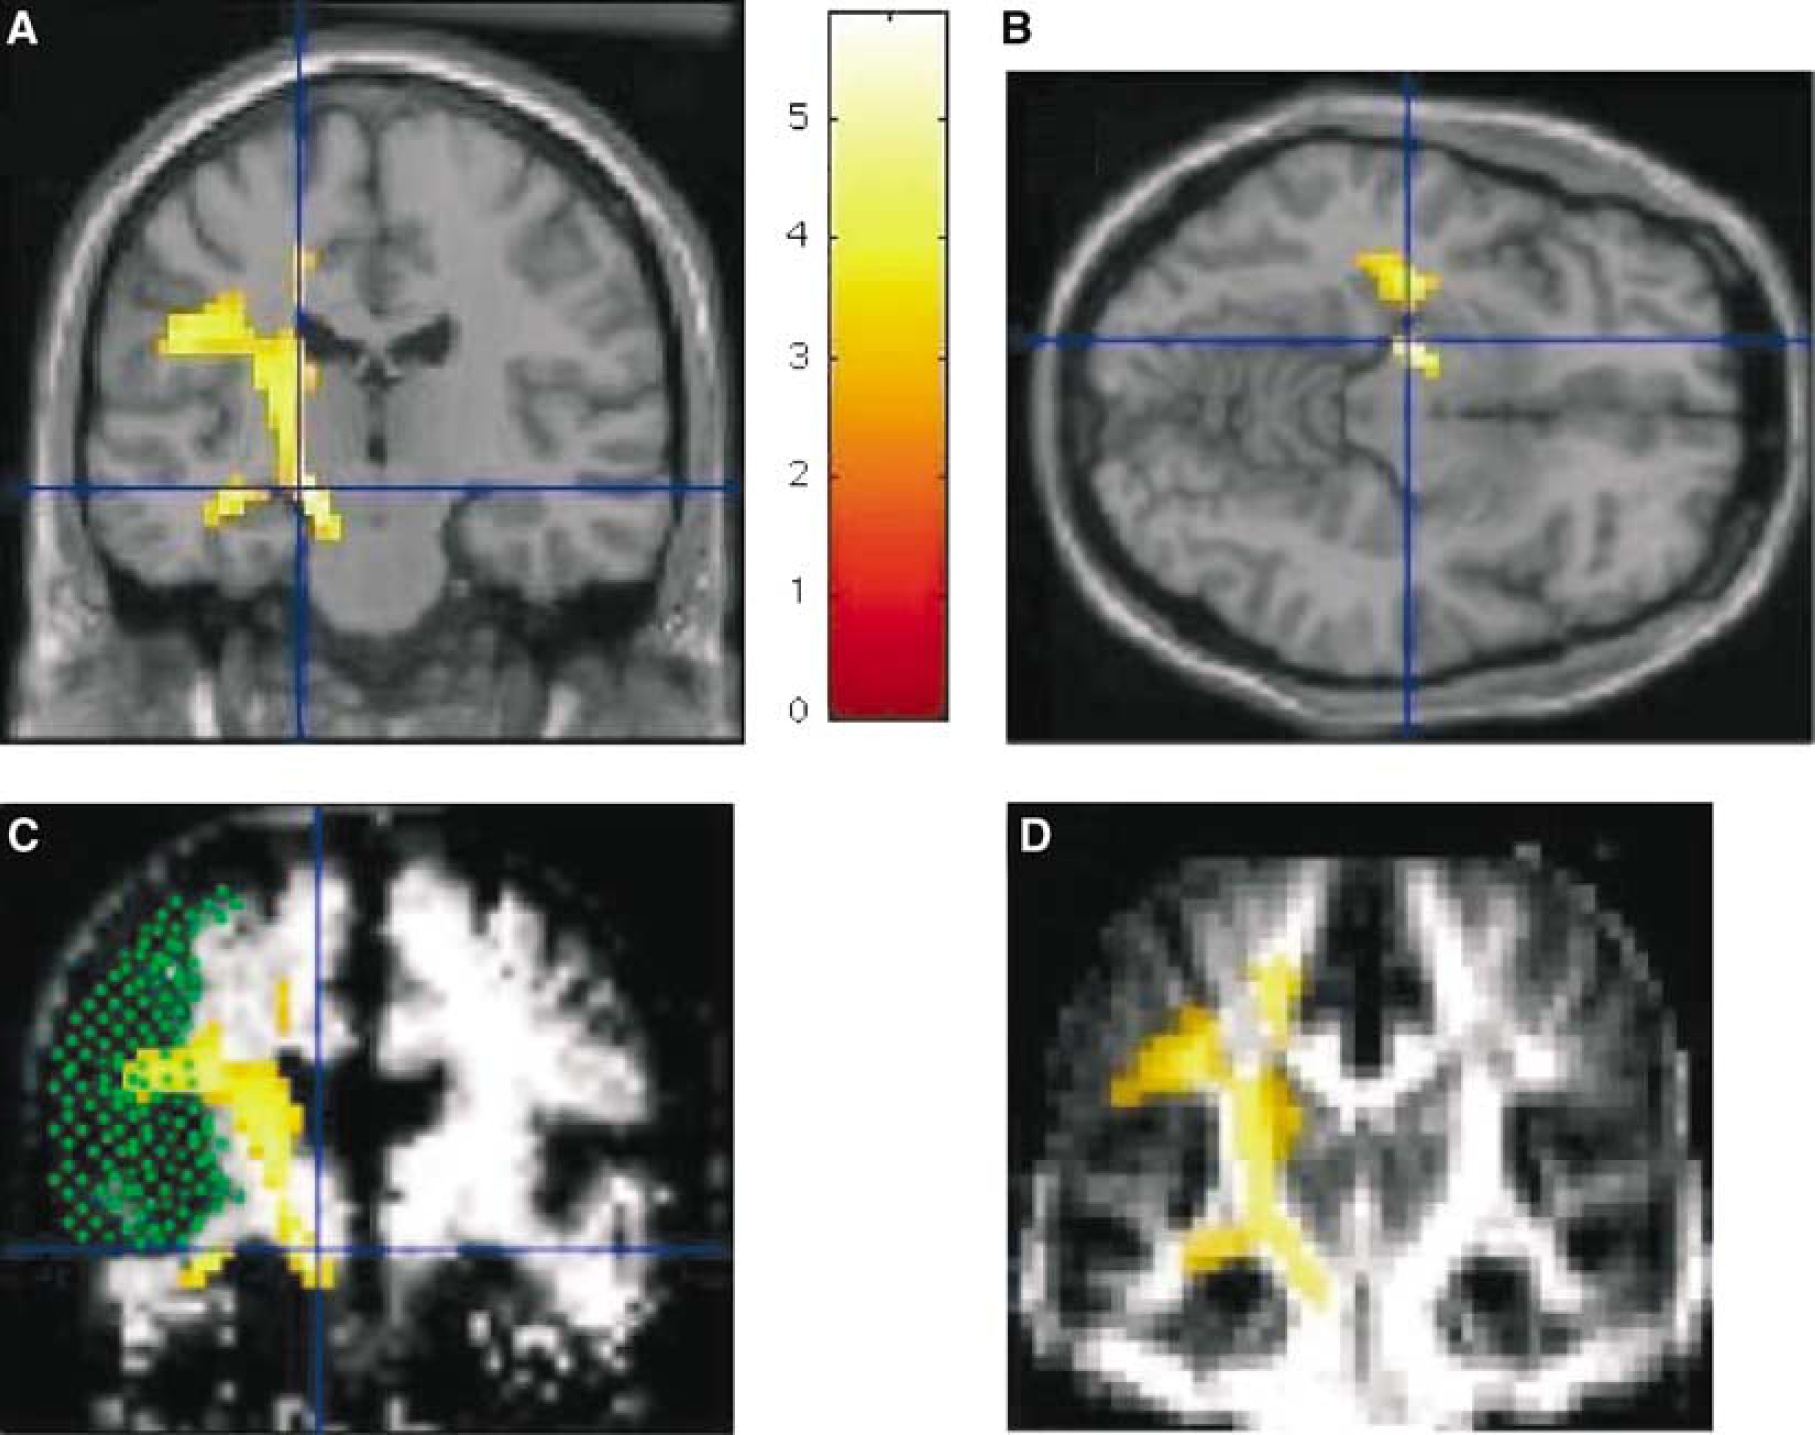
Results of the voxel-by-voxel group analysis for FA. Significant clusters of voxels with decreased FA are shown (color bar corresponding to the Z scores at the level of the voxel) for comparison between the whole group of patients at M6 and controls. Regions with decreased FA in patients at M6 are shown superimposed on normalized T1-WI ((
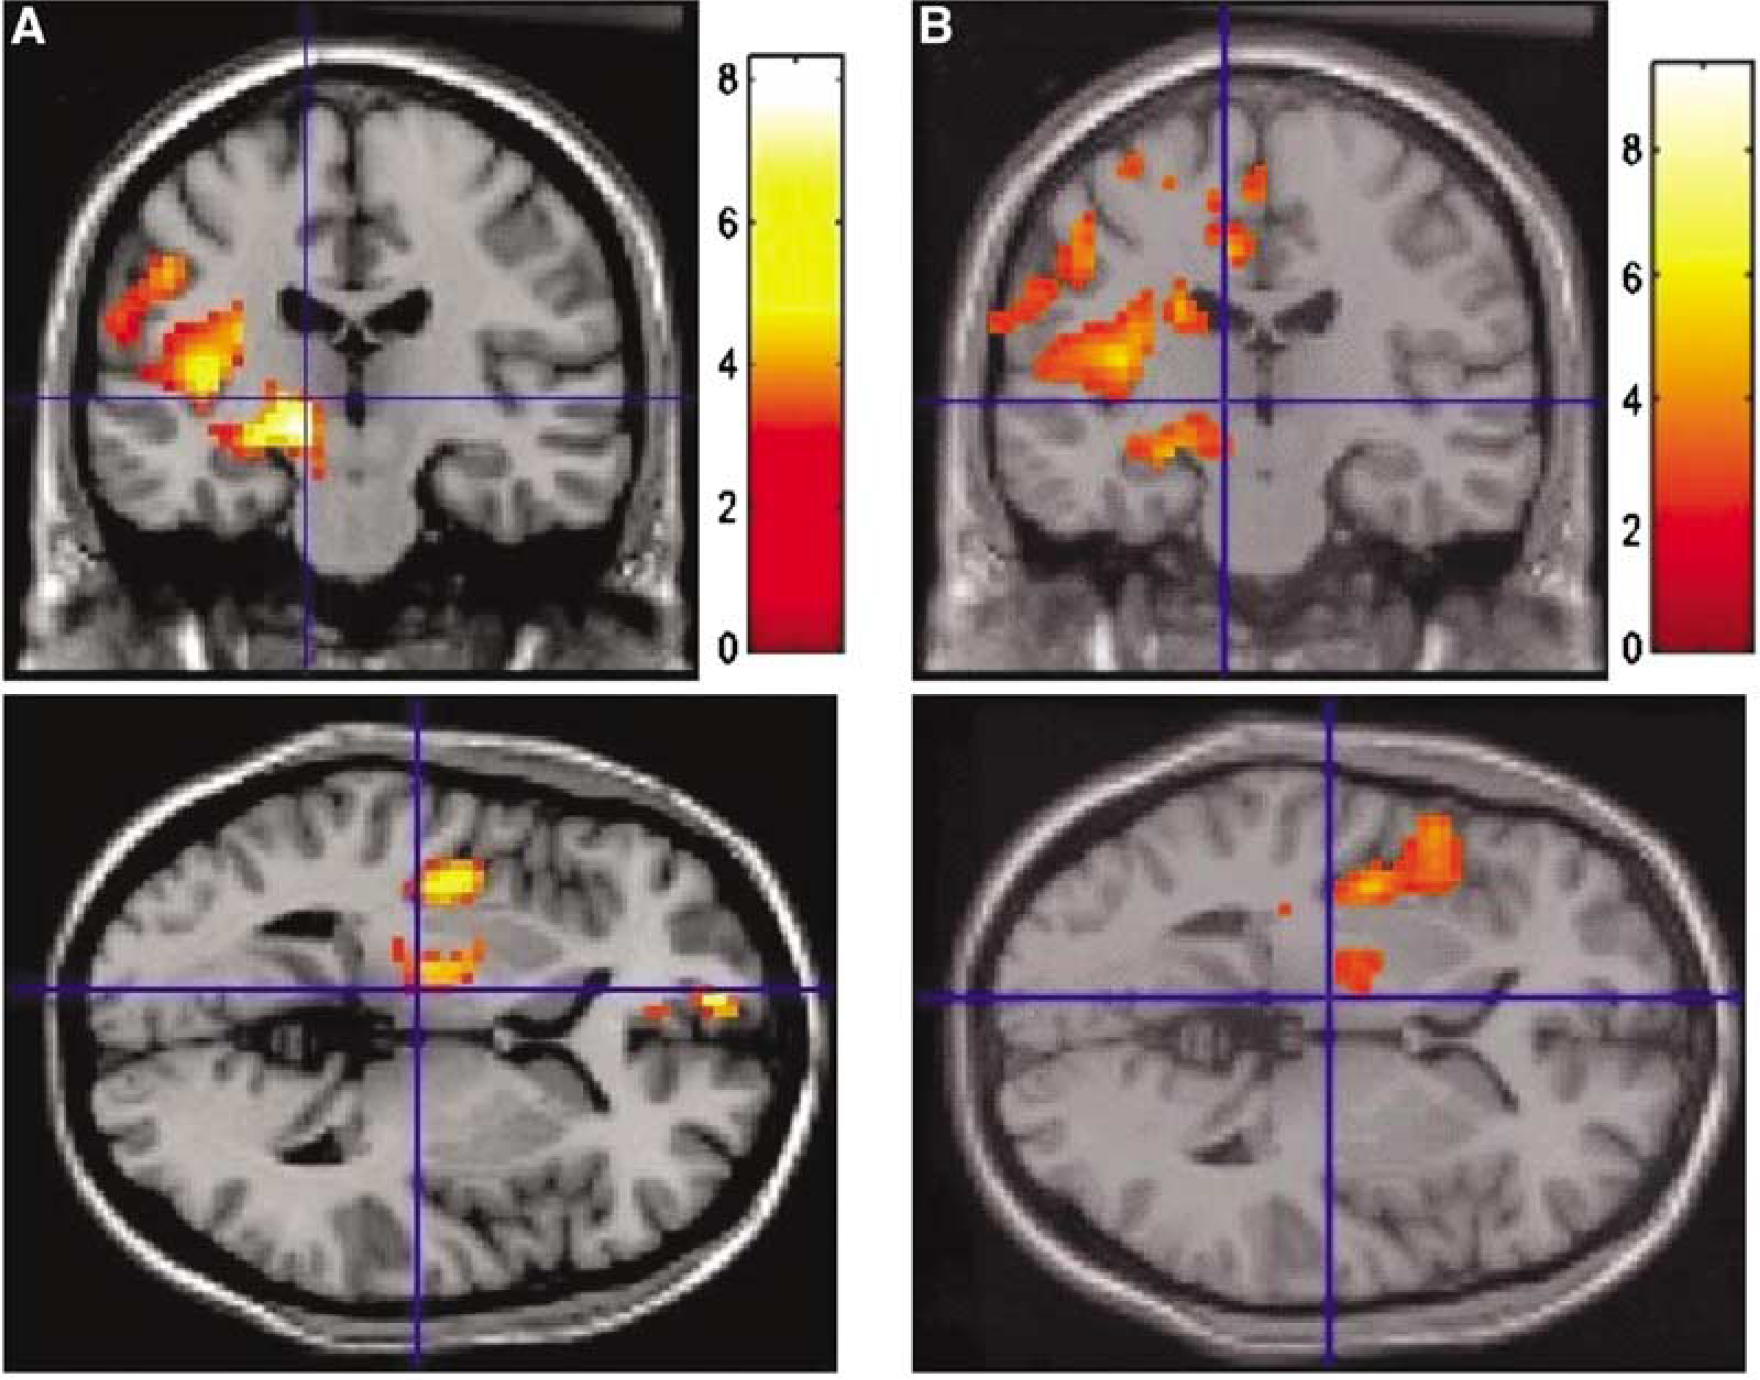
Results of the voxel-by-voxel group analysis for MD. Significant clusters of voxels with increased MD are shown (color bar corresponding to the Z scores at the level of the voxel) for comparison between the whole group of patients at M6 and the control group (
Contralateral hemisphere
No cluster of voxels with significant modifications of MD or FA was detected in the contralateral hemisphere using the same procedure at the individual or group level.
Volumetry of Contralateral Hemisphere
The mean volume of the contralateral hemisphere varied between 453,063 mm3 (±45,965 mm3) at D7 and 437,149 mm3 (±53,089 mm3) at M6. The ANOVA confirmed a statistically significant reduction of the hemispheric volume between D7 and M6 (P=0.011, Pcorrected=0.050) as illustrated by the enlargement of cortical sulci and distension of lateral ventricles as detected on T1-WI (Figure 6).
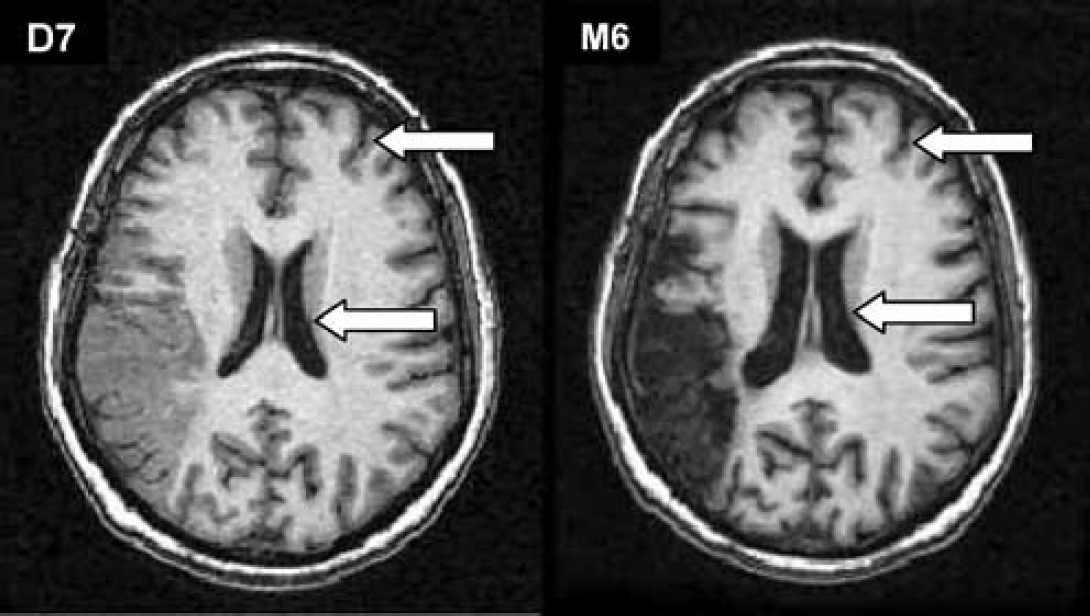
T1-WI obtained in a 60-year-old patient with an isolated left MCA infarct obtained at D7 and M6. Note the cortico-subcortical atrophy detected visually that occurred between D7 and M6, illustrating the significant volume reduction measured in the contralateral hemisphere in the patients' group.
Discussion
This is the first DTI study performed to monitor both the regional and global microstructural tissue modifications occurring after an isolated MCA infarction in humans.
Within the hemisphere ipsilateral to the ischemic lesion, the analysis of histograms confirmed a global and progressive increase in diffusion from D7 to M3 after the stroke onset. At the individual level, this increase was mainly located within the ischemic area. These results are in accordance with several reports of a steady increase in diffusion occurring after the first week within the ischemic area. This increase in water diffusion is presumably related to the rupture of cell membranes associated with the extension of the extracellular space resulting from necrosis (Sotak, 2002). The progressive loss of anisotropy that became significant at the group level more than 3 months after the onset is also in line with this interpretation. The decrease in FA is presumably related to the loss of ordered structures within the tissue restricting the movements of water molecules, and may reflect the axonal damage and/or myelin loss accumulating with time in the ischemic region. In the present study, the histogram analysis showed that the loss of anisotropy is maximal at 6 months, while the MD reaches a plateau after 3 months. This finding further confirms that the decreased anisotropy and increased diffusion are not related to identical processes, and suggests that the loss of ordered structures (axonal loss) and/or demyelination within the affected hemisphere is not ended 3 months after the infarction.
Another important result of this study is the demonstration of water diffusion modifications 3 and 6 months after the stroke onset, in the thalamus and within the pyramidal tract, that is, in areas remote from the ischemic area. The significant increase in diffusion detected in the thalamus ipsilateral to the infarction is in favor of a loss of microscopic thalamic components because of the interruption of some thalamo-cortical fibers by retrograde degeneration as already observed in post-mortem studies after MCA occlusion (Ogawa et al, 1997b). This was recently reported by Hervé et al (54th Meeting of the American Academy of Neurology, Denver, 2002) who performed a study focusing on this aspect based on regions of interest delineated after anatomical segmentation of the thalamus in the same sample of subjects. In the pyramidal tract, the reduction of anisotropy without significant change of the magnitude of diffusion was detected both at the individual and at the group level. Identical results were previously reported by Werring et al (2000) using regions of interests, 2 to 6 months after MCA infarction. These diffusion changes are presumably related to wallerian degeneration. The increase in cellularity due to the infiltration of glial cells counterbalancing the axonal and myelin loss may explain the apparent normality of diffusion associated with the reduction in anisotropy (Pierpaoli et al, 2001). Some authors suggested that these diffusion changes are of prognostic value for motor recovery (Werring et al, 2000; Zelaya et al, 1999). We did not assess this aspect in this too small sample of patients.
In the hemisphere contralateral to the infarction, the histogram analysis revealed a significant loss of anisotropy between D7 and M6 in the absence of a detectable regional pattern using the voxel-by-voxel analysis. Despite this discrepancy, we think that the reduction in anisotropy detected in the contralateral hemisphere at M6 is not linked to artifacts for different reasons. First, the histogram method used in the present study offers many advantages compared with other techniques of imaging analysis and has been validated in various conditions (Molko et al, 2002; Nusbaum et al, 2000). Particularly, this highly reproducible method does not require operator-dependant delineation of regions of interest or algorithms for registration (Molko et al, 2002; Sormani et al, 2000). Second, the results obtained using this technique at the global and regional levels in the infarcted hemisphere provided coherent data and confirmed results already obtained by different authors (Werring et al, 2000; Zelaya et al, 1999). Third, the reduction in anisotropy was parallel to the volume reduction in the hemisphere contralateral to the infarct, another evidence of structural changes detected at 6 months. Otherwise, the negative results obtained in the regional analysis might be related to the very low degree of diffusion changes occurring in this hemisphere or to the variable distribution of FA changes related to the different size and topography of the infarct, or to both of these phenomena. In addition, the small size of our sample, the loss of information using the image transformation for registration (including the partial volume effect), spatial normalization, and the smoothing of the data that can alter the sensitivity of the voxel-by-voxel analysis are other important limitations of the present study (Alexander et al, 2001; Friston et al, 1995; Jones et al, 2002). In spite of these limitations, such results suggest that diffusion modifications in the contralateral hemisphere are much more subtle or widespread than those detected in the ipsilateral hemisphere. The loss of anisotropy associated with hemispheric atrophy contralateral to MCA infarcts strongly supports that secondary degeneration and demyelination spread to the contralateral hemisphere during the first 6 months after the occurrence of a MCA infarction. Only functional modifications have been previously reported in the contralateral hemisphere after MCA infarcts using SPECT (Bowler et al, 1995) or PET (Iglesias et al, 1996), the role of which in clinical recovery is now debated. Remarkably, a significant increase in FA was also detected in the hemisphere ispilateral to the ischemic lesion with histograms and a similar trend was found in the contralateral hemisphere at M3 before the final loss of anisotropy measured at M6. The reduction in the peak height of FA associated with the increase of the mean of FA suggests that these diffusion changes might be quite extensive. A hypothesis is that the increase in anisotropy may reflect some aspects of delayed synaptic reorganization. In rats, several authors reported that axons from uninjured neurons that have lost efferent target neurons may sprout and form synapses in previously empty spaces (Carmichael, 2003; Kristt, 1987; Stroemer et al, 1995, 1998). An alternative explanation would be a transient increase in axonal density related to neuronal regeneration as observed in the ipsilateral striatum and hippocampus in animal models of MCA occlusion (Nadareishvili and Hallenbeck, 2003; Nakatomi et al, 2002). However, we cannot exclude a type I error to explain such results due to the small size of the sample, and due to the high sensitivity of FA maps to noise that can favor some fluctuations in the data. The increase in the mean of FA histogram detected in 6/9 patients at M3 in association with the random recruitment and investigation of patients does not support this interpretation; however, only a new study in a larger sample of patients will help to settle this issue. Finally, this DTI study shows that both micro- and macrostructural cerebral modifications occur during the late stage of MCA infarcts in regions remote from the ischemic area. The relationships between these structural tissue changes and the functional plasticity of the brain and their importance in the clinical recovery deserve further investigations.