
Abstract
Compartmental modeling analysis of 11C-raclopride (RAC) PET data can be used to measure the dopaminergic response to intra-scan behavioral tasks. Bias in estimates of binding potential (BPND) and its dynamic changes (ΔBPND) can arise both when head motion is present and when the compartmental model used for parameter estimation deviates from the underlying biology. The purpose of this study was to characterize the effects of motion and model bias within the context of a behavioral task challenge, examining the impacts of different mitigation strategies. Seventy healthy adults were administered bolus plus constant infusion RAC during a simultaneous PET/magnetic resonance (MR) scan with a reward task experiment. BPND and ΔBPND were estimated using an extension of the Multilinear Reference Tissue Model (E-MRTM2) and a new method (DE-MRTM2) was proposed to selectively discount the contribution of the initial uptake period. Motion was effectively corrected with a standard frame-based approach, which performed equivalently to a more complex reconstruction-based approach. DE-MRTM2 produced estimates of ΔBPND in putamen and nucleus accumbens that were significantly different from those estimated from E-MRTM2, while also decoupling ΔBPND values from first-pass k2′ estimation and removing skew in the spatial bias distribution of parametric ΔBPND estimates within the striatum.
Introduction
11C-Raclopride (RAC) positron emission tomography (PET) is a well-established means of imaging dopamine D2/D3 receptor binding. It has been used to measure the spatial distribution of receptors, 1 as well as the kinetic properties of their binding. 2 It has also been used to study the dopaminergic system under blocking and displacement conditions and after pharmacological challenges using amphetamine,3–5 cocaine,6,7 and nicotine,8,9 and behavioral challenges such as reward,10,11 motor performance, 12 pain, 13 and cognitive tasks. 14
One of the difficulties in working with behavioral challenge experiments is their modest response magnitudes relative to those of pharmacological challenges. While pharmacological challenges may cause changes in binding potential (BPND) of 10–20% or greater,5,15,16 behavioral challenges produce smaller changes of around 0–10%.14,17–19 With these smaller effects, measurements of behavioral challenge response are more difficult to discern from noise, while also being more susceptible to different sources of bias,20,21 including bias arising from head motion 17 and from model selection. 22
Head motion over the course of a PET acquisition can create misalignments between frames and blurring artifacts within frames leading to biased measurements of BPND and its change over time (ΔBPND: BPND-POST – BPND). Motion bias is routinely addressed in the field by either rigidly registering PET volumes after reconstruction (i.e. frame-based motion correction)23,24 or using more advanced methods which require independently estimated motion parameters (e.g. reconstruction-based motion correction 25 or event-based rebinning26,27).
Bias in estimates of RAC BPND and ΔBPND can also arise from the compartmental models used for analysis when underlying assumptions are violated. Depending on the design of the study, RAC kinetic modeling approaches may utilize a two-tissue compartment model configuration with metabolite-corrected arterial plasma data as an input function. Alternatively, simplifying assumptions may be made to use a one-tissue compartment model configuration and/or a reference-tissue model for which the input function is derived from a region devoid of specific binding.28,29 One common source of model bias arises when fitting a model with a one-tissue compartment configuration to data that is more accurately represented by two-tissue compartments.21,22 Single-tissue compartment configurations are often employed to improve model stability and convergence, rendering such bias a necessary tradeoff. This bias may be compounded if the model is further reduced by fixing the rate of efflux from the reference region (k2′) to constrain the parameter space and thereby facilitate robust parametric mapping.30,31 These biases can be reduced while maintaining a single-compartment configuration by adjusting the model to better fulfill its simplifying assumptions.
In this work, we build upon an earlier finding of measurable differences in RAC ΔBPND between participants grouped by task performance 32 to investigate the impact of motion and model biases and to propose an effective approach for addressing them within the context of an intra-scan behavioral challenge. First, we used simulations to estimate the extent of the motion bias and compare frame-based and reconstruction-based approaches to correcting it. Next, we considered the bias that arises when the one-tissue model assumption of fast-exchange between the non-displaceable and specifically bound compartments is violated. To mitigate this bias, we propose a new model: the Debiased Extended Multilinear Reference Tissue Model (DE-MRTM2). DE-MRTM2 eliminates the contribution of the initial uptake period to the estimation of BPND and ΔBPND, thereby improving model-based bias in estimates of behavioral task response for intra-scan task designs. Simulations were used to estimate the extent of the model bias, the impact of DE-MRTM2, and the relationship between k2′ selection and ΔBPND. The estimates of model bias and motion bias were then compared using simulated challenge responses of different magnitudes. Finally, frame-based motion correction and DE-MRTM2 were applied to the acquired human data and the regional statistical significance of the proposed methods was evaluated.
Material and methods
Participants and data acquisition protocols
Seventy adult participants (female = 34, ages 18–30 years) were retrospectively selected from an adolescent development study performed on an integrated PET/MRI scanner (Biograph mMR, Siemens Healthineers, Erlangen, Germany) at the University of Pittsburgh Medical Center. 33 Healthy volunteers were scanned using RAC while simultaneously performing a functional magnetic resonance imaging (fMRI) task designed to study reward response. All participants gave written informed consent and were studied in accordance with experimental procedures approved by the University of Pittsburgh Institutional Review Board. All participants were imaged in the headfirst supine position and PET data were collected from the start of radiotracer administration.
Participants received a bolus injection of RAC (661–802 MBq) followed by a constant infusion (KBol = 105 min, 54% of the total dose) for the duration of the 90-minute scan. PET 3D coincidence event data were collected and stored in list-mode format. PET volumes were iteratively reconstructed with a uniform 3-minute framing using the e7 tools (OP-OSEM, 3 iterations, 21 subsets, no filter).34,35 Attenuation correction was performed using a pseudoCT attenuation map 36 generated from a T1-weighted structural sequence (MPRAGE) registered to the PET volume at the start of the task. The simultaneously acquired MRI protocol centered on eight fMRI-BOLD sequences (echo time [TE] = 30 ms, repetition time [TR] = 1500 ms). Six were acquired during the task window (t = 40–75 min) and two were resting state sequences, one at the beginning of the scan (t = 0–10 min) and one after completion of the task (t = 80–90 min). The protocol also included the aforementioned MPRAGE for attenuation correction and region-of-interest label generation, and several sequences used routinely for brain studies (e.g. localizer, gradient-echo field mapping, ultrashort TE, TurboFLASH, diffusion spectrum imaging, and magnetization transfer ratio). For the purpose of PET data analysis, the task was considered as a single block. No pharmacological intervention was performed. Further information about the study design can be found in previous reports.32,33
Control data from a different bolus RAC study 5 were utilized exclusively to determine specific simulation input parameters (K1′, k2′). These data were acquired on a standalone PET scanner (ECAT EXACT HR+, Siemens, Knoxville, TN) at the University of Pittsburgh. Transmission-mode PET was used to acquire attenuation maps, and arterial blood plasma was sampled as an input function. The maximal injected mass of the RAC bolus was 6 µg and PET data were acquired for 60 minutes post-injection.
Kinetic modeling
The Multilinear Reference Tissue Model (MRTM2)
31
was used to measure RAC BPND in the striatum with the cerebellum as the reference tissue. The efflux rate constant (

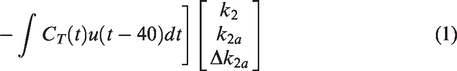
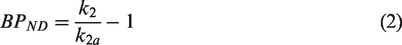
When considering a model with a single-tissue compartment, BPND is expressed in terms of a combination of the true efflux rate (k2), and the apparent efflux rate (k2a)
29
(equation (2)).
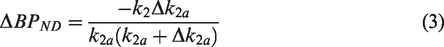
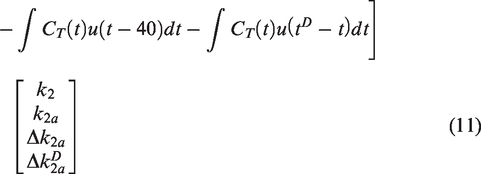
ΔBPND is expressed in terms of k2, k2a, and the change in the apparent efflux rate (Δk2a) (equation (3)).
Simulation design
Simulated PET data were utilized in three different simulation experiments to investigate bias in ΔBPND: estimation of motion bias, estimation of model bias, and comparison of motion and model bias (see the respective sections for each below). This section details the common methods across all simulation experiments.
Simulated PET time activity curves were generated for every voxel in the brain using a two-tissue compartment model configuration. Fully simulating this set of four-dimensional timeseries PET data required values of K1, k2, k3, and k4 for every voxel in the brain as well as an arterial input function (CP).
The input parameters to the simulations were deliberately selected to reflect the experimental data to the greatest extent possible without the benefit of known ground truth values. Individual values of K1, k2, and k3 for each voxel were generated using the definitions of their associated macroparameters: R1 and BPND (equations (4) to (6)).
29


To determine the most appropriate values of R1 and BPND, voxelwise analysis with MRTM231 was performed on the acquired PET data and maps of R1 and BPND were averaged across all participants to serve as realistic voxel-based maps for input to the simulations.
In contrast to the selection of the other compartmental microparameters, a robust means of assigning voxelwise estimates to k4 was not available. Therefore, individual simulations fixed k4 to a single physiologically plausible value reported for RAC (k4 = 0.07 min−1)2,22 in order to calculate bias levels.
To estimate the reference tissue rate constants (K1′, k2′), we utilized a control RAC data set acquired in healthy adult volunteers with a bolus injection and arterial blood sampling. 5 The reference region (cerebellum) time activity curve (TAC) was fit using a nonlinear one-tissue compartmental model and a metabolite-corrected plasma input function. The average estimated values across four participants (K1′ = 0.22 ± SD 0.02 mL cm−3 min−1, k2′ = 0.58 ± SD 0.05 min−1) were selected for use in the simulations. Given these values of K1′ and k2′ and the acquired cerebellum TACs averaged across participants in the task-reward study, a suitable parametric bolus plus constant infusion arterial input function (CP) was selected for use in simulations.
Once the noiseless TACs were simulated, Gaussian noise was added on a voxelwise basis according to the method described in Logan et al.
40
(equations (7) and (8))
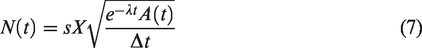
Equation (7) describes the generated noise (N) prior to decay correction, where A(t) is the noiseless activity value at time t, λ is the half-life of 11C (20.4 min),

Equation (8) shows how the decay-corrected noise (
Motion bias
Frame-based motion correction
The methodology for frame-based motion correction is well established in the field.23,24,41,42 Briefly, the head was treated as non-deformable, and a linear least squares rigid body registration algorithm (implemented in SPM8 43 ) was applied to track its displacements. This was accomplished by retrospectively coregistering the dynamic volumes 44 to a reference volume at the onset of the task (t = 40 min).
Reconstruction-based motion correction
To correct for motion during reconstruction, head motion was first estimated from the PET data using a procedure similar to frame-based motion correction. First, the PET list-mode data were split into 1-minute subframes (with the exception of the first subframe, which was 2 minutes to accommodate the rapidly changing spatial contrast associated with delivery). Next, preliminary image reconstructions were performed, accounting for detector normalization and radiofrequency MRI coil array attenuation, but without correcting for head attenuation. The resulting volumes were registered to produce motion estimates, rather than to perform motion correction directly. These motion estimates were measured as a set of three translations and three rotations, which were then encoded into a 4 × 4 transformation matrix and supplied to the reconstruction algorithm for motion correction.
Motion was corrected as part of the iterative PET reconstruction for each dynamic frame using a development version of the e7 tools. 25 For each PET volume reconstructed, the associated timeframe was divided into subframes corresponding to the temporal resolution of the motion estimates. During each reconstruction iteration, the current estimate of the PET volume was replicated for each subframe, and the subframe volumes were moved according to the estimated motion before being forward projected into sinogram space. After backprojection, the subframe volumes were motion corrected and averaged to form the subsequent estimate of the reconstructed PET volume. Correction for scatter and randoms was performed using the full sinogram for the given timeframe, with proportional scaling for each subframe.
Motion bias: Experimental task data
To demonstrate the deleterious effects of motion and the compensatory effects of frame- and reconstruction-based motion correction, a comparison was performed between the participants who moved the most and those who moved the least. The high and low motion groups were selected to include individuals whose motion was in the upper and lower quintiles (20%, n = 10 per group) of total cumulative participant motion (Figure S1). For each participant, voxelwise maps of binding potential and the change in binding potential were generated by applying kinetic modeling to motion-corrected image data, using the methods described above. Example regional TACs reconstructed with different motion corrections and fit with E-MRTM2 can be seen in Figure 1(a).
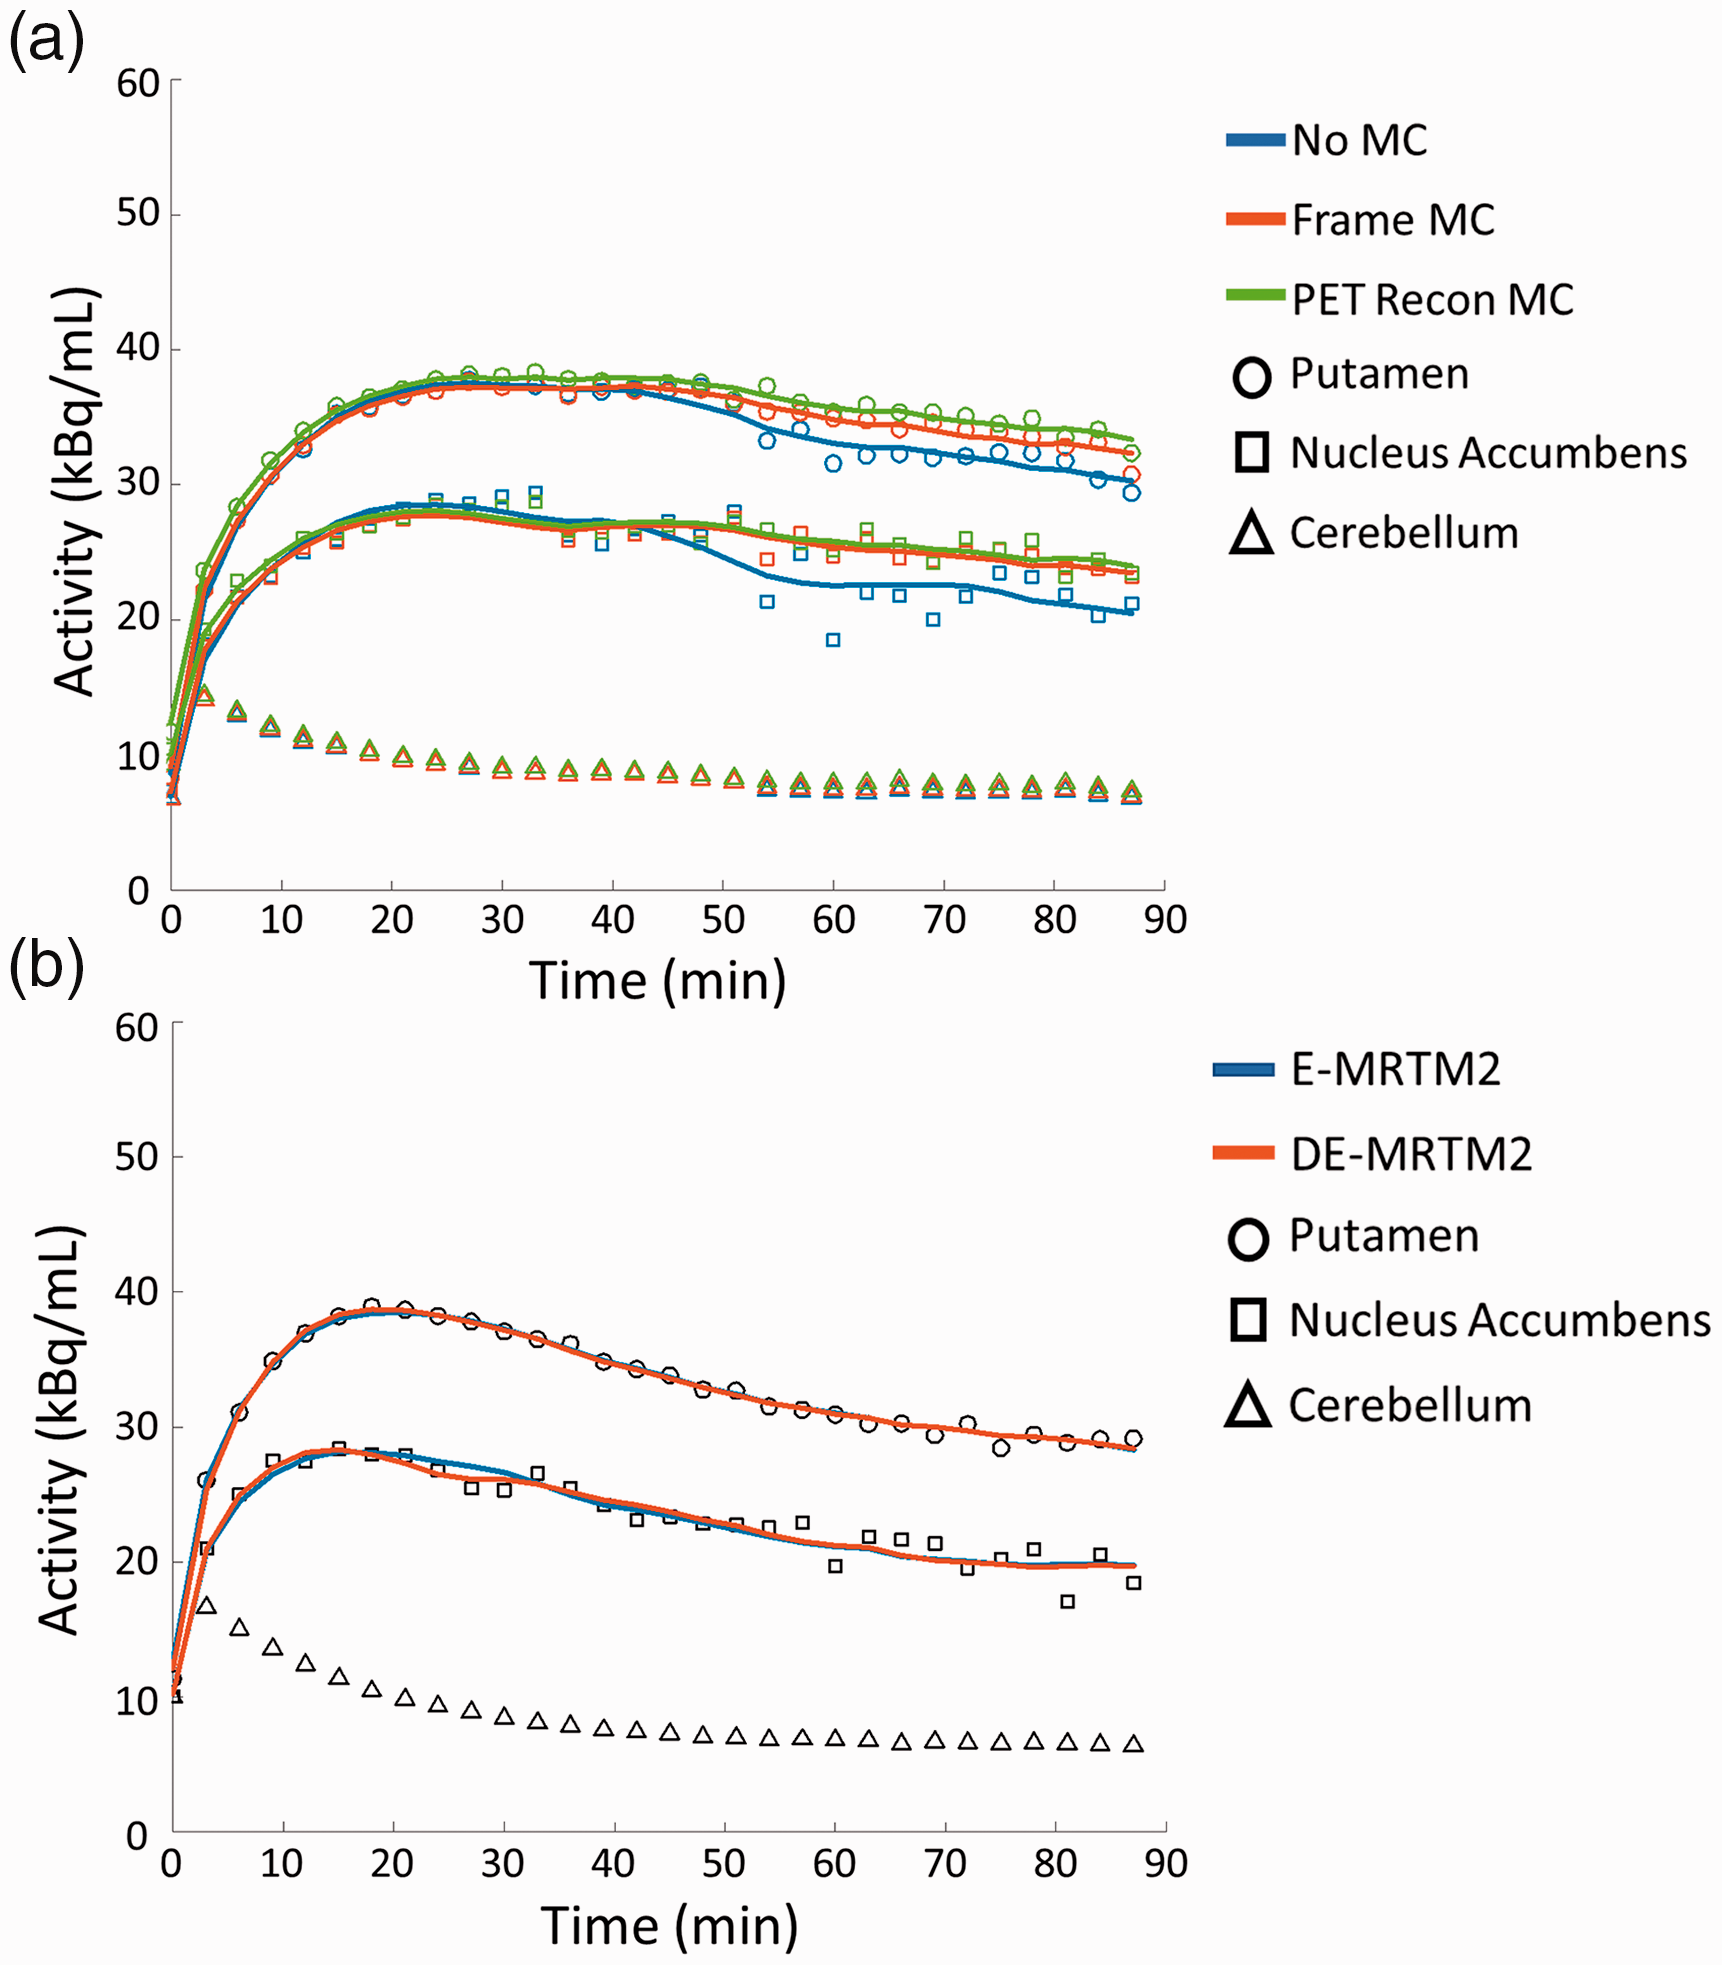
Example experimental TACs and kinetic model fits. (a) Putamen and nucleus accumbens TACs from a high motion subject reconstructed with no motion correction (No MC), frame-based motion correction (Frame MC), or reconstruction-based motion correction (PET Recon MC) and fit with E-MRTM2. (b) Putamen and nucleus accumbens TACs from a low motion subject reconstructed with frame-based motion correction and fit with E-MRTM2 and DE-MRTM2.
Motion bias: Taskless simulations
To simulate realistic motion at a high temporal resolution, motion was estimated from the simultaneously acquired MR data of the participants in the high motion group. The algorithm for estimating motion from EPI-based MRI sequences has been described previously.26,45 It follows the same approach as the PET-based approach (Figure S2A), using rigid body registration with a least-squares cost function to estimate motion. The first volume in the first task fMRI sequence was selected as the reference volume, and all other volumes were registered to it in two steps: intra-sequence and inter-sequence. First, volumes within the same sequence were registered, producing a set of motion estimates for each volume. Afterward, the reference volume used for each sequence was registered to the overall reference volume at the start of the task. Final motion estimates were obtained by multiplying the 4 × 4 transformation matrices corresponding to the intra- and inter-sequence estimates (Figure S2B).
Higher temporal resolution estimates were created by substituting the PET- for MR-based estimates wherever they were available, creating unified motion estimates (Figure S2C). However, to avoid discontinuities within the unified motion estimates, instead of using intersequence MR-based estimates for the second transformation, the time-matched PET-based transforms were used (Figure S3).
PET volumes were simulated with a dynamic framing matching the high temporal resolution of these motion estimates and transformed according to them to create intraframe motion. To create a series of volumes with a uniform framing of 3 minutes, the subframe volumes at this higher temporal resolution were averaged. Where motion is simulated between the subframes, the averaging creates a blurring effect in the final volume, simulating intraframe motion.
The relative effects of intra- and interframe motion were compared by simulating intraframe motion with no task challenge and either performing no motion correction or frame-based motion correction before kinetic analysis. Not performing motion correction allowed us to estimate the total motion bias in ΔBPND, while correcting for it allowed us to estimate the contribution of the intraframe component alone. Simulated motion was derived from estimates of the participants with the most motion (top 20%), and noise levels were calibrated to match the acquired data.
Model bias
Theory: DE-MRTM2 and model bias in ΔBPND
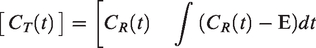
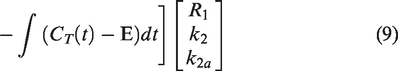
An analytical approach can be employed to describe the bias that arises from the difference between one-compartment and two-compartment reference tissue models (equation (9)). This difference can be ascribed to a term (E) that depends upon the convolution of the tissue concentration derivative with an exponential function of BPND and k422 (equation (10)).

This term is especially pronounced during the uptake period (strong tissue derivative) and in regions with either low binding or low k4. Applying a one-compartment tissue model—like MRTM and its variations—assumes that E (and therefore the difference between the two models) is negligibly small. Therefore, to mitigate the bias that arises when it is not, we propose an approach to
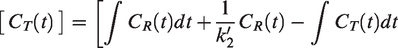
DE-MRTM2 breaks the measurement of
Simulations: Estimating model bias in ΔBPND
Model bias was estimated by comparing data simulated with a two-tissue compartmental model against kinetic modeling analysis performed with a single compartment. By simulating PET data without a challenge, and fitting a model with a challenge, any resultant estimate of ΔBPND can be attributed solely to bias. Voxel maps of ΔBPND were produced by fitting both E-MRTM2 and DE-MRTM2 to the simulated data and median averaging across noise realizations (n = 10). These simulations were then compared to human voxel maps of ΔBPND fit with E-MRTM2 and DE-MRTM2 and median averaged across all participants.
Experimental: Assessing the impact of k2′ on ΔBPND
To examine the extent to which this approach to bias mitigation is dependent upon the selection of k2′, DE-MRTM2 and E-MRTM2 were fit while the value of k2′ was fixed according to one of four estimation methods. In order of highest to lowest estimated value of k2′, these methods were:
Estimated from blood in control data set (k2′ = 0.55)
MRTM fit to top 10% of striatum voxels by BPND (k2′ = 0.30)
MRTM fit to putamen (k2′ = 0.25)
MRTM fit to bottom 10% of striatum voxels by BPND (k2′ = 0.20)
Comparing motion and model bias
To compare the effects of motion bias, model bias, and true task response signal, a series of voxelwise simulations were analyzed, varying the presence of motion and the magnitude of the simulated challenge response (
Regional statistical significance
To evaluate the impact of the proposed methods for reducing both motion and model bias, ΔBPND values within the most salient striatal subregions (putamen, caudate, nucleus accumbens) were statistically tested across motion and modeling methodologies. Frame-based and reconstruction-based motion correction were compared with a paired t-test using participants’ regional ΔBPND values fit with E-MRTM2. E-MRTM2 and DE-MRTM2 were also compared with a paired t-test using participants’ regional ΔBPND values with frame-based motion correction.
Results
Regional statistical significance
Comparing regional ΔBPND values using frame- and reconstruction-based motion correction showed no significance (p > 0.05) in caudate and nucleus accumbens and significance (p < 0.05) in putamen (Table 1). Differences between ΔBPND values fit with E-MRTM2 and DE-MRTM2 were extremely significant (p < 0.001) in putamen and nucleus accumbens, and not significant (p > 0.05) in caudate (Table 1).
Human Data. Regional ΔBPND analyzed with different methods and evaluated for statistical significance. %ΔBPND is reported with raw ΔBPND in parentheses.
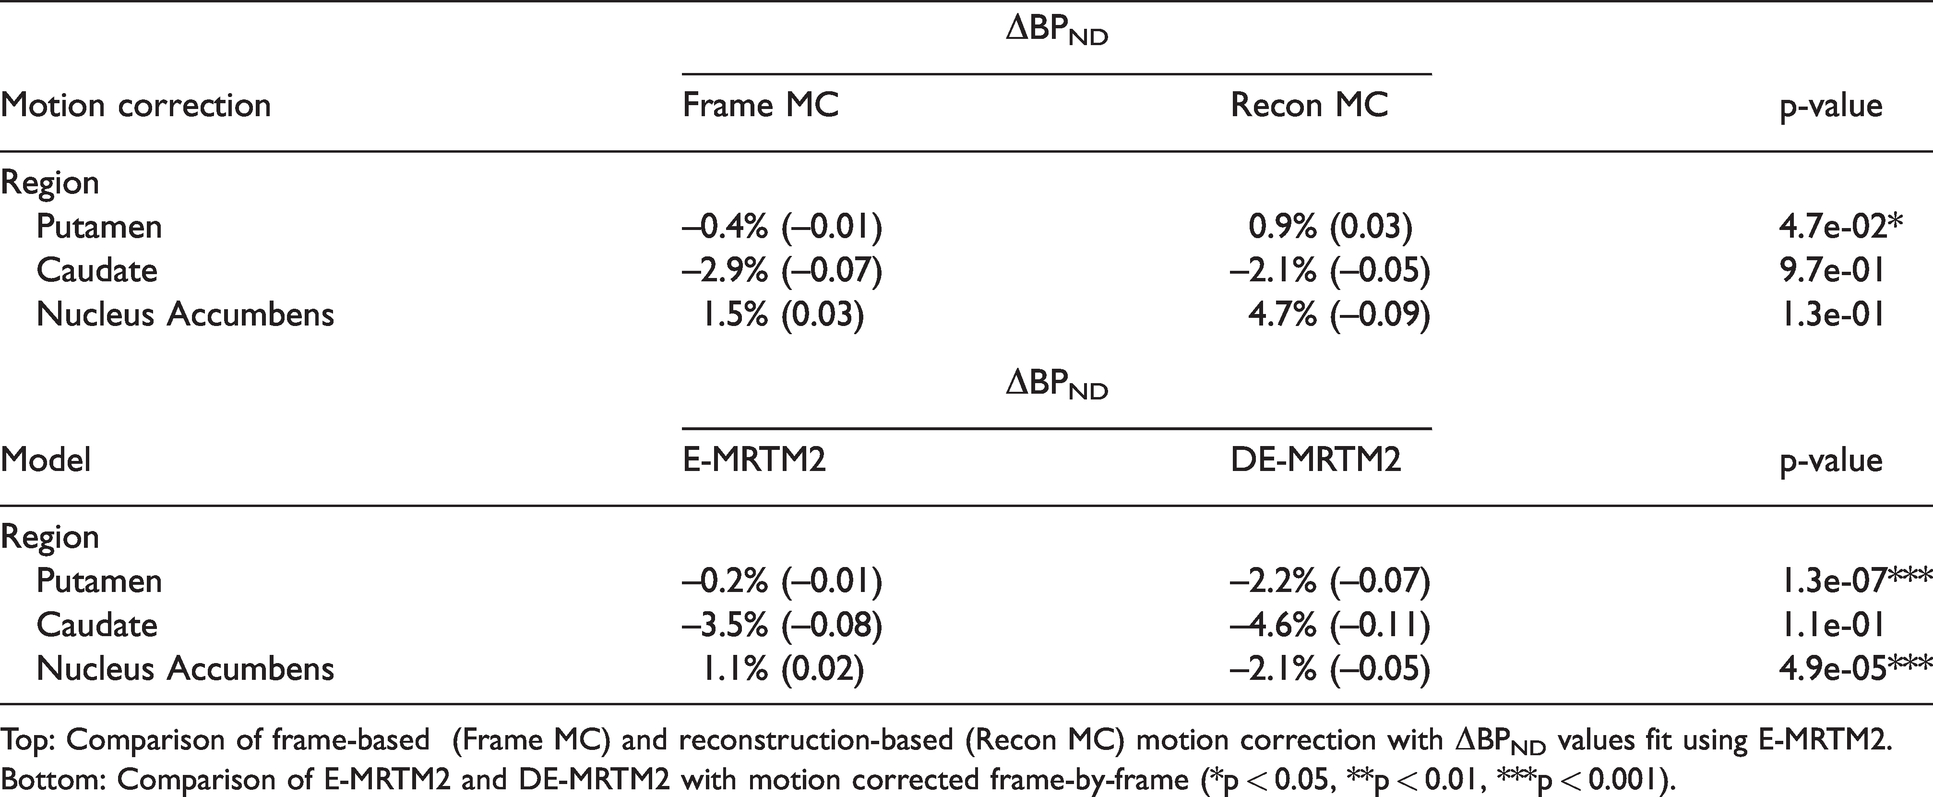
Top: Comparison of frame-based (Frame MC) and reconstruction-based (Recon MC) motion correction with ΔBPND values fit using E-MRTM2. Bottom: Comparison of E-MRTM2 and DE-MRTM2 with motion corrected frame-by-frame (*p < 0.05, **p < 0.01, ***p < 0.001).
Motion bias
The top row of Figure 2 demonstrates how important motion correction can be for the accuracy of ΔBPND maps when participant motion is high (n = 10). Even averaged across participants, motion causes a bias pattern in the ΔBPND map consistent with a rigid displacement of the head over time. With frame-based motion correction, striatal ΔBPND in the voxel map changes from 9.7% to −3.5%. An extended version of the top row of Figure 2, including the low motion group and reconstruction-based motion correction, can be found in Figure S4.
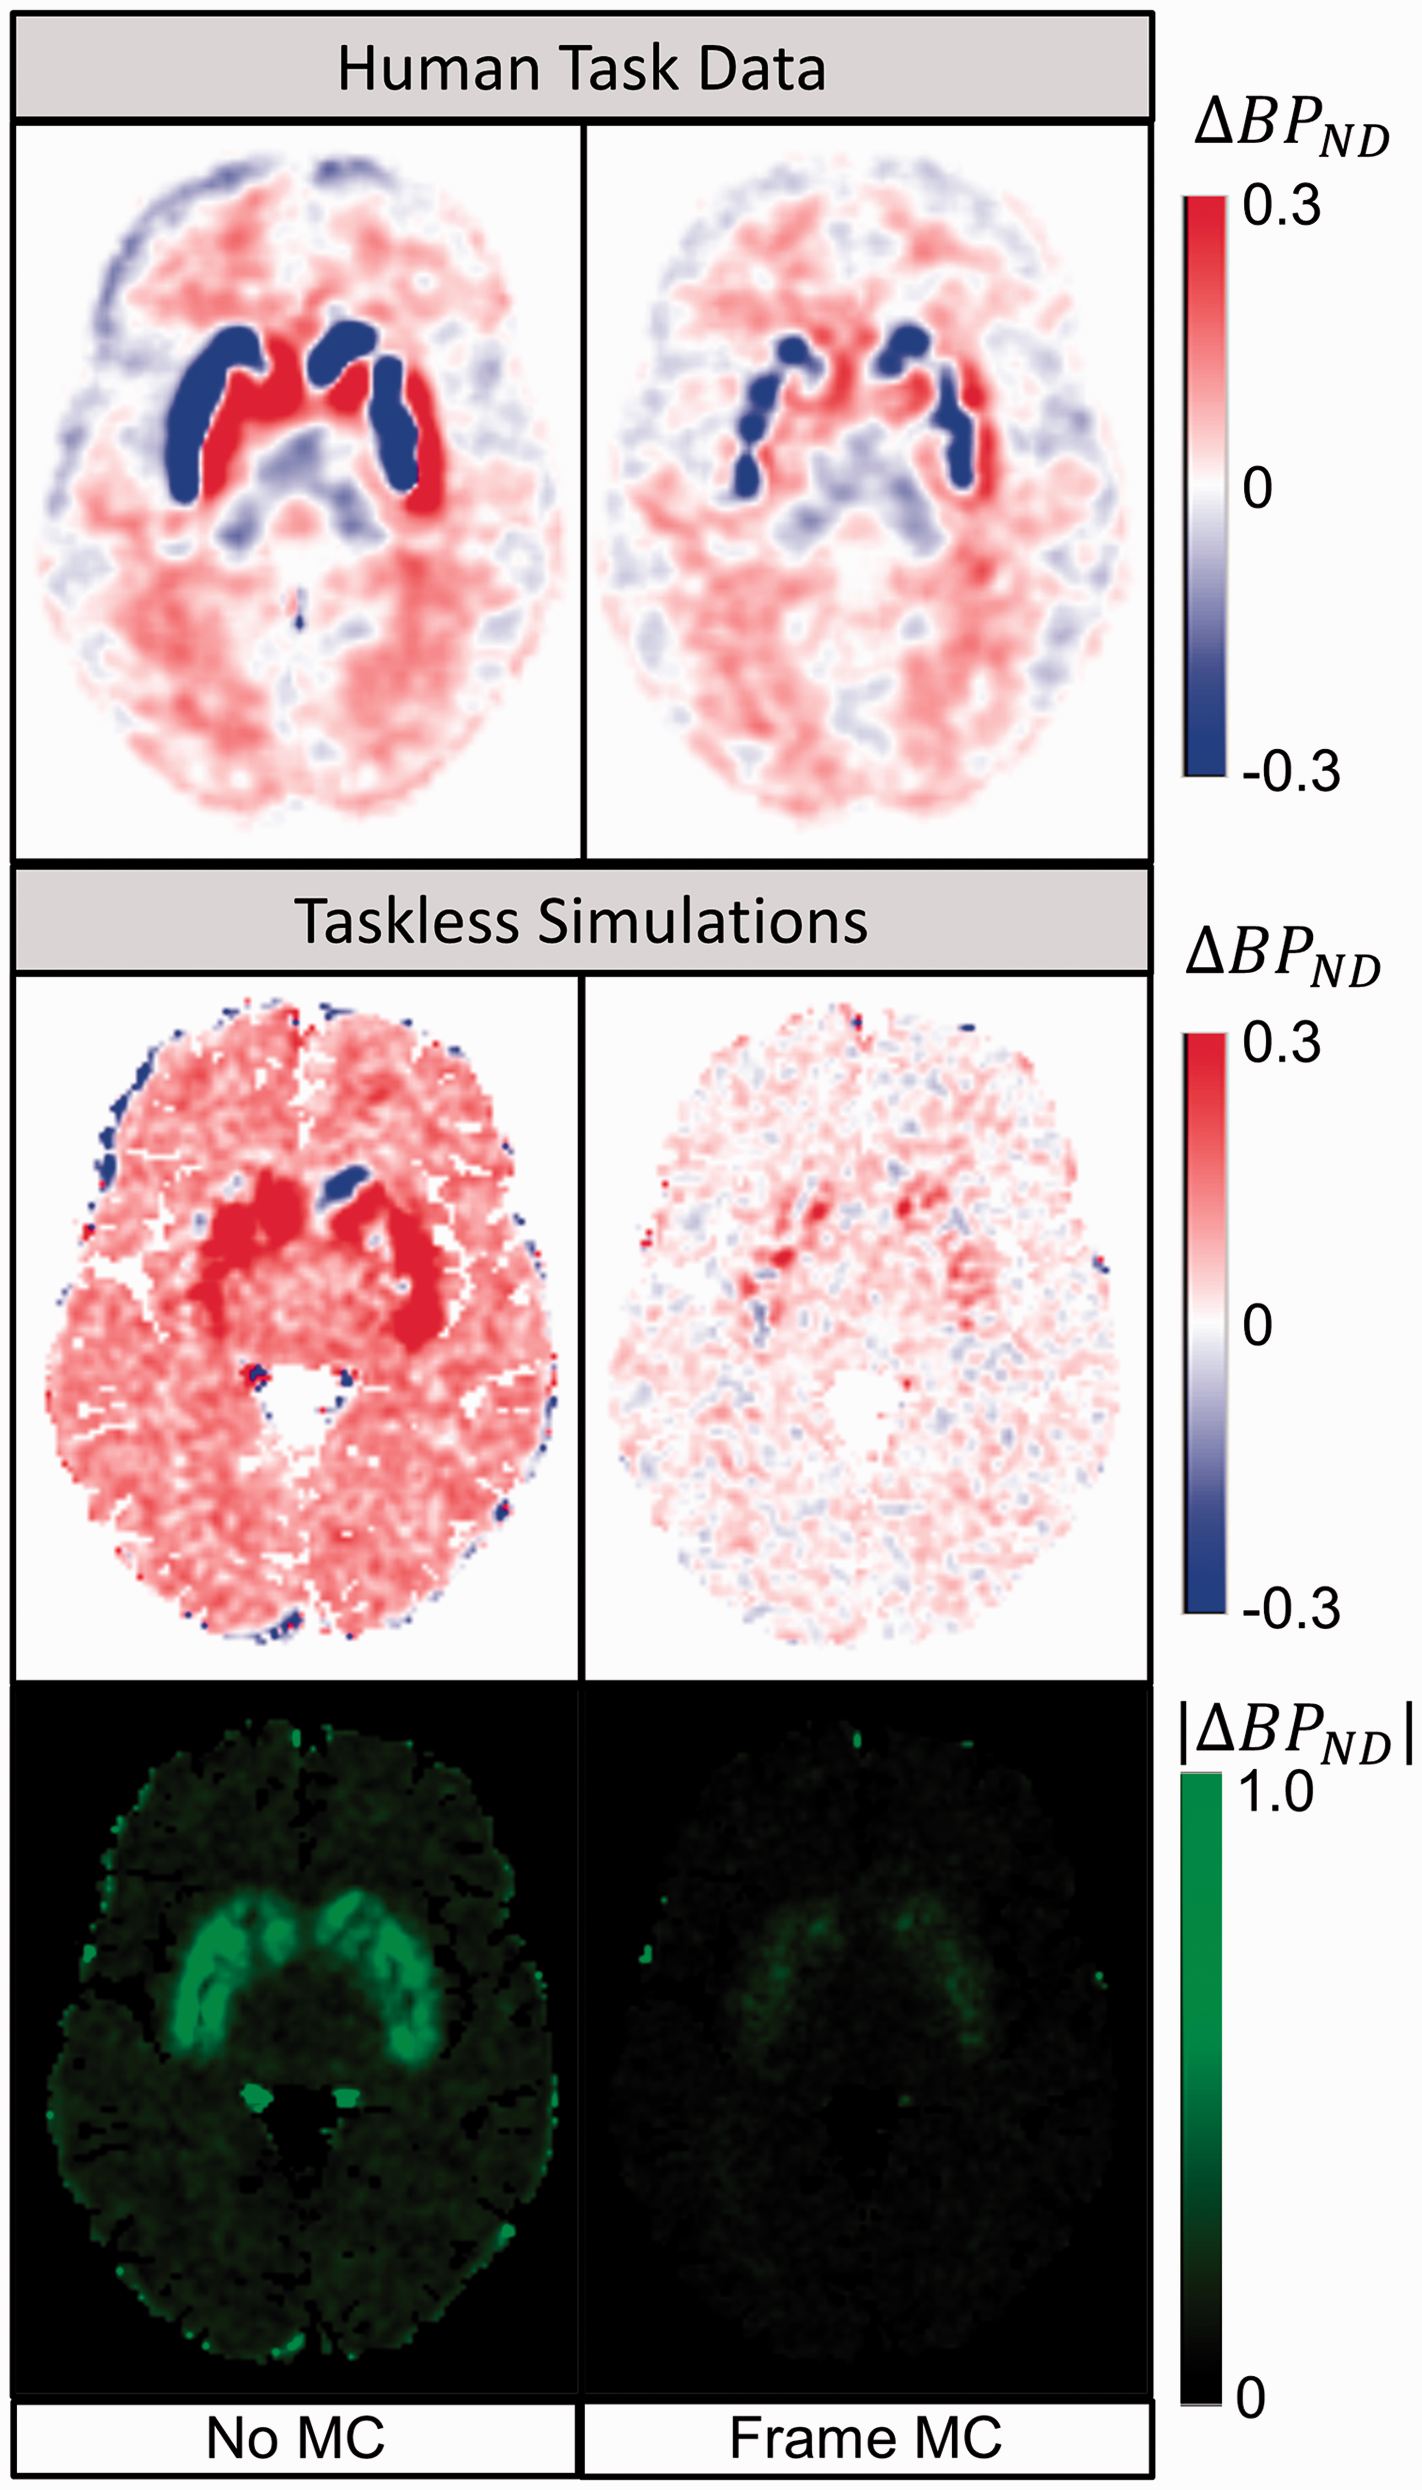
Motion Bias and Correction (
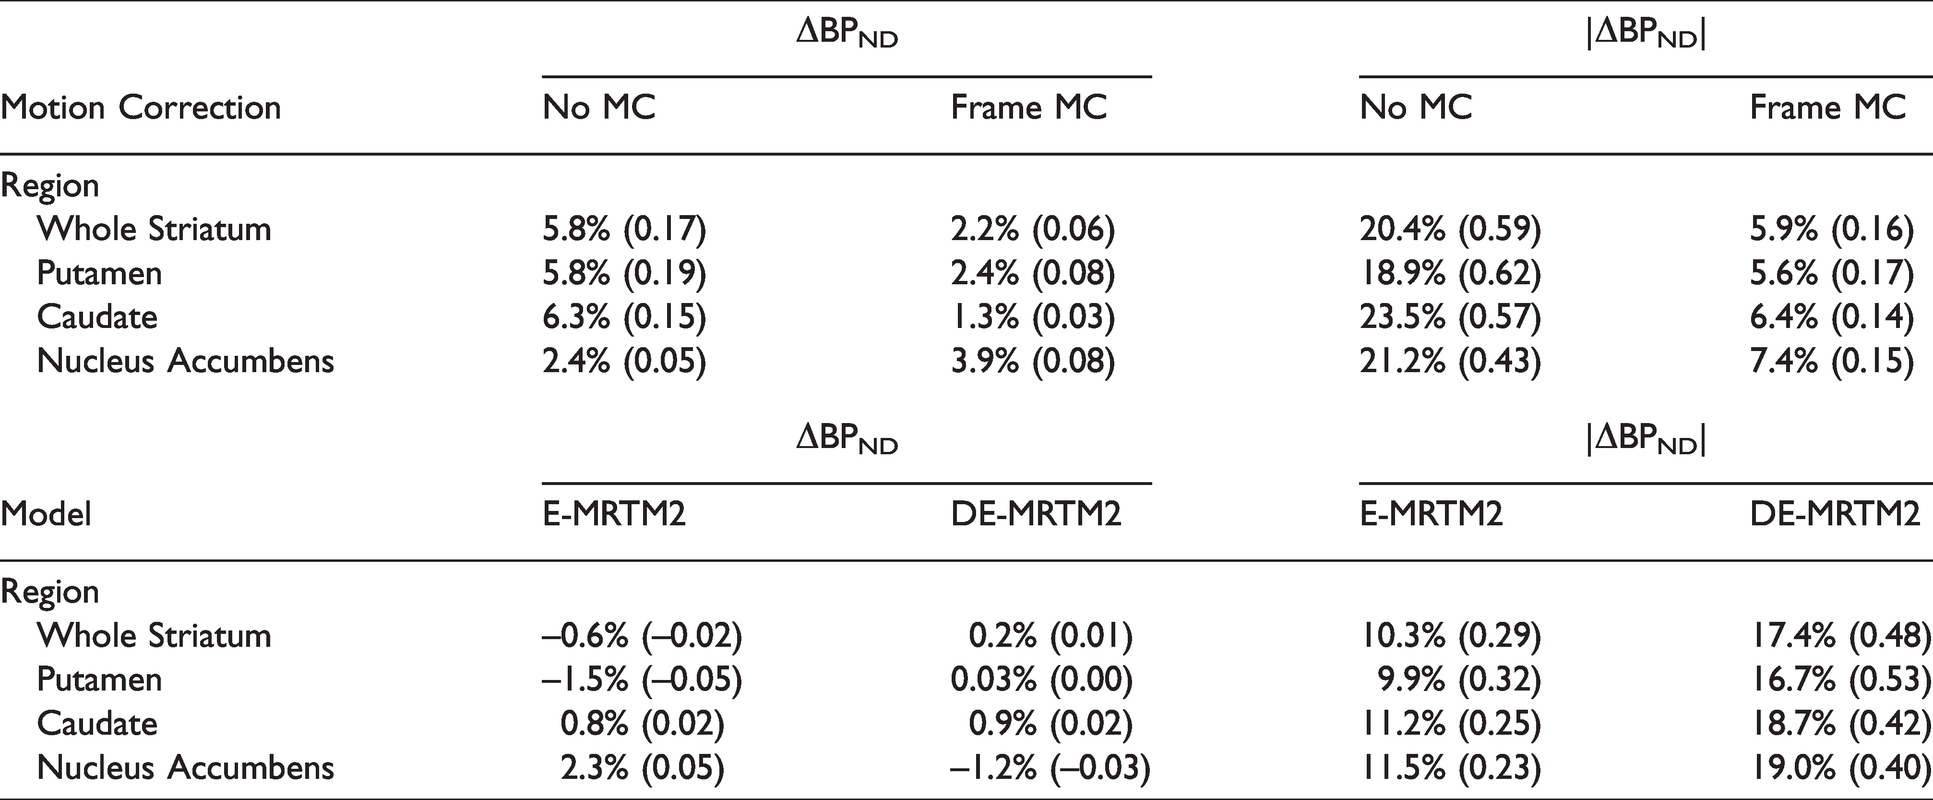
The simulations in the bottom panels of Figure 2 examine the same application of frame-based motion correction in the context of a known ground truth to quantify the extent of the bias present before and after motion correction. With no simulated challenge, all the measured change in BPND can be attributed to bias. After frame-based motion correction, striatal bias in ΔBPND was reduced from 5.8% to 2.2% (Table 2). With both positive and negative motion bias apparent at the voxel level, absolute bias values were taken at the regional level to capture the variance present in the bias maps. After frame-based motion correction, the absolute value of the total motion bias in striatal ΔBPND changed from 0.59 to 0.16 (a decrease in the spatial variance of motion bias of 72.9%). This equates to 20.4% average error in absolute occupancy (|%ΔBPND|) in striatum before frame-based motion correction and 5.9% average error afterward (Table 2). For comparison, putamen RAC BPND has been shown to have a standard deviation of 10% in test-retest evaluations. 46
Model bias
To find an appropriate time for ending the uptake period (
The top row of Figure 3 shows the effect of applying DE-MRTM2 to the acquired task-reward data. Median averaging across participants was applied to parametric maps of ΔBPND, reducing the influence of spurious outlier voxels. While the regional ΔBPND values in the striatum remain similar (E-MRTM2: −3.1%, DE-MRTM2: −3.3%), differences can be observed in the surrounding areas. Specifically, the “halo” of positive values around the striatum becomes less spatially distinct, and positive and negative ΔBPND values are no longer strongly associated with white and gray matter respectively.
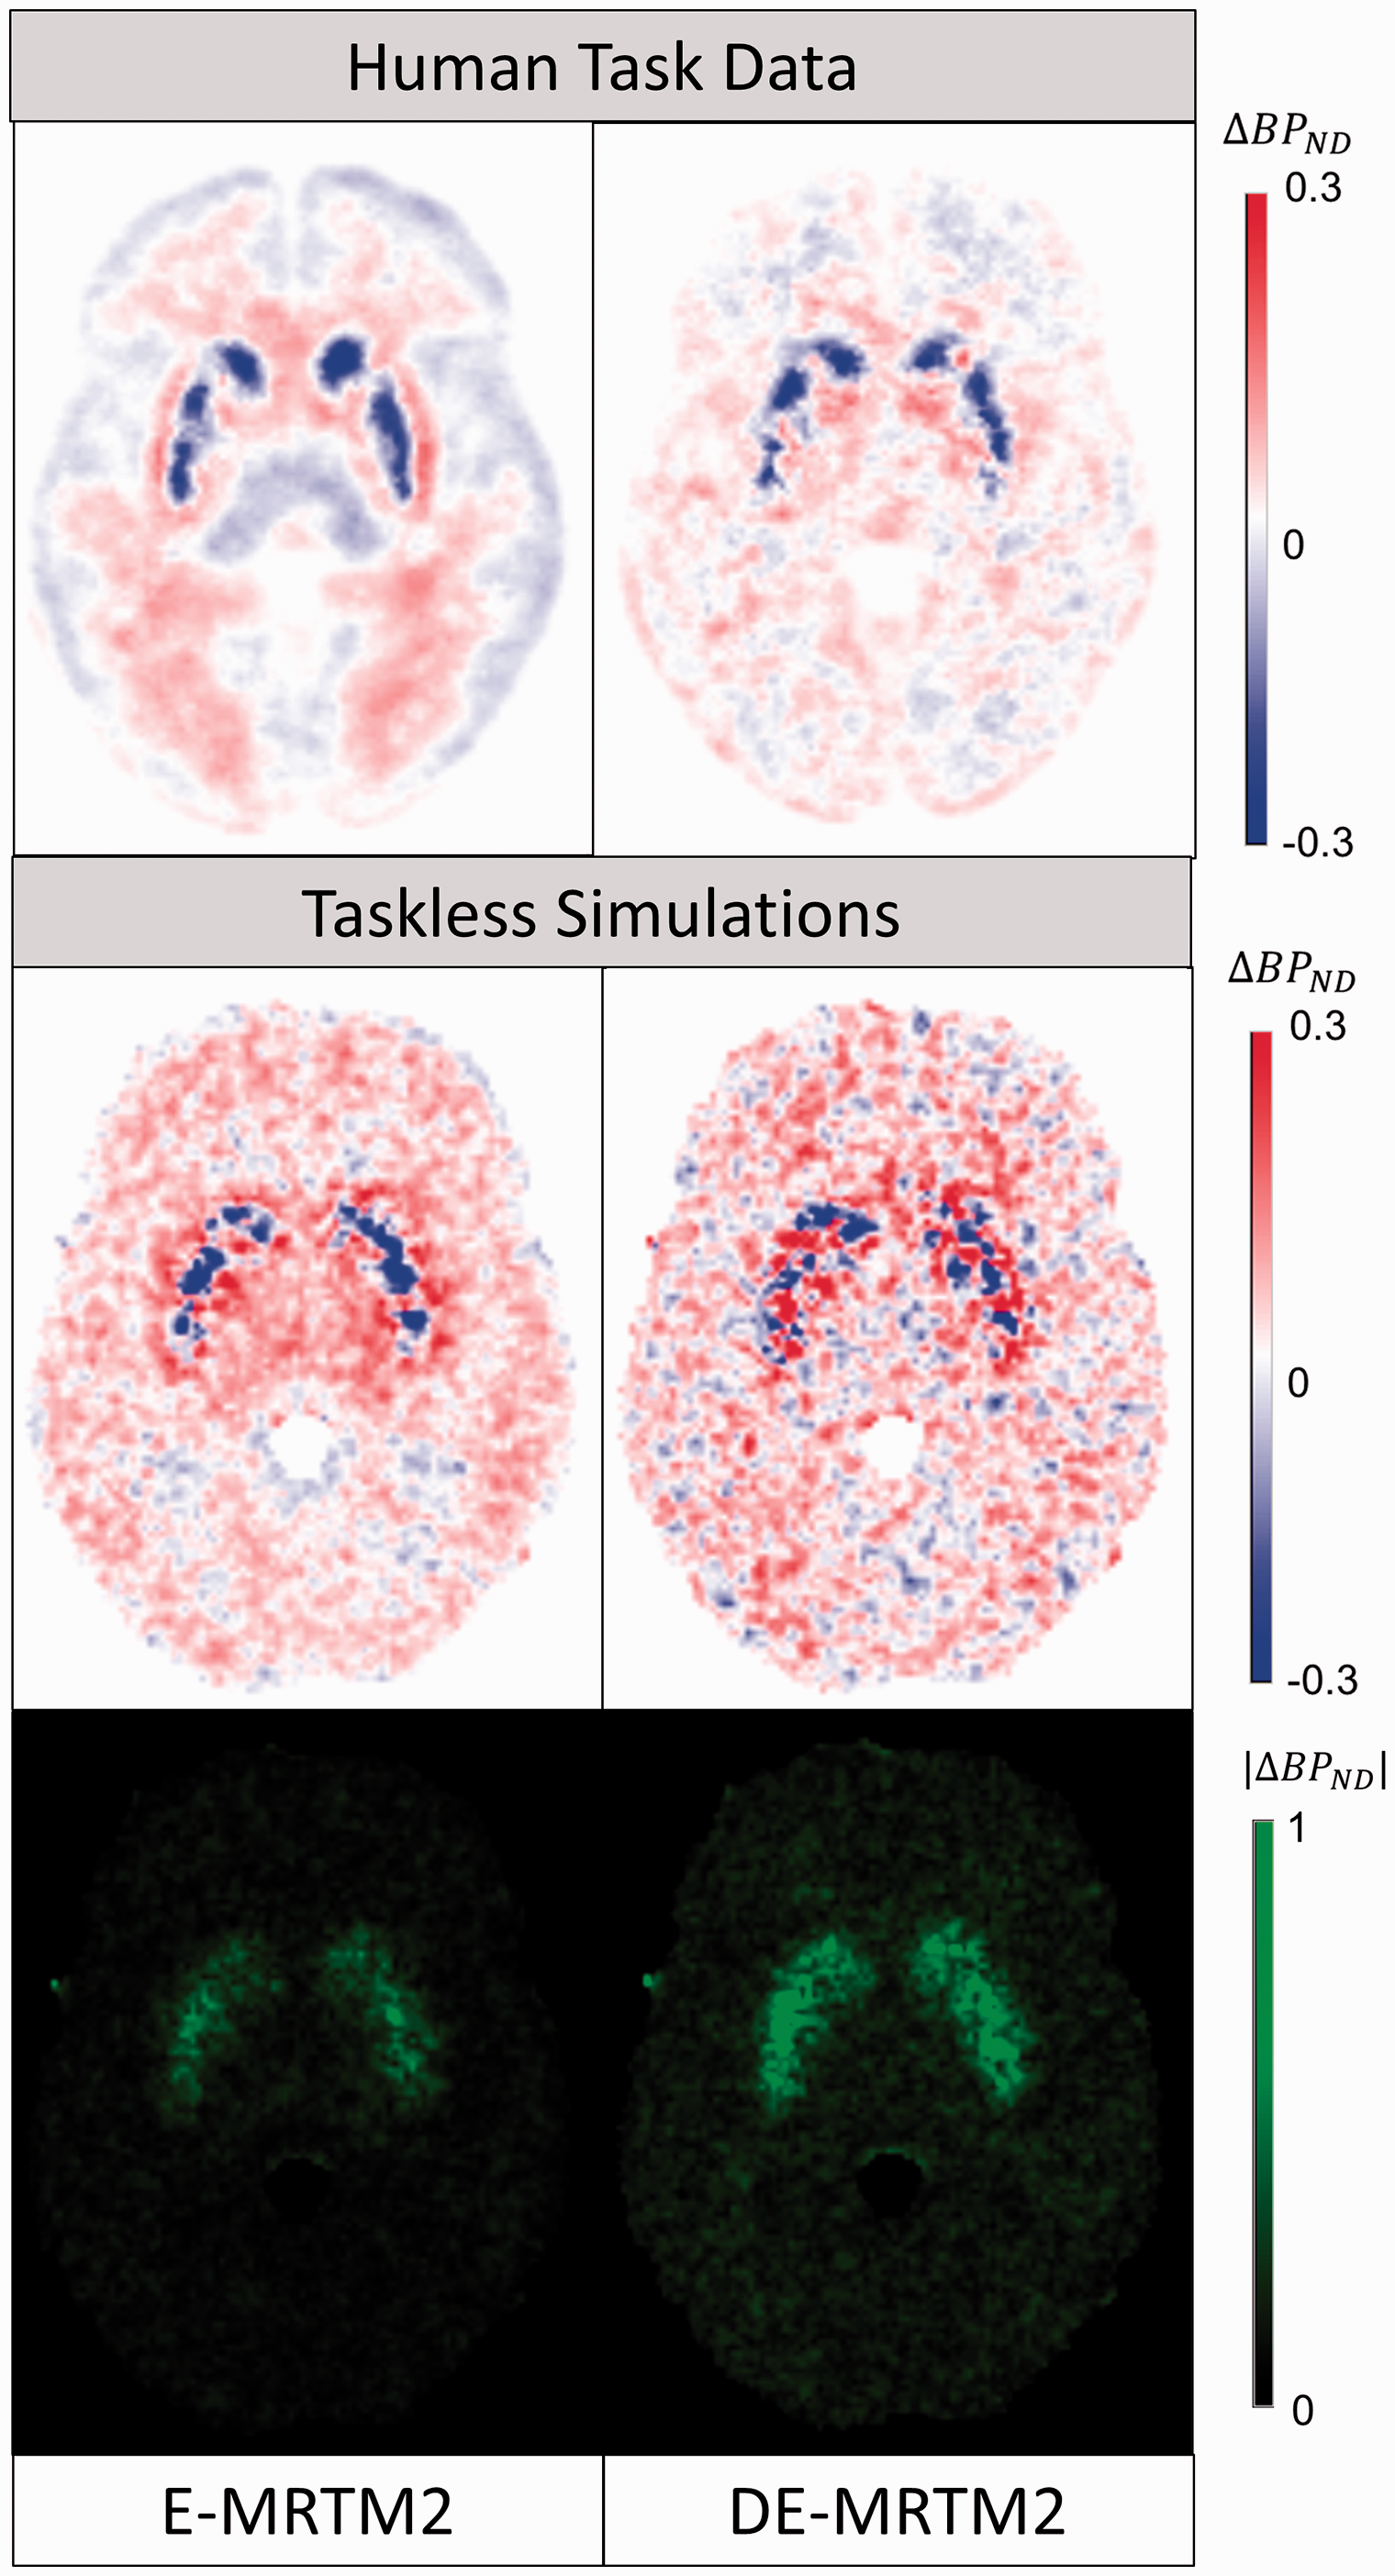
Model Bias and Correction (
Similar spatial effects can be observed in the simulated ΔBPND maps averaged across noise realizations (n = 10) in the lower half of Figure 3. Positive bias around the edges of the striatum is mitigated and extrastriatal bias becomes more balanced. Within the striatum, ΔBPND bias changes modestly (from −0.6% to 0.2%) after deweighting. However, striatal variance in absolute ΔBPND bias (|ΔBPND|) increases from 0.29 to 0.48 (an increase in the spatial variance of model bias of 65.5%) (Table 2). Another way to interpret this effect is by examining histograms of ΔBPND voxels within the striatum (Figure S6). The histogram of striatal voxels fit with E-MRTM2 has a standard deviation of 0.17 and a skewness of -0.78, while the histogram of striatal voxels fit with DE-MRTM2 has a standard deviation of 0.23 and a skewness of −0.25.
Figure 4 shows the relationship between DE-MRTM2 and the selection of k2′ in the context of a representative participant data set. The E-MRTM2 ΔBPND fits are highly dependent on the value of k2′ fixed prior to analysis. The conventional method for selecting the value of k2′ (MRTM fit to a high binding region like putamen) 31 produces ΔBPND maps that are most similar to DE-MRTM2—albeit with some dependence on the average level of BPND used for the calibration—while setting the value of k2′ either too high or too low causes higher and lower estimates of ΔBPND respectively. DE-MRTM2 however, produces consistent ΔBPND maps independent of the selection of k2′.
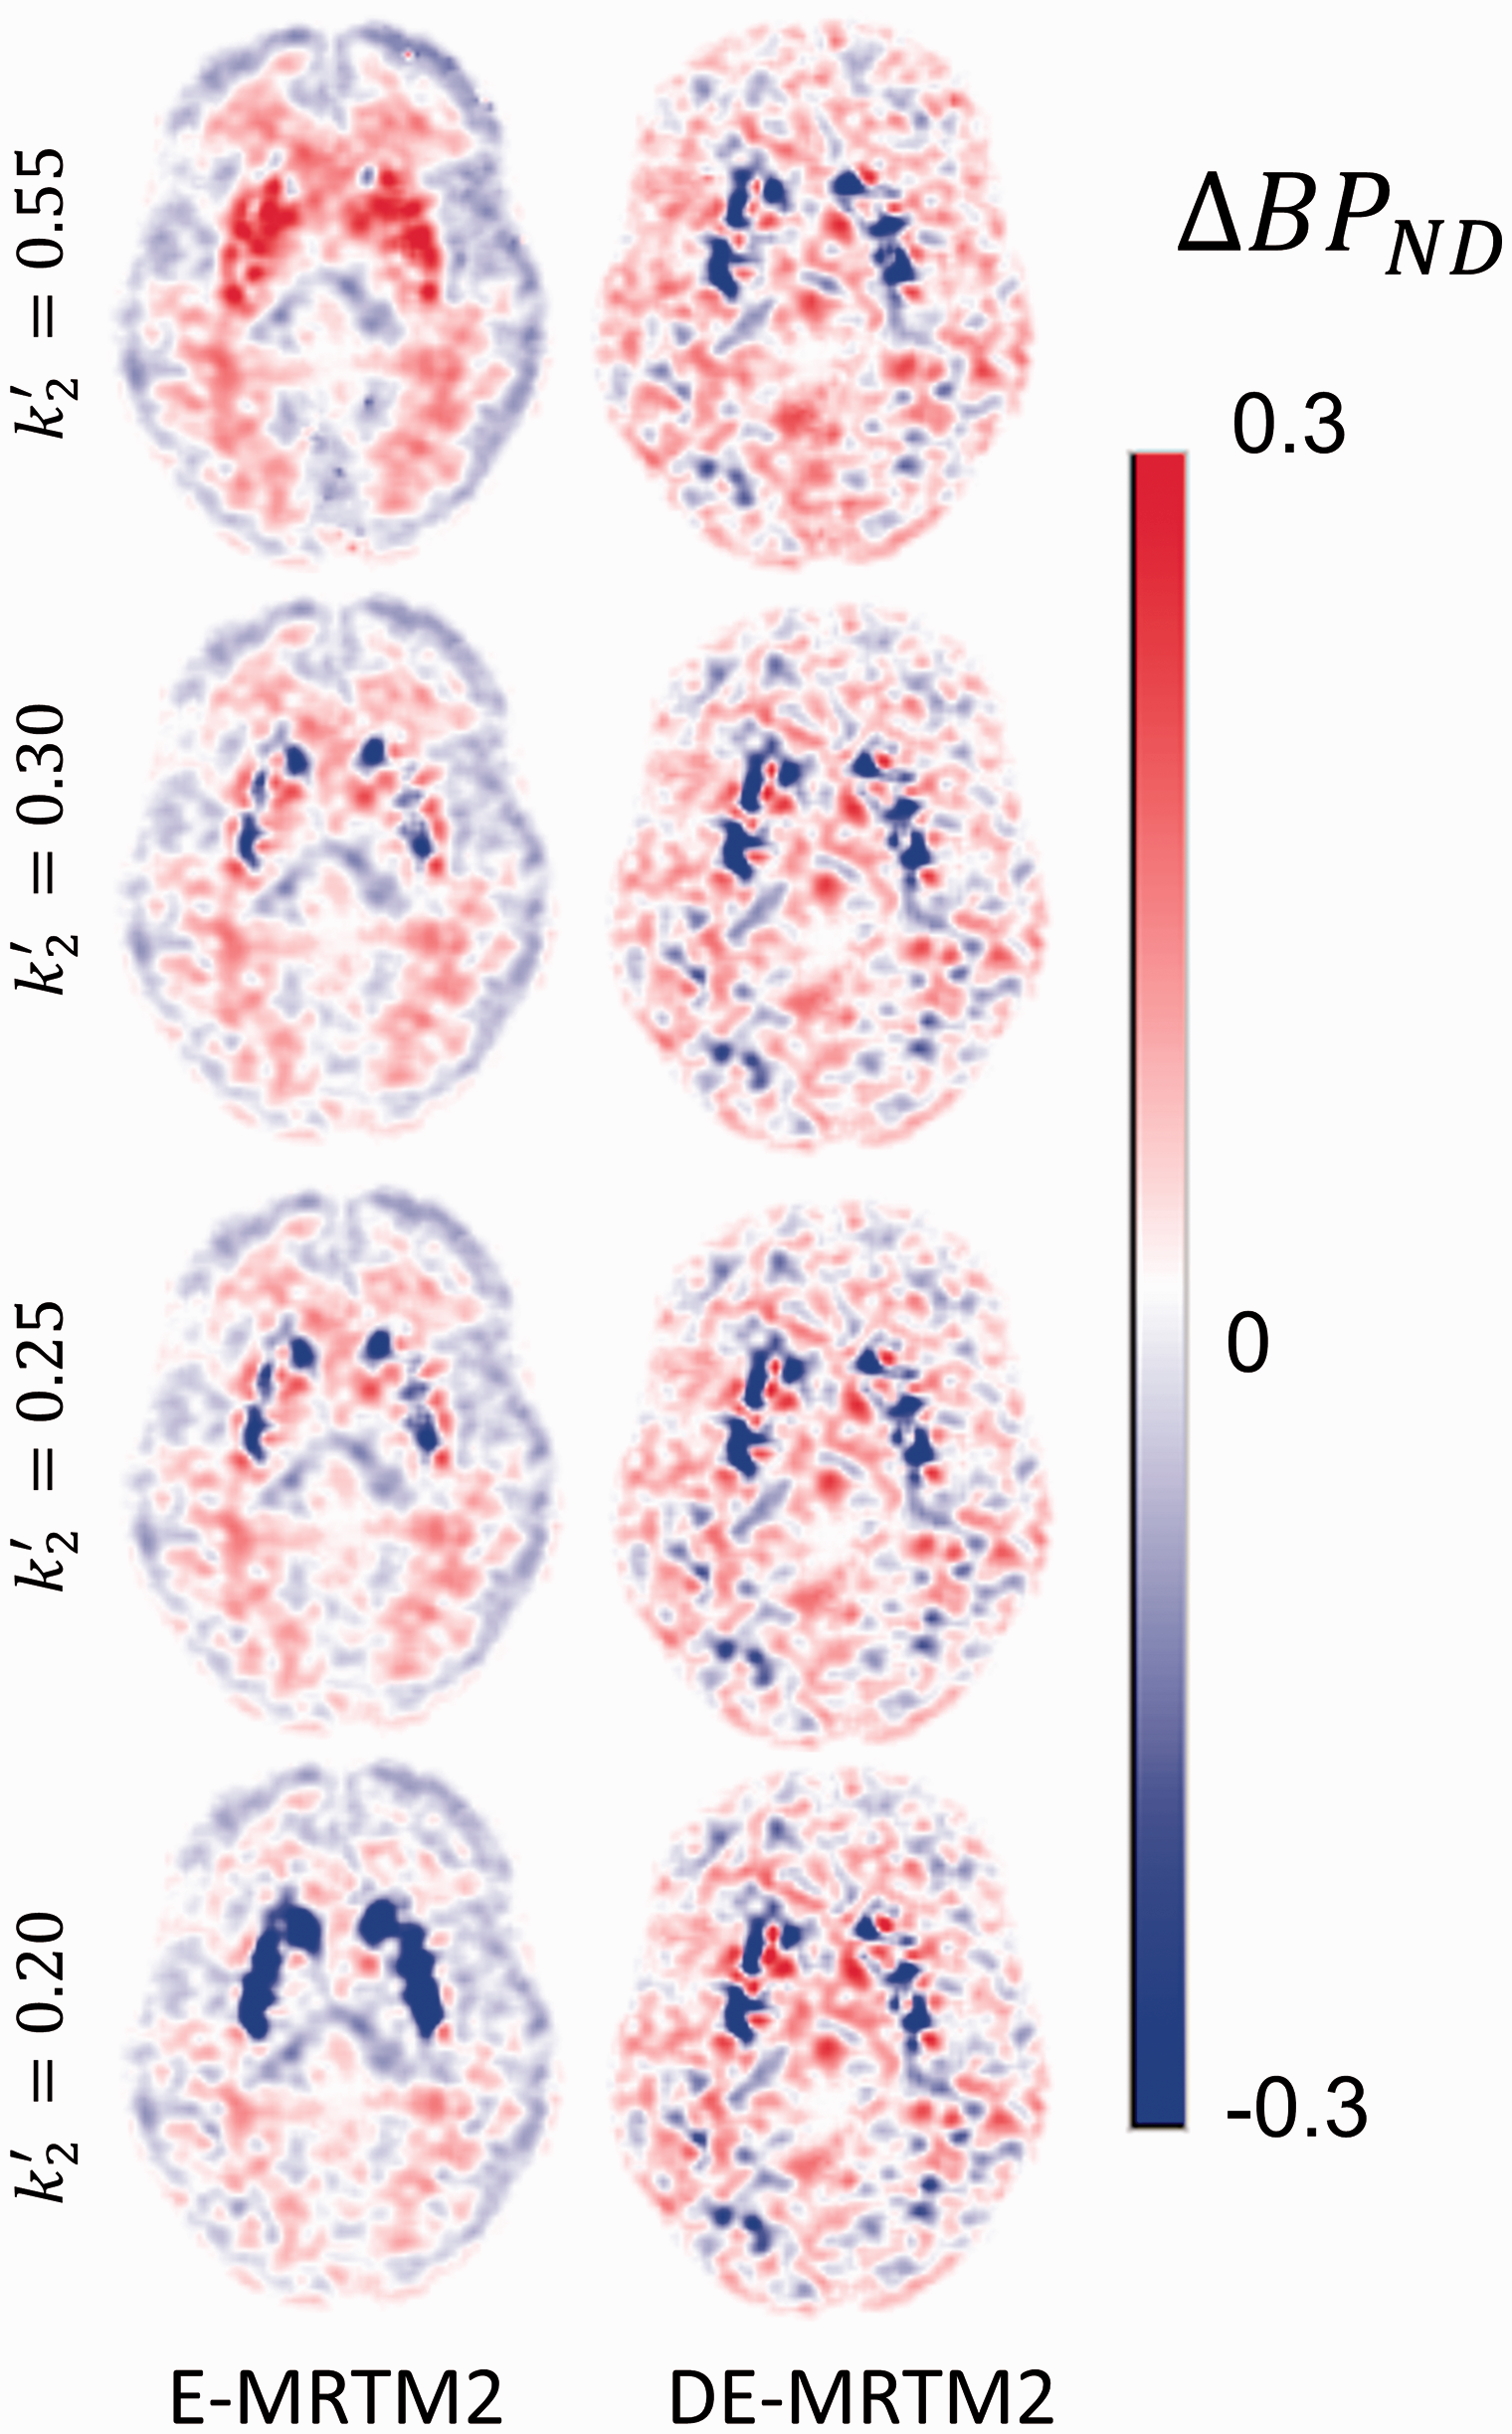
Effect of debiasing at different levels of k2′. E-MRTM2 estimates of ΔBPND are highly dependent on k2′ selection, while DE-MRTM2 estimates of ΔBPND are not. Each row selects k2′ using a different method: k2′ = 0.55, estimated from blood plasma fits in control data set. k2′ = 0.30, estimated from MRTM fits of top 10% of striatum voxels by BPND. k2′ = 0.25, estimated from MRTM fit to regional putamen TAC. k2′ = 0.20, estimated from MRTM fits of bottom 10% of striatum voxels by BPND.
Comparing motion and model bias
Figure 5 compares the relative effects of high motion bias and model bias at different levels of task response. Independent of the task magnitude, bias in whole striatum ΔBPND ranges from 0.5% to 5%, while in the nucleus accumbens subregion, it can range from 2% to 12%. Examining the absolute value bias maps in the bottom half of Figure 5, as task response increases, model bias increases only slightly and motion bias decreases only slightly. When there is no task response (0%), motion accounts for 63% of the bias effect in the striatum (model bias: 37%). At high magnitudes of task response (20%) however, motion bias contributes 50% of the observed effect (model bias: 50%).
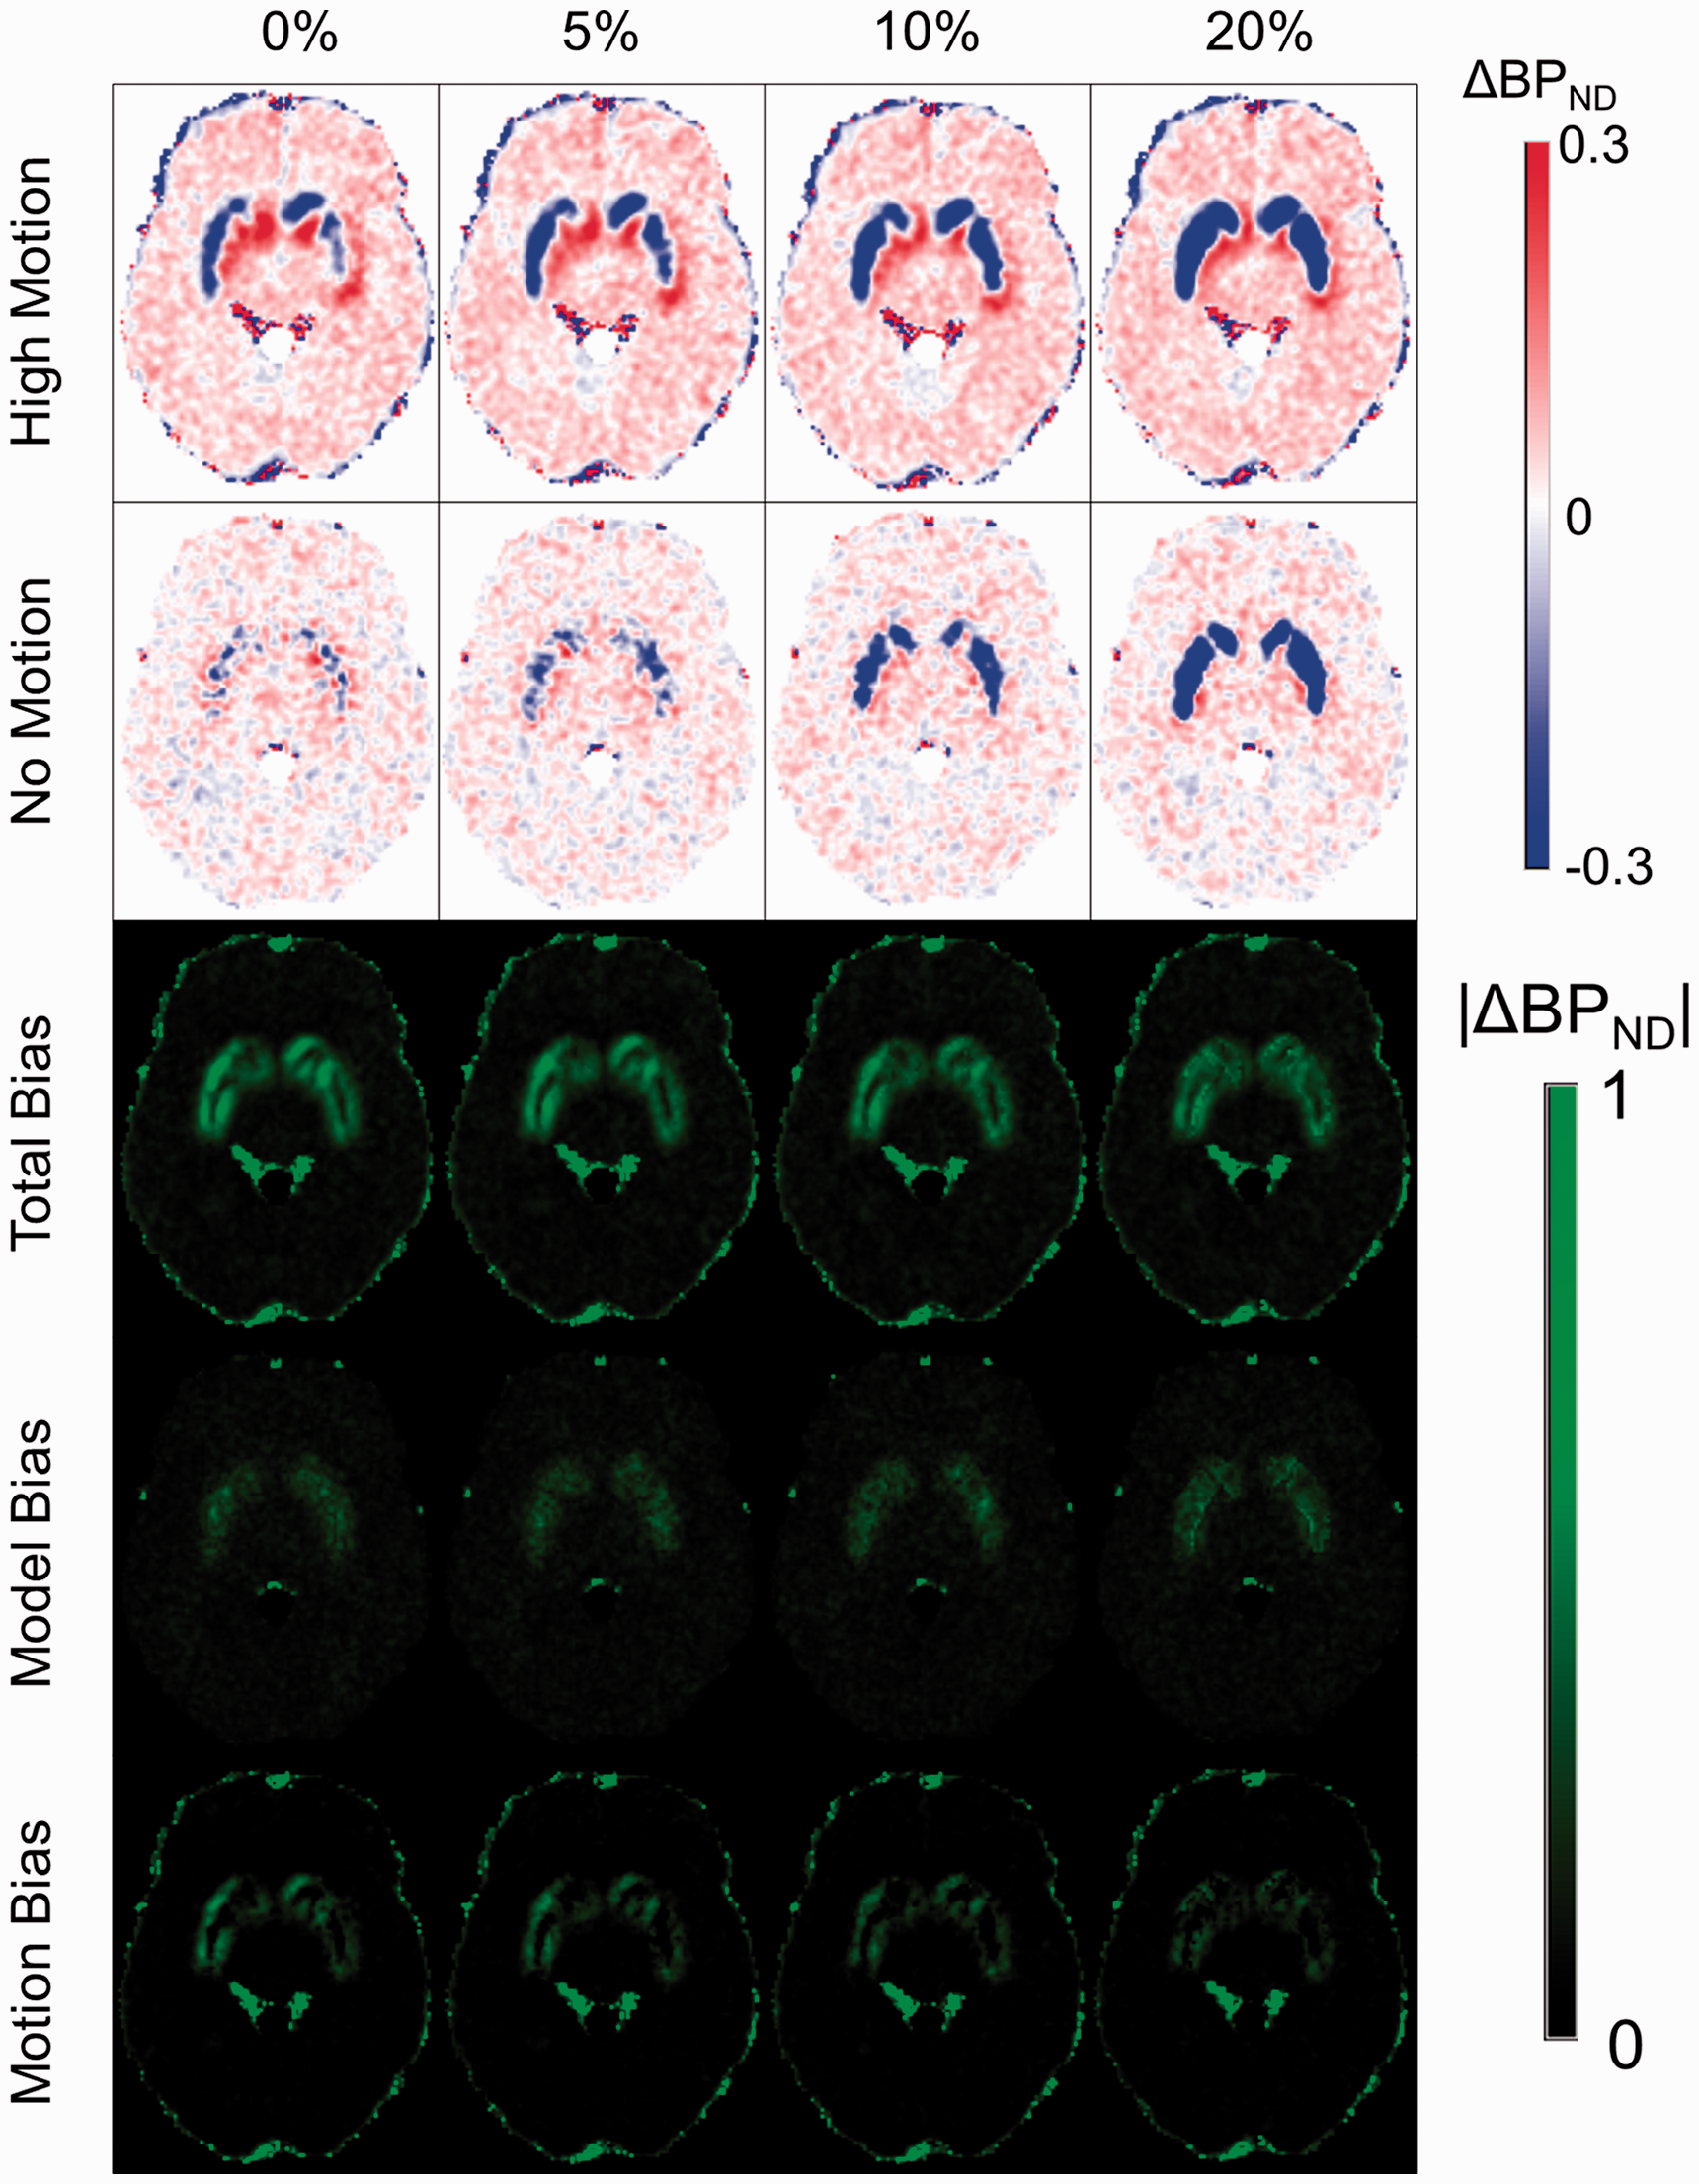
Simulations to compare motion and model bias in ΔBPND. Each column depicts the simulation of a different level of challenge response in terms of change in BPND. The top two rows depict the ΔBPND levels in high motion and motionless simulations respectively. The bottom three rows show the absolute value of the error in ΔBPND after accounting for the simulated response magnitude for each column. Total bias is derived from the high motion simulations, model bias from the motionless simulations, and motion bias from the difference between them.
Discussion
An examination of motion bias and model bias has been presented in the context of an intra-scan behavioral challenge response paradigm. Motion was shown to cause a bias pattern of large adjacent positive and negative regions, while model bias was shown to cause a spatial bias pattern dependent on BPND. Frame-based motion correction decreased ΔBPND bias globally while also decreasing its variance as shown by |ΔBPND|. DE-MRTM2 removed the dependence of ΔBPND on first-pass selection of k2′ and rebalanced the spatial distribution of positive and negative ΔBPND bias in exchange for increased variance in ΔBPND bias as shown by |ΔBPND|. Both sources of bias remained relatively consistent as simulated task response increased.
Frame-based motion correction is considered the standard in the field, making its favorable impact on ΔBPND bias unsurprising. The alternative that was considered here, reconstruction-based motion correction, did not considerably improve performance relative to standard frame-based motion correction. Although statistical significance between the two methods was observed in putamen, this difference achieved far less significance than the impact of DE-MRTM2 and would not have appeared significant if ‘no motion correction’ had been included in the statistical comparison. ‘No motion correction’ was excluded from the formal statistical test because the differences it produced in ΔBPND, relative to either motion correction method, were both clear (Figure 2) and expected. While more advanced motion-correction did not provide a clear benefit to the quantification of ΔBPND in this study, it might be better utilized in others that require finer temporal resolution.25,27,47
One of the clearest benefits of DE-MRTM2 is markedly reducing the contingency of first-pass global k2′ selection, which can vary depending on precisely which regions are included in the initial ‘high-binding’ fit. Reduction of 3-parameter MRTM to 2-parameter MRTM2 by fixing k2′ 30 is necessary because E-MRTM fits of ΔBPND yield far noisier parametric maps and corresponding increases in the variance of regional fits. In our previous work, we observed that fixing k4 to the optimal value resulted in both a decoupling of the correlation between BPND and k2′ and a reduction in BPND bias. 22 By fitting estimates of BPND and ΔBPND only after the end of the initial uptake period (tD), we were able to mitigate the bias introduced by the selection of k2′ even when using a single-compartment model.
The other benefit of DE-MRTM2 is a reduction in bias by rebalancing the distribution of voxels with positive and negative bias. It does, however, come with an increase in |ΔBPND|, evoking the familiar noise/bias tradeoff. This is best illustrated by Figure S6, where DE-MRTM2 increases the standard deviation of the histogram but decreases the skewness relative to E-MRTM2. This increase in variance could potentially be mitigated in future studies by setting the task start time later. In this work, we used a tD of 27 min and a task start time of 40 min, allowing only 13 min for the estimation of BPND before starting to fit ΔBPND. A more even balance between the baseline and task phases of the scan could lead to more robust parametric estimates of ΔBPND.
Finally, it is useful to consider the impacts of motion and model bias in the context of informed estimates of the dopamine-induced displacement due to challenge. Here, the total measured change in regional BPND was less than 5% (Table 1), and simulations estimated that unmitigated motion and model biases can be around 3% and 1% respectively (Table 2). As positive and negative biases can counteract one another within a given region, Figure 5 uses absolute values to examine the magnitude of motion and model bias relative to one another and as simulated task response increases. Motion accounts for a greater proportion of the absolute bias at low task response rates, while motion and model bias contribute equally at high task response rates. The difference between the two bias effects lies more in their skews and spatial distributions than their overall magnitudes. Also of note is that the total bias is relatively consistent and even decreases slightly as task response increases. These observations—that motion and model bias produce comparable errors that are only weakly dependent on the simulated magnitude of displacement—underscore the notion that sources of bias pose a greater challenge when the elicited task-response effect is small.
Our study had several limitations. The results presented here are specific to RAC and to the context of an intra-scan task challenge paradigm. Pharmacological challenges administered within-scan that produce larger responses may be amenable to more complex models capable of observing greater temporal detail in the responses. 8 Models fit to data acquired using slower tracers may be more greatly impacted by bias arising from the violation of the fast-exchange assumption between the specific and non-displacable compartments, which is dependent upon the value of k4. Tracers that exhibit more non-specific binding, receptor internalization, specific binding in the reference region, or signal attributable to blood volume may be more biased by those sources 21 than by the discrepancy between one and two compartment configurations. We have also limited the scope of our inquiry to motion and model bias specifically and have not considered other potential sources of bias that may have as great an impact, such as bias arising from the PET reconstruction or from attenuation-emission mismatch. Another limitation of our debiasing model is that it may not easily generalize to other behavioral RAC studies, which employ smaller subject cohorts. DE-MRTM2 accepts the trade-off of additional variance in its ΔBPND maps in order to better balance positive and negative biases. For reference, a one-sample t-test power calculation (R v3.6.1) 48 based on the data analyzed here suggests that, at a significance level of α = 0.05 and a power level of β = 0.80, in order to detect a 5% change in putamen BPND, E-MRTM2 (µ0 ΔBPND = 0, µ1 ΔBPND = 0.1600, σ ΔBPND = 0.0666) would require 4 participants and DE-MRTM2 (µ0 ΔBPND = 0, µ1 ΔBPND = 0.1609, σ ΔBPND = 0.1469) would require 9 participants. Likewise, the smaller nucleus accumbens would require 9 participants for E-MRTM2 and 19 participants for DE-MRTM2. For comparison, Martin-Soelch et al. 10 scanned 24 participants and observed a 5.6% decrease in BPND in right ventral striatum using the equilibrium method. Studies with a low participant count, lower dose, or a bolus-only infusion paradigm may not be able to accept greater noise without sacrificing detectability of the signal. We have also not yet evaluated the debiasing capacity of DE-MRTM2 in the context of other potentially applicable models such as rFRTM22 or forward-model implementations.
In conclusion, the effects of motion bias and model bias on behavioral task response have been investigated and characterized in the context of an intrascan RAC fMRI challenge study, and methods have been proposed to mitigate the negative effects of each. For motion correction, frame-to-frame correction performed as well as a more complex reconstruction-based method. For model selection, DE-MRTM2 both decoupled ΔBPND bias from first-pass k2′ estimation and rebalanced its spatial distribution.
Supplemental Material
sj-pdf-1-jcb-10.1177_0271678X221078616 - Supplemental material for Assessment of motion and model bias on the detection of dopamine response to behavioral challenge
Supplemental material, sj-pdf-1-jcb-10.1177_0271678X221078616 for Assessment of motion and model bias on the detection of dopamine response to behavioral challenge by Michael A Levine, Joseph B Mandeville, Finnegan Calabro, David Izquierdo-Garcia, Daniel B Chonde, Kevin T Chen, Inki Hong, Julie C Price, Beatriz Luna and Ciprian Catana in Journal of Cerebral Blood Flow & Metabolism
Supplemental Material
sj-pdf-2-jcb-10.1177_0271678X221078616 - Supplemental material for Assessment of motion and model bias on the detection of dopamine response to behavioral challenge
Supplemental material, sj-pdf-2-jcb-10.1177_0271678X221078616 for Assessment of motion and model bias on the detection of dopamine response to behavioral challenge by Michael A Levine, Joseph B Mandeville, Finnegan Calabro, David Izquierdo-Garcia, Daniel B Chonde, Kevin T Chen, Inki Hong, Julie C Price, Beatriz Luna and Ciprian Catana in Journal of Cerebral Blood Flow & Metabolism
Supplemental Material
sj-pdf-3-jcb-10.1177_0271678X221078616 - Supplemental material for Assessment of motion and model bias on the detection of dopamine response to behavioral challenge
Supplemental material, sj-pdf-3-jcb-10.1177_0271678X221078616 for Assessment of motion and model bias on the detection of dopamine response to behavioral challenge by Michael A Levine, Joseph B Mandeville, Finnegan Calabro, David Izquierdo-Garcia, Daniel B Chonde, Kevin T Chen, Inki Hong, Julie C Price, Beatriz Luna and Ciprian Catana in Journal of Cerebral Blood Flow & Metabolism
Supplemental Material
sj-pdf-4-jcb-10.1177_0271678X221078616 - Supplemental material for Assessment of motion and model bias on the detection of dopamine response to behavioral challenge
Supplemental material, sj-pdf-4-jcb-10.1177_0271678X221078616 for Assessment of motion and model bias on the detection of dopamine response to behavioral challenge by Michael A Levine, Joseph B Mandeville, Finnegan Calabro, David Izquierdo-Garcia, Daniel B Chonde, Kevin T Chen, Inki Hong, Julie C Price, Beatriz Luna and Ciprian Catana in Journal of Cerebral Blood Flow & Metabolism
Supplemental Material
sj-pdf-5-jcb-10.1177_0271678X221078616 - Supplemental material for Assessment of motion and model bias on the detection of dopamine response to behavioral challenge
Supplemental material, sj-pdf-5-jcb-10.1177_0271678X221078616 for Assessment of motion and model bias on the detection of dopamine response to behavioral challenge by Michael A Levine, Joseph B Mandeville, Finnegan Calabro, David Izquierdo-Garcia, Daniel B Chonde, Kevin T Chen, Inki Hong, Julie C Price, Beatriz Luna and Ciprian Catana in Journal of Cerebral Blood Flow & Metabolism
Supplemental Material
sj-pdf-6-jcb-10.1177_0271678X221078616 - Supplemental material for Assessment of motion and model bias on the detection of dopamine response to behavioral challenge
Supplemental material, sj-pdf-6-jcb-10.1177_0271678X221078616 for Assessment of motion and model bias on the detection of dopamine response to behavioral challenge by Michael A Levine, Joseph B Mandeville, Finnegan Calabro, David Izquierdo-Garcia, Daniel B Chonde, Kevin T Chen, Inki Hong, Julie C Price, Beatriz Luna and Ciprian Catana in Journal of Cerebral Blood Flow & Metabolism
Supplemental Material
sj-pdf-7-jcb-10.1177_0271678X221078616 - Supplemental material for Assessment of motion and model bias on the detection of dopamine response to behavioral challenge
Supplemental material, sj-pdf-7-jcb-10.1177_0271678X221078616 for Assessment of motion and model bias on the detection of dopamine response to behavioral challenge by Michael A Levine, Joseph B Mandeville, Finnegan Calabro, David Izquierdo-Garcia, Daniel B Chonde, Kevin T Chen, Inki Hong, Julie C Price, Beatriz Luna and Ciprian Catana in Journal of Cerebral Blood Flow & Metabolism
Footnotes
Funding
The author(s) disclosed receipt of the following financial support for the research, authorship, and/or publication of this article: This work was partly supported by National Institute of Biomedical Imaging and Bioengineering Grant 5R01EB014894-02, National Institute of Mental Health Grant Number R01MH080243, National Institute of General Medical Sciences Grant T32 GM008313, NIH Blueprint for Research Science Grant T90DA022759/R90DA023427, and NIH Shared Instrumentation Grant S10RR023043.
Acknowledgments
We would like to thank Rajesh Narendran for making available to us a set of previously published RAC data with arterial blood sampling 5 for comparison.
Declaration of conflicting interests
The author(s) declared no potential conflicts of interest with respect to the research, authorship, and/or publication of this article.
Authors’ contributions
Design and acquisition of imaging protocol: FC, JCP, BL
Design and execution of analysis: MAL, JBM, DIG, DBC, KTC, IH, CC
Drafting of manuscript: MAL
Editing of manuscript: MAL, JBM, FC, DIG, DBC, KTC, IH, JCP, BL, CC
Supplemental material
Supplemental material for this article is available online.
References
Supplementary Material
Please find the following supplemental material available below.
For Open Access articles published under a Creative Commons License, all supplemental material carries the same license as the article it is associated with.
For non-Open Access articles published, all supplemental material carries a non-exclusive license, and permission requests for re-use of supplemental material or any part of supplemental material shall be sent directly to the copyright owner as specified in the copyright notice associated with the article.