
Abstract
While functional MRI (fMRI) localizes brain activation and deactivation, functional MRS (fMRS) provides insights into the underlying metabolic conditions. There is much interest in measuring task-induced and resting levels of metabolites implicated in neuroenergetics (e.g., lactate, glucose, or β-hydroxybutyrate (BHB)) and neurotransmission (e.g., γ-aminobutyric acid (GABA) or pooled glutamate and glutamine (Glx)). Ultra-high magnetic field (e.g., 7T) has boosted the fMRS quantification precision, reliability, and stability of spectroscopic observations using short echo-time (TE) 1H-MRS techniques. While short TE 1H-MRS lacks sensitivity and specificity for fMRS at lower magnetic fields (e.g., 3T or 4T), most of these metabolites can also be detected by J-difference editing (JDE) 1H-MRS with longer TE to filter overlapping resonances. The 1H-MRS studies show that JDE can detect GABA, Glx, lactate, and BHB at 3T, 4T and 7T. Most recently, it has also been demonstrated that JDE 1H-MRS is capable of reliable detection of metabolic changes in different brain areas at various magnetic fields. Combining fMRS measurements with fMRI is important for understanding normal brain function, but also clinically relevant for mechanisms and/or biomarkers of neurological and neuropsychiatric disorders. We provide an up-to-date overview of fMRS research in the last three decades, both in terms of applications and technological advances. Overall the emerging fMRS techniques can be expected to contribute substantially to our understanding of metabolism for brain function and dysfunction.
Keywords
Introduction
A wide range of magnetic resonance imaging (MRI) and spectroscopy (MRS) methods are routinely applied in explorations of the human brain, spanning from basic sciences to clinical research.1,2 The most popular is functional MRI (fMRI), which is widely used in creating biomarkers of neurological and neuropsychiatric disorders. The fMRI method is based on blood oxygen level-dependent (BOLD) contrast to indirectly localize brain function associated with task-induced activations (BOLD signal increase) or deactivations (BOLD signal decrease), as well as intrinsic resting-state brain activity from the spontaneous BOLD signal fluctuations.3,4 BOLD contrast reflects changes in the local magnetic field gradients caused by paramagnetic deoxyhemoglobin packed inside red blood cells, which in turn affects transverse relaxation time of tissue water protons (T2 or T2*). Changes in BOLD signal are associated with complex interactions between hemodynamic and metabolic variations.1,5 Although progress has been achieved for the interpretation of BOLD contrast in terms of the cerebral blood flow (CBF), cerebral blood volume (CBV), and the cerebral metabolic rates of glucose (CMRGlc) and oxygen (CMRO2) consumption,1,2,6,7 the underlying neurometabolic modulations are still being explored.1,2
Technological advances in 1H-MRS in vivo have improved rapidly, leading to a substantial increase in spectral quality allowing robust quantification of low concentration metabolites in human brain.8,9 As a result, much interest has emerged in the measurement of metabolite levels implicated in neuroenergetics and neurotransmission mediating physiological activity during task and rest conditions, which initiated an emergence of functional 1H-MRS (fMRS). For instance, fMRS measurements of task-associated changes in glucose, lactate or β-hydroxybutyrate (BHB) can provide insights into overall brain energetics, while measurements of changes in glutamate (or pooled glutamate and glutamine termed Glx) and γ-aminobutyric acid (GABA) can provide insights into excitatory and inhibitory neuromodulation. Under normal conditions, glucose is the primary brain energy substrate and BHB is an additional energy substrate during starvation, whereas lactate is a byproduct of glycolysis and Glx and GABA are associated with major excitatory and inhibitory actions in the neuropil. Typically, fMRS addresses hypotheses pertaining to changes in neurometabolic alterations characteristic of physiological stimuli and rest conditions. Specifically, stimuli-induced changes in glutamate/glutamine/GABA are hypothesized to reflect changes in functional excitation-inhibition balance, and changes in glucose/lactate/BHB are hypothesized to reflect changes in functional energetics. Changes in other metabolites detected by 1H-MRS (e.g., myo-inositol, glutathione, aspartate) are less frequently observed in fMRS studies and thus require further reproducibility tests prior to specific hypotheses testing.
Positron emission tomography (PET) allows quantification of glucose metabolism 10 related to glucose transport and phosphorylation (CMRGlc) using 18F-fluorodeoxyglucose (FDG). Recently, FDG-PET has been shown to be feasible for dynamic measure of spontaneous fluctuations of CMRGlc at rest and in response to physiological stimuli (∼minutes timescale). 11 Furthermore, PET using different methods can measure resting or task-induced changes in CBF and CMRGlc, 10 similar to what MRI/MRS methods can provide. 1 Although single-photon emission computed tomography (SPECT) can be used to image CBF, it is less preferred compared to MRI and/or PET in functional studies. Currently, there are no PET and SPECT methods that can measure levels of metabolites like glutamate, GABA, Glx, lactate, BHB in human brain. There are, however, PET ligands for glycine transporters (GlyT1)12,13 and glutamate receptors (mGluR5)14,15 that can indirectly reflect intrasynaptic glycine and glutamate levels, whereas MRS measures of metabolites predominantly reflect intracellular levels. PET also allows steady-state estimates of GABA and serotonin16,17 receptors and dopamine transporter. 18 Thus, despite low sensitivity of functional 1H-MRS, it is the only non-invasive technique available for simultaneous quantitative measurement of multiple neurochemicals in vivo, with as many as six metabolites showing stimulus-related changes out of twenty metabolites quantified at 7.0T. When combined with isotopic enrichment of appropriate substrates, 1H-MRS with indirect 13C detection, as well as other MR-sensitive nuclei (e.g., 13C, 17O, 19F) can be used to measure fluxes through metabolic pathways related to neurotransmission and neuroenergetics (for review, see 1 ) Particularly, 13C-MRS, 17O-MRS and 1H-MRS provide rates of CMRO2, 13C-MRS, 1H-MRS and 19F-MRS provide rates of CMRGlc, as well as 31P-MRS provides rates of ATP synthesis in mitochondria. 13C-MRS has been also used to study functional changes in neuronal tricarboxylic acid (TCA) cycle turnover during visual stimulation. 19 This review presents an overview of methodological advances in functional MRS (fMRS), and fMRS studies investigating consistent metabolic changes implicated in neuroenergetics and neurotransmission underlying brain function in healthy controls, which supplements previous reviews focused on the interpretation of observed metabolic changes, 20 specifically glutamate changes,21–23 and multimodal imaging.1,24
Initial functional 1H-MRS findings of task-induced changes in neuroenergetics
Brain energy from glucose oxidation (CMRGlc(ox)) is critical for rest and stimulated conditions. 25 Regional CBF, CMRGlc and CMRO2 values measured by PET are tightly coupled throughout the resting human brain, 10 where the ratio of CMRO2 to CMRGlc provides the oxygen-to-glucose index (OGI) and the ratio of CMRO2 to CBF leads to the oxygen extraction fraction (OEF). The OGI indicates the degree of CMRGlc(ox) in a given region. Since the normal brain is well oxygenated, the degree of deviation of the OGI from the theoretical maximum of 6 is often termed aerobic glycolysis. 26 The OEF indicates the degree of oxygen transported to the tissue in relation to the oxygen remaining in the blood, and its role in interpretation of BOLD signal is critical. 6 Recent studies suggest that for the resting human brain there exist very small regional differences in OGI and OEF.10,26 During physiological stimulation there is modest uncoupling between CMRO2 and CMRGlc, as well as between CMRO2 and CBF in localized brain areas. PET and MRS studies have contributed much to our current knowledge about OGI and OEF changes during brain activation and deactivation (for historical perspective, see 2 ).
Steady-state stimuli-induced activation triggers regional uncoupling between CBF and CMRO2 (where ΔCBF%>ΔCMRO2% implies reduced OEF), which is consistent with the increased BOLD effect during stimulation compared to baseline.27,28 Similarly, steady-state stimuli-induced activation also shows regional uncoupling between CMRGlc and CMRO2 (where ΔCMRGlc%>ΔCMRO2% implies OGI drop), which suggests less efficient CMRGlc(ox) and some lactate increase during task.29–31 These types of flow-metabolism uncouplings specifically occur over longer time scales after stimulation onset, as typically measured by fMRS studies. While the task-induced increase of lactate suggests a rise in aerobic glycolysis and flux from pyruvate to lactate, its subsequent fate in the neuropil is less clear. For example, lactate could serve as a signaling molecule between neurons and glial cells,2,32 but lactate could also serve as an alternative energy substrate.2,33,34 Recently, the role of lactate was further extended by suggesting that it could act as a blood volume transmitter of cellular signals (vasodilation) that also regulates energy metabolism in large neuronal ensembles.28,35 Much less is known about lactate changes associated with stimuli-induced deactivation. These different fates for lactate are better discussed in each of the references mentioned above.
1H-MRS in human brain provides insights into the underlying metabolic and physiologic modulations from rest. Since task-induced increase in CMRGlc may be associated with a rise in lactate and fall in glucose,2,22,31,34,36,37 these changes can serve as the basis for fMRS measurements. Consistently, early fMRS studies detected lactate increase31,38,39 and glucose decrease37,39,40 in visual cortex (VC) during visual stimulation (Table 1). In addition to studying VC activation, lactate elevations were associated with basal ganglia activation during finger tapping, 41 and with inferior frontal gyrus activation during silent word generation task.42,43 Of note, single voxel (or single volume) spatial localization is mostly used for (f)MRS acquisitions, with typical voxel size of 8 mL or larger. The size of the single (f)MRS voxel is typically a compromise between the desired spatial specificity and signal-to-noise ratio (SNR) of the target low-concentrated molecules given magnetic field strength and MRS method. Relatively large single (f)MRS voxels allow for increased spectral SNR, optimization of field inhomogeneity, and efficient water and lipid suppression, but these come at the cost of limited spatial sampling, and thus these signals cannot be analyzed like dynamic fMRI data.
Combined fMRI and fMRS for various brain regions shows task-induced changes in various metabolites.
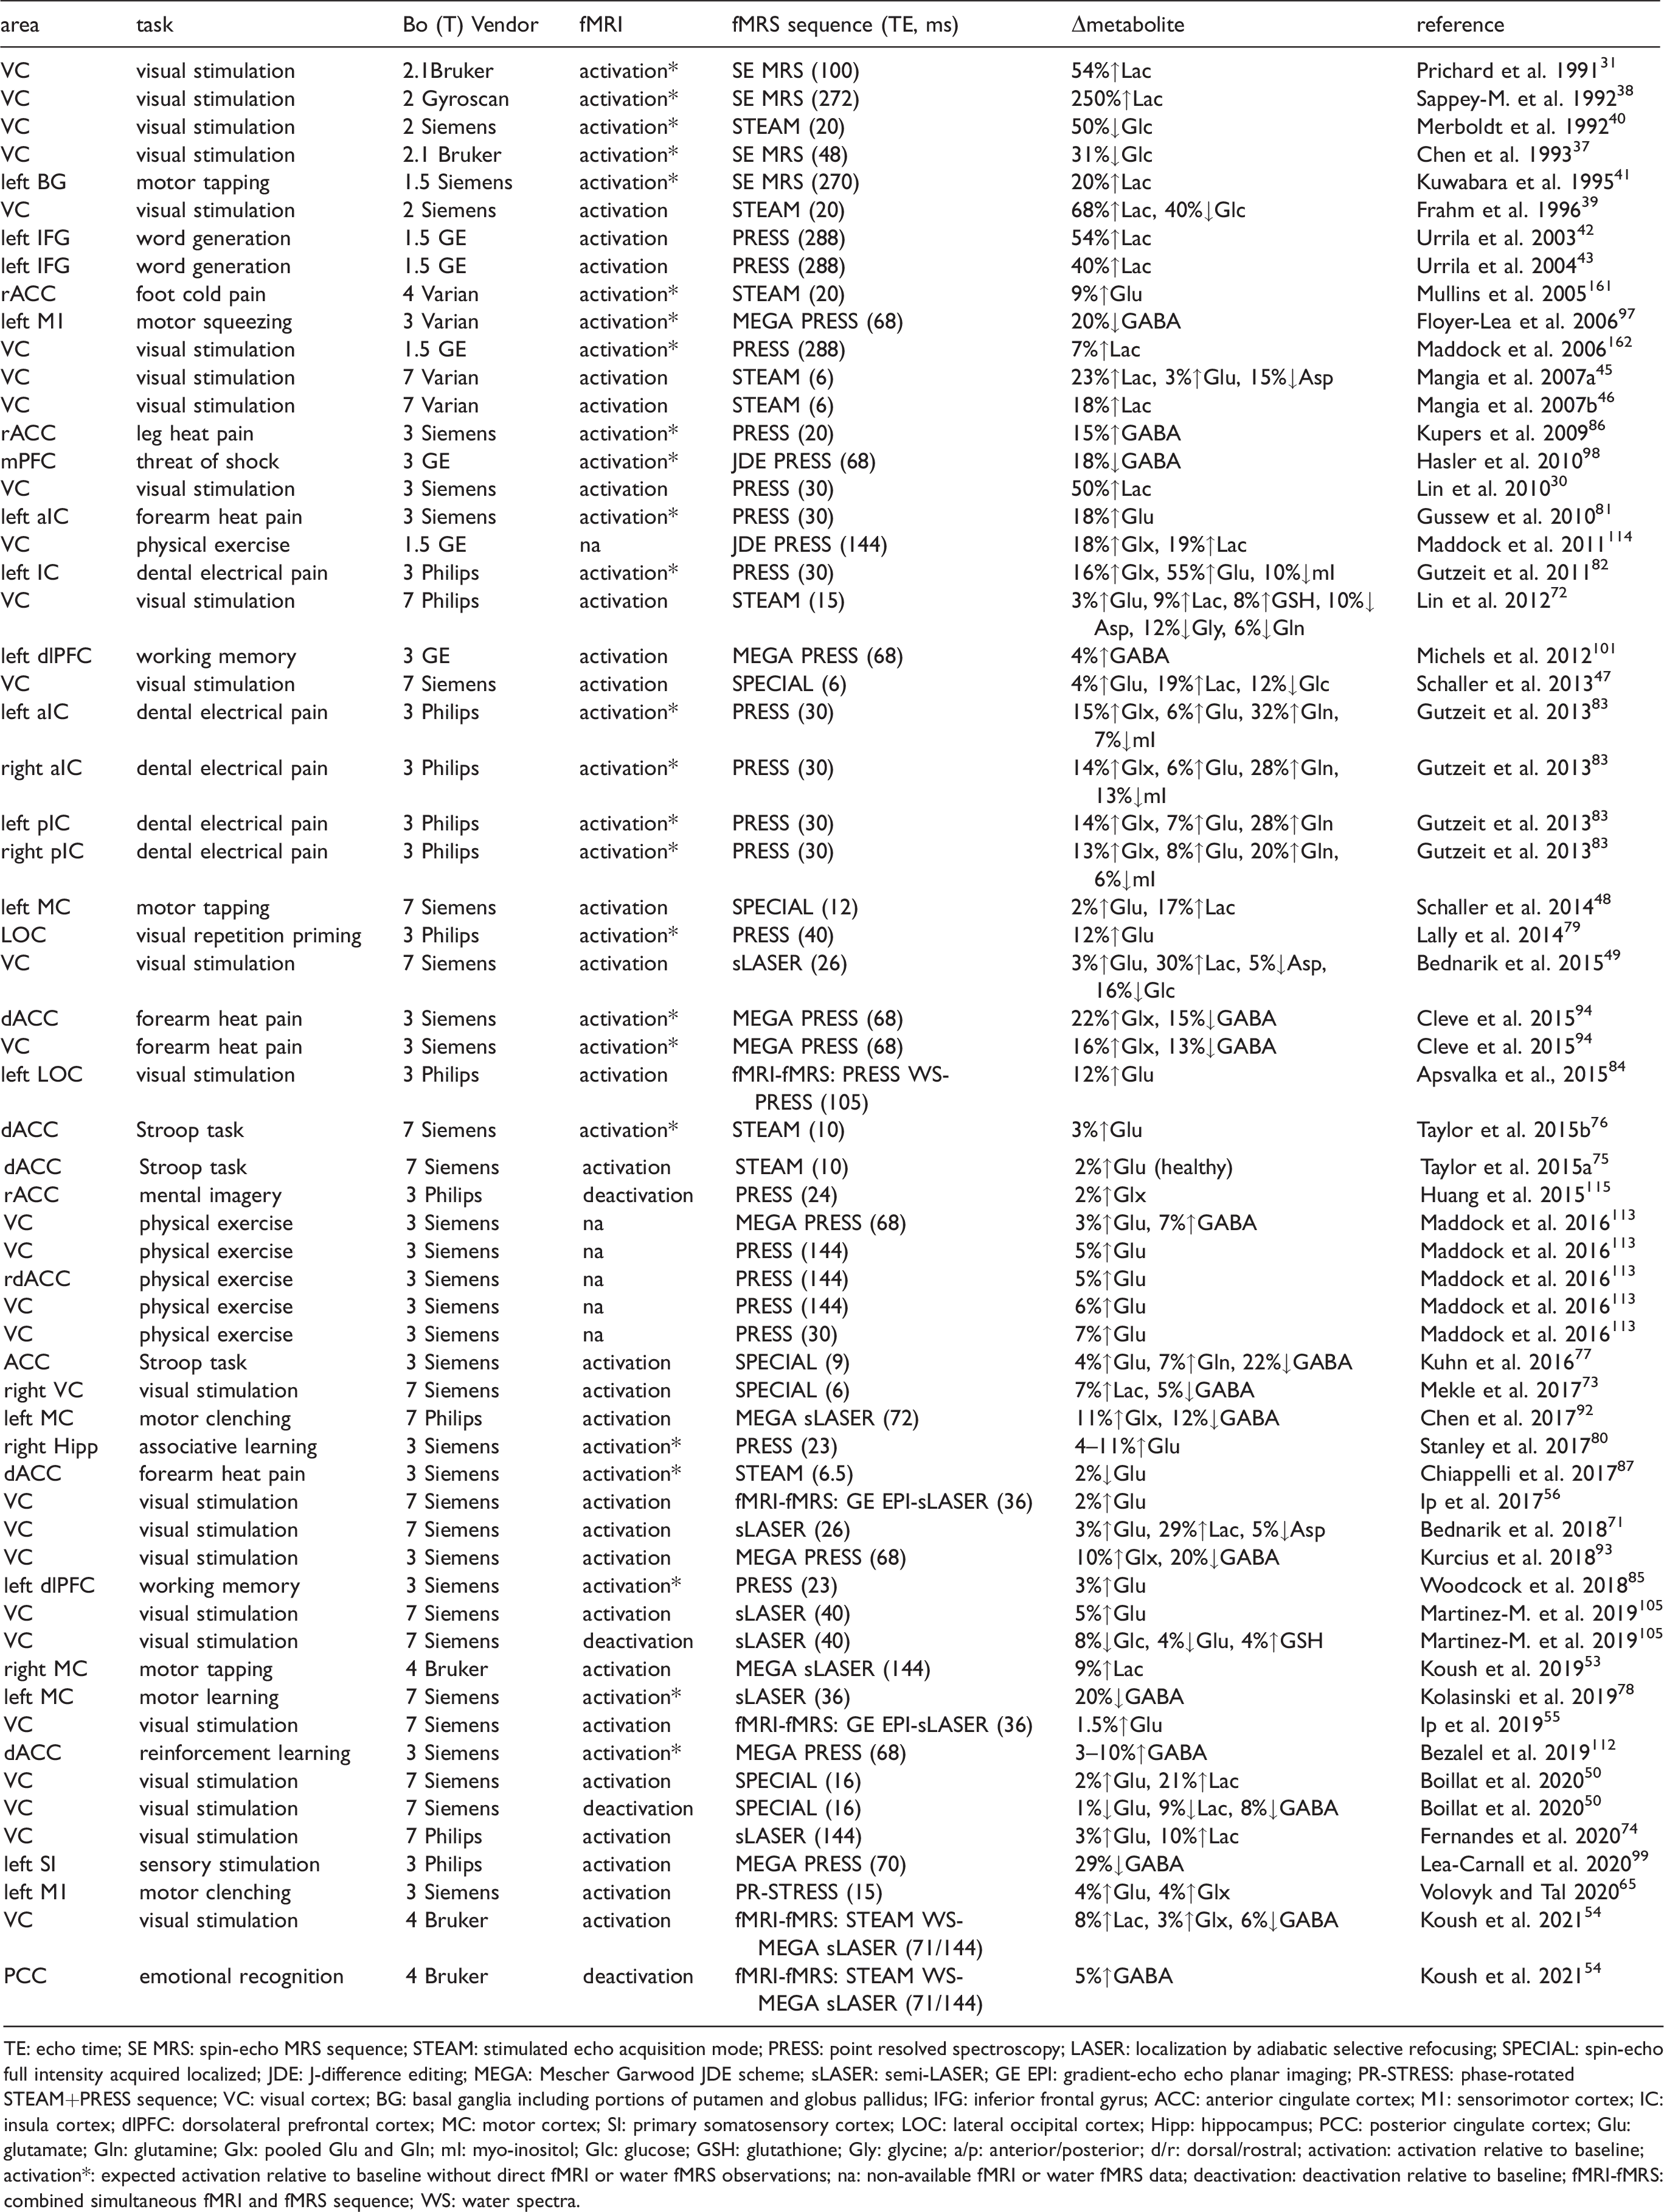
TE: echo time; SE MRS: spin-echo MRS sequence; STEAM: stimulated echo acquisition mode; PRESS: point resolved spectroscopy; LASER: localization by adiabatic selective refocusing; SPECIAL: spin-echo full intensity acquired localized; JDE: J-difference editing; MEGA: Mescher Garwood JDE scheme; sLASER: semi-LASER; GE EPI: gradient-echo echo planar imaging; PR-STRESS: phase-rotated STEAM+PRESS sequence; VC: visual cortex; BG: basal ganglia including portions of putamen and globus pallidus; IFG: inferior frontal gyrus; ACC: anterior cingulate cortex; M1: sensorimotor cortex; IC: insula cortex; dlPFC: dorsolateral prefrontal cortex; MC: motor cortex; SI: primary somatosensory cortex; LOC: lateral occipital cortex; Hipp: hippocampus; PCC: posterior cingulate cortex; Glu: glutamate; Gln: glutamine; Glx: pooled Glu and Gln; mI: myo-inositol; Glc: glucose; GSH: glutathione; Gly: glycine; a/p: anterior/posterior; d/r: dorsal/rostral; activation: activation relative to baseline; activation*: expected activation relative to baseline without direct fMRI or water fMRS observations; na: non-available fMRI or water fMRS data; deactivation: deactivation relative to baseline; fMRI-fMRS: combined simultaneous fMRI and fMRS sequence; WS: water spectra.
The initial fMRS study was performed by Prichard and coworkers 31 at 2.1T on 5 subjects using a long echo-time (TE) localized spin-echo sequence and surface transmit/receive radio frequency (RF) coil. At this long TE, macromolecules were largely suppressed, as shown by the lactate doublet in the spectra. The mean lactate concentration was measured at 0.71 mM, similar to earlier report from the same group using lactate editing of 0.60 mM. 44 An average lactate increase of 54% was observed with a range from 30–90%, which reached a maximum by 3 minutes and slightly declined at 9 minutes (time resolution of measurements was 6 minutes). Although the percent increase in lactate was higher than most recent reports, the average lactate increment (when renormalized to creatine at 8.0 mM) was 0.29 mM which is within the range of lactate concentration increments reported in more recent studies at ultrahigh field.45–50 Prior to 2005 (Table 1) all fMRS studies were performed at what is considered today relatively low field (1.5T to 2.1T). The use of long TE suppresses short T2 lipid and macromolecule signals, but the long TE lowers spectral SNR. However, several studies implemented short TE for fMRS using the stimulated echo acquisition mode (STEAM) 8 pulse sequence at 2.0T.39,40 Several early studies at these lower magnetic field failed to show any task-induced alterations and failed to quantify basal level metabolites most likely due to the reduced specificity from long TE, use of volume transmit/receive coils, and insufficient duration of stimulation epochs (for examples of studies without reported metabolic changes, see reviews20,51). For studies with sufficient SNR to detect lactate, the majority of studies reported a higher percent increase than most studies after 2005 that used higher magnetic fields (Table 1). A partial explanation is that lactate in the early studies using a long TE was not impacted by macromolecules, resulting in a higher percentage change for the same absolute increment in lactate concentration. Another explanation is large reported intrasubject variation in both the earlier low field and recent high field fMRS studies. As described below, much of this variation is likely biological as it correlates with the increase in the magnitude of the BOLD activation. In the pre-2005 studies, many of which used small subject numbers, this factor alone could have led to a 2-fold or more variation in the mean percentage increments (and may still explain much of the variation in recent studies when differences in stimulation paradigm, region, and partial activation volume are considered). Finally, spatial localization and motion correction methods in several of the early low field studies were not as effective as modern approaches, which could have led to lipid signals from outside the visual cortex contaminating the spectrum and being misinterpreted as an increase of lactate.
Reliable quantification of task-induced metabolite alterations using 1H-MRS is now achievable at high fields (for review, see 20 ) Moreover, advances have been to address limited spectral resolution and dispersion of chemical shifts at lower magnetic fields, extensive overlap between metabolites and lipids/macromolecules, low metabolite concentrations and small function-associated metabolite level changes all contribute to spectral quality and quantification accuracy. The basal concentrations of metabolites measured in fMRS studies to date are all in mM (or millimolar) range and include: glucose (1–2 mM), lactate (0.2–1 mM), aspartate (1–2 mM), GABA (1–2 mM), Glu (6–12.5 mM), Gln (3–6 mM), Glx (9–18.5 mM) and BHB (<0.5 mM). 9 Of note, BOLD response (seconds timescale) indirectly reflects electrophysiological processes identified by local field and/or spiking activity modulations (milliseconds timescale). 1 Similar to block design fMRI paradigms (alternating blocks of stimuli and rest periods, each lasting tens of seconds), fMRS paradigms have prolonged block designs (each block lasting minutes timescale). Prolonged block designs are demanding because of habituation effects associated with long cycling, 52 but also specific tasks can be used with limited choices of brain areas to be studied. Thereby, to ensure proper functional engagement of the target brain area(s), it is essential to justify prolonged fMRS paradigms with either identical fMRI paradigms 53 or at least with similar (typically significantly shorter) fMRI paradigms,48,49 or alternatively, acquire concurrent fMRI-fMRS data.54–56 Given large single fMRS voxels, conventional fMRS block designs reflect steady-state metabolite levels with low spatial resolution. Metabolic changes estimated with fMRS reflect just pooled inhibitory, excitatory and energetics effects, without possibility to separate GABAergic and glutamatergic activity unless compartmentalized metabolic models are applied.20,54
The 1H-MRS quantification benefits from increased static magnetic field giving rise to improved chemical shift dispersion and SNR despite concomitant increase in peak linewidth (due to T2 shortening).9,57 However, high quality 1H-MRS also requires fine adjustment of first and second order shim coils to correct for field inhomogeneities,58–60 tissue water suppression and outer-volume signal exclusion techniques to minimize extracranial contamination from lipids and macromolecules. 8 Availability of magnetic fields at 3.0–7.0T or even higher with advanced MRI instrumentation and pulse sequence designs substantially increased 1H-MRS quantification accuracy and consistency.8,61,62 As a result of these advances, it was shown that short TE fMRS at 7.0T could provide reliable quantification of up to 20 metabolites and functional changes of up to 6 metabolites from VC in relatively small groups of 10–15 healthy participants (Figure 1(a), Table 1).45,47,49 For comparison, short TE fMRS at 3.0T can only detect changes in glutamate or Glx.63–65 Of note, task-induced 1H-MRS spectra linewidth modulations are intrinsically sensitive to BOLD changes, which alter T2 of both water and metabolite protons regardless of the magnetic field.20,66–68 Although these modulations reported in fMRS literature validate expected activity, they must be compensated (Figure 1(b)).20,49 Importantly, increased fMRS spectral quality at 7.0T also led to substantially increased temporal resolution of metabolic changes and provided the first insights into dynamics of the functional metabolic response (Figure 1(c)). 49
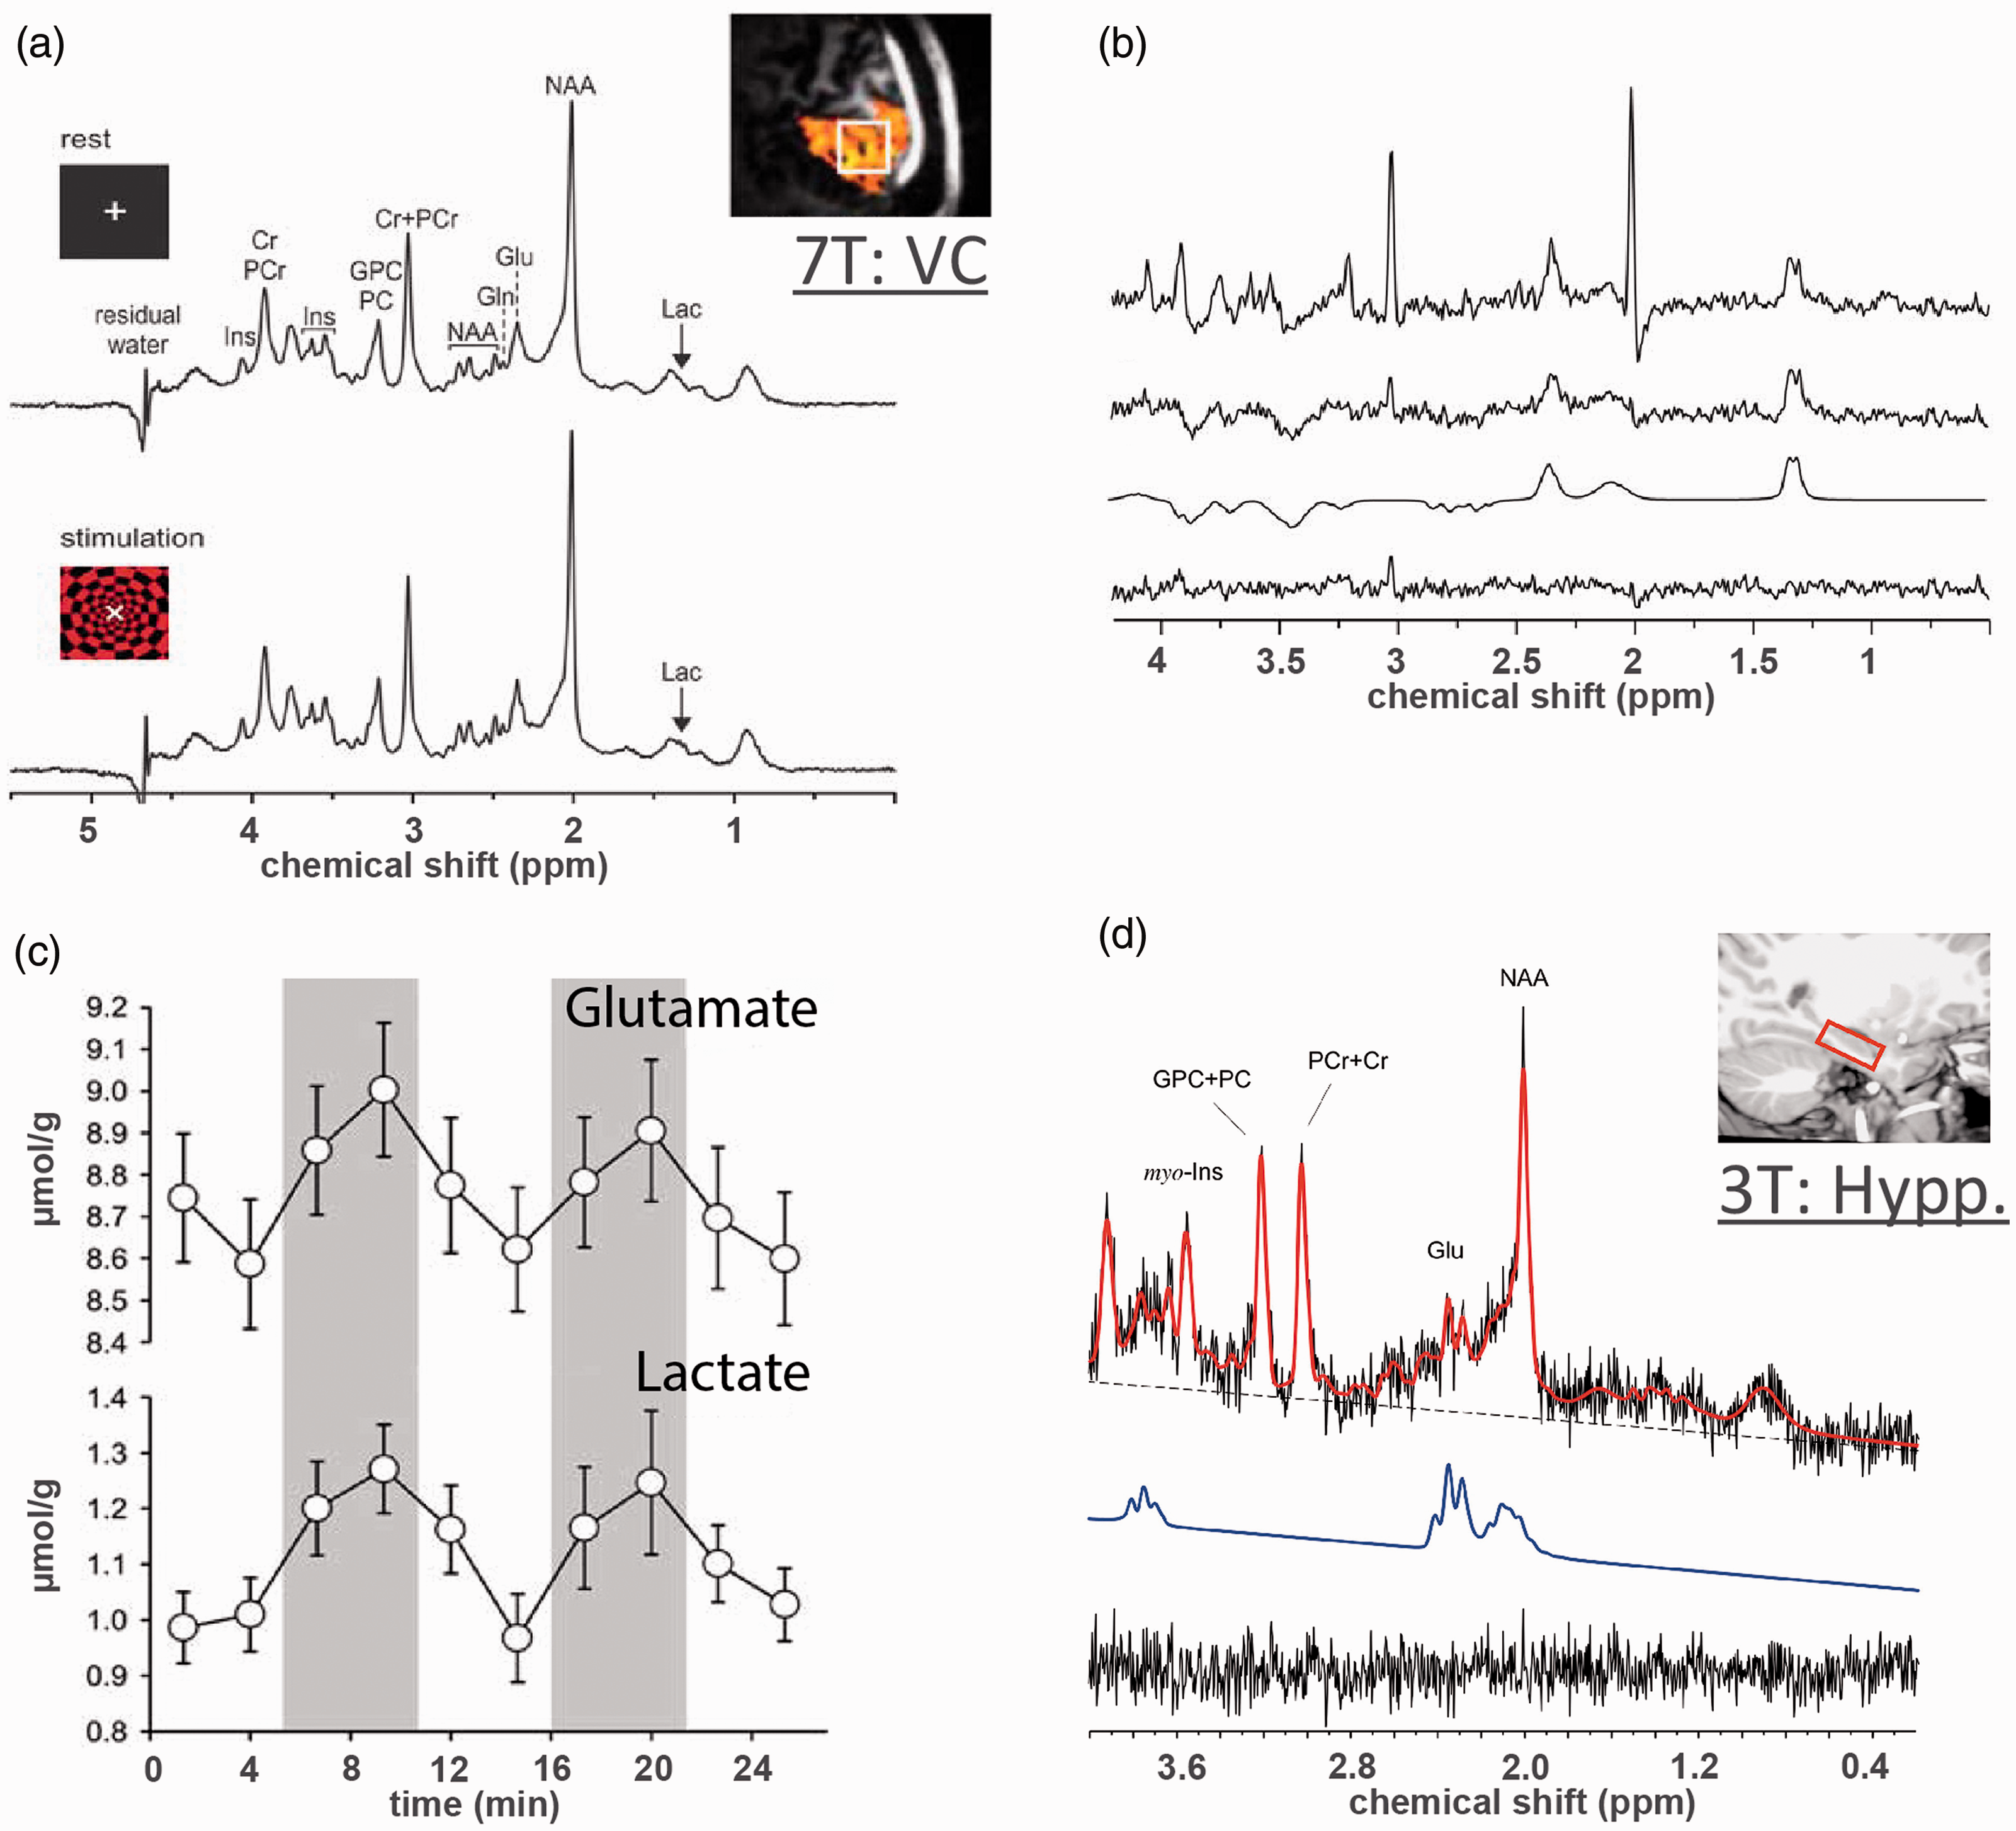
Short TE functional MRS in human brain at 7 T and 3 T. (a) High quality 1H fMRS spectra acquired at 7 T from VC for baseline and stimulation blocks using short TE (26 ms) sLASER sequence during a flashing checkerboard task. Reliable quantification of ∼20 metabolites are achievable. (b) From top to bottom, difference spectrum between stimulation and baseline blocks without compensation for BOLD line-width narrowing, difference spectrum with compensated BOLD effect, LC model fit of the difference spectrum, and fit residuals. The comparison shows that metabolite changes from short TE spectra are highly sensitive to BOLD effect change from rest to stimulation. (c) High spectra quality at 7 T allows increasing the temporal resolution of fMRS and observing task-induced dynamics of metabolic response, e.g., increases in Glutamate and Lactate. (d) Sufficient spectra quality of short TE (23 ms) PRESS sequence at 3 T allows for fMRS observations of glutamate increase associated with hippocampus activation during associative learning tasks, i.e. for a target metabolite with relatively large concentration. Panels (a–c) are modified from Bednarik et al. 49 with permission. Panel (d) is modified from Stanley et al. 80 with permission.
The fMRS spectra at 3.0T are typically acquired with short TE (15–50ms) spin-echo point-resolved spectroscopy (PRESS) sequences. 69 At ultra-high magnetic field, PRESS sequence suffers from chemical shift displacement errors and RF (or B1) related artifacts. Thereby ultra-short TE (6–15ms) STEAM and spin-echo full intensity acquired localized (SPECIAL) sequence61,62 have been proposed for fMRS at 7.0T.8,62 A more recently proposed method for high quality fMRS spectra is spin-echo full intensity sequence with semi localization by adiabatic selective refocusing (sLASER), which is characterized by reduced chemical shift displacement at ultra-high magnetic field and high test-retest reliability.64,70 Short TE sLASER (26–40ms) has been successfully applied for fMRS at 4.0T and 7.0T.49,53,54,56,71
Short and ultra-short TE fMRS at various magnetic fields
Short TE (15–50 ms) and ultra-short (<15 ms) TE fMRS has been successfully applied at 3.0T and 7.0T in a variety of brain areas and tasks (Table 1). VC is often the target brain area due to easiest placement of surface RF coils despite suboptimal shimming conditions at this location. This is primarily because of relative simplicity of the stimulation required to achieve robust and sustained physiological activation, absence of task-induced body motions (e.g., as compared to intense tapping or clenching), as well as the high SNR from closer proximity to head RF coil elements.45–47,49,50,71–73 Conventional flashing checkerboard paradigm covering whole-screen has been often used to activate VC and identified the following stimulation-induced metabolic alterations: 1.5–5% increase in glutamate, 9-30% increase in lactate, 5–15% decrease in aspartate and 12–16% decrease in glucose.45,47,49,50,55,56,71,74 Besides, in VC, 3% increase in glutamate, 9% increase in lactate, 8% increase in glutathione, 10% decrease in aspartate, 6% decrease in glutamine and 12% decrease in glycine were observed during whole-screen moving wedges stimulation. 72 The specificity of metabolic observations during unilateral VC activation has been studied using flashing checkerboard paradigm presented only in a half of the screen for target and control regions, respectively. 73 Identified activation in contralateral to stimuli VC was associated with 7% increase in lactate and 5% decrease in GABA.
In addition to the extensively studied VC, consistent 2-4% glutamate increase, 7% glutamine increase, and 22% GABA decrease were observed in anterior cingulate cortex (ACC) during Stroop task using ultra-short TE fMRS at 3.0T and 7.0T75–77. Reliable 17% increase in lactate and 2% increase in glutamate were also observed in human motor cortex during finger tapping paradigm using ultra-short TE fMRS at 7.0T.
48
Conversely, motor sequence learning was found to be associated with 20% decrease of GABA in primary motor cortex, while glutamate and lactate changes were not observed using short TE fMRS at 7.0T.
78
Of note, motor cortex fMRS has been achieved using ultra-short TE sequence at 7.0T, shifting the RF transmit
Although to a lesser extent, short TE fMRS at 3.0T has been successfully used to study task-induced VC activations. Specifically, 12% glutamate increase was observed during visual repetition-priming cognitive task, 79 and 50% lactate increase was observed during flashing checkerboard stimulation. 30 Consistently, short TE fMRS at 3.0T unveiled: 4–11% glutamate increases in hippocampus during associative learning tasks (Figure 1(d)); 80 18% glutamate increase in insular cortex during acute heat pain applied to the left forearm; 81 13–16% Glx increase, 6–55% glutamate increase, 20–32% glutamine increase, and 6–13% myo-inositol decrease in insular cortex during dental pain induced by electrical stimulation;82,83 12% glutamate increase in lateral occipital cortex after novel visual stimuli presentation; 84 and 3% glutamate increase in dorsolateral prefrontal cortex during working memory task. 85 In addition, the heat pain applied to the right upper leg was associated with 15% GABA increase in rostral ACC as identified by short TE fMRS at 3.0T, 86 as well as heat pain applied to the forearm was associated with 2% glutamate decrease in dorsal ACC as identified by ultra-short TE fMRS at 3.0T. 87
These studies show that, regardless of the region and type of stimulation, activation paradigms reproducibly lead to increased levels of glutamate and lactate, with a commensurate decrease in glucose. These can largely be interpreted as heightened metabolic demands to support neuroenergetics and neurotransmission. However, verification of the potential involvement of a few other less frequently observed metabolites reported during (de)activation (e.g., myo-inositol, glycine, glutathione, BHB) will be technically challenging, and best addressed at ultra-high magnetic field.57,88
J-difference edited fMRS at various magnetic fields
While short TE MRS at 3.0T has shown variable fMRS results, fMRS observations at 7.0T are largely consistent across metabolite changes implicated in neuroenergetic (glucose, lactate) and neurotransmission (glutamate, GABA). Fortunately, these metabolic changes can also be detected by J-difference editing (JDE) 1H-MRS at lower magnetic fields. Spectral editing with J modulation takes advantage of the quantum mechanical properties of specific molecules to selectively observe or “edit” them from the overall 1H-MRS spectrum, 89 thereby providing separation from overlapping resonances and lipids/macromolecules. Advantage of an edited signal over non-edited signal detection is strongly dependent on the molecule of interest and magnetic field strength. The ultimate goal of spectral editing, including JDE, is to reduce the dynamic range between a signal-of-interest (e.g., GABA) and partially overlapping signals (e.g., creatine). For GABA at low magnetic fields the removal of creatine by JDE is so pronounced that detection error (as for example measured by Cramer-Rao lower bound (CRLB) fitting) on GABA greatly decreases. Thus, in such cases use of spectral editing is mandatory. At higher magnetic fields, like 7.0T and above, the overlap between creatine and GABA is partial so that GABA may be detected with direct, non-edited 1H MRS. However, even at high magnetic fields the use of JDE can still be beneficial as the CRLB of a non-overlapping signal is always lower than that of a partially overlapping one, provided that the decrease in detection sensitivity due to the longer TE does not undue SNR gains achieved by editing. With JDE spectrum contains the scalar couplings, but also the distorted portion where the frequency-selective editing pulses are applied. While JDE gives a superior depiction of the “edited” signal, other portions of the spectrum cannot be relied upon. Although the water signal should be edited out in the JDE spectrum, typically a non-zero water signal is observed which arises due to small variations in vasomotion, frequency drift, RF coil loading that lead to minute water subtraction errors between the two experiments for JDE. Thus, JDE still requires excellent water suppression to reduce water-related distortions in the JDE spectrum.
JDE MRS is typically based on the MEscher-Garwood (MEGA) J-editing scheme, 90 during which selective refocusing pulses are applied at the coupling partner of the target spin system (editing ON) and at the mirror position (editing OFF) relative to the water frequency or relative to the target spin system. Frequency selective editing pulse refocuses the evolution of scalar coupling of target spin system in the editing ON experiment, whilst during editing OFF it remains unaffected. Then, the sum and difference between editing OFF and ON experiments correspond to spectra of J-edited sum that contains resonances of unaffected signals and J-edited difference that contains resonances of affected signals, respectively (Figure 2(a) for MC, motor cortex, and (b,c) for VC and PCC, posterior cingulate cortex). JDE MRS is based on scalar coupling evolution which requires a longer TE, which is optimized for specific spin systems to maximize the amount of editing, typically ranging 70–200 ms. Besides, JDE MRS could be used to co-edit additional metabolites that have similar J-evolution profiles with a target metabolite and captured by bandwidth of the applied refocusing pulse.9,91 Typically, pooled glutamate and glutamine (termed Glx) at 3.75 ppm is co-edited with GABA at 3.01 ppm in GABA JDE fMRS spectra,54,92–94 and similarly BHB at 1.19 ppm is co-edited with lactate at 1.31 ppm in lactate JDE fMRS spectra53,54 (Figure 2).
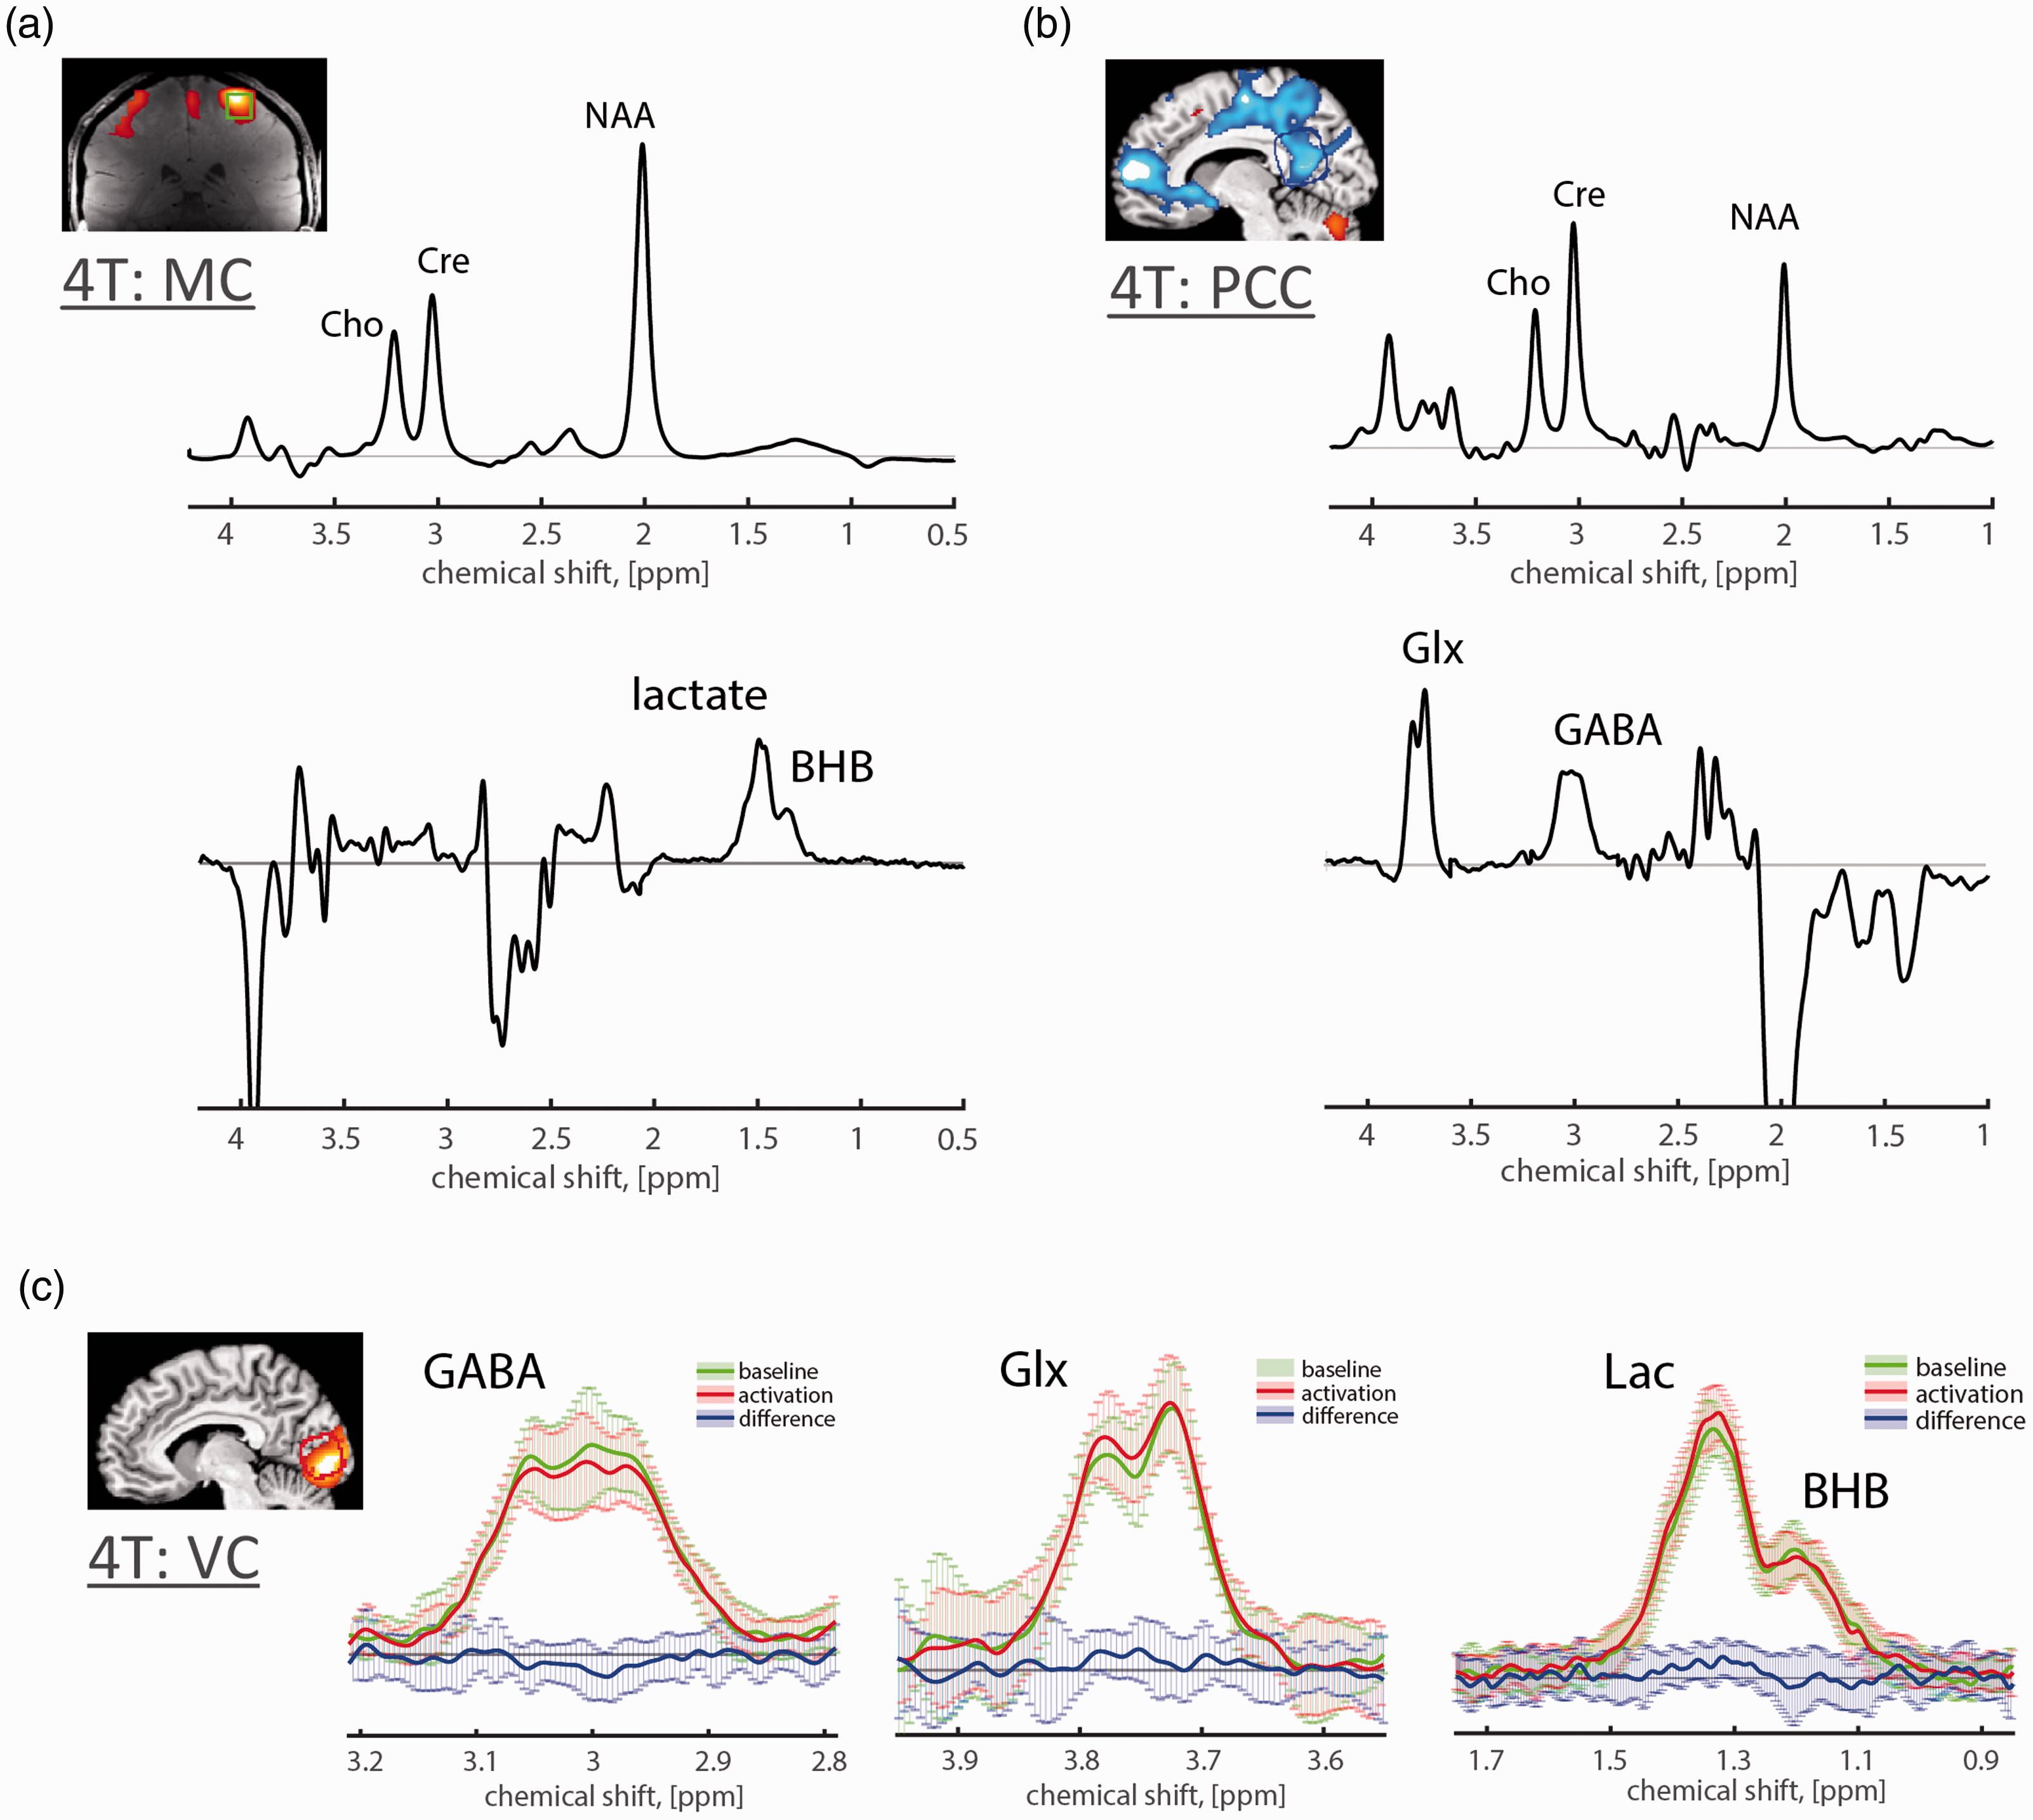
J-difference edited fMRS in human brain at 4 T. JDE 1H MRS allows for high quality spectra observations of such low concentration metabolites as Lac (0.2–1 mM), pooled Glu (6–12.5 mM) and Gln (3–6 mM) termed as Glx, GABA (1–2 mM) and BHB (<0.5 mM) using MEGA-PRESS or MEGA-sLASER sequences at relatively low magnetic field (Table 1). For baseline condition, conventional group (a) average motor cortex (MC) JDE sum spectra for Lac JDE (TE = 144 ms) and (b) average posterior cingulate cortex (PCC) JDE spectra for GABA/Glx JDE (TE = 71 ms) using MEGA-sLASER sequence at 4 T.53,54 Note that the difference GABA spectrum contains flipped NAA peak due to the subtraction between the NAA amplitude-distorted spectrum (by the editing ON pulse applied adjacent to NAA) and editing OFF spectrum with unaffected NAA peak. (c) For flashing checkerboard paradigm at 4T, group average J-difference spectra for activated VC baseline (green), condition (red) and their difference (blue; decrease in GABA −5.7 ± 3.3% from baseline level 2.22 ± 0.33 mM, increase in Glx 3.0 ± 2.1% from baseline level 1.50 ± 0.21a.u., increase in Lac 7.8 ± 5.4% from baseline level 0.99 ± 0.13 mM, and no changes in BHB). 54 Shaded error bars denote standard deviation.
GABA measured by JDE fMRS has been shown feasible to reliably detect metabolic changes in different brain areas at 3.0T and 7.0T (Figures 2 and 3). Most consistently at 3.0T, GABA decrease and Glx increase were observed in ACC (22% Glx increase and 15% GABA decrease) and VC (16% Glx increase and 13% GABA decrease) during acute heat pain applied to the left forearm, 94 as well as in VC activation during eyes-open and flashing checkerboard stimulation tasks in darkness as compared to eyes-closed (10% Glx increase and 20% GABA decrease). 93 Of note, the edited GABA signal at 3.0T includes co-edited lipids/macromolecules.92,95,96 Hence, assuming no change in lipids/macromolecules with task, the reported task-related GABA changes typically underestimate true changes of inhibitory tone. GABA JDE fMRS was used to study VC activation during flashing checkerboard stimulation and PCC deactivation during auditory emotion identification (VC: 3% Glx increase and 6% GABA decrease; PCC: 5% GABA increase) at 4.0T. 54 In addition, 20% GABA decrease was observed following repetitive sensory stimulation of two fingertips in primary sensorimotor cortex, 97 18% GABA decrease was observed during threat of shock condition in medial prefrontal cortex, 98 29% GABA decrease was observed during motor learning task in primary somatosensory cortex,99,100 4% GABA increase was observed during working memory task in dorsolateral prefrontal cortex, 101 as well as 22% GABA decrease was observed during Stroop task in ACC. 77 Recently, GABA JDE fMRS has been shown feasible at 7.0T, retaining good SNR for measuring dynamic changes of GABA and Glx. It was used to study motor cortex activation during hand clenching and revealed 11% Glx increase and 12% GABA decrease. 92
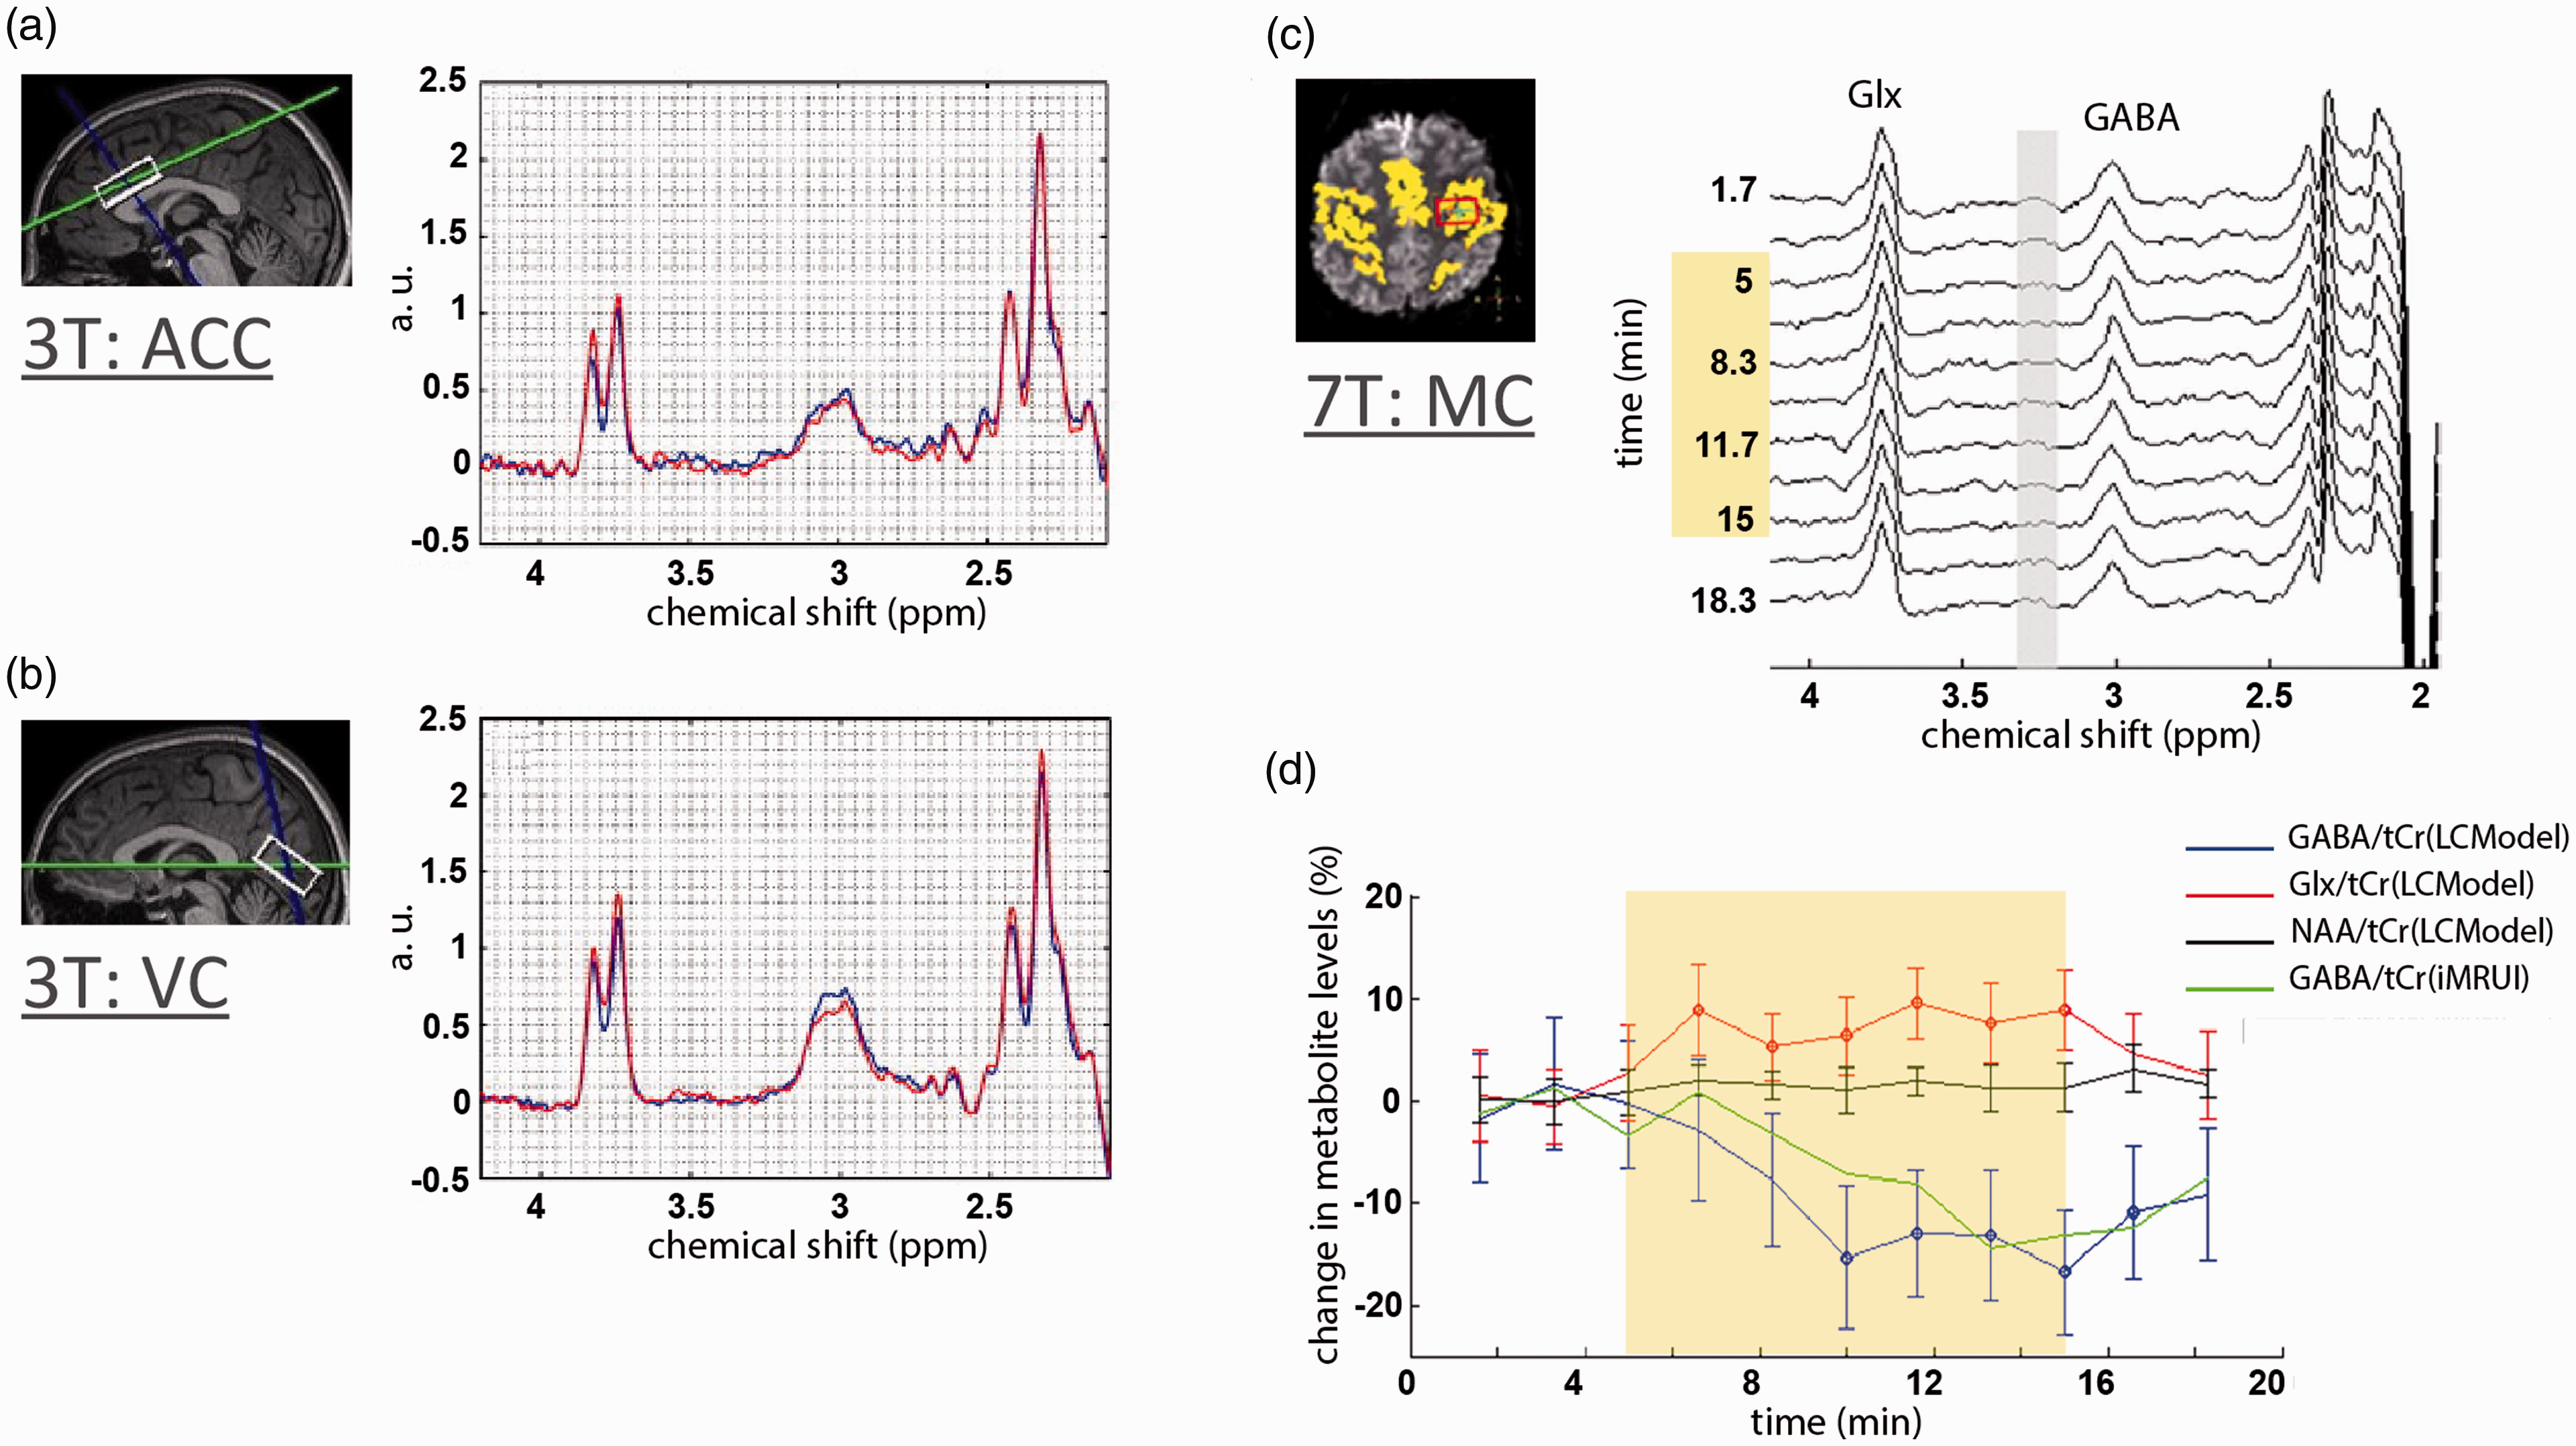
J-difference edited fMRS in human brain at 3T and 7T. (a,b) Group average anterior cingulate cortex (ACC) and visual cortex (VC) GABA/Glx JDE spectra highlight an increase of Glx and a decrease of GABA during acute forearm heat pain paradigm using MEGA-PRESS sequence (TE = 68 ms; blue baseline and red pain state spectra) at 3T. 94 (c) Group average motor cortex (MC) GABA JDE spectra during hand clenching paradigm using MEGA-sLASER sequence (TE = 72 ms) at 7T. 92 (d) The time-course of the group average MC spectra and (d) block-related group average MC spectra obtained during the hand-clenching paradigm highlight improvement in the temporal resolution of JDE fMRS at 7T. 92 Panels (a,b) are modified from Cleve et al. 94 with permission. Panels (c,d) are modified from Chen et al. 92 with permission.
Most recently, lactate JDE fMRS at 4.0T has also been used to study task-induced modulations during motor cortex activation using finger tapping (9% lactate increase), 53 during VC activation using flashing checkerboard (8% lactate increase) 54 and during PCC deactivation using auditory emotion identification (no lactate changes). 54 In these studies, the presence of lactate co-edited BHB was consistent in the JDE spectra from visual (0.34 mM), motor (0.28 mM) and posterior cingulate (0.34 mM) cortices, although no significant task-induced BHB level changes were detected given applied experimental conditions at 4.0T. Of note, JDE fMRS of lactate utilizes long TE (144 ms) that results in reduction of macromolecular contributions to lactate spectra due to dephasing of macromolecule signal. This facilitates determination of lactate changes as compared to short TE fMRS spectra where accurate deconvolution of low concentration metabolites from overlapping resonances remains a significant challenge for identification of basal lactate levels. Conversely, JDE MRS is compromised with long TE that may lead to some T2 signal losses, with the editing pulse flip angle and chemical shift displacement, factors which do not affect the short TE fMRS. Nevertheless, highlighted studies show that, regardless of the region and type of stimulation, JDE fMRS is capable of consistent detection of functional modulations in GABA, Glx and lactate at 3.0T, 4.0T and 7.0T magnetic fields.
Interpreting 1H fMRS findings of metabolite changes
In this section we focus on interpretations of most consistent fMRS observations in lactate, glutamate/Glx and GABA (Table 1). Task-induced decreases of glucose are believed to reflect increased CMRGlc in response to increased energy demands and net glucose influx through blood-brain barrier. Since lactate is an end product of aerobic glycolysis, glucose decrease and lactate increase are expected in fMRS activation studies. However, short and ultra-short TE fMRS at 7.0T is not always sensitive to significant glucose changes, most likely due to its spread of glucose resonances, small glucose concentration, an overlap with other strong resonances, as well as due to the suboptimal experimental conditions.47–49,57,71,72 Task-induced increases in both glutamate and lactate are typically considered to reflect increases in CMRO2 and CMRGlc. However, they are complicated to interpret due to their reflecting coupled changes in both neurotransmitter and other metabolic fluxes.2,102,103 In particular, lactate increase is complicated by the fact that it can indicate a rise in non-oxidative glycolysis,2,22,104 the debate about degree of lactate compartmentalization in neurons vs. astrocytes and lactate shuttling between neurons and astrocytes,34,36 and possible action of lactate as a blood volume neurotransmitter mediating vasodilation.28,35 Regardless of these remaining questions, task-induced lactate and glutamate/Glx changes have been shown to correlate positively with BOLD signal changes.49,54,55,93,105
Glutamate is a major excitatory neurotransmitter and a precursor of GABA.102,106,107 It is directly linked to the TCA and energy metabolism,102,108 suggesting that energetic and glutamatergic changes could be paralleled in activated brain areas.20,49,54 Consistent increase of glutamate and decrease of aspartate have been observed during VC stimulation using fMRS at 7.0T45,49,71,72 (Table 1), which could be associated with the increased rate of the malate-aspartate shuttle (MAS) and increased flux into the TCA cycle during stimulation.20,109 MAS maintains the cytosolic redox potential required for glucose utilization and neurotransmitter synthesis. 109 In one fMRS study, increase of glutamate during visual stimulation was coupled with an expected decrease of glutamine underlying an increased flux of the glutamate-glutamine cycle. 72 Glutamate-glutamine cycle could balance impermeable to blood-brain barrier stimulation-induced glutamate changes to prevent ecotoxicity, thus reflecting concomitant modulation of glutamine. 110
GABA is a major inhibitory neurotransmitter and tissue GABA as measured by 1H fMRS reflects mainly intracellular GABA as extracellular GABA is too low for detection. Because intracellular GABA determines extracellular GABA as maintained by plasma membrane GABA transporters which operate near equilibrium, task-induced GABA alterations can reflect changes in extracellular GABA level, and thus in tonic inhibition. Activation-induced GABA level decreases were observed during motor and sensory stimulation,78,97,99 as well as GABA decrease together with lactate/glutamate/Glx increase were observed during visual, motor and pain stimulation54,73,92–94 (Table 1). Also, GABA could alter local CBF and hence the BOLD response via release of vasoactive neuromodulators such as intestinal peptide from inhibitory neurons. 111
Less commonly, increased GABA levels have been observed during activations in certain brain areas (Table 1). Activation of dorsolateral prefrontal cortex during a working memory task has been shown to be associated with parallel increases of GABA 101 and Glu. 85 Activation of rostral ACC during heat pain stress was associated with an increase of GABA and suggested to represent an increased inhibition of pain-induced excitatory thalamo-cingulate afferent input. 86 In dorsal ACC during reinforcement learning, activation led to a 3–10% increase of GABA, potentially reflecting increased inhibition during high cognitive load. 112 Vigorous physical exercise on a bicycle ergometer was associated with 3–7% glutamate increase and 7% GABA increase in VC, 5% glutamate increase in rostrodorsal ACC 113 as well as with 18% Glx and 19% lactate increase, 114 suggesting exercise-induced expansion of cortical pools of lactate, glutamate and GABA.
In addition to studying localized brain activations as compared to baseline, fMRS has been recently used to study localized deactivations50,54,105 (Table 1). Although these findings are heterogenous across observed deactivation-induced metabolic changes, target brain areas and experimental conditions, they are consistent in that localized deactivation could be mediated by metabolic alterations different from those underlying localized activation. Since deactivation is not simply the inverse of activation, metabolism may differ across deactivated brain areas/tasks.50,54 Interestingly, deactivation of rostral ACC was found to be associated with 2% Glx level increase during mental imagery task. 115 Furthermore, along with whole-screen flashing checkerboard activations in VC described above, a centered, small-circle flashing checkerboard was used to deactivate VC. This deactivation was associated with 8% decrease in glucose, 4% decrease in glutamate and 4% increase in glutathione, 105 as well as with 1.3% decrease in glutamate, 9% decrease in lactate and 8% decrease in GABA. 50 One of the key distinctions between these studies was either different 105 or identical 50 VC areas used for activation and deactivation during fMRS. In addition, more metabolic alterations were observed by Boillat et al, 50 which could be due to the larger sensitivity of the applied ultra-short TE (16 ms) SPECIAL sequence as compared to the short TE (40 ms) sLASER sequence used by Martinez-Maestro et al. 105 Nevertheless, both studies consistently show decreased glutamate level during deactivation, suggesting decreased TCA cycle activity as compared to baseline, which is paralleled by decreased lactate level suggesting an overall reduction in CMRGlc and neuronal activity. 50 Boillat et al. 50 suggested that the significant decrease in GABA during VC deactivation may be paralleled with glutamate decrease as it is a GABA precursor.102,106,107 Since fMRS measured changes in GABA and glutamate are believed to reflect GABAergic and glutamatergic neurons, the concurrent change of both neuronal pools is difficult to interpret. Conversely, functional rise of aerobic glycolysis (lactate increase) and glutamatergic activity (glutamate increase) was found to be specific to the activation in VC during whole-screen flashing checkerboard stimulation and not to the deactivation in posterior cingulate cortex during auditory emotion identification. 54 In addition, VC activation was associated with 6% GABA decrease, and PCC deactivation was associated with 5% GABA increase. 54 These findings suggest that neurotransmission in VC and PCC differ in terms of their support by aerobic glycolysis during activation and deactivation as compared to baseline, possibly through differences in the modes of neurotransmission and/or neuroenergetic capabilities. For smaller absolute changes in signaling in PCC, these findings do not exclude the possibility that detection sensitivity was not sufficient to see a significant decrease in Glx, or that small glutamate changes were counter-balanced by opposite changes in glutamine in pooled Glx observations. Moreover, an opposite effect of larger task-induced GABA changes in activated (negative correlation with BOLD response) and deactivated (positive correlation with BOLD response) brain areas was observed. 54 More detailed interpretations of (de)activation mechanisms are available in the original publications.50,54,105
Given the sparseness of fMRS studies investigating BHB changes, some caution is necessary for interpreting these studies in the context of the others being reviewed for other metabolites. BHB concentration can rise substantially due to prolonged exercise 116 and fasting, 117 and serve as an additional substrate to partly fulfill energy demands in the presence of low glucose. 118 However, its potential role in functional activation has not been addressed so far due to the limited sensitivity and very low BHB concentration (<0.5 mM). Lactate JDE MRS demonstrated sufficient sensitivity for the BHB quantification at 4.0T53,54 and 3.0T, 119 but the accuracy to determine BHB change was insufficient; thus mandating additional investigation, e.g. at 7.0T. Therefore, we suggest that BHB could serve as an additional, not alternative, energy source to meet exceedingly high energy demand situation.
Overall, these studies show that levels of glutamate (or Glx) and GABA can change in opposite directions during brain activation, suggesting that a new excitatory/inhibitory balance is integral to the neuropil activating process. In contrast, metabolite changes associated with deactivation processes are more heterogenous and require further investigation.
Interpreting 1H fMRS findings of metabolite levels
With functional metabolic alterations, basal levels of excitatory and inhibitory neurotransmitters are implicated in modulation of local brain responses to activation and deactivation stimulations and tasks, and functional/effective connectivity during task and/or resting-state conditions (Table 2). For the same brain area, regional resting-state GABA level modulates inter-subject BOLD response variability so that greater inhibition is associated with smaller positive BOLD magnitude (activation) in VC during visual stimulation,49,54,93,120–122 in anterior temporal lobe (ATL) during semantic processing, 123 and in left primary sensorimotor cortex during motor learning. 124 In addition, higher individual resting-state GABA level is associated with larger negative BOLD magnitude (deactivation) in rostral ACC during emotion processing,125,126 in PCC during working memory task 127 and during auditory emotion identification task, 54 as well as in medial PFC during working memory task. 128 For different brain areas, higher individual resting-state GABA level in dorsal ACC is associated with greater amygdala activation during fear recovery and deactivation during fear extinction. 129 Since the inverse relationship between tissue GABA level and BOLD response extends over both activated and deactivated areas (Table 2), the fMRS GABA measure reflects a common inhibitory effect modulating excitation-inhibition balance, suggesting that basal inhibition of brain activity is ubiquitously important for normal brain function. 54
Combined fMRI and MRS for various brain regions shows correlations between basal GABA/Glx/glutamate level and fMRI signal.
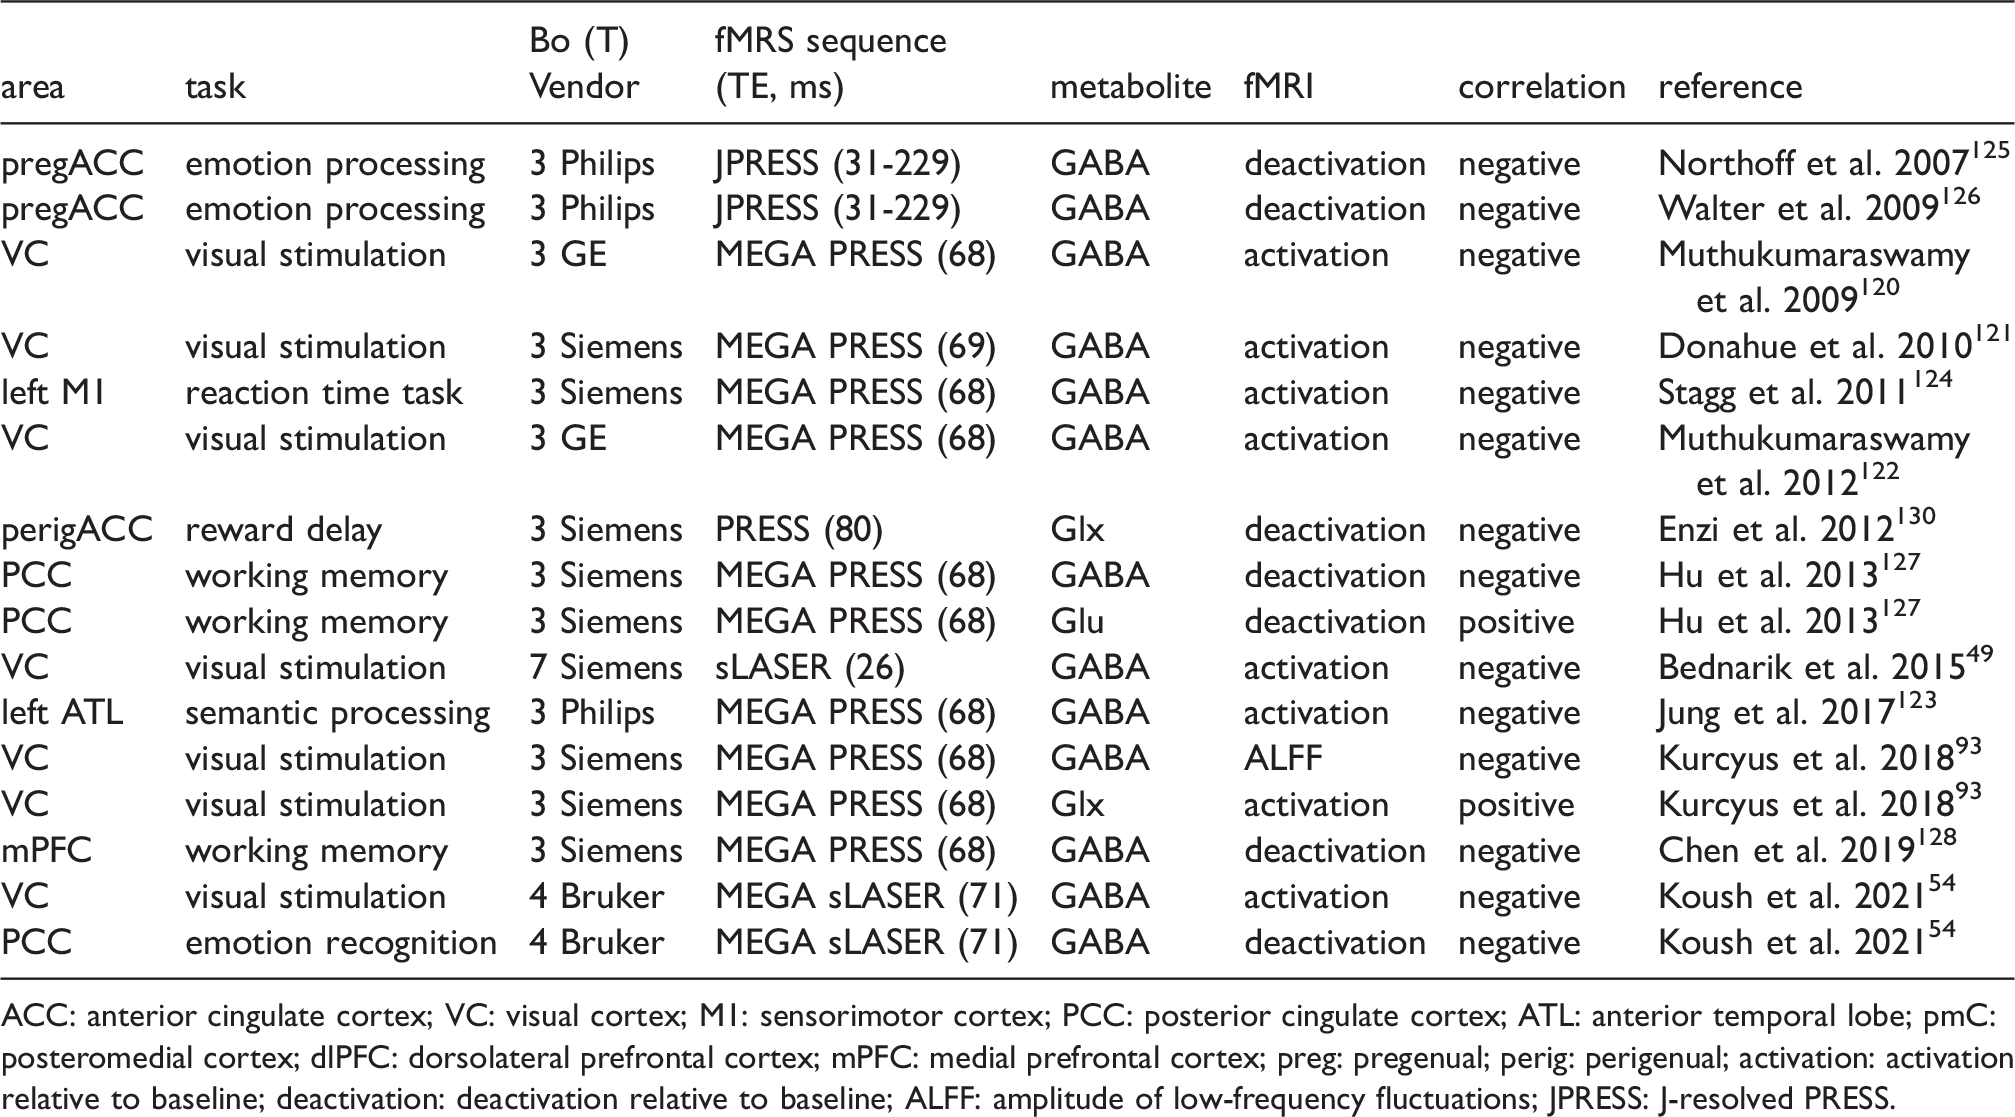
ACC: anterior cingulate cortex; VC: visual cortex; M1: sensorimotor cortex; PCC: posterior cingulate cortex; ATL: anterior temporal lobe; pmC: posteromedial cortex; dlPFC: dorsolateral prefrontal cortex; mPFC: medial prefrontal cortex; preg: pregenual; perig: perigenual; activation: activation relative to baseline; deactivation: deactivation relative to baseline; ALFF: amplitude of low-frequency fluctuations; JPRESS: J-resolved PRESS.
The relationship between resting-state glutamate (Glx) and local BOLD response and/or connectivity between brain areas/networks is less prominent than for GABA (Tables 2 and 3). For the same brain area, higher individual resting-state glutamate (Glx) was associated with more deactivation in pregenual ACC during monetary reward incentive delay task, 130 with less deactivation in PCC during working memory task, 127 and with more activation in VC during visual stimulation. 93 In addition, for different brain areas, higher individual perigenual ACC resting-state Glx is associated with larger activation in subgenual ACC during emotional faces viewing. 131 Individual variability of resting-state dorsal ACC glutamate is related to cognitive control. 132 Specifically, lower individual glutamate levels are associated with higher BOLD response in retrosplenial cortex, orbitofrontal cortex, inferior parietal lobe, and basal ganglia during high-demand dichotic listening. Conversely, higher glutamate levels are associated with larger BOLD response in the same brain areas during low-demand dichotic listening.
Combined fMRI and MRS for various brain regions shows correlations between basal GABA/Glx/glutamate level and functional connectivity estimates.
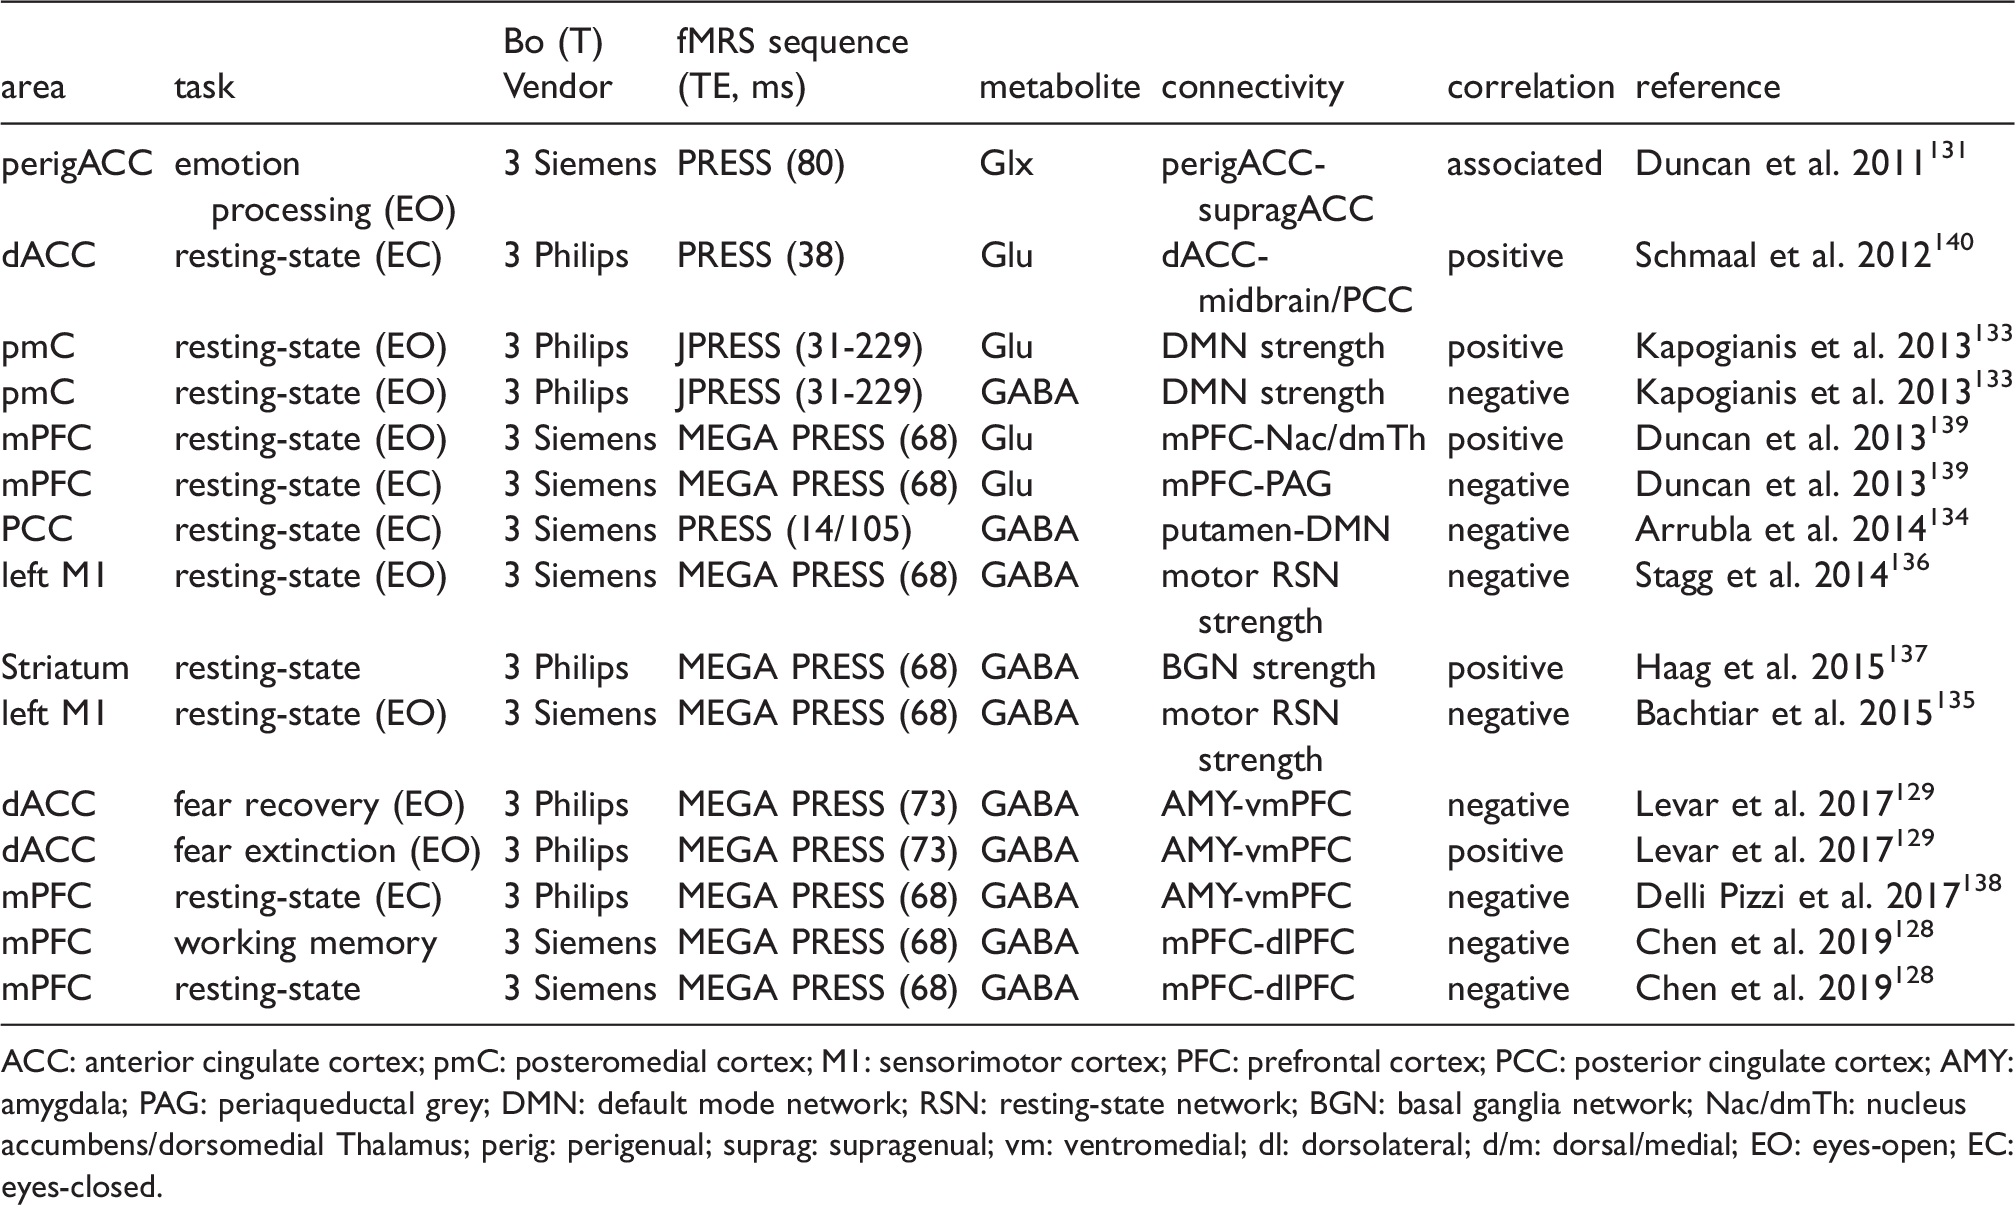
ACC: anterior cingulate cortex; pmC: posteromedial cortex; M1: sensorimotor cortex; PFC: prefrontal cortex; PCC: posterior cingulate cortex; AMY: amygdala; PAG: periaqueductal grey; DMN: default mode network; RSN: resting-state network; BGN: basal ganglia network; Nac/dmTh: nucleus accumbens/dorsomedial Thalamus; perig: perigenual; suprag: supragenual; vm: ventromedial; dl: dorsolateral; d/m: dorsal/medial; EO: eyes-open; EC: eyes-closed.
In additional to local BOLD responses, inter-individual resting-state GABA and glutamate levels are associated with functional connectivity estimates between specific brain areas, within resting-state networks and between different networks. Inter-individual resting-sate GABA levels in posteromedial cortex correlated negatively with functional connectivity strength of default mode network, DMN, 133 and GABA levels in PCC correlated negatively with the connectivity strength between putamen and DMN. 134 In sensorimotor cortex (M1), GABA level correlated negatively with the connectivity strength of motor resting-state network (RSN),135,136 whereas in striatum, GABA level correlated positively with the connectivity strength of basal ganglia network (BGN). 137 Inter-individual resting-state GABA levels in dorsal ACC correlated negatively with effective connectivity strength between amygdala and deactivated ventromedial PFC during fear recovery and correlated positively with effective connectivity strength between amygdala and activated ventromedial PFC during fear extinction, as assessed by psychophysiological interaction (PPI). 129 Inter-individual resting-state GABA level in medial PFC correlated negatively with anti-correlation between dorsomedial PFC, the DMN node, dorsolateral PFC and the control network (CN) node during rest and during working memory task. 128 In addition, inter-individual resting-state medial PFC GABA levels correlated negatively with negative functional coupling between amygdala and ventromedial PFC. 138
Inter-individual resting-state glutamate levels in medial PFC correlated positively with functional connectivity between medial PFC and nucleus accumbens (NAc) and between medial PFC and dorsomedial thalamus (dmTh), as well as correlated negatively with functional connectivity between medial PFC and periaqueductal grey (PAG). 139 In dorsal ACC, glutamate correlated positively with functional connectivity between dorsal ACC and midbrain and between dorsal ACC and PCC, 140 while in posteromedial cortex glutamate correlated positively with functional connectivity strength of DMN. 133 Inter-individual resting-state glutamate levels in perigenual ACC have been implicated in the interaction (effective connectivity assessed using PPI) between task-negative perigenual ACC and task-positive supragenual ACC during emotion processing task. 131
In summary, these studies show that, regardless of the region and type of stimuli, basal tissue levels of glutamate (or Glx) and GABA impact the BOLD response reciprocally, suggesting that the resting tissue levels may reflect their excitatory and inhibitory neurotransmitter levels underlying brain activity, connectivity and the reproducibility of BOLD changes. Further investigations that link the MRS measurement of tissue glutamate and GABA to their neurotransmitter levels are critically needed.
J-edited difference MRS advances for multiple metabolites and brain areas
Conventional JDE MRS targets a single metabolite of interest at a single brain location and time, which could require 8-10 min per experimental observation/condition, substantially limiting the number of target metabolites per fMRS experimental session. An approach that bypasses this limitation is the use of Hadamard encoding, 141 which facilitates efficient MRS data acquisition. When applied to multivolume/multifrequency localizations, Hadamard encoding substantially reduces total scan time without compromising SNR. 9 It can be used with spectral editing when applied to frequency selective refocusing pulses given single voxel localization, such as PRESS, sLASER and SPECIAL. 142 For example, Hadamard Encoding and Reconstruction of MEGA-Edited Spectroscopy (HERMES) allows simultaneous detection of two spin systems by acquiring four experiments with different combinations of editing pulses: (A) ON, ON; (B) ON, OFF; (C) OFF, ON; and (D) OFF, OFF (Figure 4(a)). 143 The acquired data are then combined (A–B + C–D and A + B – C – D) to separate overlapping resonances without compromising SNR and scan time, as compared to sequential JDE MRS for individual molecules. HERMES was used to separate GABA and glutathione,142,144 and N-acetylaspartate (NAA) and N-acetylaspartylglutamate (NAAG). 143 Also, it has the potential to segregate more than two target spin systems with comparable quality to MEGA-PRESS JDE spectra, under the condition that the target resonances are separated by more than the bandwidth of the editing pulses, such as the 1H resonances of NAA, NAAG and aspartate molecules. 143 The A + B + C +D combination consists of spectra at full SNR, largely unaffected by editing pulses and can be used for whole-spectrum quantification. HERMES results in co-editing of molecules, like that of MEGA-PRESS, providing Glx in the GABA-glutathione JDE spectrum. To segregate multiple low concentration metabolites at 3.0T, a Hadamard-encoded editing scheme was combined with multiplexed linear-modeling using simulated basis functions, i.e., Hadamard editing resolves chemicals using linear-combination estimation of spectra (HERCULES). 145 The HERCULES editing scheme is based on four experiments (TE = 80 ms) and combinations of three editing pulses at 1.9 ppm (targeting GABA and 2-hydroxyglutarate), 4.18 ppm (targeting ascorbate, aspartate, lactate), and 4.58 ppm (targeting glutathione and NAAG). Three spectral combinations, A + B + C +D, A–B + C–D, A + B – C – D, are quantified simultaneously. Thus, the HERCULES technique allows for the quantification of multiple coupled metabolites in the same scan time that would be required for segregation of a single metabolite. Specifically, the quantified metabolites include ascorbate, aspartate, GABA, glutathione, NAAG and lactate along with choline, creatine, myo-inositol, glutamate, glutamine, 2-hydroxyglutarate (elevated in some tumors), and co-edited Glx. Note that 2D J-resolved spectroscopy (2D JRES) 146 detects various scalar coupling resonances and has been successfully used to study associations between localized GABA levels and BOLD response. 125 However, besides the required longer acquisition time that does not fit the typical fMRS block design, the resolving power of in vivo 2D JRES is limited in, e.g., resolving GABA from creatine and macromolecules. When focused on a single metabolite (e.g., GABA) the use of JDE is recommended, whereas JRES is more appropriate to establish an entire steady-state metabolic profile.
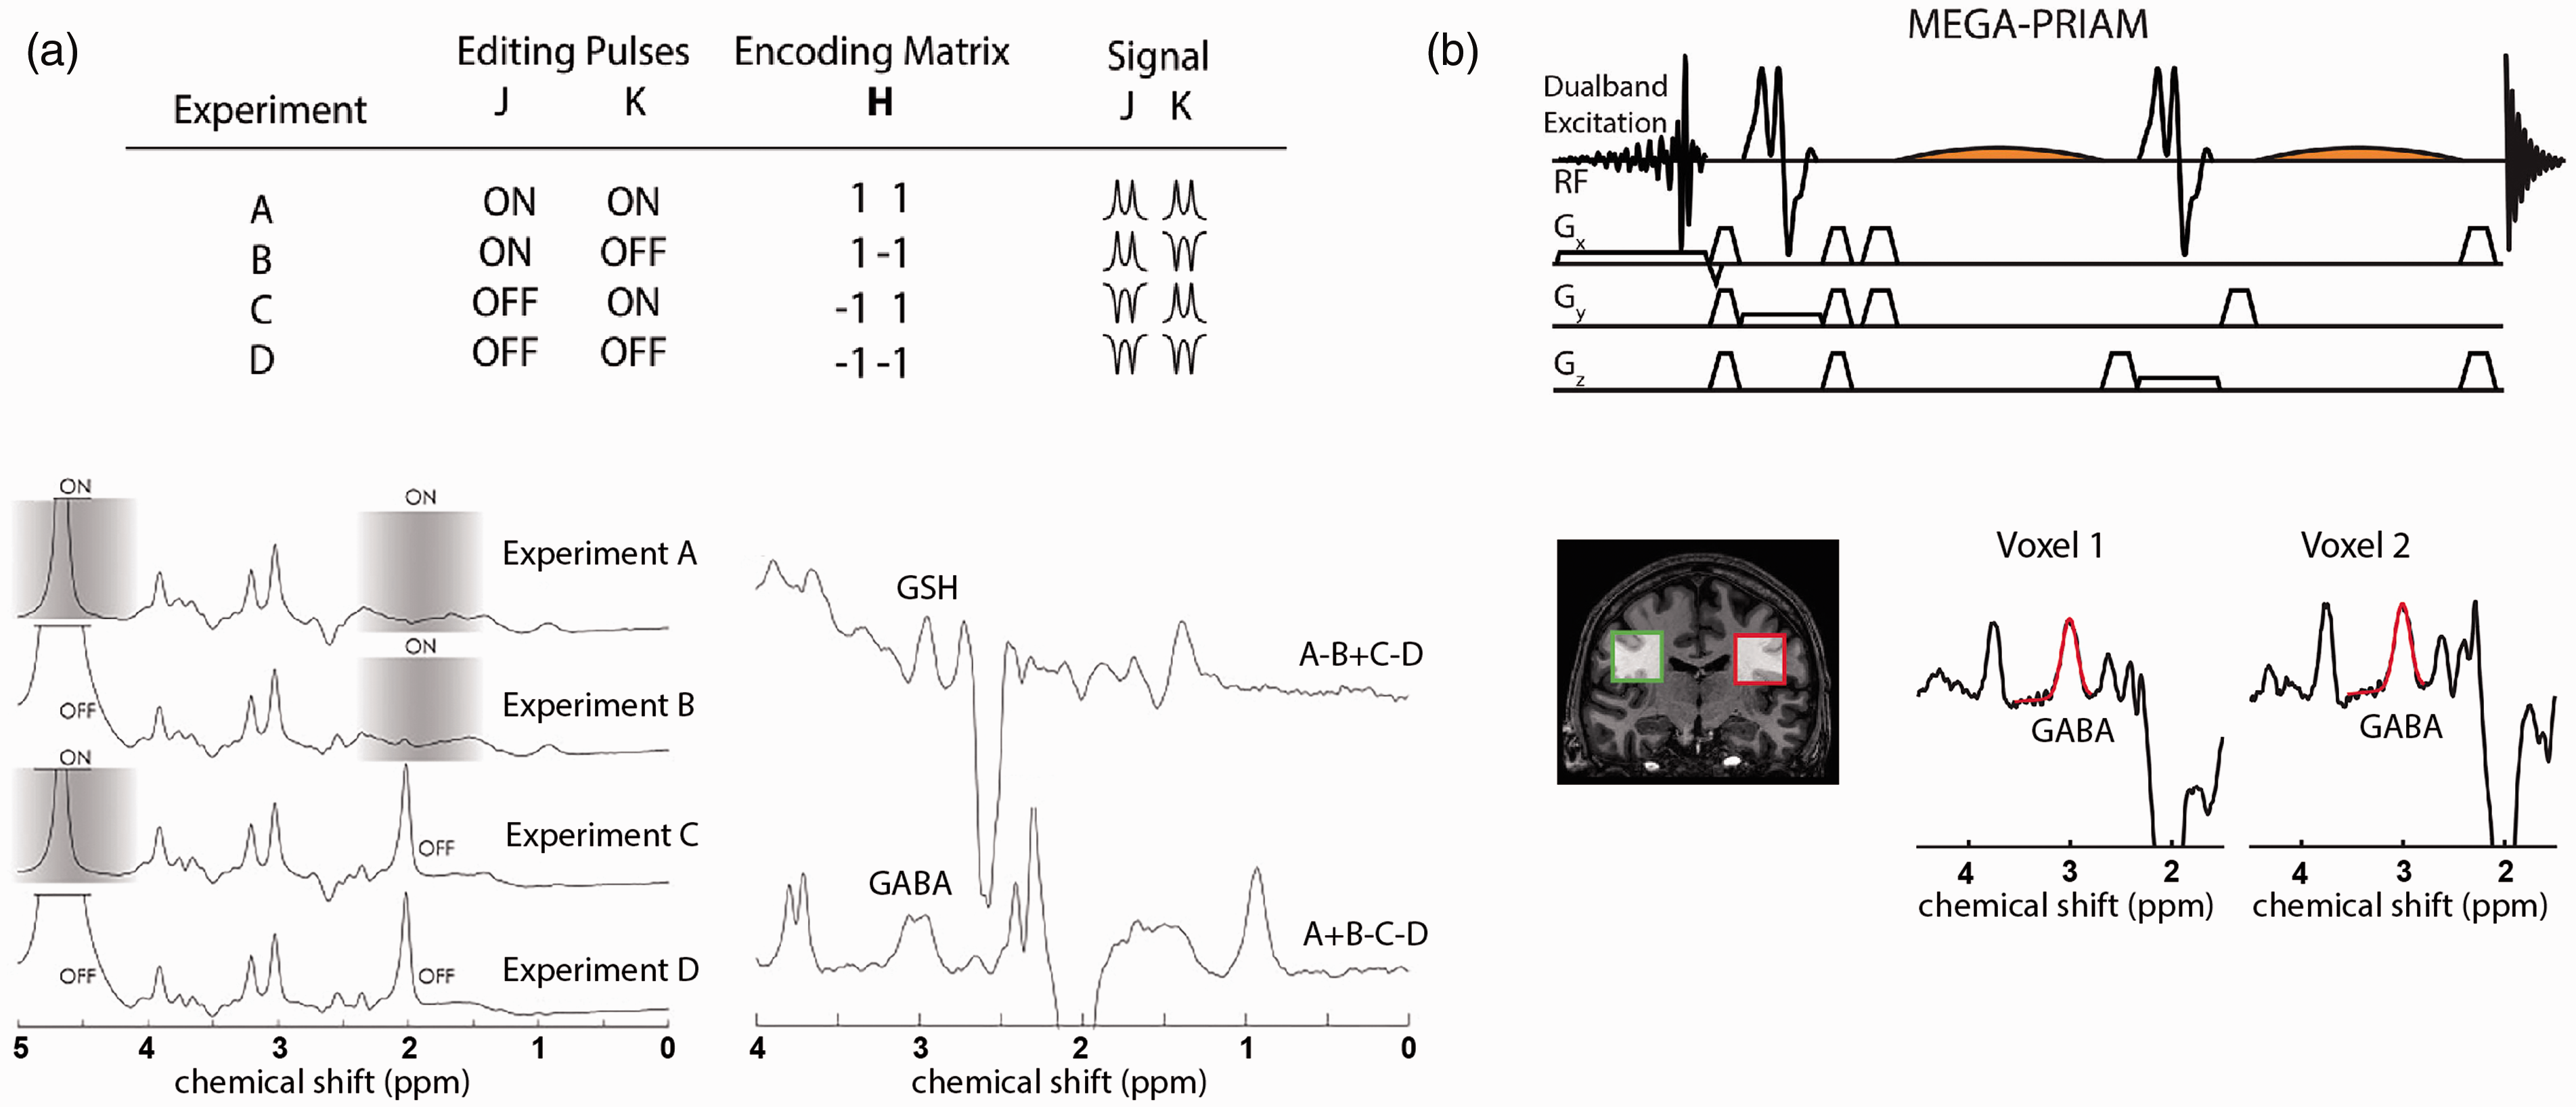
Methodological advances for JDE MRS in the human brain. (a) Single-subject Hadamard encoded JDE spectra with four step J-editing scheme of applied frequency-selective pulses (shaded grey blocks) for two target molecules. The combination of Hadamard experiments efficiently separates overlapping GABA and GSH resonances. (b) Simultaneous acquisition of JDE spectra from two simultaneously excited voxels has been shown feasible at 3T using a combination of MEGA-PRESS JDE with parallel reconstruction of accelerated multivoxel (PRIAM) acquisitions. Panel (a) is modified from Chan et al. 143 and Saleh et al. 142 with permission. Panel (b) is modified from Oeltzschner et al. 147 with permission.
There are intense efforts to improve spatial information content of JDE MRS and to accelerate acquisition, which could be achieved by extending the number of simultaneously scanned voxels and by incorporating the JDE MRS advances in the MRS imaging (MRSI) pulse sequences. Specifically, parallel reconstruction in accelerated multivoxel (PRIAM) MRS has been developed as a means of extending the conventional single-volume MEGA-PRESS sequence to a dual-volume sequence by incorporating dual-band excitation pulses and parallel reconstruction (Figure 4(b)). 147 Applied parallel reconstruction was based on the spatial sensitivity encoding of the multichannel phase-array coil (SENSE). 148 SENSE reconstruction performs well for multichannel coils, as compared to coils with fewer channels, due to the less overlap between sensitivity profiles of the receive coil elements. SENSE cannot be performed for single-channel receive coils. To overcome this limitation, spatial Hadamard encoding has been implemented for the dual-voxel localization by applying gradient pulses during frequency-selective editing pulses. 149 This method could be used both for single- and multichannel receive coils without SNR loss and coil geometry limitation. The placement of voxels in dual-voxel localization approaches is limited by a few factors, namely, editing efficiency linked to editing frequency and distance between voxels, single-slice dual-band excitation, voxel geometry and suboptimal shimming of an area covering both voxels, which could be compromised by reasonable voxel placement and methodological advances such as multiband slice-selective pulses and separate voxel shimming.147,150 Importantly, spatial acceleration based on multivolume approaches could be combined with Hadamard encoding schemes for multiple metabolites, such as HERMES and HERCULES. It has also been suggested that multivoxel MRS acquisitions can be greatly accelerated by combining PRIAM and HERMES for improved MRS efficiency. 147 In addition, spatial GABA acquisitions were performed using MEGA LASER JDE with spiral-encoded 3D-MRSI at 3.0T 151 and GABA-glutathione MEGA PRESS using HERMES editing with MRSI at 3.0T, 152 which is a promising approach for mapping multiple low concertation metabolites (for studies on JDE MRS and MRSI methods, see reviews153,154) The feasibility of detecting lactate functional changes using a single voxel, long TE (144 ms) sLASER sequence has been recently demonstrated for VC during visual stimulation at 7.0T (Figure 5). 74 This method is similar to the editing OFF experiment in lactate JDE MRS,53,54,119 however, it benefits from the high quality sLASER localization at ultra-high magnetic field as compared to the long TE fMRS studies.31,38,42,43
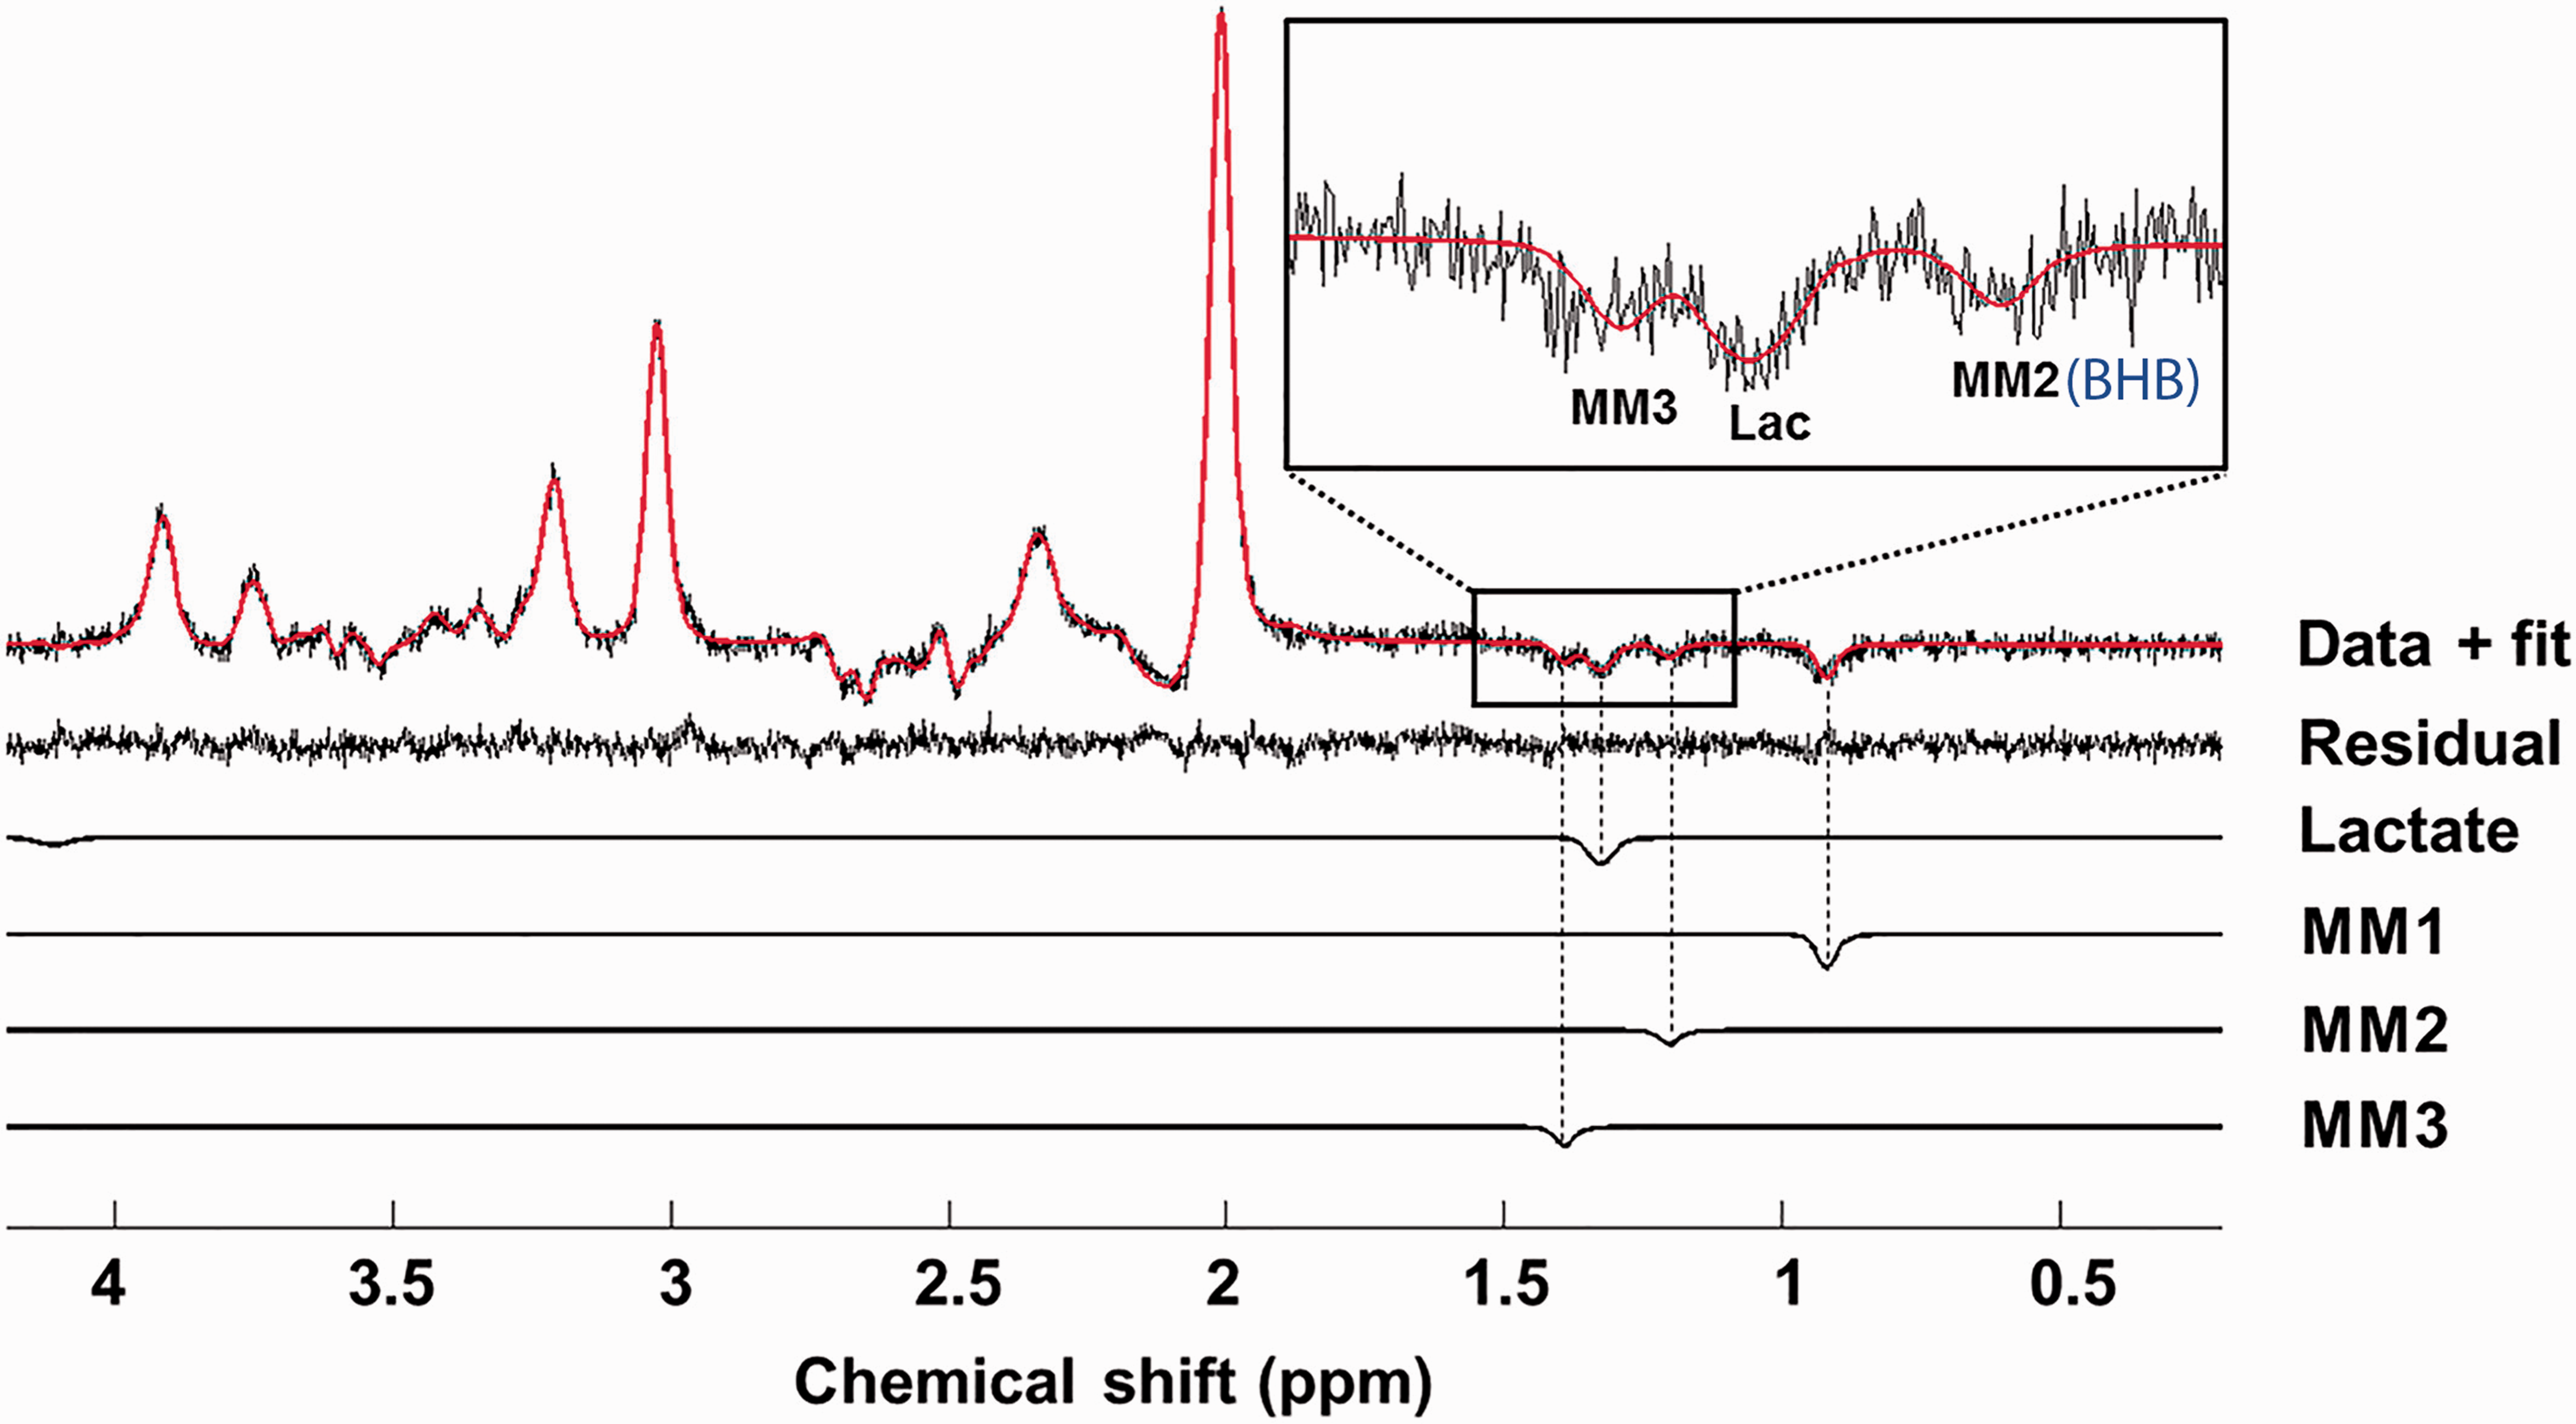
Single subject long TE semi-LASER data and fit for lactate fMRS at 7 T. This data acquisition is similar to editing OFF experiment in lactate JDE MRS acquisitions.53,54,119 However, in comparison to J-difference spectrum, this method has a lower SNR which may not be sufficient for applications at lower magnetic fields. Macromolecules MM1-MM3 were modelled as Lorentzian peaks, 74 yet as it has been recently shown, the MM2 at 1.20 ppm contains the BHB resonance.53,54,119 The figure is modified from Fernandez et al. 74
Combined fMRI-fMRS and real-time water proton fMRS
Functional changes in low SNR metabolites of low concentration can be consistently interpreted if the concomitant BOLD response is measured in the selected spatial location, experimental design and tasks. In most fMRS studies, whole-brain fMRI is used as localizer to identify individual brain (de)activation clusters for placement of the single fMRS voxel. In some cases, single fMRS voxels could be placed based on the structural scan alone (Table 1). Because fMRS requires prolonged experimental condition and baseline blocks to gain sufficient SNR for low concentration metabolites, identical fMRI runs are needed to justify the fMRS findings. Concomitant fMRI and fMRS scans during functional studies can provide the possibility to justify and interpret modulations of neurochemistry in relation to hemodynamic alterations and help understand underlying excitatory-inhibitory neuromodulation, neuroenergetics and potentially other yet unknown metabolic mechanisms supporting localized functional changes.49,54–56,93,105 Nevertheless, task-induced changes in tissue metabolite levels cannot be directly related to altered fluxes in energy metabolism and neurotransmitter cycling, which would require multimodal measurements, e.g. 1H-MRS and 13C-MRS or PET.
Conventional fMRI is based on fixed TE observations from the unsuppressed water resonance. In contrast, in fMRS acquisitions of metabolites, the water signal, which is several orders of magnitude larger than the metabolites of interest, is suppressed. However, the BOLD response from the single fMRS voxel could be evaluated using the whole free induction decay (FID) of unsuppressed water resonance.67,68,155,156 Ideally, from an fMRS perspective, the stimulation-induced BOLD response should be evaluated from the same single voxel using the same localization and shimming parameters. This was demonstrated for the first time at 3.0T using a long TE asymmetric PRESS sequence, whereby water was acquired interleaved with water-suppressed metabolite acquisitions (TE = 105 ms, TR = 1500 ms per each water suppressed and unsuppressed acquisition). 84 Thus, assessing water suppressed and unsuppressed fMRS data using the same long TE is feasible. However, it could be suboptimal in terms of the water FID sensitivity to BOLD modulations, because of the reduced FID magnitude and thereby potentially reduced T2* fitting precision, as compared to the whole FID acquired at short TE.
To concomitantly acquire BOLD-weighted water and J-edited metabolite responses to (de)activation, a diffusion-weighted STEAM sequence for fMRI (TE = 20 ms, mixing time TM = 10 ms, 410 ms delay) was interleaved with MEGA sLASER JDE sequence for GABA and lactate fMRS (TE = 71 ms for GABA, TE = 144 ms for lactate, TR = 2700 ms) (Figure 6(a)). 54 The diffusion weighting (b-value = 1400 s/mm2, TR = 2700 ms) was applied to reduce intravascular BOLD effects. To provide the functional whole-brain/slab hemodynamic along with metabolite estimates, a conventional fMRI sequence using gradient-echo echo planar imaging (3D EPI; TE = 30 ms, TR = 40 ms, 250 ms delay), was interleaved with fMRS spectra acquisitions using short TE sLASER at 7.0T (TE = 36 ms, TR = 4000 ms) (Figure 6(b)).55,56 In principle, any fMRI or fMRS techniques could be interleaved given the availability of vendor/custom pulse sequences. Concomitant fMRI-fMRS acquisitions have a temporal shift between fMRI and fMRS acquisitions conditioned by their repetition times and a delay in-between to acquire the FID 54 or to minimize potential eddy current effects from EPI read-out.56,157
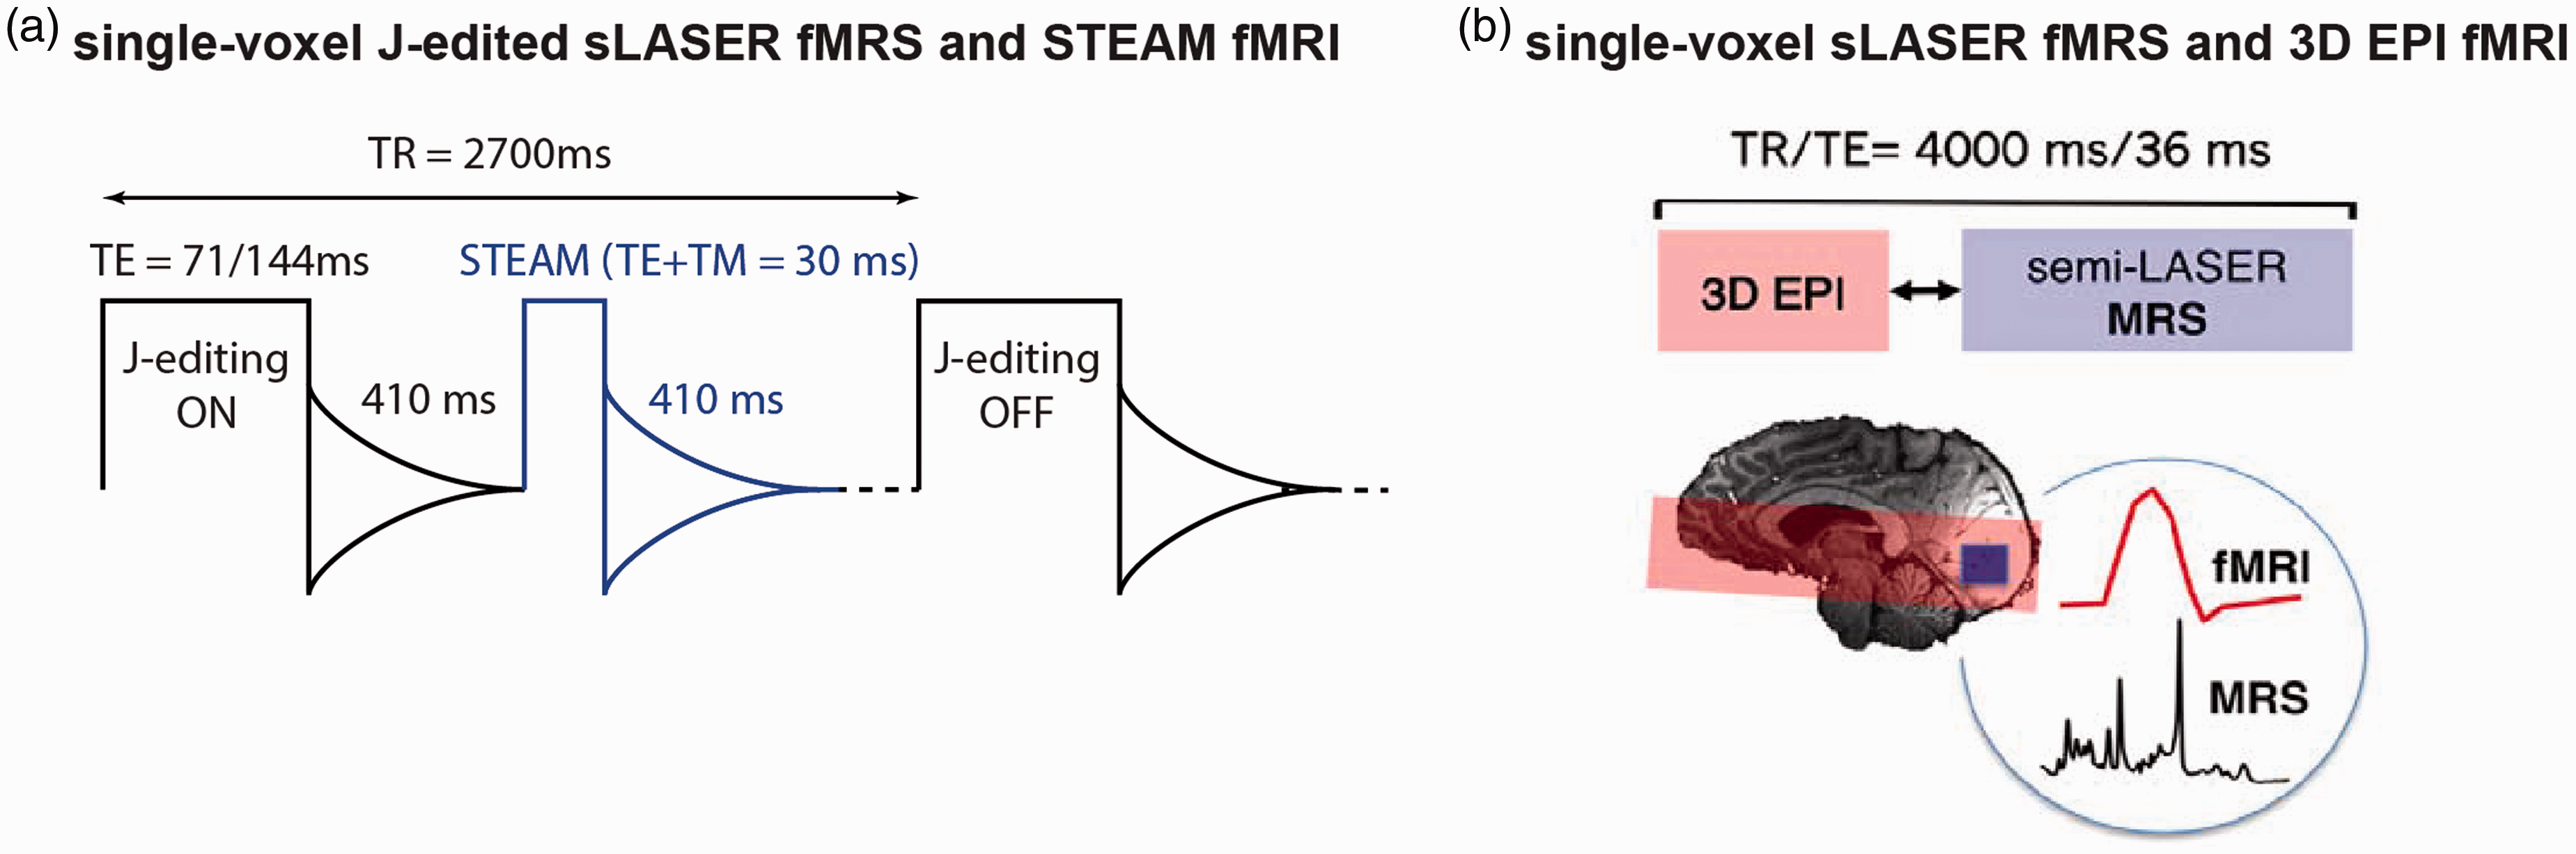
Combined fMRI and fMRS sequences for simultaneous hemodynamic and metabolic observations. (a) To concomitantly acquire single voxel water 1H for BOLD responses and metabolite 1H for metabolic responses, unsuppressed water 1H acquisitions (fMRI) could be interleaved with water-suppressed 1H MEGA-sLASER JDE (fMRS). 54 For fMRS, short TE MRS or JDE MRS for single or multiple metabolites could be used. Water spectra could be acquired using single voxel short TE MRS without water suppression, e.g., using STEAM 163 with diffusion weighting to reduce intravascular BOLD effects (diffusion gradient b = 1400 s/mm2, 410 ms delay from preceding free induction decay). (b) Partial brain coverage BOLD-fMRI by conventional GE EPI sequence could also be efficiently interleaved with single voxel short TE sLASER 1H MRS.55,56 Panel (b) is modified from Ip et al. 56
A potential application of real-time water and J-edited fMRS, as well as interleaved fMRI-fMRS, could be in neurofeedback studies based on BOLD signal. Neurofeedback enables individuals to learn a volitional control of brain circuits implicated in specific behaviors or pathology. 158 Conventional fMRI is based on indirect T2* mapping at fixed TE. However, tissue T2* can vary across brain regions and individuals and can be biased by macrovasculature signals at ultra-high magnetic field. Therefore, direct single voxel T2* estimation based on real-time, short TE PRESS fMRS was proposed to estimate individual (and more physiologically plausible) neurofeedback using the unsuppressed water FID at 3.0T (TE = 30 ms, TR = 1000 ms) and 7.0T (TE = 20 ms, TR = 1000 ms).67,68,156 Neurofeedback signal was provided to individuals at each repetition time and was based on real-time water spectra preprocessing and T2*-based feedback estimates. For visual and motor cortices, BOLD sensitivity of direct T2* estimates was compared to conventional gradient echo EPI acquisitions at 3.0T and 7.0T 68 and across different T2* estimation algorithms. 156 The demonstrated feasibility of real-time water fMRS suggests an efficient application of concomitant real-time fMRI-fMRS measurements for neurofeedback research and therapy, benefiting from joint hemodynamic and neurometabolic underpinnings.
Conclusion and future outlook
We reviewed up-to-date fMRS studies, demonstrating that fMRS can be used to investigate metabolic underpinnings of human brain function by measuring metabolic alterations at 3.0T and higher. Non-invasive in vivo assessment of metabolites, like GABA, glutamate, glucose, lactate, glutathione and BHB using fMRS is important for understanding and interpreting brain function in health and disease, providing neurobiological insights into mechanisms underlying excitatory and inhibitory neuromodulation, cerebral blood flow and energy metabolism. Recent fMRS findings demonstrate improved consistency in measurements of basal metabolite levels and their changes, due to progressive improvements of methods benefiting from transition to ultra-high magnetic field and advanced MRI/MRS sequence designs. Short and ultra-short TE spectra acquisitions remain the most common approach for fMRS at 7.0T. Nevertheless, intrinsic elimination of overlapping resonances with JDE MRS and accurate quantification of appropriate metabolites has been shown feasible for fMRS, improving metabolite quantification, especially at the magnetic field below 7.0T (Tables 1 and 2). While MRI at ultra-high magnetic fields improves SNR and has superior tissue contrast, the MRS at ultra-high magnetic field has improved spectral SNR and chemical shift separation, thereby allowing very dilute metabolites to be measured.57,88,159 Particularly for JDE MRS, ultra-high field increases the ability to resolve overlapping multiplets of J-coupled resonances, contributing to superior spectral quantification. These sensitivity and specificity improvements with ultra-high field allow for smaller physiological and functional effects to be detected. However, acquisitions at ultra-high magnetic field also increases the challenges related to non-uniform RF fields, magnetic susceptibility artifacts, higher RF energy deposition to the tissue, and the requirement for novel magnetic field shimming approaches within spectroscopic voxels. 88
Due to intrinsic quantum mechanical properties of some target metabolites, JDE MRS at 3.0T has the potential to improve quantitation of fMRS accuracy and replicate metabolic functional changes observed using short TE fMRS at ultra-high field. Recent methodological advances in JDE MRS could be translated to JDE fMRS, such as MR sequence pulse designs for reduction of co-edited lipids/macromolecules,92,95,96 and advanced editing schemes for quantification of multiple metabolites at 3.0T and 7.0T. When combined with efficient localization approaches, novel JDE schemes could be used in fMRS to segregate multiple metabolites from two voxels simultaneously or from multiple MRSI voxels. JDE fMRS could also extend the number of functionally relevant low concentration metabolites and potentially operate at lower levels of neural (and metabolic) activity. 54 JDE MRS has been shown feasible for highly demanding measurements of glutathione at 3.0T142,152 and 7.0T, 144 BHB at 4.0T,53,54 and glucose at 7.0T, 160 emphasizing the potential of JDE fMRS in future studies at 3.0T and 7.0T.
While short-TE MRS is largely considered as the method of choice for 7.0T fMRS, JDE-based MRS can be effectively applied for fMRS at lower magnetic field of 3.0T, thereby substantially increasing the capacity of fMRS methods applied for fundamental and clinical research. Moreover, using 7.0T JDE-based fMRS functional changes in neurotransmitters and neuroenergetics could be observed with significantly improved temporal resolution. 92 We foresee that fMRS observations of functional metabolite alterations will benefit from both low and ultra-high magnetic fields, as well as from both (ultra-)short and JDE MRS methods. To avoid ambiguities regarding effects of habituation from prolonged activations, it is highly recommended to combine fMRS acquisitions with BOLD-based fMRI and even calibrated fMRI 164 for the same paradigm and apply concurrently fMRI-fMRS experiments. Concomitant fMRI-fMRS pulse sequences will provide complementary data for interpretations of hemodynamic and neurochemical alterations associated with excitatory-inhibitory neuromodulation by means of Glu/Gln/GABA levels, and neuroenergetics by means of Glc/Lac levels, both in health and disease. Technological advances of multimodal MRI-PET scanners can further increase the information from neuroimaging.1,11,24 Finally, real-time water proton fMRS and/or combined fMRI-fMRS acquisitions could be used to provide tissue-specific neurofeedback signal and/or neurofeedback signal accompanied with metabolic observations.
Footnotes
Funding
The author(s) disclosed receipt of the following financial support for the research, authorship, and/or publication of this article: Supported by the National Institutes of Health (R01 NS-100106, R01 MH-067528).
Declaration of conflicting interests
The author(s) declared no potential conflicts of interest with respect to the research, authorship, and/or publication of this article.