
Abstract
Neuroimaging with functional MRI (fMRI) identifies activated and deactivated brain regions in task-based paradigms. These patterns of (de)activation are altered in diseases, motivating research to understand their underlying biochemical/biophysical mechanisms. Essentially, it remains unknown how aerobic metabolism of glucose to lactate (aerobic glycolysis) and excitatory-inhibitory balance of glutamatergic and GABAergic neuronal activities vary in these areas. In healthy volunteers, we investigated metabolic distinctions of activating visual cortex (VC, a task-positive area) using a visual task and deactivating posterior cingulate cortex (PCC, a task-negative area) using a cognitive task. We used fMRI-guided J-edited functional MRS (fMRS) to measure lactate, glutamate plus glutamine (Glx) and γ-aminobutyric acid (GABA), as indicators of aerobic glycolysis and excitatory-inhibitory balance, respectively. Both lactate and Glx increased upon activating VC, but did not change upon deactivating PCC. Basal GABA was negatively correlated with BOLD responses in both brain areas, but during functional tasks GABA decreased in VC upon activation and GABA increased in PCC upon deactivation, suggesting BOLD responses in relation to baseline are impacted oppositely by task-induced inhibition. In summary, opposite relations between BOLD response and GABAergic inhibition, and increases in aerobic glycolysis and glutamatergic activity distinguish the BOLD response in (de)activated areas.
Keywords
Introduction
In functional MRI (fMRI) studies with cognitive or sensory stimuli, a task-positive brain area has been defined as an area where the blood oxygenation level dependent (BOLD) signal is greater during the experimental epoch vs. the baseline (or resting) block, whereas a task-negative brain area is where the BOLD response is larger during resting vs. task periods. 1 In the human brain, these task-positive and task-negative brain areas roughly occupy equal swathes of the cerebral cortex. 2 Examples of task-positive areas include the motor cortex (MC), visual cortex (VC), and anterior cingulate cortex (ACC). Prominent task-negative brain areas are observed within the default mode network (DMN), where posterior cingulate cortex (PCC) is a major area. There is a large body of evidence from fMRI studies that DMN is implicated in various brain diseases. 1 We suggest that applied task distinguishes the definition of task-positive and task-negative brain areas, such as VC could be activated by whole-screen flashing checkerboard3–5 as well as deactivated by small flashing checkerboard3,6 and visual-spatial attention.7,8
The BOLD signal indirectly represents neuronal activity. Studies in primates have shown that sensory-evoked BOLD response in cortex correlates with synaptic activity and neuronal firing. 9 Studies conducted in rodents further revealed that the sensory-evoked BOLD cortical response relies on voltage-dependent sodium channel activity10,11 in an energy-dependent manner.12,13 Localized change in neuronal activity depends on the interplay between excitatory and inhibitory cellular activities, where glutamate and γ-aminobutyric acid (GABA) are the major respective neurotransmitters.14,15 Energy production from aerobic glycolysis, which refers to the metabolism of glucose to lactate in the presence of oxygen, is important at rest.16,17 A task-induced increase in aerobic glycolysis may lead to a rise in lactate and fall in glucose,18,19 and this change can serve as the basis of its measurement by functional MRS (fMRS). Lactate, however, is also a potential source of energy production through its oxidation, in addition to glucose,19,20 and may also serve as a novel signaling molecule for slow volume conduction. 21
Whereas water protons detected in fMRI studies expose BOLD correlates of neural (de)activation, metabolite protons measured in functional MRS (fMRS) scans provide metabolic changes underlying the fMRI response.22,23 Optimized fMRS methodology, primarily using short echo-time (TE) 1H-MRS protocols without J-editing, has consistently revealed activation-induced changes in various metabolites in the human brain.4,5,24–27 Most consistently, BOLD activation of VC and MC is associated with increases of glutamate and lactate, and decreases of glucose and aspartate. Whereas BOLD activation of VC is also associated with a decrease in GABA,25,28 BOLD deactivation of VC is associated with decreases of glutamate, lactate, and GABA. 3 Finally, basal GABA levels are negatively correlated with the BOLD response in various regions, including ACC, 29 PCC, 30 VC,5,31–33 and anterior temporal lobe. 34
While the short TE 1H-MRS protocol without J-editing has high signal-to-noise ratio (SNR), exact appraisal of changes in metabolites like lactate, glutamate and glutamine (Glx), and GABA depend on separation of overlapping signals from lipids and/or macromolecules. Homonuclear J-editing can selectively detect these metabolites. 35 J-edited fMRS changes in lactate were initially reported even at relatively low magnetic field of 2.1 T. 22 More recently, J-edited fMRS detected task-induced modulations of lactate in MC at 4 T, 36 and GABA and Glx in VC at 3 T 33 and 7 T. 28 In addition, combined fMRI-fMRS with short-echo fMRS has been shown feasible to simultaneously detect BOLD and metabolic changes during VC activation at 7 T.27,37
The studies mentioned above highlight the complex metabolic underpinnings of BOLD activation and deactivation. Improved understanding of metabolic differences across various (de)activation brain areas involved in normal cognition will shed light on their modifications in neurological and neuropsychiatric disorders. We therefore investigated the metabolic nuances in a task-positive area (VC activated by a visual task) and a task-negative area (PCC deactivated by a cognitive task) in healthy volunteers. We report that task-induced increases in aerobic glycolysis and glutamatergic activity occur in VC activation, but not in PCC deactivation. In addition, VC and PCC have opposite relations with BOLD response and GABAergic inhibition. These results feature the power of concurrent fMRI-fMRS scans to separate the metabolic specialties of (de)activated brain areas.
Material and methods
Participants
Twenty healthy volunteers (right-handed, 10 male, age 29 ± 8.5) participated in the experiment that consisted of one fMRI session and two fMRI-fMRS sessions spanning over 3 days. All participants gave their written consent to participate in the study approved by the Yale University Human Investigation Committee, which operates in accordance with the Belmont Report and Declaration of Helsinki. The experiments were performed at the Magnetic Resonance Research Center on a 3 T Siemens Prisma scanner using 64-channel head/neck coil and a 4 T Bruker spectrometer using a single-channel quadrature surface head coil. Prior to the study onset, participants received written instructions about visual and cognitive tasks they will perform, (f)MRI and concurrent fMRI-fMRS data acquisitions, and requirements during scanning (breathe steadily and remain still).
Experiments
The first experimental session consisted of whole-brain fMRI runs on a 3 T Siemens Prisma scanner. We performed two fMRI runs that consisted of three interleaved baseline and condition blocks (Figure S1(a), 162 s block duration, 16.4 min in total). For VC activation, participants performed a classical visual paradigm. During condition blocks, the whole-screen flashing checkerboard was used (8 Hz, visual angle 15 × 18°). During baseline blocks, a grey dot was displayed in the center of the screen. During condition and baseline blocks, subjects were asked to fixate the grey dot in the center of the screen and press a response button when the dot’s color changed to green. 38 For PCC deactivation, participants performed a cognitive paradigm. During condition blocks, they listened to short sentences of audio-emotion portrayals taken from the GEMEP Core Set 39 with eyes closed, and were asked to press the response button each time a specific emotion, contempt, disgust or surprise, was identified (2-3 times per activation block; participants were unaware of number of target stimuli). During baseline blocks, participants rested with their eyes closed. The second and third daily sessions consisted of two VC and two PCC single-voxel fMRI-fMRS runs on a 4 T Bruker spectrometer with paradigms and timing identical to the whole-brain fMRI runs, respectively. Note that single-voxel VC fMRI-fMRS data were collected only for the activation task, whereas single-voxel PCC fMRI-fMRS data were collected only for the deactivation task. Although acquired whole-brain fMRI data could allow for VC and PCC observations in both tasks, consistently with fMRI-fMRS data, we focused on fMRI VC and fMRI PCC data for activation and deactivation tasks, respectively. Foam paddings were placed around the subject’s head inside the head-coils to minimize head motion. Visual stimuli and instructions were displayed using a rectangular projection screen at the rear of the scanner bore.
fMRI and fMRI-fMRS data acquisitions
At the beginning of the 3 T Siemens Prisma scanning session a T1-weighted structural image (3 D MPRAGE, voxel size = 1mm3 isotropic, flip angle α = 8°, TR = 1900 ms, TI = 900 ms, TE = 2.96 ms, GRAPPA, iPAT = 3), and spin-echo field maps for geometric distortion correction (TE = 68.4 ms, 64 slices volume, voxel size = 2.2mm3 isotropic, TR =7326 ms, flip angle = 90°, bw = 2000 Hz/pixel) were acquired. For whole-brain fMRI runs, we used T2*-weighted EPI sequence with 654 repetitions (TR = 1500 ms, TE = 30 ms, 60 slices volume, matrix size = 110 × 110, voxel size = 2mm3 isotropic, flip angle = 70°, bw = 1818 Hz/pixel, multiband acceleration factor = 3, GRAPPA, iPAT = 2).
For concurrent single voxel fMRS targeting GABA and lactate metabolite spectra acquisitions and single voxel fMRI targeting T2* weighted water spectra acquisitions at 4 T Bruker spectrometer, we used interleaved J-difference editing 35 and diffusion-weighted stimulated echo acquisition mode sequence (STEAM, 40 Figure S1(b)). The MEscher-GArwood scheme (MEGA 41 ) was used for J-difference editing (GABA TE = 70.7 ms, lactate TE = 144 ms, TR =2700 ms, 180 paired spectra, number of averages = 2) and consisted of 10 ms Gaussian editing pulses (GABA editing pulses with 7.47 ppm and 1.89 ppm offsets; lactate editing pulses with 5.26 ppm and 4.10 ppm offsets; 0.67 ppm bandwidth). For slice selective excitation combined with localization by adiabatic selective refocusing (semi-LASER 42 ) we used a non-adiabatic slice-selective Shinnar-Le-Roux 43 excitation pulse (90°, 2 ms, bandwidth = 2800 Hz) followed by two pairs of the second-order hyperbolic secant adiabatic full passage refocusing pulses (180°, 4 ms, bandwidth = 5000 Hz). 44 For water suppression we used variable pulse power with optimized relaxation delays (VAPOR 45 ) with Gaussian 15 ms pulses (bandwidth = 133.6 Hz). Prior to fMRI-fMRS acquisitions, we acquired B0 field map and water spectrum, adjusted basic frequency, shimmed globally and locally, and optimized RF power.
Each water-suppressed J-edited spectra was followed by the diffusion-weighted STEAM water spectra acquisition (360 spectra, echo time TE = 20 ms, mixing time TM = 10 ms, diffusion b = 1400 s/mm2) with 410 ms delay from the start of the preceding free induction decay (FID) acquisition. To facilitate fMRI-fMRS single voxel localization, we also acquired a FLASH scan (TR = 1013 ms, TE = 30 ms, voxel size = 4mm3 isotropic, matrix size = 61 × 35 × 27, flip angle = 30°, bandwidth = 50 kHz, TA = 35.5 s).
fMRI data processing
The fMRI data analysis was performed using SPM12 (Wellcome Trust Center for Neuroimaging, UK). The first 6 EPI volumes of each fMRI run were discarded to account for T1 saturation effects. The remaining images were spatially realigned to the mean scan of each run, corrected for geometric distortions, 46 coregistered to the individual structural scan and standard MNI structural template using DARTEL, 47 and smoothed with an isotropic Gaussian kernel with 8 mm full-width-at-half-maximum. For the subject-level analysis, we specified general linear models with 2 regressors, one for condition and one for baseline blocks (flashing and fixation for the visual activation paradigm; emotion identification and rest for the cognitive paradigm), and 6 covariates derived from head movement parameters to capture residual motion artifacts. The regressors were modeled as boxcar functions convolved with the canonical hemodynamic response function. For the whole-brain group level analysis, we performed two factorial 2-way ANOVAs with fixed factor ‘condition’ and random factor ‘subject’. As covariates, we included the participants’ age and gender. Statistical maps were corrected for multiple comparisons using whole-brain family-wise error correction (FWE, p < .05).
fMRI and fMRI-fMRS region of the interest (ROI) definitions and data processing
We identified individual VC and PCC ROIs as rectangular voxels around local maximum of the corresponding activation pattern. The activation patterns were obtained in subject’s native space (activation maps, p < 0.01 unc). The voxel was positioned to entirely capture the corresponding activation pattern without including signal from outside the brain.5,24,36 For each voxel, we calculated the average contrast estimates of (de)activation condition and baseline based on the fMRI first-level beta value maps produced by SPM12 for estimated ANOVAs.
For the subsequent fMRI-FMRS daily sessions, VC and PCC rectangular voxel coordinates were semi-automatically transferred from the 3 T scanner native space to the 4 T spectrometer native space given the specifications of the Siemens and Bruker coordinate system. Due to the sensitivity profile of the surface coil, manual coregistration using FreeSurfer (surfer.nmr.mgh.harvard.edu) was required to assure precise coregistration between the partial FLASH scan and the whole-brain fMRI mean scan. Automatic coregistration procedures were used to identify the spatial transformation parameters of the FLASH scan after manual coregistration with regard to its original location. These transformation parameters were then applied to the coordinates of the rectangular voxels.
For metabolic data of the fMRI-fMRS runs, we preprocessed J-difference edited spectra and derived quantitative estimates per (de)activation and baseline blocks, respectively. The preprocessing included frequency drift, eddy current and phase correction, and spectra alignment. 36 For lactate spectra, NAA peak was used as a reference. For GABA spectra, frequency drift corrections were performed using Creatine peak. An initial alignment for GABA J-edited fMRS was performed using NAA peak, based on the editing OFF spectra and transferred to the editing ON spectra (where NAA peak is affected by the editing pulse). The aligned paired spectra were summed to form a J-edited sum spectrum, subtracted to form a J-edited difference spectrum, and apodized using 2 Hz Gaussian and 2 Hz exponential filters. Preprocessed sum and difference J-edited spectra were averaged across condition and baseline blocks, and frequency and shape-aligned, because spectral averaging slightly affects the reference spectral frequency and shape. Individual spectra were centered and aligned to the group average reference NAA peak. The residual fMRS BOLD linewidth narrowing was estimated using line-shape differences in NAA peak between the (de)activation and rest and nulled using exponential linewidth adjustment. 36 The same corrections were applied to the J-edited difference spectra.
GABA, Glx (pooled glutamate and glutamine), lactate, β-hydroxybutyrate (BHB), and NAA levels were estimated using linear combination model (LC model) quantification 48 using NMRWizard and simulated basis sets generated in SpinWizard (mrrc.yale.edu), a Matlab-based GUI for quantum-mechanical density matrix simulations for complete, 3 D localized MR sequences. 49 Each metabolite, i.e., GABA, Glx, BHB and lactate, implies coedited macromolecules. NAA denotes NAA and N-acetyl-aspartyl-glutamic acid (NAAG). We fitted the NAA(G) peaks over a range of 2.01 ± 0.15 ppm, lactate and BHB peaks over a range of 1.25 ± 0.50 ppm, GABA peak over a range of 3.01 ± 0.20 ppm, and Glx peaks over a range of 3.75 ± 0.20 ppm. The potential contributions of other overlapping metabolites given fitting ranges were minimal at our echo time and were not further considered. Conventional polynomial baseline correction and shape distortion correction of the first order were performed as a part of the fitting procedure. 49 To avoid overfitting, lactate, BHB and GABA fits were constrained with Gaussian peaks (Figure S2). Parameters of modelled Gaussians and linewidth of the corresponding metabolites of the LC model were first approximated based on the total average spectra per run, and then kept constant for separate fitting of the baseline and condition spectra. Modelled Gaussians were summed up with the corresponding metabolite being considered inseparable, and therefore, just constrained the potential overfitting problems (Figure S2). The uncertainties in the applied quantifications were estimated by the Cramér–Rao lower bound (CRLB) procedure. 50 Average NAA levels were used for GABA, Glx, lactate and BHB level scaling, assuming 10 mM NAA. These levels were corrected for the T2 effect by an additional scaling approximated as a ratio exp(-TE/T2NAA)/exp(-TE/T2GABA, Glx,l actate, BHB) and based on recent 3 T studies in humans51–53: for GABA = 1.76 and for Glx = 1.12 given TE = 70.7 ms, T2NAA = 297 ms, T2GABA = 88 ms and T2Glu = 201 ms; for lactate and BHB = 1.13, given TE = 144 ms, and T2NAA = 297 ms and T2lactate = 239 ms.
To estimate fMRI-fMRS BOLD response (task-induced T2* modulations) in water STEAM spectra of the fMRI-fMRS runs, we applied optimized linear approximation of the water peak linewidth using logarithm of the water FID.36,54–56 Estimated T2* values were transformed to exp(-TE/T2*) to facilitate comparison between STEAM and EPI BOLD estimates. 54 The spectroscopic data were processed using custom routines written in Matlab (Mathworks, USA).
Analyses of functional BOLD and metabolic changes
The robustness of single voxel coregistration, coordinate transformation and BOLD estimation procedures, together with consistency of the participants’ performance, was assessed by two-tailed Pearson correlation between whole-brain fMRI BOLD and single voxel fMRI-fMRS BOLD percent signal changes. Whole-brain fMRI BOLD percent signal change was estimated as a difference between ROI-specific condition and baseline contrast estimates based on beta value maps. Water spectra fMRI-fMRS BOLD percent signal change between condition and baseline blocks was estimated based on T2* values. We used two-tailed one-sample t-tests for BOLD and metabolite percent signal changes estimated between corresponding (de)activation conditions and baselines. The Jarque-Bera test established that data were normally distributed (pJB denotes p-value that data does not come from normal distribution). The correlation between BOLD estimates, metabolite levels and their changes were assessed using two-tailed Pearson correlation. For average values, we reported the mean and standard deviation.
Results
Using the whole-brain 3 T fMRI, we revealed brain areas responding to a flashing checkerboard and auditory emotion identification (Figure 1(a) and (b), Figure S1(a)). In particular, flashing checkerboard stimulation was associated with widespread fMRI BOLD activation in the primary VC (Table 1, flashing > fixation; Figure 1(a)). The identification of emotion portrayals was associated with fMRI BOLD activations in the auditory cortex (AC) and inferior frontal gyrus (IFG) (identification > rest; Table 1, Figure 1(b)), which agrees well with auditory task engagement and emotion valuation. 39 However, this cognitive task was also associated with widespread fMRI BOLD deactivation in the medial prefrontal cortex (mPFC), PCC, extrastriate VC (V4), ventral striatum (VS), inferior parietal lobule (IPL), superior parietal lobule (SPL), supplementary motor area (SMA), MC, ACC, middle temporal gyrus (MTG), superior frontal gyrus (SFG), and premotor cortex (preMC) (identification < rest; Table 1, Figure 1(b)). These regions are commonly found to be deactivated during cognitive tasks.57–59
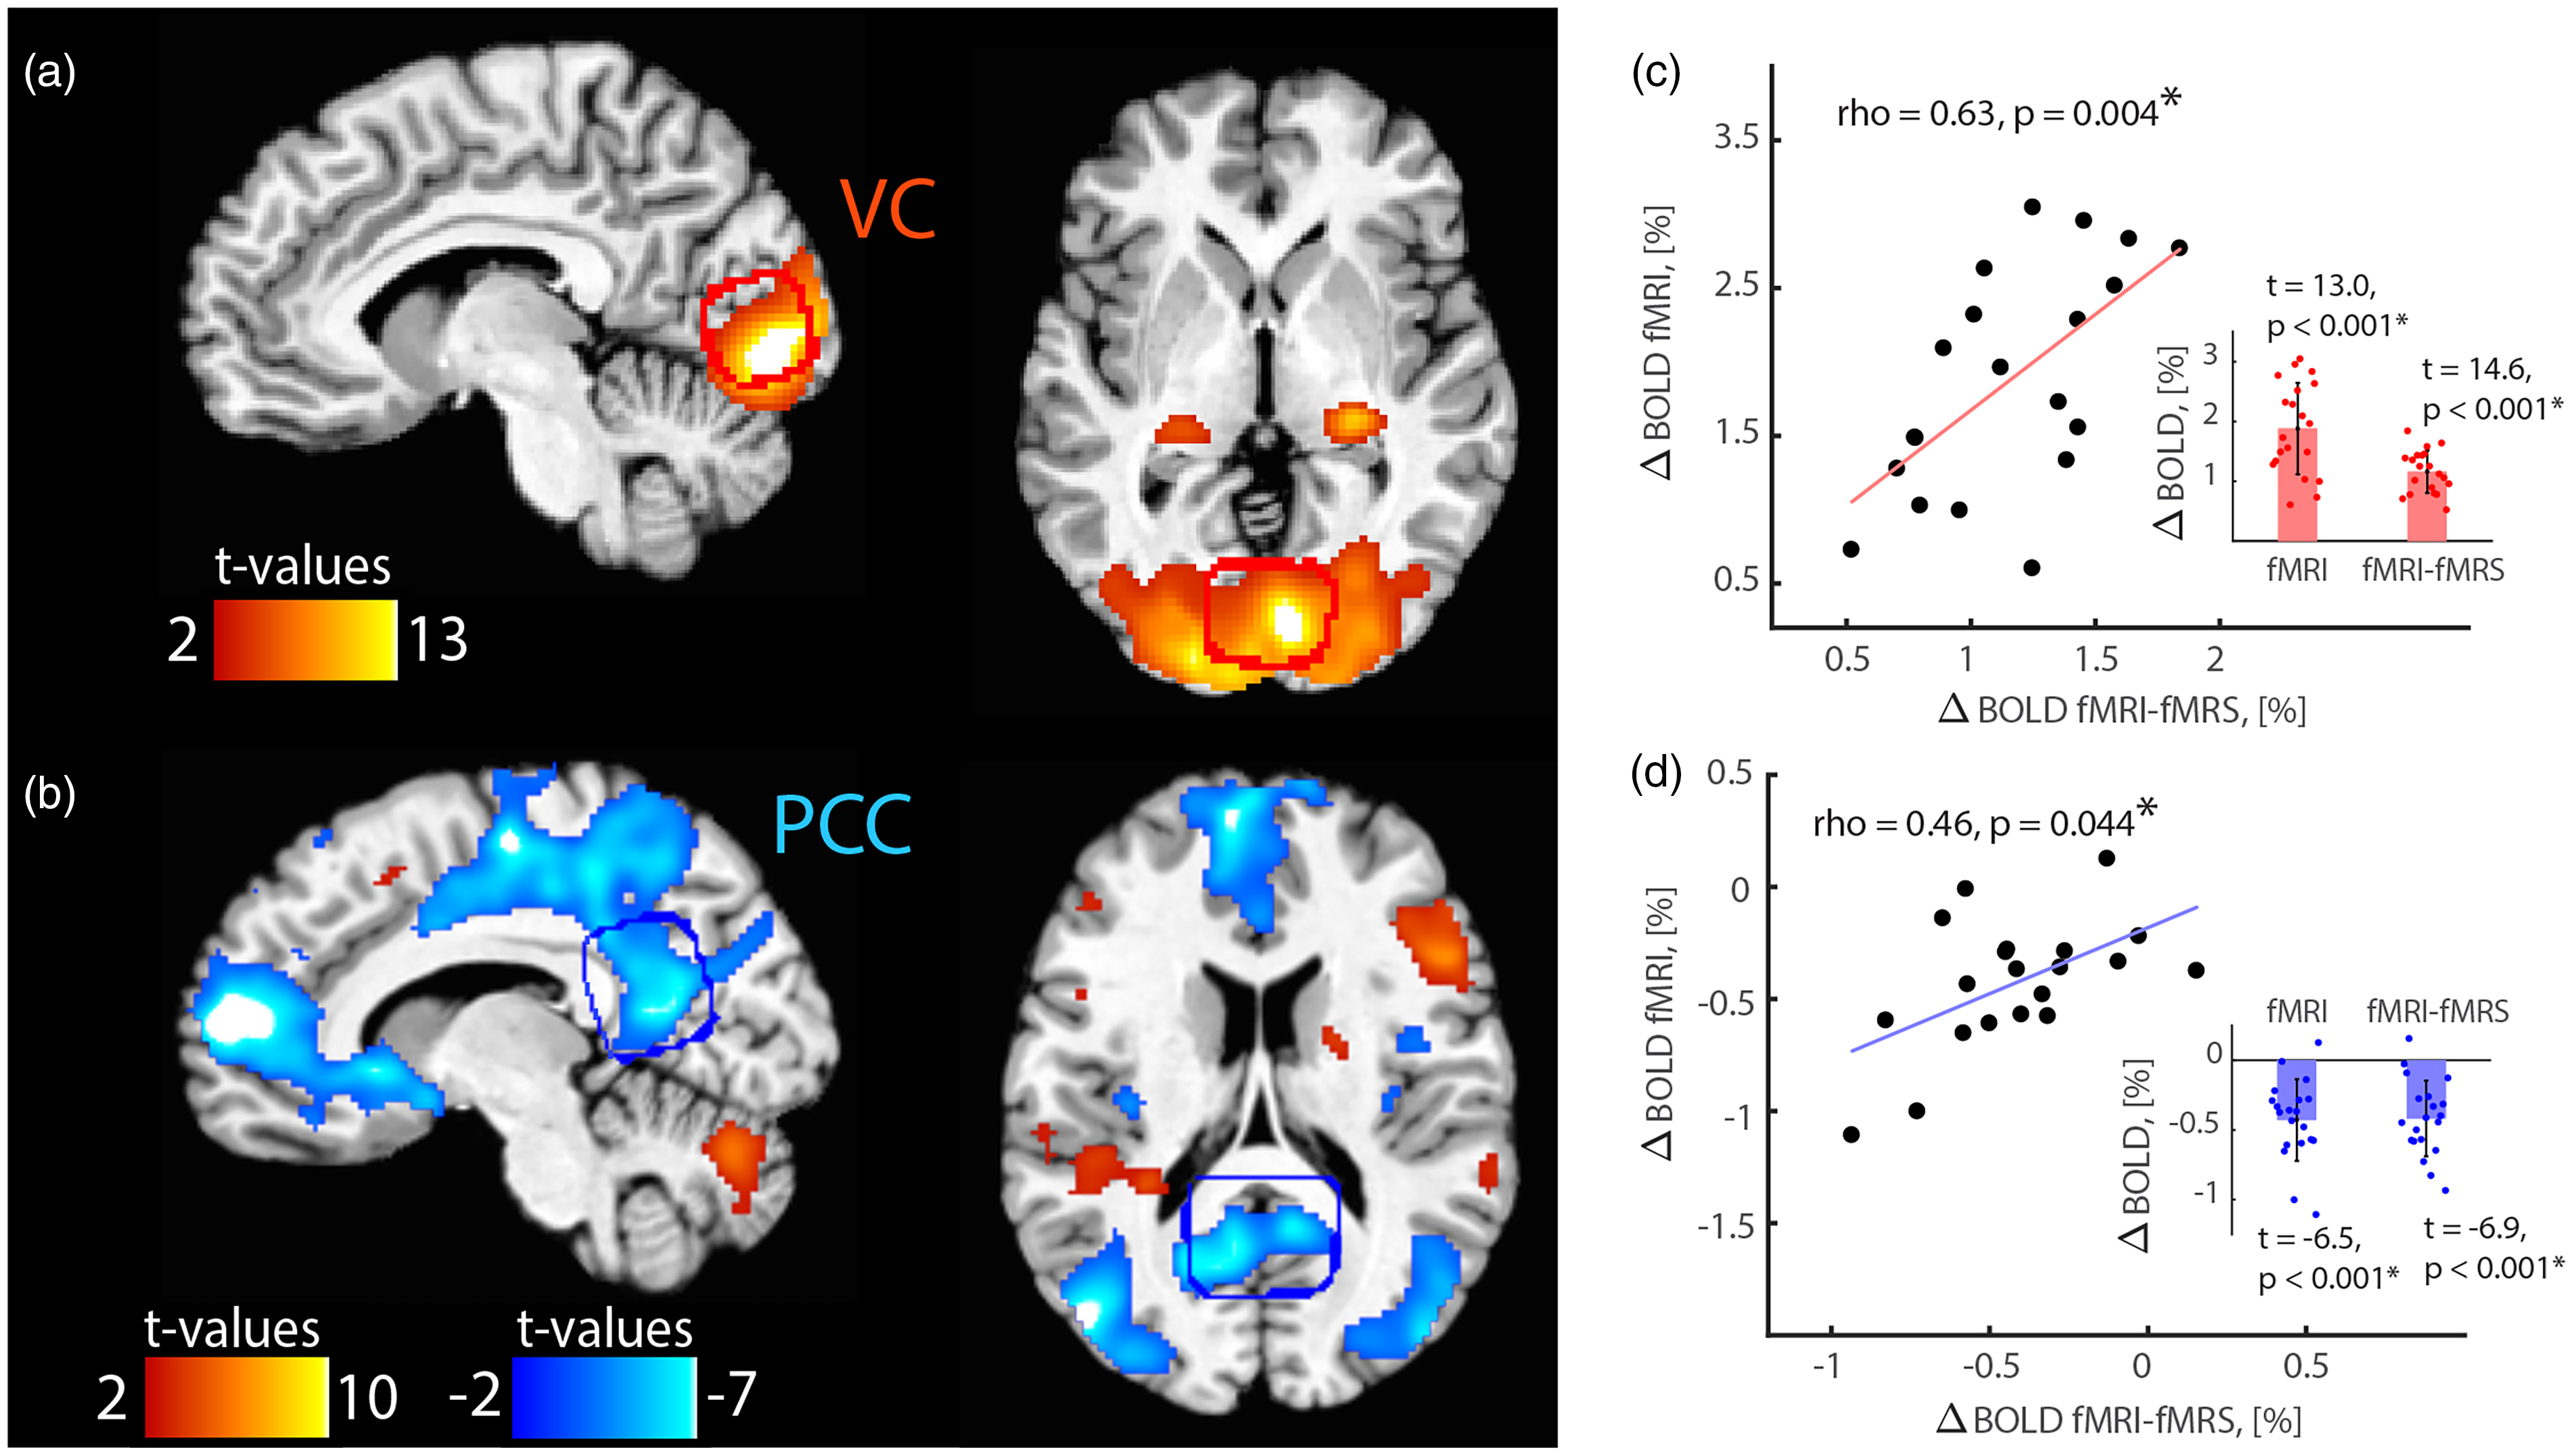
fMRI-measured activations and deactivations in task-positive and task-negative areas (Table 1), respectively. (a) Flashing visual checkerboard was associated with activations in the primary visual cortex (VC, activation, task-positive area). (b) Identification of auditory emotion portrayals was associated with deactivations in task-negative brain areas, in particular, in the posterior cingulate cortex (PCC, deactivation, task-negative area). Group average fMRI-fMRS single VC (red) and PCC (blue) voxels are shown as overlays. For illustration purposes, maps were thresholded at p <.001 unc. (c, d) Localized BOLD signal change assessed using whole-brain fMRI at 3 T and single-voxel diffusion-weighted water fMRI-fMRS at 4 T consistently increased (c) and decreased (d) during activation and deactivation tasks, respectively. Whole-brain fMRI BOLD percent signal change was estimated as a difference between ROI-specific condition and baseline contrast estimates based on beta value maps. Water spectra fMRI-fMRS BOLD percent signal change between condition and baseline blocks was estimated based on T2* values. The BOLD responses measured by fMRI and fMRI-fMRS were positively correlated. Shaded plots and error bars denote the mean and the standard deviation. Note that individual BOLD changes were averaged across J-difference edited lactate and GABA fMRI-fMRS runs.
Brain areas activated by a flashing checkerboard and deactivated during identification of emotional portrayals.
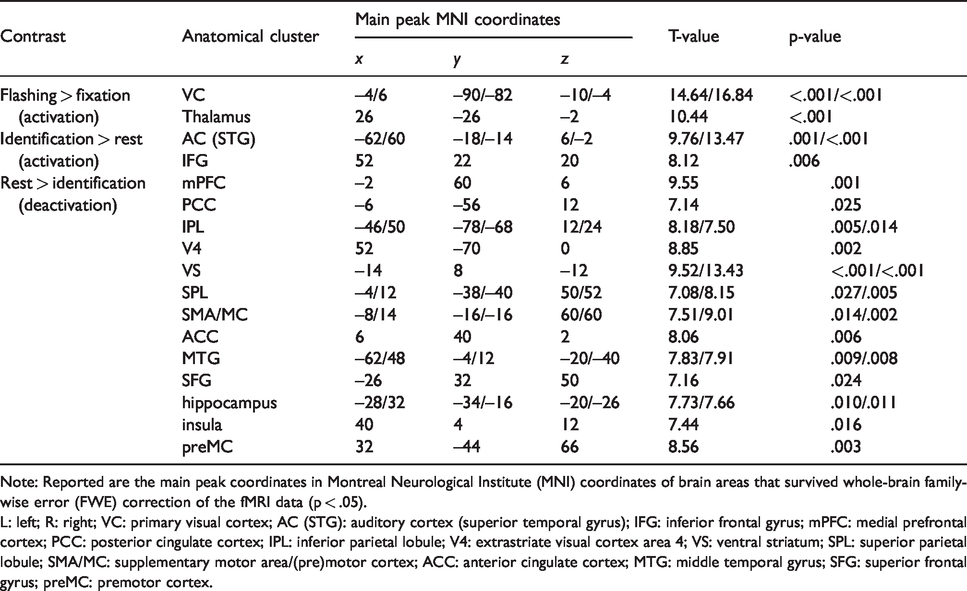
Note: Reported are the main peak coordinates in Montreal Neurological Institute (MNI) coordinates of brain areas that survived whole-brain family-wise error (FWE) correction of the fMRI data (p < .05).
L: left; R: right; VC: primary visual cortex; AC (STG): auditory cortex (superior temporal gyrus); IFG: inferior frontal gyrus; mPFC: medial prefrontal cortex; PCC: posterior cingulate cortex; IPL: inferior parietal lobule; V4: extrastriate visual cortex area 4; VS: ventral striatum; SPL: superior parietal lobule; SMA/MC: supplementary motor area/(pre)motor cortex; ACC: anterior cingulate cortex; MTG: middle temporal gyrus; SFG: superior frontal gyrus; preMC: premotor cortex.
To investigate concurrent metabolic and BOLD responses to (de)activation tasks, we interleaved fMRI and fMRS acquisitions at 4 T using single voxel diffusion-weighted water STEAM (fMRI) and J-difference editing (fMRS), respectively (Figure S1(b)). The results showed a fMRI-fMRS BOLD response increase in VC (Figure 1(c); two-tailed one-sample t-test, t = 14.6, p < 0.001, pJB = 0.500; ΔBOLDfMRI-fMRS = 1.16 ± 0.36%; fixation T2* =28.2 ± 3.4 ms), and a decrease in PCC (Figure 1(d); two-tailed one-sample t-test, t = −6.9, p < 0.001, pJB = 0.500; ΔBOLDfMRI-fMRS = −0.42 ± 0.27%; rest T2* = 35.2 ± 3.4 ms). BOLD responses for whole-brain fMRI at 3 T and localized fMRI-fMRS at 4 T were positively correlated in both VC and PCC (Figures 1(c) and (d); two-tailed Pearson correlations; VC runs: rho = 0.63, p = 0.004; PCC runs: rho = 0.46, p = 0.044), which confirms the robustness of data collected between scanners and performance of participants.
High quality J-edited sum and difference spectra of lactate, glutamate plus glutamine (Glx), and γ-aminobutyric acid (GABA) were evidenced by narrow N-acetylaspartate (NAA) baseline linewidth in VC (GABA runs: linewidth = 7.61 ± 0.59 Hz, CRLB = 3.4 ± 1.2; lactate runs: linewidth = 7.95 ± 0.62 Hz, CRLB = 3.7 ±1.4) and in PCC (GABA runs: linewidth = 5.73 ± 0.69 Hz, CRLB = 4.8 ± 2.4; lactate runs: linewidth =6.80 ± 0.93 Hz, CRLB = 4.5 ± 4.3; Figures S1(c) to (f)). The results revealed BOLD-induced NAA linewidth narrowing in VC during the visual task (linewidth difference between fixation and flashing tasks; GABA runs, -0.10 ± 0.13 Hz; lactate runs, -0.10 ± 0.13 Hz), and NAA linewidth broadening in PCC during the cognitive task (linewidth difference between rest and emotion identification tasks; GABA runs, 0.03 ± 0.09 Hz; lactate runs, 0.03 ± 0.04 Hz). These spectra were modeled using an exponential term and compensated for the effects of linewidth change. 36 No significant task-induced change in NAA level was found between baseline and task conditions in fMRS runs after compensation (two-tailed one-sample t-test; GABA VC runs: t = 0.7, p > 0.5, GABA PCC runs: t = 1.0, p > 0.3; lactate VC runs: t = 0.7, p > 0.4, lactate PCC runs: t = 0.3, p > 0.5).
We estimated GABA, Glx, and lactate levels during baseline and task conditions, and their correlation with concurrent fMRI-fMRS BOLD responses (Figure 2, Figure S2). We found a significant negative correlation between baseline GABA levels and fMRI-fMRS BOLD responses in VC (Figure 2(a); two-tailed Pearson correlation; rho = -0.50, p = 0.027) and in PCC (Figure 2(b); two-tailed Pearson correlation; rho = -0.57, p = 0.010), but not between baseline lactate or Glx levels and fMRI-fMRS BOLD responses (Figures 2(c) to (f); p-values > 0.3). GABA levels were somewhat high (VC baseline level = 2.22 ± 0.33 mM, PCC baseline level = 2.27 ± 0.30 mM) given differential T2 weighting factor 1.76 for GABA as referenced to NAA, and likely due to some co-edited macromolecular contributions (Figure S2).28,60–65 However, quantified GABA levels may reflect individual and/or regional differences.32,66,67 Note that Glx levels are given in arbitrary units because the J-editing parameters were not optimal for absolute quantification of Glx.
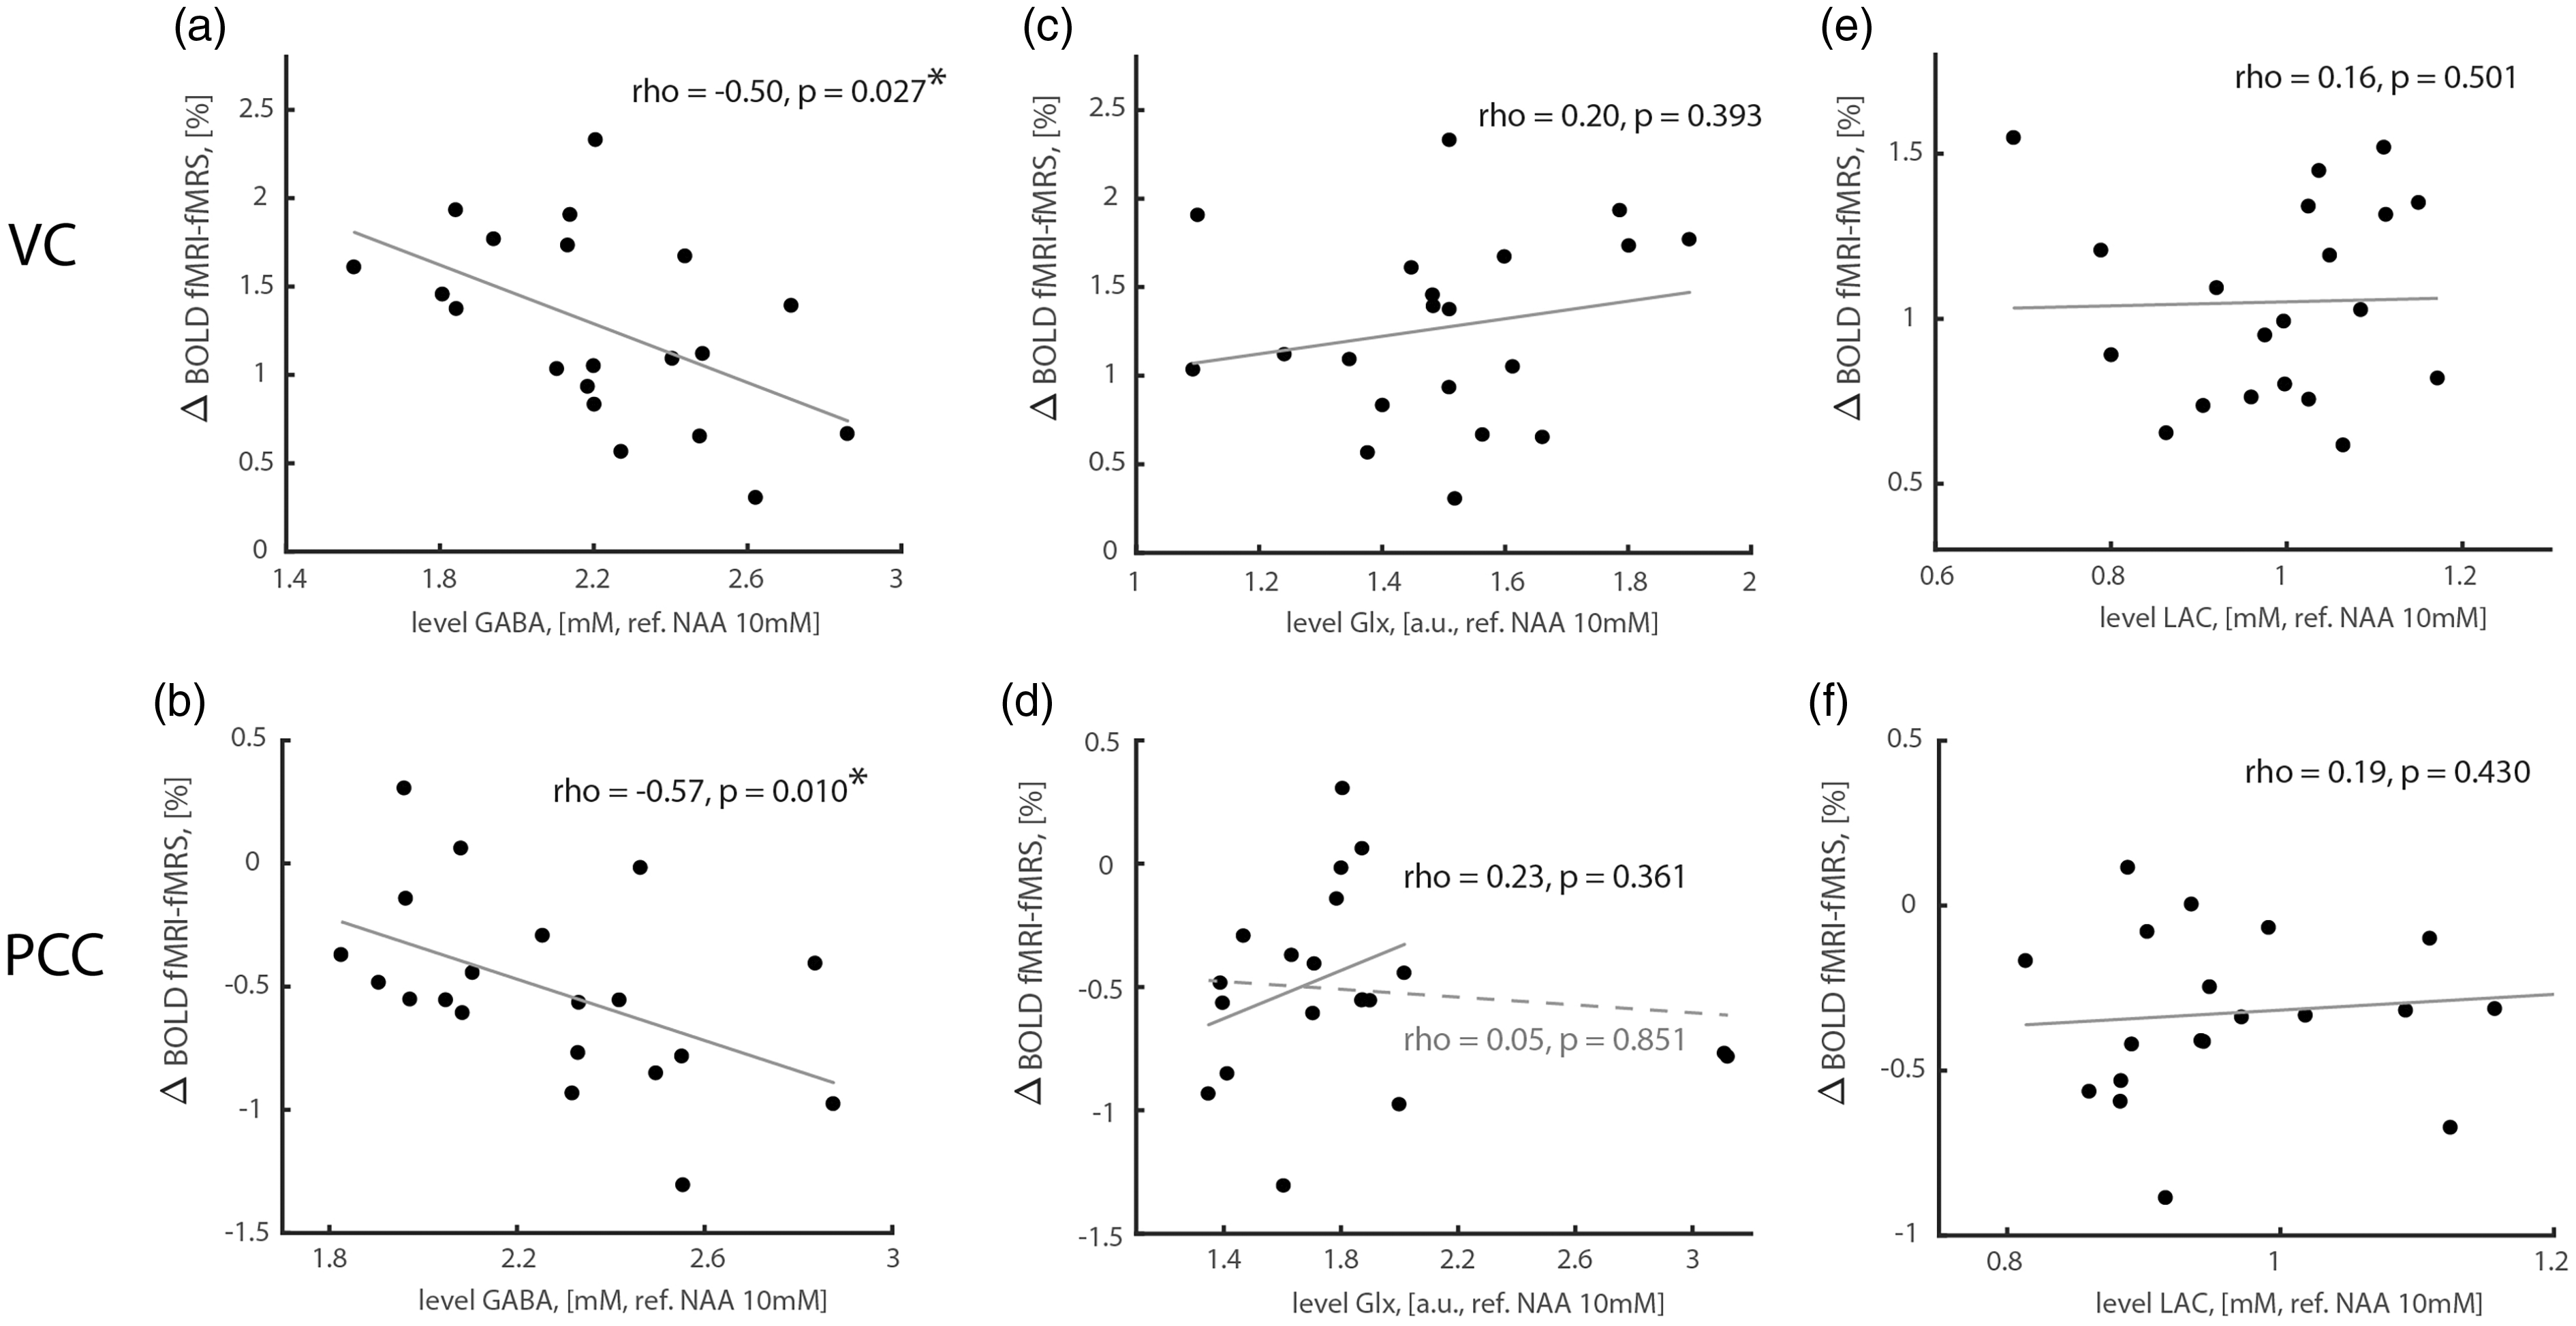
Correlations between task-induced BOLD responses and baseline GABA, Glx and lactate levels. (a, b) Normalized GABA levels correlated negatively with BOLD responses both during VC activation and PCC deactivation. (c–f) Glx or lactate levels did not correlate with BOLD responses. Solid and dashed lines in (d) denote slopes without and with two outlying Glx estimates, respectively. GABA, Glx and lactate levels were estimated assuming NAA concentration of 10 mM. Glx levels are expressed in (a.u.) because the J-editing parameters were optimized for GABA.
We found a significant GABA reduction in VC during task activation (Figure 3(a); two-tailed one-sample t-test, t = -7.65, p < 0.001, pJB = 0.500; -5.7 ± 3.3% from baseline level 2.22 ± 0.33 mM; CRLB =3.2 ± 1.8) and GABA increase in PCC during task deactivation (Figure 3(a); two-tailed one-sample t-test, t = 3.24, p = 0.004, pJB = 0.350; 4.5 ± 6.2% from baseline level 2.27 ± 0.30 mM; CRLB = 1.7 ± 0.7). Task-induced GABA level changes correlated negatively with fMRI-fMRS BOLD responses in VC (Figure 3(b), Figure S3(a) and (b); two-tailed Pearson correlation; rho = -0.48, p = 0.033), but positively in PCC (Figure 3(c), Figures S3(c) and (d); two-tailed Pearson correlation; rho = 0.46, p = 0.045).
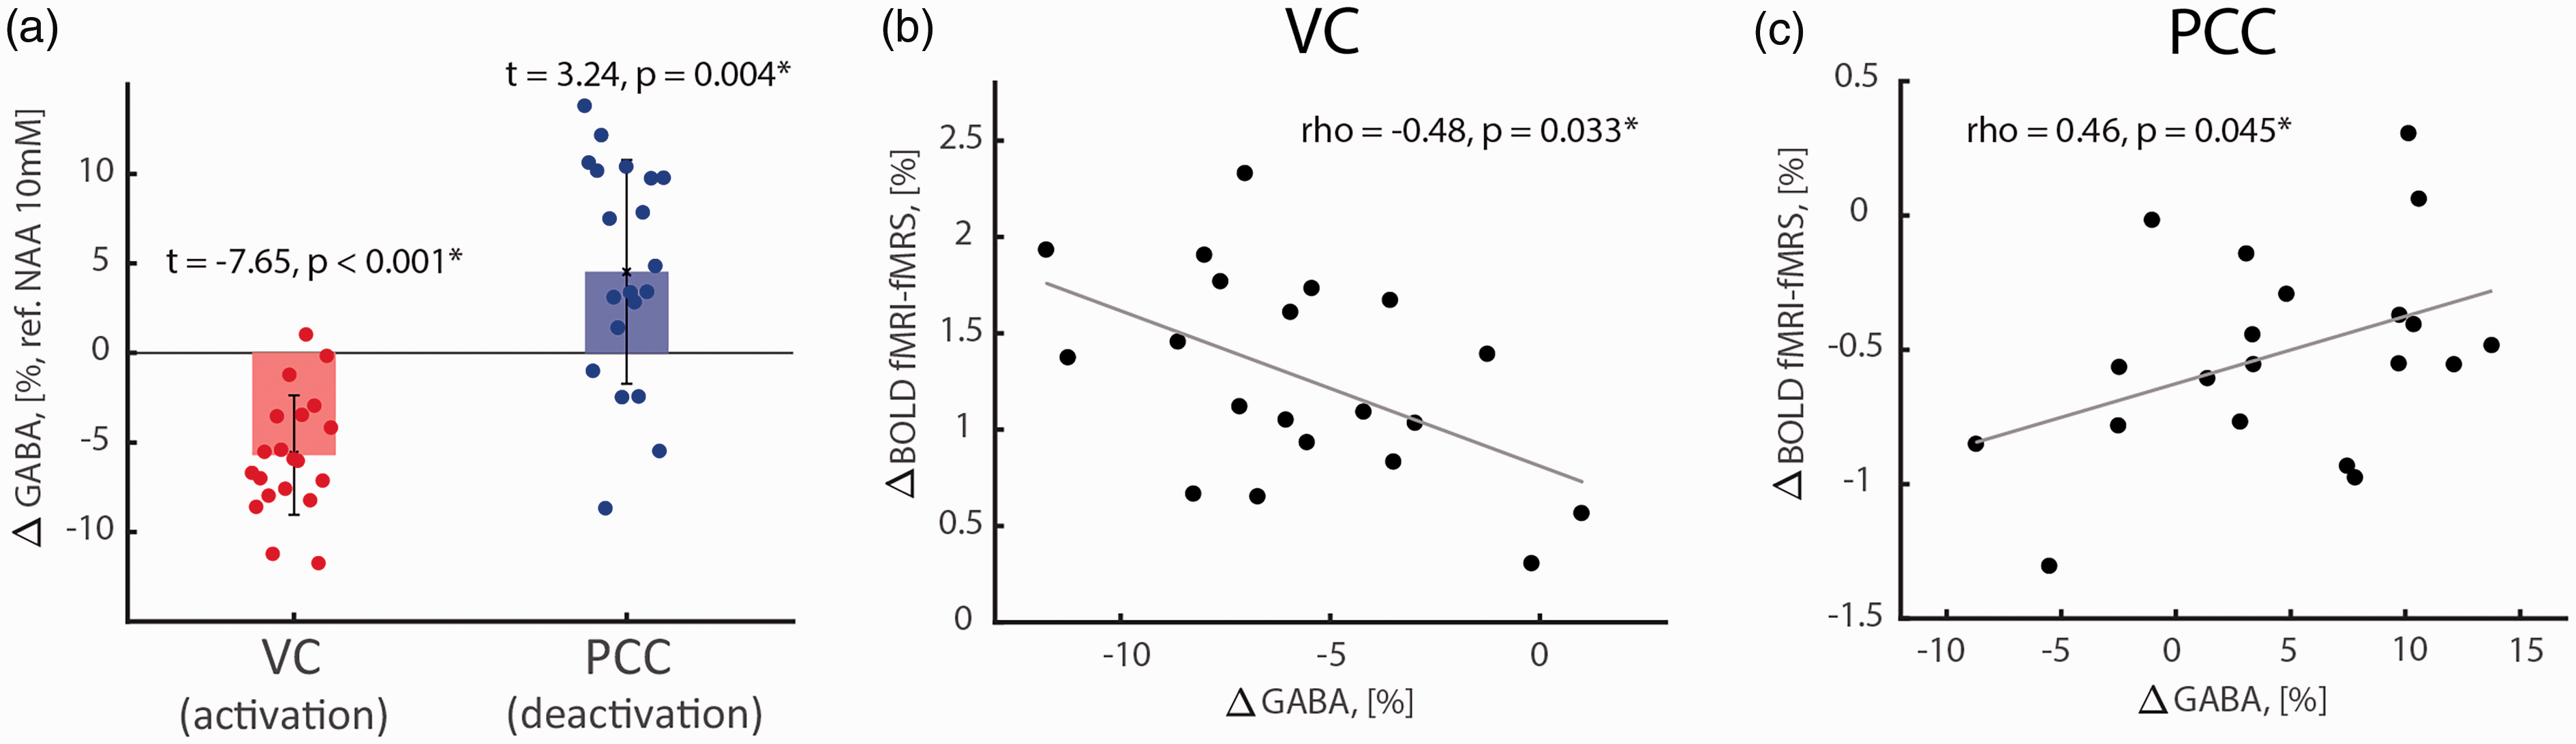
Reciprocal task-induced GABA level changes and their correlations are seen during VC activation and PCC deactivation. (a) Decrease of GABA level during VC activation (red bar: -5.7 ± 3.3% from baseline level 2.22 ± 0.33 mM) and increase of GABA level during PCC deactivation (bluer bar: 4.5 ± 6.2% from baseline level 2.27 ± 0.30 mM). (b) Negative correlation between task-induced GABA levels and BOLD responses in VC. (c) Positive correlation between task-induced GABA levels and BOLD responses in PCC. Normalized GABA levels were estimated by reference to NAA and assuming NAA concentration of 10 mM.
We found a significant Glx increase in VC during task activation (Figure 4(a); two-tailed one-sample t-test, t = 6.39, p < 0.001, pJB = 0.181; 3.0 ± 2.1% from baseline level 1.50 ± 0.21a.u.; CRLB = 14.1 ± 19.1) but not in PCC during task deactivation (Figure 4(a); two-tailed one-sample t-test, t = -0.81, p = 0.425, pJB = 0.500; -0.5 ± 2.9% from baseline level 1.84 ± 0.48a.u.; CRLB = 6.3 ± 2.9). Task-induced Glx changes correlated positively with fMRI-fMRS BOLD responses in VC (Figure 4(b), Figure S4(a) and (b); two-tailed Pearson correlation; rho = 0.54, p = 0.016), but not in PCC (Figure 4(c), Figure S4(c) and (d); two-tailed Pearson correlation; rho = -0.33, p = 0.160).
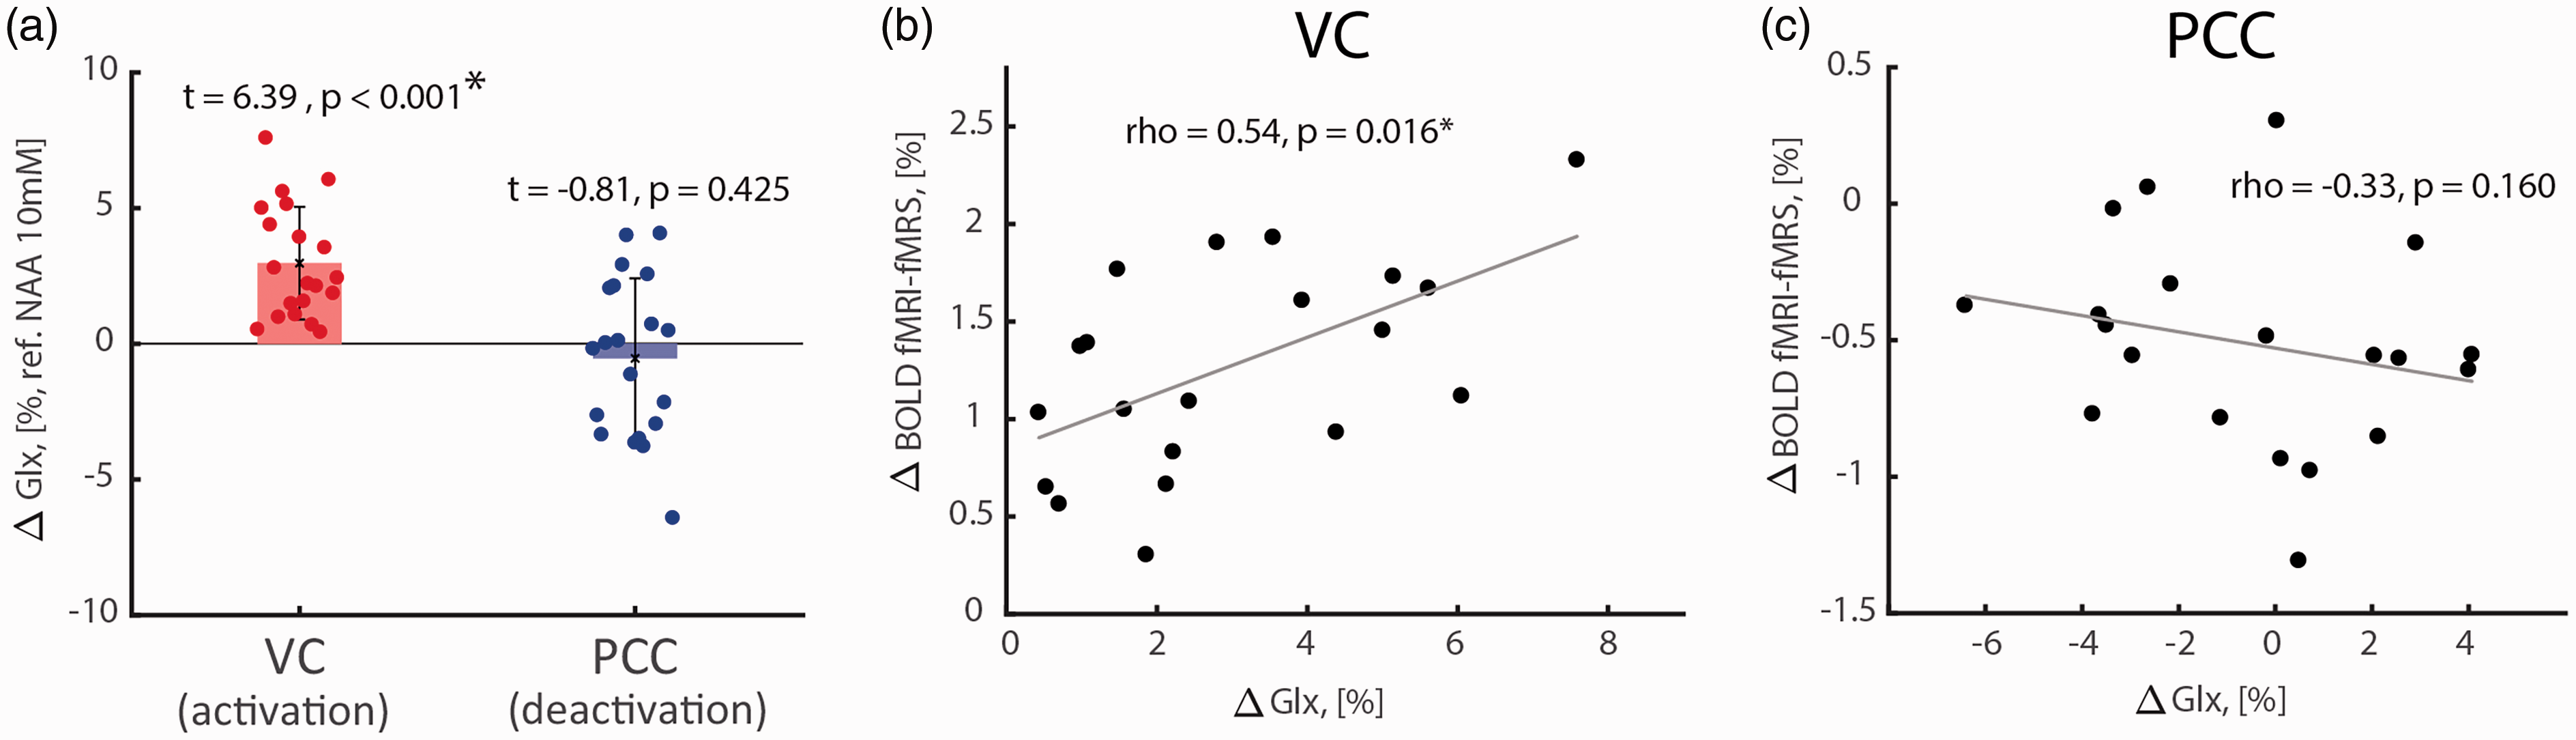
Task-induced Glx level changes and their correlations with VC activations and PCC deactivations. (a) Significant increase of Glx level during VC activation (3.0 ± 2.1% from baseline level 1.50 ± 0.21a.u.) and non-significant Glx level change during PCC deactivation (-0.5 ± 2.9% from baseline level 1.84 ± 0.48a.u.). (b) Significant positive correlation between task-induced Glx level and BOLD responses in VC. (c) Task-induced Glx level and BOLD responses did not correlate significantly. Glx levels were referenced to NAA assuming NAA concentration of 10 mM.
Similar analyses for lactate showed a significant increase of lactate in VC during task activation (Figure 5(a); two-tailed one-sample t-test, t = 6.46, p < 0.001, pJB = 0.388; 7.8 ± 5.4% from baseline level 0.99 ± 0.13 mM; CRLB = 4.0 ± 1.8), and a significant positive correlation between activation-induced lactate change and fMRI-fMRS BOLD responses (Figure 5(b); two-tailed Pearson correlation; rho = 0.62, p = 0.005). In contrast to VC, no significant task-induced changes in lactate were seen in PCC during task deactivation (Figure 5(a); two-tailed one-sample t-test, t = 1.35, p = 0.193, pJB = 0.219; 1.4 ± 4.7% from baseline level 0.97 ± 0.11 mM; CRLB = 2.3 ± 0.7); lactate change also did not correlate significantly with fMRI-fMRS BOLD responses (Figure 5(c); two-tailed Pearson correlation; rho = -0.10, p = 0.681). Because lactate and β-hydroxybutyrate (BHB) have similar J-evolution profiles, both are co-edited in a J-difference spectrum where these signals partially overlap (Figure S5). 36 However, no significant change in BHB was observed in VC (two-tailed one-sample t-test, t = -0.77, p = 0.449, pJB = 0.500; -3.2 ± 18.5% from baseline level 0.37 ± 0.09 mM; CRLB = 11.3 ± 4.7) or PCC (two-tailed one-sample t-test, t = 0.81, p = 0.426, pJB = 0.500; 2.1 ± 11.5% from baseline level 0.34 ± 0.11 mM; CRLB = 8.0 ± 6.3), also eliminating a potential inference of a change in BHB on the quantification of lactate signal.
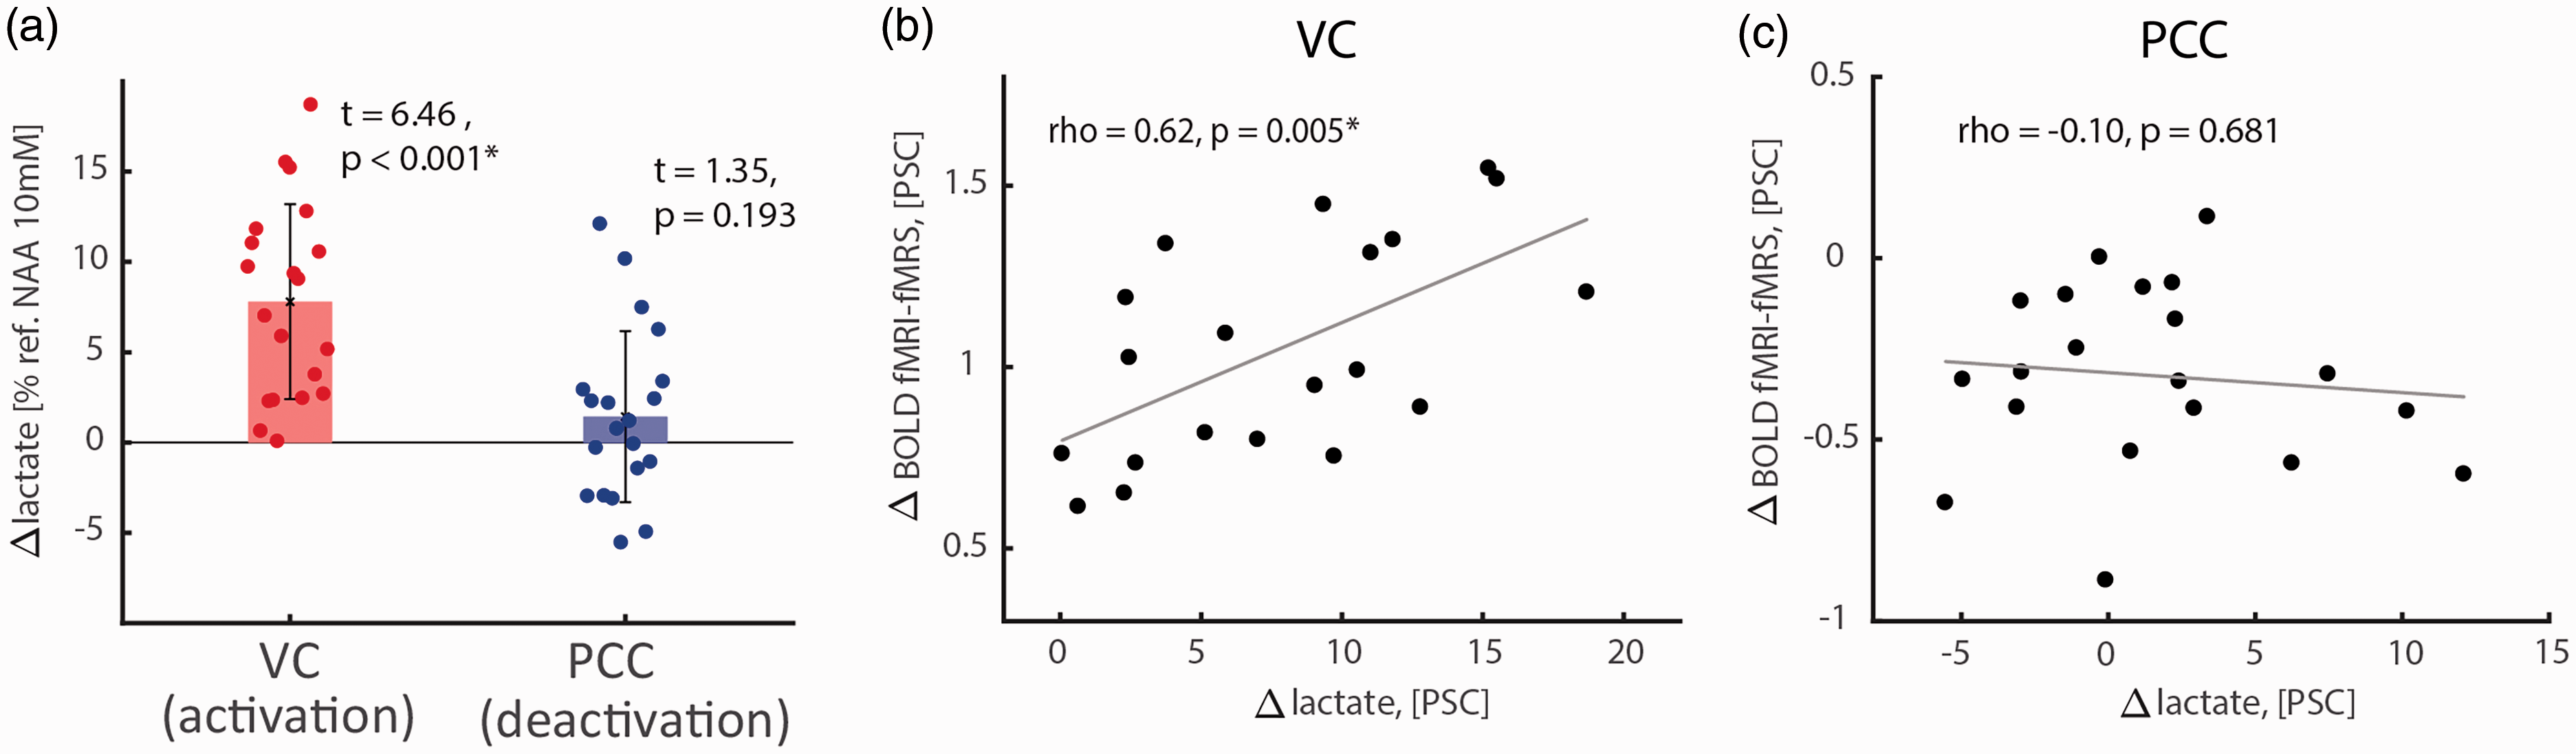
Task-induced lactate level changes and their correlations with VC activations and PCC deactivations. (a) Significant lactate increase during VC activation (7.8 ± 5.4% from baseline level 0.99 ± 0.13 mM) but not during PCC deactivation (1.4 ± 4.7% from baseline level 0.97 ± 0.11 mM). BHB did not change, neither during VC activation (-3.2 ± 18.5% from baselin1e level 0.37 ± 0.09 mM), nor during PCC deactivation (2.1 ± 11.5% from baseline level 0.34 ± 0.11 mM). (b) Positive correlation between task-induced lactate change and BOLD responses in the VC. (c) Task-induced lactate change did not correlate with BOLD responses in PCC. Referenced lactate levels are estimated assuming NAA concentration of 10 mM.
Discussion
In this study, we used whole-brain fMRI and single-voxel fMRI-fMRS to investigate activation in a task-positive brain area (VC activated by a visual task) and deactivation in a task-negative brain area (PCC deactivated by an auditory cognitive task). The fMRI-fMRS pulse sequence allowed for concurrent quantification of GABA, Glx and lactate in relation to BOLD response during the (de)activation paradigms. The measurements of GABA, Glx, and lactate served as proxies for excitatory-inhibitory balance and aerobic glycolysis. Our results provide insights into the complex metabolic underpinnings of positive and negative BOLD response.
BOLD response and GABAergic function
Baseline GABA levels in VC and PCC were negatively correlated with the task-induced BOLD response across participants, which accords well with previous findings suggesting that increased inhibition is associated with decreased positive BOLD magnitude in VC5,31–33 and increased negative BOLD magnitude in ACC 29 and PCC. 30 These observations suggest that a significant component of the variability seen in BOLD response across subjects could be modulated by regional GABA level. 31 At the simplest level, this result suggests that regional GABA level modulates inter-subject BOLD response variability. 31 Because both task-negative and task-positive brain areas follow this relationship, baseline inhibition of brain activity is ubiquitously important for normal brain function.
We also found area-specific, task-induced GABA modulations, as evidenced by decreased GABA in VC during task activation (-5.7 ± 3.3%) and increased GABA in PCC during task deactivation (4.5 ± 6.2%). These results are consistent with studies reporting decreased GABA during task activation in VC.25,28 Conversely, we found that the task-induced GABA modulations correlated negatively with the BOLD response in VC during activation and positively with the BOLD response in PCC during deactivation. The negative correlation in VC suggests that a larger positive BOLD signal is associated with a reduced level of GABA (and of task-induced inhibition) as related to baseline (fixation of a stationary dot), while the positive correlation in PCC represents an opposite dependency. Interestingly, a higher positive BOLD response in VC is associated with lower baseline GABA levels and an increased task-induced GABA change (Figures 2(a) and 3(b)), whereas a lower negative BOLD response in PCC is associated with higher baseline GABA levels and a reduced task-induced GABA change (Figures 2(b) and 3(c)). Since larger basal GABA level was associated with less positive BOLD changes in task-positive and more negative BOLD changes in task-negative brain areas, we suggest an opposite effect of larger basal GABA on task-induced BOLD changes in these areas. Since task-induced GABA change was negatively and positively correlated with BOLD response in activated and deactivated areas, respectively, we suggest an opposite effect of larger task-induced GABA changes in task-positive and task-negative brain areas.
BOLD response, GABAergic and glutamatergic function, and brain energetics
13C MRS studies in rat and human brain show strong coupling between neurotransmission and neuroenergetic fluxes.14,68 Our results show that Glx increased significantly in VC during task activation (3.0 ± 2.1%), and task-induced Glx level changes and BOLD response were positively correlated (Figure 4). However, no Glx change was seen in PCC during task deactivation nor did task-induced Glx level changes correlate with BOLD response. The observed Glx increase in VC fits well within the previously reported range,4,5,24,27,28,37,69 as well as the correlation with the BOLD response. 5,70 Glutamate is in a unique metabolic position, both as an excitatory neurotransmitter and precursor of GABA, but also directly linked to the tricarboxylic acid cycle and energy metabolism.14,68 The observation of increased Glx and decreased GABA levels in a task-positive area, like the VC, but not in a task-negative area like the PCC suggests that the relationship between the energetic changes associated with the BOLD effect, which are likely to be paralleled by the glutamate changes, may differ in task-negative areas. Whereas the task-induced increases in Glx and lactate levels in VC have been shown to correlate with increased glutamatergic neuronal activity,3–5,24,26,69,71 the relationship between task-related changes in tissue and extracellular GABA levels and GABAergic neuronal metabolic activity has not been established. In addition to GABA’s role in mediating inhibition, release of vasoactive neuromodulators such as vasoactive intestinal peptide from GABAergic or acetylcholinergic (ACh) neurons, 72 as well as adenosine, nitric oxide, or certain prostanoids released by astrocytes,73–75 could directly alter local cerebral blood flow, and hence the BOLD response. Regardless of task-induced modulation of cerebral blood flow, the results suggest that in VC the excitatory-inhibitory balance is associated with reciprocal changes in Glx and GABA levels during task, whereas in the inhibition-dominated PCC during task this relationship is not observed. Nevertheless, our findings in PCC do not exclude the possibility that due to smaller absolute changes in signaling in the PCC the sensitivity of applied methods was not sufficient to see a significant decrease in Glx, because Glx changes were based on pooled glutamate and glutamine observations that could underestimate the actual glutamate change.
We did not reveal dependencies between baseline lactate level and BOLD response across participants (Figure 2(e) and (f)). However, we found task-induced lactate modulations for a task-positive but not for task-negative brain areas (Figure 5). In particular, we found a 7.8 ± 5.4% task-induced lactate increase in VC, which is consistent with our previous J-edited fMRS findings of 8.6% change in MC. 36 The observed baseline lactate of concentration 0.99 mM in VC and 0.97 mM in PCC is within the reported baseline lactate concentration range of 0.56-1.02 mM in VC.3–5,25,26,69,76 Such relatively large variation of the lactate level estimates and, subsequently, their task-induced changes in the literature could be due to quantification bias in fMRS methods, as lactate heavily overlaps with mobile macromolecules and/or extracerebral lipid contaminations. 36 In line with previous findings, 5 our task-induced lactate changes correlated positively with BOLD signal changes in VC. The lactate increase indicates a rise in non-oxidative glycolysis,18,19 but its energetic significance is presently not known. The elevated lactate may also play a role in mediating neuromodulation. 21 The fact that the lactate increase is observed in a task-positive area and not in a task-negative area suggests that neurotransmission in these areas differ in terms of their support by aerobic glycolysis, possibly through differences in the modes of neurotransmission (e.g., point-to-point versus graded volume conduction) and(or) neuroenergetic capabilities (i.e., through glycolysis and/or oxidation). Given that the PCC is repeatedly observed to be affected in brain diseases by fMRI, 1 we posit that it could be due to inability for sustaining additional mechanisms to support enhanced neurotransmission and neuroenergetic fluxes.
Similarly to our previous J-edited fMRS lactate findings in MC, 36 we consistently observed the presence of BHB in the J-edited lactate spectra but no significant task-induced BHB level changes in VC and PCC areas. BHB and lactate could serve as alternative energy buffers to fulfill energy demands in the presence of low glucose.77,78
On GABA dynamics in fMRI
The inverse relationship between tissue GABA level and BOLD response extended over both task-positive and task-negative areas, suggesting the GABA measure reflects a common inhibitory effect modulating excitation-inhibition balance, thus extending previous studies done on task-positive primary VC and MC areas. Tissue GABA as measured by 1H MRS reflects mainly intracellular GABA as extracellular GABA levels are too low for detection. The intracellular level of GABA is a major determinant of extracellular GABA (and tonic inhibition) as maintained by plasma membrane GABA transporters operating at or near equilibrium. Thus, the observed task-induced decrease of GABA in VC, and increase of GABA in PCC, might be expected to lead respectively to lower and higher levels of extracellular GABA (and of tonic inhibition) in those regions. Because fluxes in energy metabolism and neurotransmitter cycling were not measured in the present study, we cannot address how the task-induced changes in tissue GABA level relates to GABAergic neuronal activity in the two areas.
Clinical implications
Dysregulation of excitatory and inhibitory balance at the synaptic level is believed to play a role in the pathogenesis and symptoms associated with many neurological and psychiatric disorders. The common relationships between fMRI response and baseline GABA levels in both task-negative and task-positive areas suggest that it is a common mechanism for modulating brain response. Using the approach presented here it should be possible to determine the relationship in healthy volunteers and use it to assess when the relationship is altered in brain disorders, e.g., manifesting in altered DMN function 1 as well as modified activation responses in task-positive regions. 79 In these patients the effectiveness of GABAergic targeted drugs in restoring the normal balance could potentially be tracked with fMRS even in individual patients based on the SNR and reproducibility achieved. Changes in the Glx and lactate in response to stimuli are at present more complicated to interpret due to their reflecting coupled changes in both neurotransmitter and metabolic fluxes.14,15,19 However through directed studies at understanding how these couplings impact glutamate concentration, fMRS measurements may provide additional important information on pathological changes in these critical relationships. Moreover, neurometabolic information obtained with fMRS offers important new insights for clinical task-based and rest-based fMRI of brain areas and could provide a potential neurochemical explanation of the (non)observed differences between different clinical as well as between clinical and healthy control groups.
Technical considerations and future directions
A recent study measuring glutamate in response to visual stimulation of various contrasts reported that high visual stimulus intensity is critical for modulating glutamate levels in VC. 27 Likewise, metabolic task-induced alterations in task-negative brain areas and parts of the DMN may be associated with lower BOLD response and even stronger dependence on task engagement.29,30,80
With increased magnetic field strength and fMRS data quality, it has become possible to reveal correlations between the BOLD response and metabolic changes.5,81 J-editing fMRS is of practical importance at relatively low magnetic field,22,36,82 however its specificity could be reduced by co-edited macromolecules65,83 leading to underestimation of the true task-related modulations. The problem of co-edited macromolecules may require specific compensatory techniques during data acquisitions.28,60 The metabolic quantification for fMRS studies also appears to be more demanding than for conventional MRS studies. Applied spectra preprocessing and LC modeling could be further justified with increasing SNR for spectroscopic acquisitions. For instance, we used averaging per entire run for definition of the constraining Gaussians due to SNR limitations at relatively low magnetic field, while Gaussians could be constrained based on the average spectra per condition given increased SNR.
J-editing is also sensitive to scanner instabilities and motion artifacts.28,60,84 Thus, J-editing fMRI-fMRS has a strong potential for further optimizations. In particular, it can be used in combination with parallel data acquisition and reconstruction methods.85–87 We used single-voxel STEAM water spectra acquisitions to increase the consistency of paired BOLD and metabolic estimates. Although this approach is efficient for proof-of-principle studies, single voxel water spectroscopy could be replaced with whole-brain EPI acquisitions27,37 which could be further sped up by using multiband acceleration techniques.88–91
It has been recently reported that significant increases of glutamate, lactate and negative trend of GABA were associated with the activation of VC using whole-screen visual flashing checkerboard paradigm, whilst deactivation of the same VC using a small visual flashing checkerboard located in the center of the screen 6 was associated with a significant decrease in glutamate, lactate and GABA. 3 Negative trend in GABA levels associated with VC activation has been repeatedly observed in multiple fMRS studies reaching significant decrease in just a few studies,25,28 which highlights the need in increasing the method sensitivity and consistency of fMRI and fMRS observations. Albeit it is essential to increase the sensitivity of J-editing fMRS acquisitions at relatively low magnetic field (3 T) to increase the fMRS applicability, ultra-high magnetic field (7 T) could be used to explore and check the feasibility of J-editing fMRS findings. 28
Summary
Our findings strengthen the link between the hemodynamic response, inhibitory and excitatory activities and aerobic glycolysis. fMRI with BOLD contrast shows brain areas involved in task-induced activation and deactivation paradigms. Because connections between activated and deactivated brain areas, specifically within the DMN, are transformed in disease, we explored the relationships between aerobic glycolysis and excitatory-inhibitory balance across activated and deactivated brain areas in the normal brain. Our results suggest opposite relations between task-induced inhibition and BOLD responses given applied baselines in (de)activated areas. We also found that functional rise of aerobic glycolysis and glutamatergic activity was specific to the activated area. This study highlights the importance of the concurrent fMRI-fMRS acquisitions for unveiling metabolic nuances of the (de)activated brain areas and complementary interpretation of neural activity by hemodynamics and neurochemistry in health and disease.
Supplemental Material
sj-pdf-1-jcb-10.1177_0271678X21989186 - Supplemental material for Metabolic underpinnings of activated and deactivated cortical areas in human brain
Supplemental material, sj-pdf-1-jcb-10.1177_0271678X21989186 for Metabolic underpinnings of activated and deactivated cortical areas in human brain by Yury Koush, Robin A de Graaf, Ron Kupers, Laurence Dricot, Maurice Ptito, Kevin L Behar, Douglas L Rothman and Fahmeed Hyder: Gastrobiota Group in Journal of Cerebral Blood Flow & Metabolism
Footnotes
Funding
The author(s) disclosed receipt of the following financial support for the research, authorship, and/or publication of this article: This study was supported by the Swiss National Science Foundation (P300PB_161083), the Dansk Blindesamfund, and the National Institute of Health USA (R01 NS-100106, R01 MH-067528, R01 MH-109159).
Declaration of conflicting interests
The author(s) declared no potential conflicts of interest with respect to the research, authorship, and/or publication of this article.
Authors’ contributions
YK, RK, LD, MP, DLR, FH – designed the study, YK, RAG, RK, LD, FH – acquired and analyzed the data, YK, RAG, FH – prepared the MR sequence, YK, RAG, RK, LD, MP, KLB, DLR, FH – wrote the manuscript.
References
Supplementary Material
Please find the following supplemental material available below.
For Open Access articles published under a Creative Commons License, all supplemental material carries the same license as the article it is associated with.
For non-Open Access articles published, all supplemental material carries a non-exclusive license, and permission requests for re-use of supplemental material or any part of supplemental material shall be sent directly to the copyright owner as specified in the copyright notice associated with the article.