
Abstract
The contribution of glutamatergic and γ-aminobutyric acid (GABA)ergic neurons to oxidative energy metabolism and neurotransmission in the developing brain is not known. Glutamatergic and GABAergic fluxes were assessed in neocortex of postnatal day 10 (P10) and 30 (P30) urethane-anesthetized rats infused intravenously with [1,6-13C2]glucose for different time intervals (time course) or with [2-13C]acetate for 2 to 3 h (steady state). Amino acid levels and 13C enrichments were determined in tissue extracts ex vivo using 1H-[13C]-NMR spectroscopy. Metabolic fluxes were estimated from the best fits of a three-compartment metabolic model (glutamatergic neurons, GABAergic neurons, and astroglia) to the 13C-enrichment time courses of amino acids from [1,6-13C2]glucose, constrained by the ratios of neurotransmitter cycling (Vcyc)-to-tricarboxylic acid (TCA) cycle flux (VTCAn) calculated from the steady-state [2-13C]acetate enrichment data. From P10 to P30 increases in total neuronal (glutamate plus GABA) TCA cycle flux (3×; 0.24±0.05 versus 0.71 ± 0.07 μmol per g per min, P < 0.0001) and total neurotransmitter cycling flux (3.1 to 5×; 0.07 to 0.11 (± 0.03) versus 0.34 ± 0.03 μmol per g per min, P < 0.0001) were approximately proportional. Incremental changes in total cycling (δ Vcyc(tot)) and neuronal TCA cycle flux (δ VTCAn(tot)) between P10 and P30 were 0.23 to 0.27 and 0.47 μmol per g per min, respectively, similar to the ∼ 1:2 relationship previously reported for adult cortex. For the individual neurons, increases in VTCAn and Vcyc were similar in magnitude (glutamatergic neurons, 2.7× versus 2.8 to 4.6×; GABAergic neurons, ∼ 5× versus ∼7×), although GABAergic flux changes were larger. The findings show that glutamate and GABA neurons undergo large and approximately proportional increases in neurotransmitter cycling and oxidative energy metabolism during this major postnatal growth spurt.
Keywords
Introduction
Cerebral glucose metabolism rises rapidly during the first postnatal month in the rat (Daniel et al, 1978; Nehlig and Pereira de Vasconcelos, 1993) responding to energy needs for massive brain growth and synaptic development. Between the end of the first and third (weaning) postnatal weeks, glucose replaces ketone bodies as the primary oxidized fuel (Hawkins et al, 1974), neuronal synaptogenesis reaches its peak (Sutor and Luhmann, 1995), and neuron—glia substrate trafficking expands and matures (Patel and Balazs, 1970). Cortical spontaneous electroencephalographic activity, which is not detected in rats before postnatal day 6 (P6), attains the adult pattern by P20 (Deza and Eidelberg, 1967). Taken together the period between the first and third postnatal week in rodents is a major critical period in cortical development.
Cerebral glucose utilization assessed by [14C]2-deoxyglucose uptake is relatively low and homogeneous in rodents at birth but increases rapidly, becoming sharply defined for different sensory areas between P4 to P6 and P21 (Melzer et al, 1994; Nehlig and Pereira de Vasconcelos, 1993). It is significant that this pattern of ‘functional’ glucose use in the cortex is not seen for ketone bodies (Auestad et al, 1990; Nehlig and Pereira de Vasconcelos, 1993), where utilization remains homogeneous and declines rapidly after weaning. These findings suggest that glucose (and glycolysis) supports a critical function(s) in the expression of developing neural activity (Novotny et al, 2001; Takagaki, 1974; Voutsinos-Porche et al, 2003) not provided by other fuels.
Noninvasive 13C-NMR studies of the adult rat (Sibson et al, 2001; Oz et al, 2004) cerebral cortex show that glutamatergic neuronal activity requires substantial energy input, corresponding to ∼ 60% to 70% of total glucose oxidation. Studies in rodents have revealed a deceptively simple but robust relationship between glutamatergic neurotransmission and glucose oxidation. In the adult rat cortex the glutamate (Glu)/glutamine (Gln) neurotransmitter cycle flux (Vcyc) increases proportionately (in a ∼ 1:2 manner) with the glutamatergic tricarboxylic acid cycle (TCA) flux (VTCAn) over a wide range of activity above the isoelectric state (Sibson et al, 1998; Hyder et al, 2006).
Studies of cultured astroglia by Magistretti and coworkers (Pellerin and Magistretti, 1994) have shown that uptake of glutamate with co-transported sodium stimulates glial glucose utilization and the release of lactate. This finding together with recognition that exogenous lactate is oxidized to a greater extent than glucose by neuronal cultures (Itoh et al, 2003) provides the basis for a possible explanation of the observed 1:2 relationship between δ Vcyc and δ VTCAn (or ∼ 1:1 for δCMRGlc(n)). We have hypothesized (Sibson et al, 1998; Hyder et al, 2006) that the observed ∼ 1:2 relationship could arise if the ATP used to clear extracellular glutamate, through expulsion of co-transported sodium and synthesis of glutamine from glutamate, is provided by glial glycolysis.
A functional linkage between glial glutamate uptake and stimulated oxygen or glucose utilization has also been observed in the developing rodent brain in vitro and in vivo. Glutamate and potassium-evoked increases in respiration are not observed in rat brain slices before P10 (Takagaki, 1974). In 10-day-old mice, the stimulation-induced increase in 2-14C-deoxyglucose uptake in the barrel cortex during whisker deflection is substantially suppressed with mutations or antisense knockdown of the glial glutamate transporters, GLAST or GLT1 (Voutsinos-Porche et al, 2003). This mechanism could explain the apparent specificity of glucose in the attainment of neurological competence in the postnatal period.
Glutamatergic and γ-aminobutyric acid (GABA)ergic neurons are the most abundant neurons in the neocortex. During postnatal development, asymmetric synapses (excitatory and presumed glutamatergic) and symmetric synapses (GABAergic) are comparable in number from P4 to P8 (57:43) but rapidly diverge with ‘glutamatergic’ synapses greatly outnumbering GABAergic synapses (90:10) by P32 (De Felipe et al, 1997). Many glutamatergic synapses are functionally ‘silent’ in the early postnatal period (Ben-Ari et al, 1997), developing in a layer and activity-dependent manner in relation to the expression of functional AMPA receptors (Ben-Ari et al, 1997; Rumpel et al, 2004). In contrast, the GABAergic interneurons, which are excitatory (depolarizing) early in development (Leinekugel et al, 1999), form functional connections earlier than glutamatergic synapses (Ben-Ari et al, 1997). Despite extensive information on the morphology, neuro-physiology, and receptor types expressed in these neuronal populations, their energetic contributions to glucose oxidation and the cycling of their neurotransmitters between neurons and glia during this critical period are largely unknown.
Recently, we reported that TCA cycle and neurotransmitter cycle fluxes of glutamatergic and GABAergic neurons in vivo could be separately determined using two different 13C-labeled substrates which are metabolized in neurons and glia differently, [1,6-13C2]glucose and [2-13C]acetate (Patel et al, 2005). Using this approach in adult rats under halothane anesthesia, cortical glutamatergic and GABAergic neurons were found to contribute ∼ 80% and ∼ 20%, respectively, of neuronal glucose oxidation and neuronal/glial cycling (Patel et al, 2005).
In this study, the TCA cycle and neurotransmitter cycle fluxes of glutamatergic and GABAergic neurons were determined from the 13C turnover rates of the major amino-acid pools (glutamate, GABA, glutamine, and aspartate) in P10 and P30 rat cortex ex vivo after in vivo intravenous infusions of [1,6-13C2]glucose and [2-13C]acetate. The flux ratios, Vcyc/VTCAn, which were evaluated for both types of neurons from the steady-state fractional enrichments of Glu-C4, GABA-C2, and Gln-C4 during the infusion of [2-13C]acetate, were employed as constraints in fitting a three-compartment metabolic model (glutamatergic neurons, GABAergic neurons, and astroglia) to the time courses of 13C labeling of amino acids from [1,6-13C2]glucose. This study provides the first quantitative characterization of developmental changes in oxidative glucose metabolism and neuronal/glial cycling in the two major neuronal populations of rat cerebral cortex. The study also provides unique insights into the metabolic relationships between glutamatergic and GABAergic neurons, and the potential role of glucose in the emergence of functional activity and during this critical period of postnatal development.
Materials and methods
Animal Preparation
All experiments were done under protocols approved by the Yale Animal Care and Use Committee. Male Sprague—Dawley rats were studied at two postnatal ages: P10 (24.7 ± 1.8g, n = 24) and P30 (102.3 ± 7.6 g, n = 20). Rats were anesthetized with urethane (1.5 g/kg, intraperitoneally). 13C-labeled substrates were administered via a tail vein (P10) or femoral vein (P30). The femoral artery was also cannulated in P30 rats for monitoring of arterial blood pressure and blood gases. Physiological parameters (heart rate, respiratory rate) were monitored throughout the experiments (BioPac Systems Inc., Santa Barbara, CA, USA; MP100A-CE). The core body temperature was maintained near 37°C with a heating pad and a temperature-regulated recirculating water bath.
Thirty minutes after injection of urethane, an intravenous infusion of either [1,6-13C2]glucose or [2-13C]acetate (99 atm%; Cambridge Isotopes, Andover, MA, USA) was begun. The [1,6-13C2]glucose (1.5 μmol per 100g per min) was infused in P10 rats for 15, 30, 60, 90, 150 mins, and in P30 rats for 7, 15, 30, 60, 120 mins using three to four rats for each infusion time point. The different timed infusion periods were chosen to allow adequate sampling of the isotopic 13C enrichment of amino acids owing to age-related differences in metabolic rates. In separate experiments, [2-13C]acetate (10 μmol per 100 g per min) was infused for 2 to 3 h in P10 (n = 8) and 2 h in P30 (n = 4) rats (Patel et al, 2005). Blood was sampled periodically in P30 rats for blood glucose and gas determination; however, in P10 rats, blood was sampled from the heart at the end of each experiment to avoid blood loss in the younger animals. Blood samples were centrifuged immediately on collection, the plasma removed, frozen in liquid N2, and stored at −80°C for later measurement of glucose and acetate concentrations, and 13C enrichments. At the end of each 13C-substrate infusion, the brain was frozen in situ using liquid N2.
Preparation of Cortical Extracts and Separation of Amino Acids
Metabolites were extracted from frozen cortical tissue (120 to 160 mg) as described previously (Patel et al, 2005). The frozen tissue was ground with 0.1 mol/L HCl in methanol (1:2 w/v) cooled in a dry-ice/ethanol bath and then transferred to a wet-ice bath. A known quantity of [2-13C]glycine (50 μL of 10 mmol/L solution) was added as an internal concentration reference. The tissue powder was homogenized with ice-cold ethanol (1:6 w/v; 60% ethanol: 40% deionized water) until no visible pieces remained. The homogenate was clarified by centrifugation (20,000 g). The supernatant was lyophilized and resuspended in 500 μL of a phosphate-buffered (100 mmol/L, pH 7) deuterium oxide (Cambridge Isotope Laboratories, Cambridge, MA, USA) solution containing 0.5 mmol/L 3-trimethylsilyl[2,2,3,3-D4]-propionate, which served as a chemical shift reference.
Nuclear Magnetic Resonance Analysis of Cortical Extracts
Fully relaxed 1H-[13C]-NMR spectra of extracts were acquired at 11.74 T (Bruker AVANCE, Bruker Instruments Inc., Billerica, MA, USA, vertical bore NMR spectrometer) as described previously (Patel et al, 2005). The concentrations of metabolites were determined relative to a known concentration of [2-13C]glycine added during tissue extraction as an internal reference. The isotopic 13C enrichments of Glu-C4 and C3, GABA-C2 and C3, aspartate (Asp)-C3, and Gln-C4 were calculated from the ratio of the areas of these resonances in the 1H-[13C]-NMR difference spectrum (2 × 13C only) and the non-edited spectrum (12C + 13C) of the separated glutamate and glutamine fractions.
Analysis of Plasma Glucose and Acetate
Plasma glucose concentrations were determined using a Beckman Glucose Analyzer II. Model 6517; Beckman Instruments, Inc; 200 South Kraemer, Brea, CA, USA. Isotopic 13C enrichment of plasma glucose and the concentration and 13C enrichment of plasma [2-13C]acetate were determined by 1H-NMR spectroscopy under fully relaxed conditions (repetition time of 20 secs). The plasma samples were mixed with D2O and passed through a centrifugal filter (10-kd cut off; Nanosep, Centrifugal Devices, Pall Life Science, 500 South Wagner Road, Ann Arbor, MI, USA) to remove large macromolecules before spectral acquisition. The concentration of acetate was determined using a known concentration of formate, added to the sample as an internal reference. The isotopic 13C enrichment of [1,6-13C2]glucose (5.2 p.p.m.) and [2-13C]acetate (1.9 p.p.m.) were calculated by dividing the areas of the 13C-coupled satellites with the total area (12C + 13C).
Determination of the Flux Ratios (Vcyc/VTCAn) During [2-13C]Acetate Infusion
The values of the ratios, Vcyc/VTCAn, for glutamatergic and GABAergic neurons were calculated using the measured steady-state 13C enrichments of Glu-C4, GABA-C2, and Gln-C4 from [2-13C]acetate (modified from Patel et al, 2005) and given by
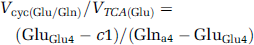
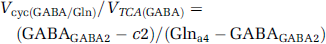
where GluGlu4, GABAGABA2, and Glna4 represent the steady-state 13C enrichments of Glu-C4 and GABA-C2 in the neuronal compartments, and Gln-C4 in the astroglial compartment, and c is a correction factor to remove contributions to brain amino-acid labeling from 13C-labeled pyruvate arising from systemic metabolism of [2-13C]acetate to 13C-labeled plasma glucose and/or lactate. γ-Aminobutyric acid and glutamine were assumed to be located entirely in GABAergic neurons and astroglia, respectively, whereas glutamate was assumed to be distributed between neurons and astroglia in the proportion 9:1 (see Discussion). The steady-state 13C enrichment of astroglial Glu-C4 was assumed to be equal to Gln-C4.
The correction factor (c) was calculated from the cortical alanine (Ala)-C3(Ac*) enrichment measured during the [2-13C]acetate infusion (assumed to reflect pyruvate-C3 enrichment), multiplied by a dilution term equal to the ratio of the steady-state enrichments of Glu-C4(Glc*) or GABA-C2(Glc*) with Ala-C3(Glc*) measured during the [1,6-13C]glucose infusion.
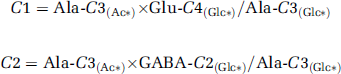
Because the end point Glu-C4(Glc*) and Ala-C3(Glc*) enrichments from [1,6-13C2]glucose were the same within the error, Glu-C4(Glc*)/Ala-C3(Glc*) was set to 1. The enrichment of Ala-C3 was employed rather than Lac-C3 because of overlap of the latter with threonine-(γCH3) at 1.33 p.p.m.
Determination of Metabolic Fluxes from Time Course Data
Metabolic fluxes were determined by fitting of a three-compartment metabolic model (glutamatergic neurons, GABAergic neurons, and astroglia; Figure 1) to the time courses of 13C labeling of Glu-C4, C3, GABA-C2, C3, and Gln-C4 during the [1,6-13C2]glucose infusion using the measured plasma glucose 13C-enrichment time course as the driver function. The ratios, Vcyc(Glu/Gln)/VTCA(Glu) and Vcyc(GABA/Gln)/VTCA(GABA), calculated using steady-state enrichment data from the [2-13C]acetate experiment, served as constraints to relate the cycle rates relative to the values of VTCA when fitting the time-course data. The metabolic model consists of a series of coupled differential equations reflecting mass balance, and 13C isotope flows from [1,6-13C2]glucose into neuronal and astroglial amino-acid pools using the CWave software package (G Mason) running in MATLAB (Mathworks, Natick, MA, USA). A complete description of the mass and isotope balance equations is given in Patel et al (2005). The equations were solved using a variable step numerical algorithm and data were fitted using an Levenburg—Marquardt algorithm. The mitochondrial/cytosolic α-ketoglutarate/glutamate exchange rate in the glutamatergic neurons (Vx) was evaluated, not constrained, in the time course analyses by fitting multiple carbon positions of glutamate. Because the sensitivity of the measurement is low to values of Vx in the astrocytic and GABAergic compartments, the values of Vx were fixed at approximately 10-fold the value of VTCA in these compartments. Dilution of 13C labeling owing to oxidation of unlabeled substrates (e.g., blood lactate or ketone bodies) leads to an effective steady-state dilution of the acetyl-CoA pool and is accounted for by a dilution flux (Vdil) for each compartment. The total glutamine and GABA pools were assigned to the astroglial and GABAergic compartments, respectively, whereas the glutamate pool was divided between glutamatergic neurons (88%), astroglia (10%), and GABAergic neurons (2%). Because of the sensitivity of some flux estimates to the neuronal glutamate concentration, we evaluated the effects of assuming a lower percentage for the fraction of total glutamate in glutamatergic neurons (78%) for P10 cortex where less information is known. In the analysis of the P30 data, anaplerotic flux (VPC) was assumed to be 20% of glutamine synthesis (Vgln) (Sibson et al, 2001), whereas for the P10 data, VPC was assumed to be 1/4 of its value at P30 (Schrijver et al, 1979). Fitted flow rates included glutamatergic and GABAergic TCA cycle fluxes (VTCA(Glu), VTCA(GABA)), astroglial TCA cycle flux (VTCAa), neurotransmitter cycles (Vcyc(Glu/Gln), Vcyc(GABA/Gln)), GABA shunt flux (Vshunt), and GABAergic TCA cycle flux (VTCA(GABA)). The rate of GABA synthesis (V GAD) is given by the sum of V cyc(GABA/Gln) and V shunt.
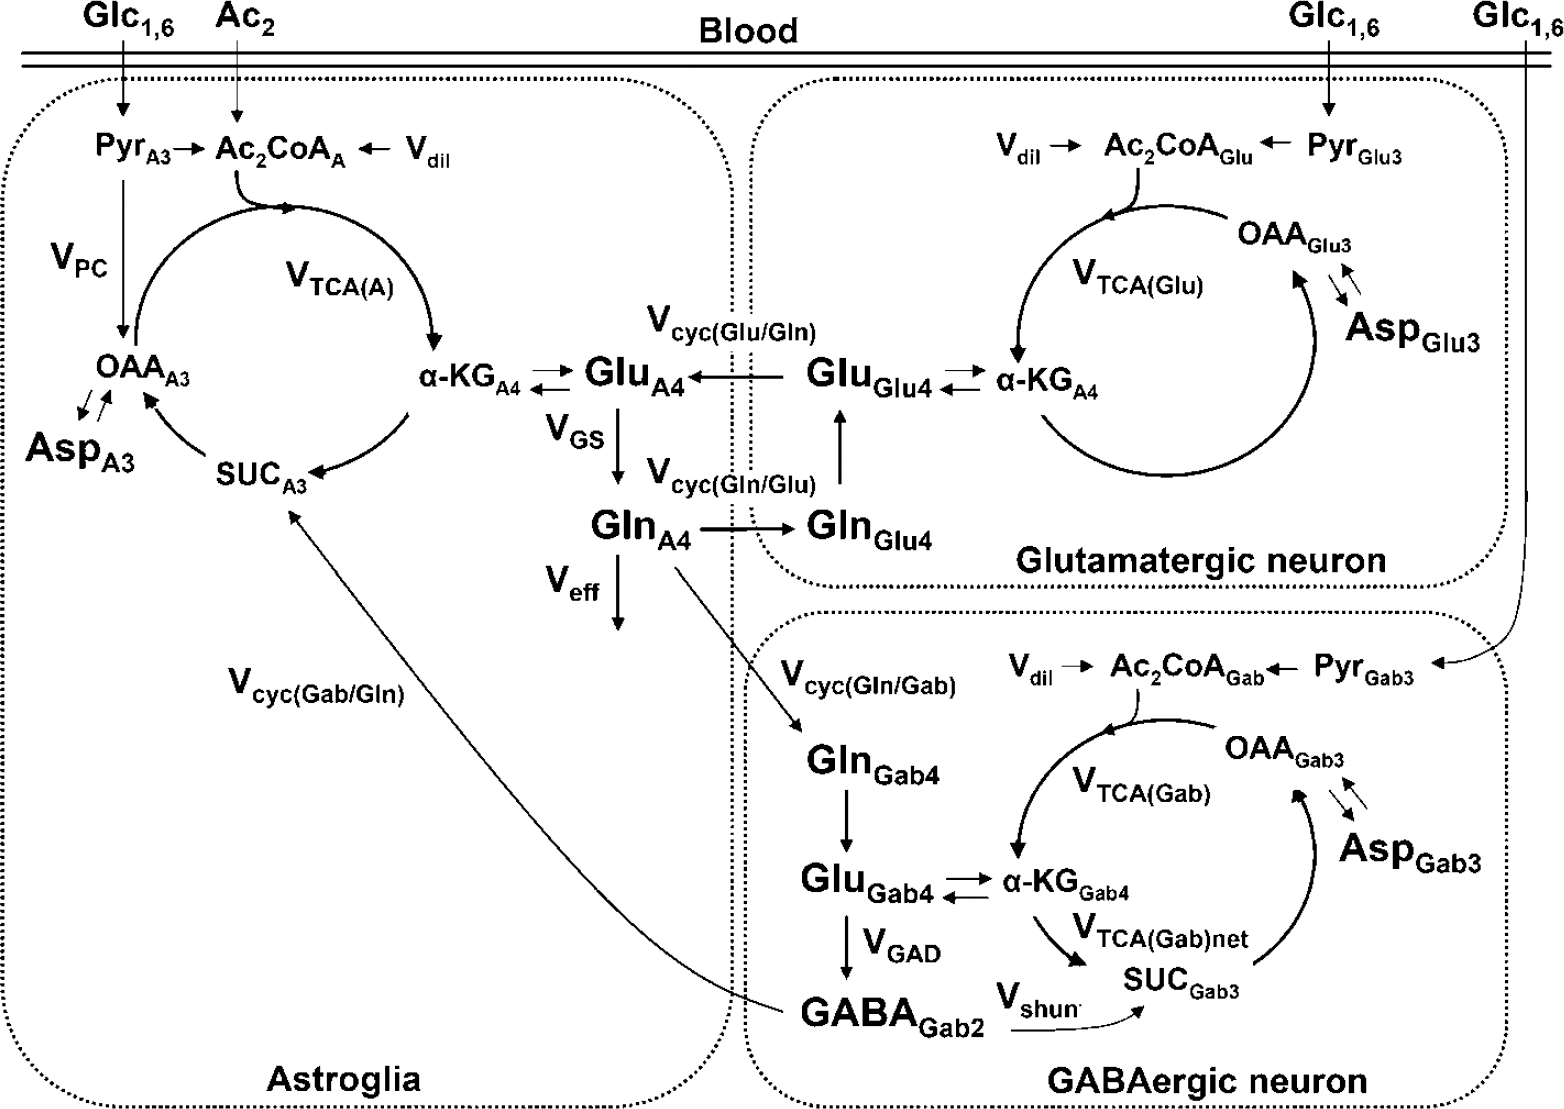
Metabolic model depicting 13C flows associated with the metabolism of [1,6-13C2]glucose and [2-13C]acetate in glutamatergic and GABAergic neurons and astroglia. The mass and isotope balance equations, which describe the three-compartment model and used in the analysis of the 13C-enrichment time courses is described in Patel et al (2005). For clarity only the first turn of the TCA cycle is depicted. [1,6-13C2]Glucose is metabolized in neurons and astroglia, whereas [2-13C]acetate is metabolized in astroglia. [1,6-13C2]glucose metabolism via glycolysis and the TCA cycle labels neuronal Glu-C4 (glutamatergic and GABAergic neurons) and GABA-C2 (GABAergic neurons) with label transfer to astroglia and synthesis of Gln-C4 by neurotransmitter cycling. Abbreviations: (subscripts: A, astroglia; glutamate, glutamatergic neuron; Gab, GABAergic neuron); VTCA, TCA cycle flux; Vcyc, neurotransmitter cycle flux; VGAD, glutamate decarboxylase flux; Vshunt, GABA shunt flux in GABAergic neurons; α-KG, α-ketoglutarate; SUC, succinate; OAA, oxaloacetate; VGS, glutamine synthetase flux; VPC, pyruvate carboxylase flux; VTCA(Glu), glutamatergic TCA cycle flux; VTCA(Gab), GABAergic TCA cycle flux; Vcyc(Gab/Gln), GABA/glutamine-cycling flux; Vcyc(Glu/Gln), glutamate/ glutamine-cycling flux.
Statistical Analysis
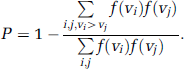
Statistical significance of differences in cerebral metabolite levels and 13C enrichments were assessed by the nonparametric Mann—Whitney U-test. Student's t-test was used to test for differences in the steady-state flux ratios. Values are given as mean ± s.d. The grouped data that were used for the kinetic analyses yielded only one set of time courses for each group, so that group statistics could not be assessed on the result. Instead, Monte—Carlo analyses were used to estimate the distributions of uncertainty for each parameter. For distributions that were approximately normal, such as the values of VTCA and Vcyc, s.d. are given. P-values were calculated by convolution of the distribution of values for each parameter in the two groups as given by
Results
Effects of Glucose and Acetate Infusion on Physiological Variables
Arterial blood physiological variables were measured in P30 rats where arterial access was possible but not in P10 rats owing to their small size. In P30 rats, the mean arterial blood pressure (80 ∼ 90 mm Hg), PaCO2 (35 ∼ 41 mm Hg), PaO2 (> 90 mm Hg), and blood pH (7.39 ± 0.03), were maintained within normal limits. Heart rate (400 ∼ 490 beats/min, P10; 350 ∼ 460 beats/min, P30) and respiration rate (105 ∼ 150 breaths/min, P10; 100 ∼ 115 breaths/min, P30) were also within normal limits. During the infusion of [2-13C]acetate, blood pH increased slightly (7.49 ± 0.06, P30) compared with [1,6-13C2]glucose.
Concentration and Enrichment of Plasma Glucose and Acetate
Infusion of [1,6-13C2]glucose led to a rapid increase in plasma glucose concentration to similar average levels (P > 0.05) in both groups (P10, from 7.9 ± 0.5 to 16.4 ± 1.3 mmol/L; P30, from 10.2 ± 0.9 to 15.1 ± 2.1 mmol/L) and levels remained nearly constant throughout the infusions (Table 1). The percentage 13C enrichment of plasma glucose-C1 rose from natural abundance (1.1%) to ∼ 33.2% in P30 rats (measured at 1 min) and 34.8% in P10 rats (measured at 15 mins) of infusion and increased slowly with infusion time (Table 1). The final percentage 13C enrichments of plasma glucose-C1 were similar for both age groups (46.6% ± 1.3%, P10 n = 3 versus 42.9% ± 4.4%, P30, n = 4, P > 0.2).
Plasma glucose concentration and percentage 13C enrichment in P10 and P30 rats during infusion of [1,6-13C2]glucose
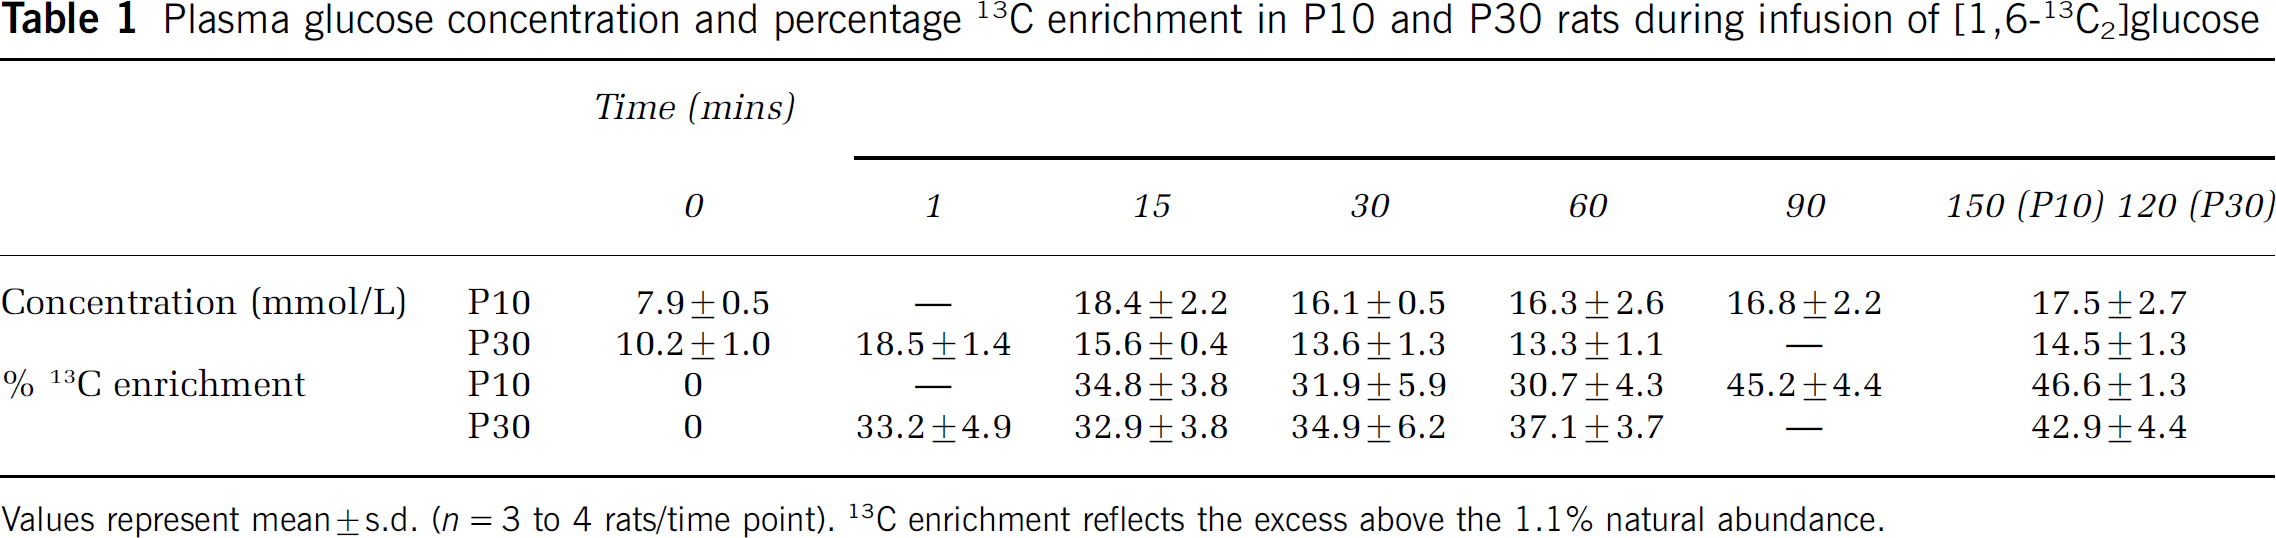
Values represent mean ± s.d. (n = 3 to 4 rats/time point). 13C enrichment reflects the excess above the 1.1% natural abundance.
In the acetate-infused rats, final plasma acetate concentrations were 8.4 ± 0.9 mmol/L (P10) and 11.0 ± 1.1 mmol/L (P30). The percentage enrichment of plasma acetate-C2 was slightly higher in P10 rats (P10, 81.2% ± 1.0%, n = 8) than in P30 rats (75.3% ± 1.6%, n = 4). The concentration of β-hydroxybutyrate was significantly (P < 0.01) higher in mixed arterio-venous blood of P10 rats (glucose infused, 0.28 ± 0.07 mmol/L; acetate infused, 0.89 ± 0.13 mmol/L) than in arterial blood of P30 rats (glucose infused, 0.11 ± 0.02 mmol/L; acetate infused, 0.40 ± 0.12 mmol/L), although for rats of both ages β-hydroxybutyrate levels were lower in glucose-infused animals.
Concentrations of Cortical Amino Acids During Postnatal Development
The concentration of cortical amino acids were determined from 1H-[13C]-NMR spectra of the extract (Figure 2). The concentrations (μmol/g) of glutamate (107%, P < 0.001), glutamine (38%, P < 0.01), GABA (35%, P < 0.01), Asp (40%, P < 0.01), and Ala (20%, P < 0.01) were significantly higher in P30 than P10 rat cortex (Figure 3), whereas succinate levels were similar (P > 0.05).
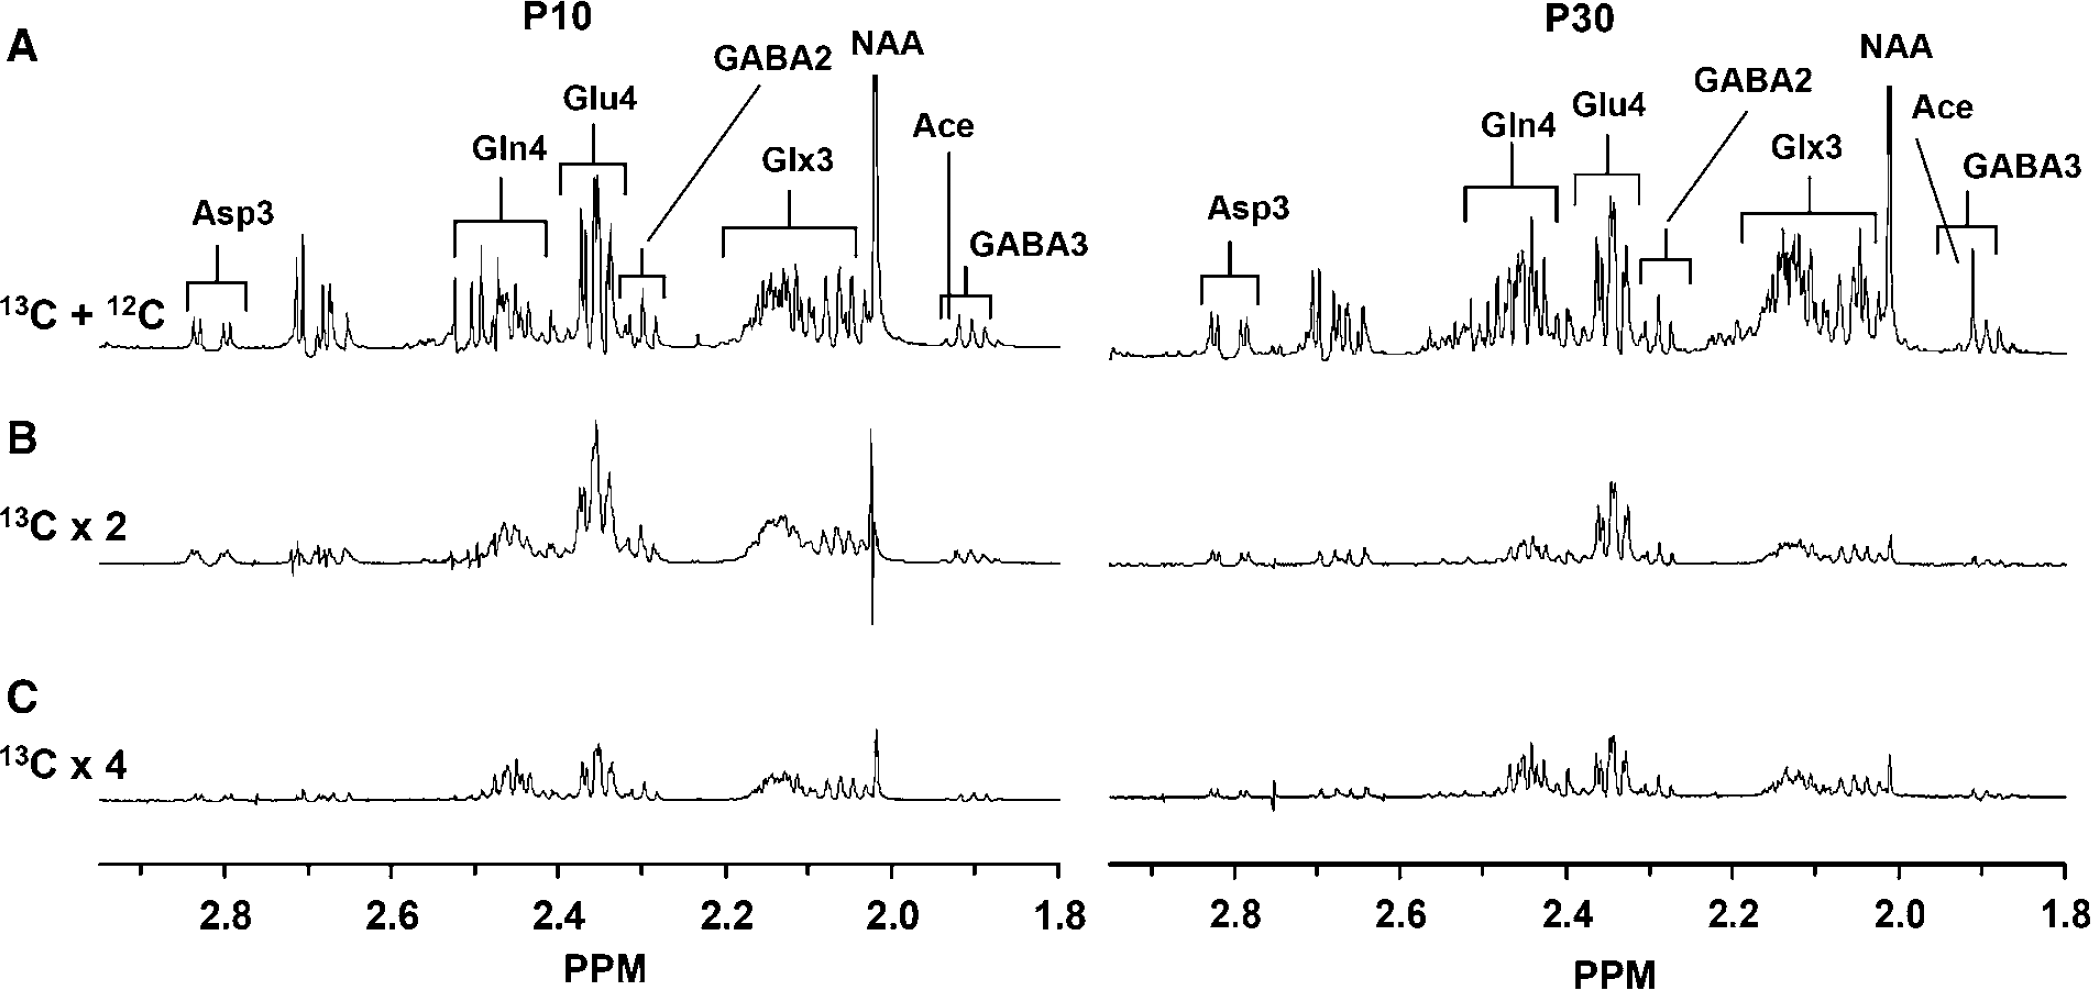
Representative ex vivo 1H-[13C]-NMR spectra of extracts of P10 and P30 cortex after intravenous infusion of [1,6-13C2]glucose and [2-13C]acetate. (
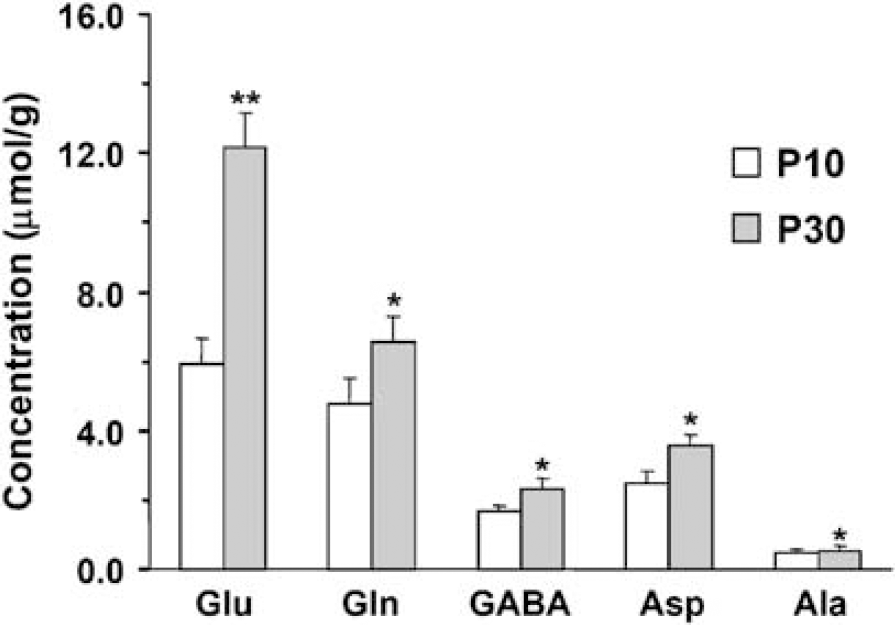
Concentrations (μmol/g) of cortical metabolites in P10 (open bar) and P30 (filled bar) rats. Values represent mean ± s.d., n = 24 and 20, respectively per group (**P < 0.001; *P < 0.01). Abbreviations: Ala, alanine; Asp, aspartate; GABA, γ-aminobutyric acid; Gln, glutamine; Glu, glutamate.
Steady-State 13C Labeling of Amino Acids from [2-13C]Acetate
The steady-state 13C enrichments of amino acids measured after 2 h infusion of [2-13C]acetate in P10 and P30 rats are given in Table 2 and Figure 2C. Lengthening the infusion time to 3 h in P10 rats (n = 3), where fluxes were slower, revealed no further increase in 13C enrichment (data not included) verifying that an isotopic steady state had been attained. Metabolism of [2-13C]acetate resulted in greater 13C labeling of Gln-C4 than Glu-C4 or GABA-C2 at isotopic steady state in both P10 and P30 rats (Table 2), consistent with the preferential metabolism of acetate in astroglia (Brand et al, 1997; Lebon et al, 2002). The enrichment of Gln-C4 was greater in P10 than P30 cortex (P < 0.01), whereas GABA-C2 and Asp-C3 were less (P < 0.05). No significant difference in 13C enrichment of Glu-C4 (P > 0.05) was observed between the two groups.
End point 13C enrichments of cortical amino acids following infusions of [1,6-13C2] glucose or [2-13C]acetate in P10 and P30 rats.
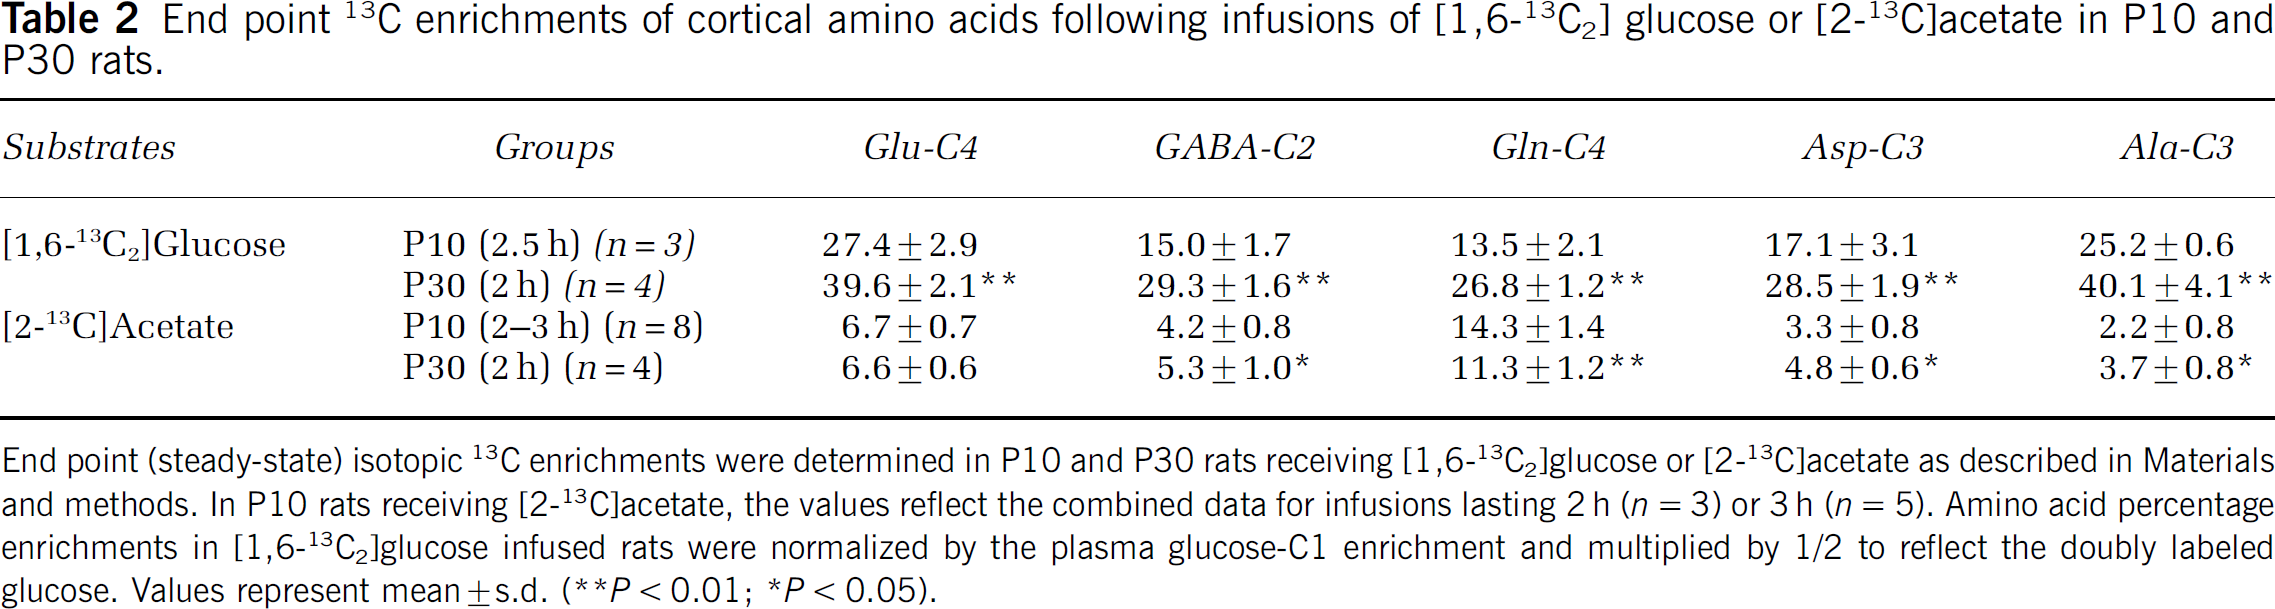
End point (steady-state) isotopic 13C enrichments were determined in P10 and P30 rats receiving [1,6-13C2]glucose or [2-13C]acetate as described in Materials and methods. In P10 rats receiving [2-13C]acetate, the values reflect the combined data for infusions lasting 2 h (n = 3) or 3h (n = 5). Amino acid percentage enrichments in [1,6-13C2]glucose infused rats were normalized by the plasma glucose-C1 enrichment and multiplied by 1/2 to reflect the doubly labeled glucose. Values represent mean ± s.d.
P < 0.01
P < 0.05.
Ratios of Neurotransmitter Cycling to Neuronal Tricarboxylic Acid Cycle Flux for Neurons
The ratios of neurotransmitter cycling to neuronal TCA cycle flux (Vcyc/VTCAn) for glutamatergic and GABAergic neurons were calculated from the steady-state 13C enrichments of Glu-C4, Gln-C4, and GABA-C2 observed during the infusion of [2-13C]acetate using Eqs. 1 and 2, respectively (Figure 4). For glutamatergic neurons, Vcyc(Glu/Gln)/ VTCA(Glu) was 0.49 ± 0.11 for P30 cortex and 0.48 ± 0.20 (P >0.9, n = 4, 8) or 0.32 ± 0.17 (P > 0.2) for P10 cortex, depending on the percentage of total glutamate (88% or 78%, respectively) assumed to be present in glutamatergic neurons of P10 cortex. For GABAergic neurons, Vcyc(GABA/Gln)/VTCA(GABA) was 0.43 ± 0.06 for P30 cortex and 0.31 ± 0.11 for P10 cortex, although the difference did not reach statistical significance (P > 0.07, n = 4, 8). The ratios of neurotransmitter cycling-to-TCA cycle flux for glutamatergic and GABAergic neurons were relatively similar between ages and across cell types.
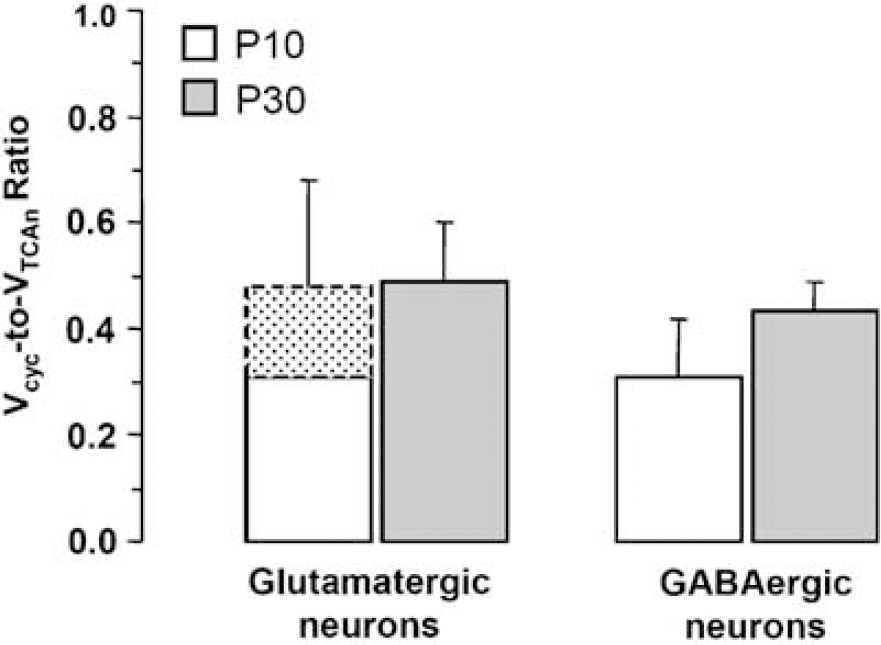
Estimated values of Vcyc/VTCAn from isotopic steady-state [2-13C]acetate data for P10 and P30 rat cortex. Flux ratios were calculated from the steady-state percentage 13C enrichment of Glu-C4, Gln-C4, and GABA-C2 from [2-13C]acetate using equations 1 and 2 (Materials and methods). The stippled area for glutamatergic neurons at P10 reflects the value of the ratio assuming that glutamatergic neurons contain 88% (maximum value) or 78% (minimum value) of total glutamate. Values represent mean ± s.d. with n = 8 (P10) and n = 4 (P30).
Kinetics of 13C Labeling of Amino Acids from [1,6-13C2]Glucose
Figure 5 shows time courses of 13C labeling of cortical amino acids in P10 and P30 rats during [1,6-13C2]glucose infusion. Isotopic turn over time was shorter and 13C content was greater for Glu-(C4, C3), GABA-(C2, C3), Asp-C3, and Gln-C4 in P30 rats than in P10 rats consistent with the higher rate of oxidative metabolism and neurotransmitter cycling in the more mature cortex. End point enrichments of amino acids were also higher in P30 compared with P10 cortex (Table 2), despite similar plasma glucose-C1 enrichments in both age groups (Table 1: P10, 46.6 ± 1.3 versus P30, 42.9 ± 4.4, P > 0.13), indicating that glucose supplied a greater fraction of total oxidative metabolism in the more mature cortex. The rate of 13C labeling of Glu-C3 was slower than that of Glu-C4 in both age groups (Figure 5), consistent with previous studies of adult rats (Patel et al, 2005; Oz et al, 2004).
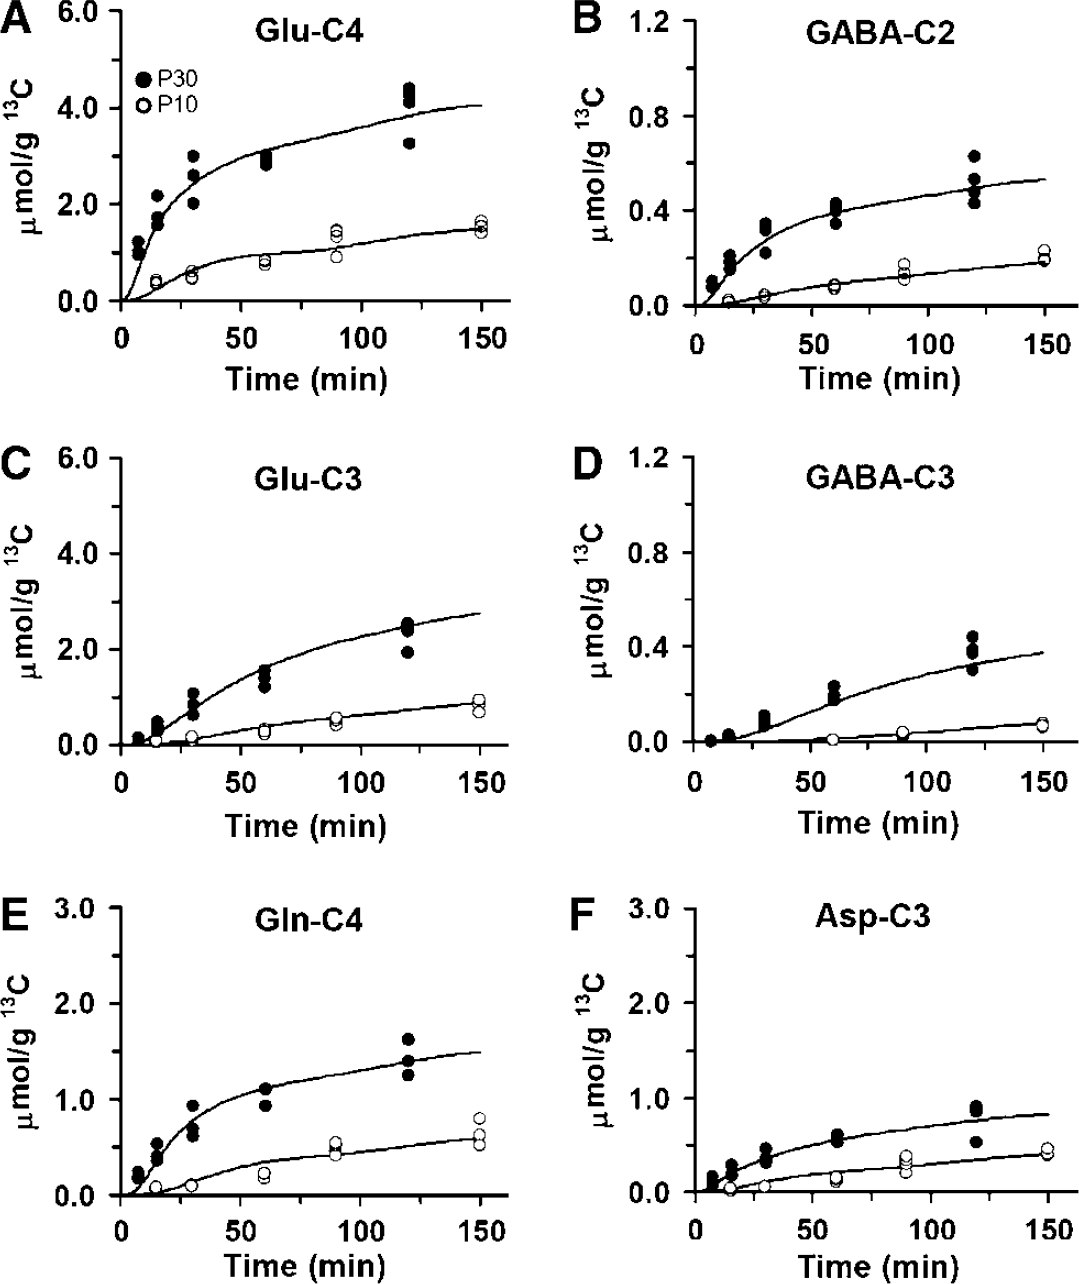
Optimal fits of the constrained, three-compartment metabolic model to 13C time courses of cortical glutamate, glutamine, GABA, and aspartate labeling from [1,6-13C2]glucose in P10 (◯) and P30 (•) rats. (
Cerebral Metabolic Fluxes During Postnatal Development
Cerebral metabolic fluxes were determined by the best fit of a three-compartment metabolic model to the 13C labeling time courses of amino acids (Figure 5). Glutamatergic fluxes (80% to 90% of total) substantially exceeded GABAergic fluxes at P10 and P30 (Figure 6) although their relative proportions differed slightly. In glutamatergic neurons from P10 to P30, VTCA(Glu) increased ∼ 2.7 × from 0.21 ± 0.02 to 0.56 ± 0.07 μmol per g per min (P < 0.0001), whereas VCYC(Glu/Gln) increased ∼ 2.8 to 4.6 × from 0.06 to 0.10 (± 0.01) to 0.28 ± 0.03 μmol per g per min (P < 0.0001) (Figure 6A). The range in values (0.06 to 0.10) reflected the assumed minimum (78%) and maximum (88%) range of the glutamatergic neuronal glutamate fraction used in the calculation of the P10 fluxes. When expressed as incremental changes in flux from P10 to P30,
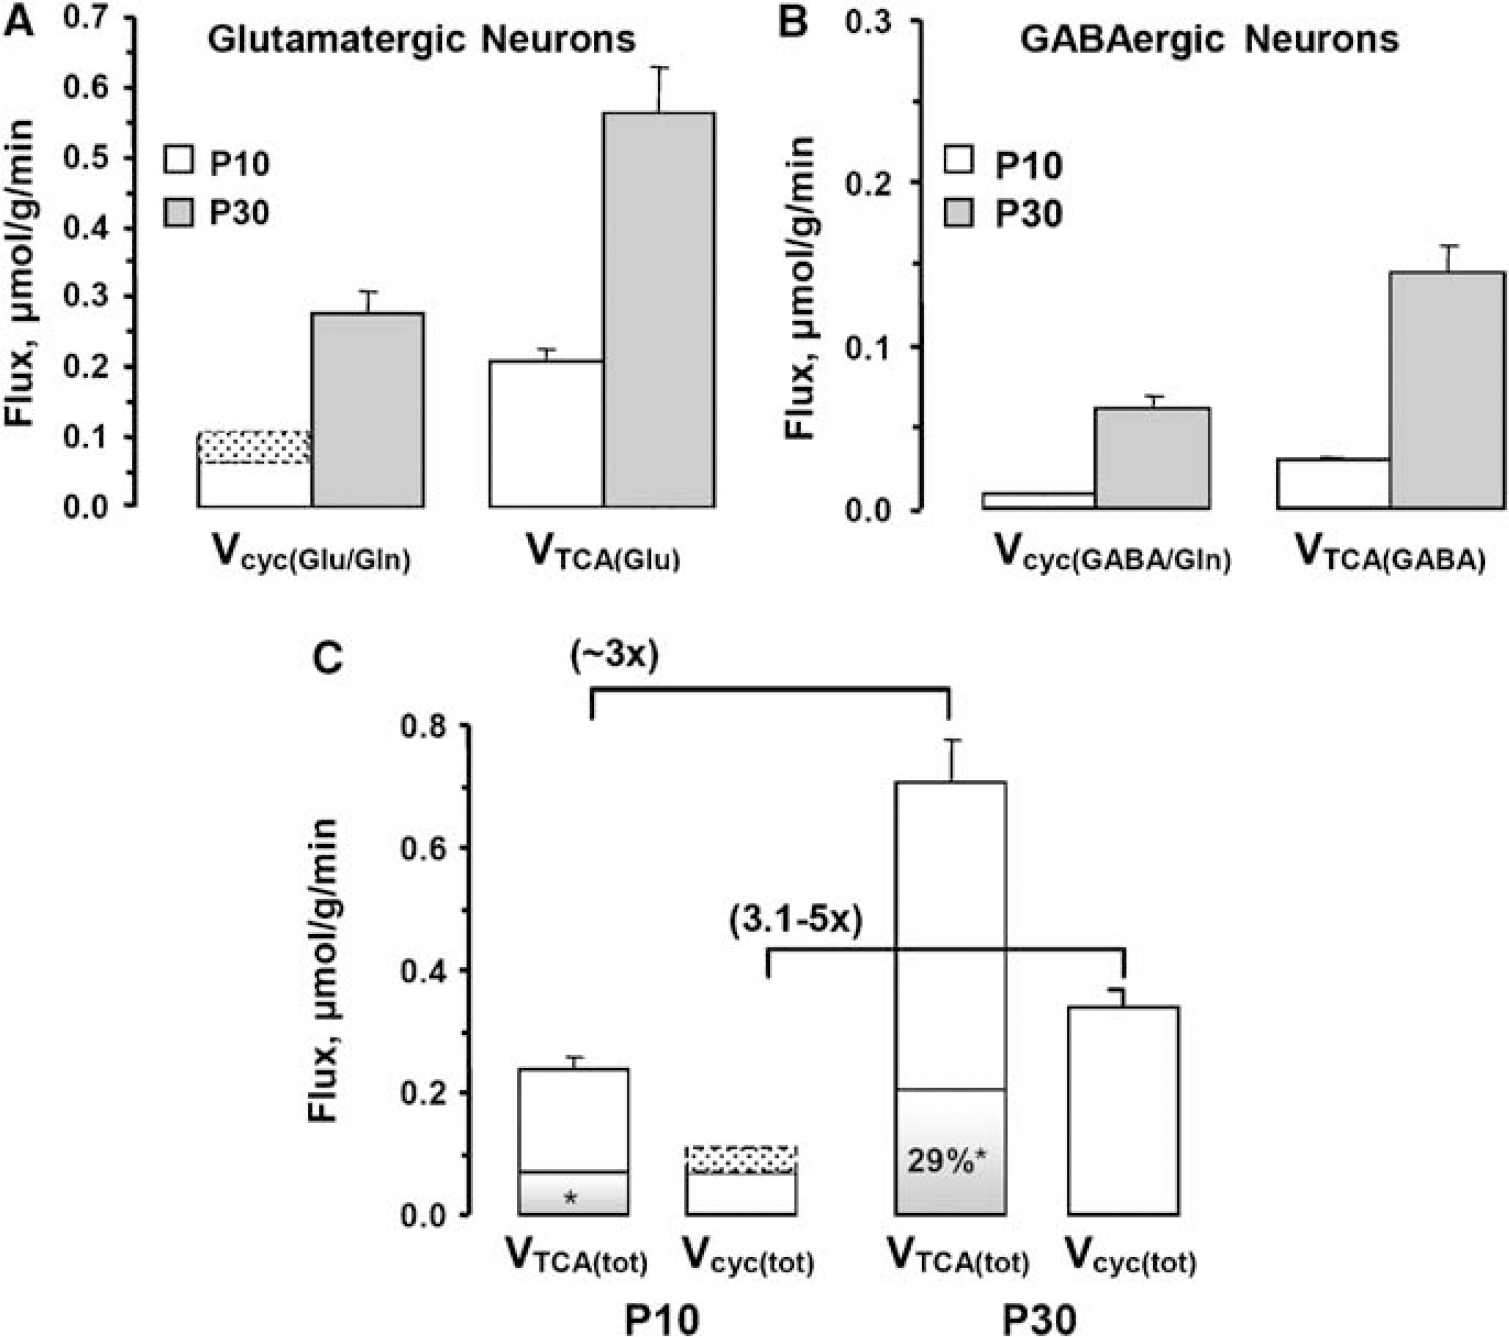
TCA cycle and neurotransmitter cycling fluxes determined for (
In GABAergic neurons increases in the respective fluxes from P10 to P30 were larger than for glutamatergic neurons, although absolute GABAergic fluxes at both ages were considerably less (Figure 6B). VTCA(GABA) increased ∼ 4.8 to 5.1 × from 0.028 to 0.030 (± 0.002) to 0.144 ± 0.018 μmol per g per min, P < 0.0001, whereas VCYC(GABA/Gln) increased ∼ 6.8 to 7.2 × from 0.009 (± 0.001) to 0.062 ± 0.008 μmol per g per min (P < 0.0001). When expressed as incremental changes from P10 to P30, δ VCYC(GABA/Gln) and δ VTCA(GABA) were 0.053 and 0.114 to 0.116 μmol per g per min, respectively, yielding a value for their ratio, δ Vcyc(GABA/Gln/δ VTCA(GABA) = 0.46. Thus, the ratios of the incremental flux increases from P10 to P30 for glutamatergic (0.49 to 0.62) and GABAergic (0.46) neurons were remarkably similar, with δ Vcyc and δ VTCAn increasing in a ∼ 1:2 manner.
When considered in toto (glutamatergic plus GABAergic) from P10 to P30 the increases in V TCAn(tot) of ∼ 2.9 to 3.0 × from 0.24 (70.05) to 0.7170.07 μmol per g per min (P < 0.0001) and Vcyc(tot) of ∼ 3.1 to 5.0 × from 0.07 to 0.11 (± 0.03) to 0.34 ± 0.03 μmol per g per min (P < 0.0001) were comparable in magnitude (Figure 6C). Expressed as increments in the total fluxes, δ Vcyc(tot) and δ VTCAn(tot) were 0.23 to 0.27 and 0.46 to 0.47, respectively, yielding a ratio δ V cyc(tot)/ δ VTCAn(tot) = 0.49 to 0.58 or ∼ 1:2.
Sensitivity of Vcyc/VTCAn to the Enrichment Correction
Systemic metabolism of [2-13C]acetate leads to isotopic enrichment of blood glucose-C1 (and C6) over time, which is metabolized in the brain to pyruvate-13C3, thus contributing to the 13C labeling of Glu-C4, Gln-C4, and GABA-C2 (Patel et al, 2005). The steady-state 13C enrichments of amino acids in the [2-13C]acetate-infused animals were corrected for this contribution by subtraction of the Ala-C3 enrichment (assumed to reflect pyruvate-C3 enrichment) corrected for dilution from non-labeled flow(s) into the respective acetyl-CoA pools. A comparison of the end point Glu-C4 and Ala-C3 enrichments in [1,6-13C2]glucose-infused animals (Table 2) showed no apparent differences at either postnatal age (P > 0.2 to 0.8), indicating that in glutamatergic neurons such inflows were negligible. In contrast, the end point enrichments of GABA-C2 from [1,6-13C]glucose were less than Ala-C3 for both age groups (P10, P < 0.001; P30, P < 0.003), suggesting the presence of a diluting flux into the GABAergic acetyl-CoA pool or alternatively, another pool of GABA turning over extremely slowly. Dilution effectively reduces the magnitude of the Ala-C3 enrichment correction from GABA (C2 in equation 2) elevating the value of the ratio, Vcyc(GABA)/ VTCA(GABA), compared with what would be seen in the absence of dilution.
Discussion
This study provides the first quantitative data on the contributions of glutamatergic and GABAergic neurons to glucose oxidation and neurotransmitter cycling in rat cortex over the critical postnatal period from P10 to P30. Over this period, increased rates of glucose oxidation in these neurons were accompanied by proportional increases in the rates of their respective neurotransmitter cycles. Thus, the tight activity-dependent coupling observed between Vcyc and VTCAn above isoelectricity in cortex of adult anesthetized rats (Sibson et al, 1998) is also displayed during postnatal development of neocortical glutamatergic/GABAergic synapses.
Methodological Considerations: Appropriateness of the Metabolic Model
The estimation of Vcyc and VTCAn for glutamatergic and GABAergic neurons was based on 13C turn over of glutamate, GABA, glutamine, and Asp using a three-compartment metabolic model consisting of a system of coupled first-order linear differential equations relating mass and 13C isotope balance under metabolic steady-state conditions (Patel et al, 2005). The model depicted in Figure 1 assumes three cellular compartments corresponding to glutamatergic neurons, GABAergic neurons, and astroglia interconnected by substrate (neurotransmitter) cycles involving intercellular flows of glutamate, GABA, and glutamine. The model was originally developed and characterized in studies of the adult cortex (Patel et al, 2005). Justification for the appropriateness of the metabolic model (Figure 1) in the analysis of 13C turn over in the immature (P10) brain is discussed below. We note that although the model contains three compartments, the inputs to each compartment (glutamate, glutamine, and GABA-positional 13C-fractional enrichments) were measured directly; thus, the rates derived for each compartment were independent, other than for intercompartmental mass balance constraints (e.g., the rate of glutamine leaving the astrocyte to replenish glutamate and GABA released from neurons must equal the sum of the rates of neurotransmitter glutamate and GABA entering the astrocyte).
Structure of the Metabolic Model
GABAergic and glutamatergic neurons are present at or near their adult densities by P10, representing ∼ 15% and ∼ 85%, respectively, of all cortical neurons (Balcar et al, 1992; Chronwall and Wolff, 1980; Micheva and Beaulieu, 1995; Morin and Beaulieu, 1994), although their synapses continue to increase in number until about the third postnatal week (Aghajanian and Bloom, 1967; Micheva and Beaulieu, 1996).
In this study glutamine, GABA, and glutamate were readily labeled from [2-13C]acetate in P10 cortex (Figure 2 and Table 2), in agreement with previous 14C-labeling studies (Van den Berg, 1970) indicating that glial glutamine synthesis and trafficking to neurons for glutamate and GABA re-synthesis is operational at this postnatal age. Glial and neuronal glutamine transporters (SN1 and SN2, respectively) are present at birth and peak at P14 (Boulland et al, 2003). The uptake of neuronally released glutamate and GABA by astroglia is also functional by this time (Vitellaro-Zuccarello et al, 2003). The expression of glial glutamate transporters and glutamine synthetase increase in parallel, reaching ∼ 70% to 80% of their adult values by P10 (Voutsinos-Porche et al, 2003). Functional coupling between glutamatergic neurons and astroglia, in terms of glial glutamate transport-coupled, 2-deoxyglucose uptake, has been demonstrated in vitro for mouse P10 somatosensory cortex (Voutsinos-Porche et al, 2003), which is similar to that seen in the adult. For GABAergic neurotransmission, evoked inhibitory synaptic potentials first appear 1 week after birth in the rat cortex (Sutor and Luhmann, 1995) and many features of GABAergic neurons are present by P10 to P15, including the density of GABAA receptors and composition of its subunits (Laurie et al, 1992). Thus, all the pathways depicted in the metabolic model (Figure 1) and used in the determination of the fluxes from the turnover data (Figure 5) are expected to be present and functional by P10.
Sensitivity of Calculated Fluxes to the Cellular Glutamate Distribution
The calculation of Vcyc/VTCA(Glu) (equation 1) requires as input the glutamate enrichment in the glutamatergic neurons—a quantity derived from the measured tissue enrichment based on the fraction of total glutamate assumed to reside in glutamatergic neurons. In this study, we assumed that in P30 cortex, the fraction of glutamate present in glutamatergic neurons was the same as for the adult cortex of 88% (Patel et al, 2005). In the adult rat brain, glutamate is mostly concentrated in glutamatergic neurons, and this is consistent with in situ glutamate immunohistochemistry, cell-culture studies, 14C-radioisotope labeling, and in vivo NMR (see Lebon et al, 2002; Patel et al, 2005, and literature cited therein). The value of Vcyc/VTCA(Glu) of 0.49 for P30 cortex as determined by the steady-state 13C labeling from [2-13C]acetate is in the upper range of values reported for halothane anesthetized or awake adult rats by fitting dynamic time courses from [1,6-13C2]glucose (0.39 to 0.42; Table 1 from Hyder et al, 2006) or from [1-13C]glucose and 14C-HCO3 (0.38 to 0.50; Oz et al, 2004), respectively. Although pyramidal neurons contain the vast majority of glutamate in developing cortex as in the adult, nerve terminals are fewer and the quantity of glutamate present in non-neuronal cells (mainly glia) is unknown and could differ from that assumed in the analysis, thus having an effect on the calculated fluxes. Reducing the percentage of the glutamate assigned to glutamatergic neurons in P10 cortex from 88% to 78% of total glutamate (corresponding to a doubling of glial glutamate levels) lowered V cyc(Glu/Gln/V TCA(Glu) from 0.48 to 0.32. The quality of the fits of P10 time course data using the lower neuronal glutamate fraction and corresponding flux ratio was similar to that using the higher values. The greatest impact was seen as ∼ 40% lower values of Vcyc(Glu/Gln) (from 0.10 to 0.06) and Vgln (from 0.14 to 0.08), whereas changes in VTCA(glu) (+ 2%), VTCA(GABA) (–7%), Vcyc(GABA/Gln) (–5%), and V GAD (∼ 0%) were small.
Postnatal Increases in Tricarboxylic Acid Cycle Flux and Neurotransmitter Cycling
The TCA cycle flux of the combined glutamatergic and GABAergic neuronal populations (V TCAn(tot)) increased ∼ 3 × from P10 to P30 (from 0.24 to 0.71 μmol per g per min), which represented ∼ 77% of the total TCA cycle flux of neurons and glia for the respective ages (from 0.27 ± 0.06 to 0.92 ± 0.07 μmol per g per min). These results compare well with previously reported increases in TCA cycle flux (Novotny et al, 2001), oxygen consumption (Kreisman et al, 1989), and glucose utilization (Nehlig and Pereira de Vasconcelos, 1993) over this postnatal period. The postnatal increase in oxidative metabolism was accompanied by comparably large increases in Vcyc(tot) of 3.1 to 5.0 × (from 0.07 to 0.11 (± 0.03) to 0.34 ± 0.03 μmol per g per min), the range in values at P10 reflecting the uncertainty in the cellular distribution of total glutamate at this age. The incremental changes in the respective fluxes from P10 to P30 (δ V cyc(tot) = 0.23 to 0.27 versus δ V TCAn(tot) = 0.47 μmol per g per min) were related in a ∼ 1:2 ratio (or ∼ 1:1 for δCMRglc(ox))—remarkably similar to the relationship observed in the adult cortex over a range of cortical activity (Sibson et al, 1998; Hyder et al, 2006). This is seen most clearly in Figure 7, where a plot of V cyc(tot) and V TCAn(tot) for P10 and P30 cortex lies close to the line of regression shown previously. The finding that the 1:2 relationship between δ V cyc(tot) and δ V TCAn(tot) observed in the adult rat cortex also exist for this critical period in postnatal development strongly suggests that this relationship reflects a fundamental process related to the energetics underlying the generation and maintenance of cortical neuronal activity.
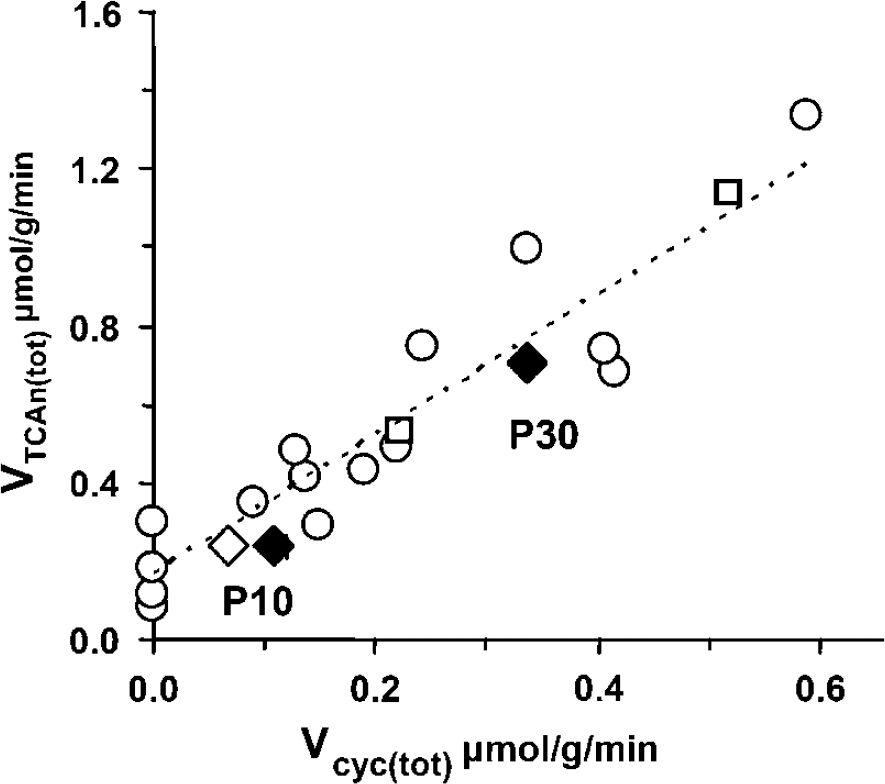
Plot of the total (glutamate + GABA) neurotransmitter cycling and TCA cycle fluxes measured in P10 and P30 cortex with previously reported data from anesthetized adult rat cortex measured over a range of activity (modified from Hyder et al, 2006). The dotted line (slope of 1.78, y-intercept of 0.16, r2 of 0.86) represents the best fit of the previous data (open circles, O) while excluding P10 and P30 values. The P10 and P30 data points (diamonds) fall close to the regression line found previously for the adult rat cortex. In P10 cortex the open diamond (⋄) corresponds to an assumed glutamate fraction in glutamatergic neurons of 78% versus 88% (♦) of tissue levels.
Comparison of Glutamatergic and GABAergic Neurotransmission During Development
Neurotransmitter cycling flux of glutamatergic neurons significantly exceeded GABAergic neurons at both postnatal ages (∼ 7 to 11:1 at P10 and ∼ 4:1 at P30). Glutamate and GABA neurotransmitter cycling fluxes at P10 were at most 36% and 15% (assuming that 88% of total glutamate is present in the glutamatergic neurons) of their respective fluxes at P30, so the greatest change was observed in GABA cycling over this period. Glutamate and GABA neurotransmitter cycling fluxes were 22% and 14% of their respective values at P30, assuming that cortical glutamatergic neurons at P10 and P30 contain 78% and 88% of the total glutamate at those ages, respectively. In either case, the fractional increase in GABAergic flux is larger. V cyc(GABA) represented 8% to 13% of the total cycling of glutamate and GABA at P10 and ∼ 18% at P30, the latter comparable to the value of 22% reported recently for the adult rat cortex (Patel et al, 2005), suggesting that GABAergic neurotransmission is near its adult value by P30.
GABAergic neuronal density (GAD-positive cell bodies) in rat neocortex is high at birth (Morin and Beaulieu, 1994) attaining near adult levels by P10 along with a substantial fraction (∼ 70%) of GAD-positive axon varicosities. In contrast, GABAergic synapses (synapses per neuron) expand rapidly from P10 to P30 (Micheva and Beaulieu, 1996). The observed increase in Vcyc(GABA) (∼ 7 ×), VTCA(GABA) (∼ 5 ×), and VGAD (∼ 5.5 ×) closely parallels the reported percentage increase in total GAD activity of 400% to 470% in the neocortex from P10 to adulthood (Balcar et al, 1992), becoming increasingly associated (65-kd isoform) with nerve terminals (Greif et al, 1991). Thus, the increase in GABA-related fluxes between P10 and P30 appears to be similar to the expansion in the number of inhibitory synapses. γ-Aminobutyric acid action at GABAA receptors is depolarizing (excitatory) at birth, but is mainly hyperpolarizing (inhibitory) by P10 with near adult expression of Cl−-dependent KCC2 channels (Stein et al, 2004); thus, the increase in GABA cycling between P10 and P30 likely corresponds to increasing neocortical inhibition.
Energetics of Signaling and Non-Signaling Processes During Development
In rodents, a major critical period in postnatal brain development occurs between the first and third postnatal week. This period is characterized by extensive changes in synaptic structural and functional organization, increased neuron-glia interactions, and strengthening of cortical networks (Aghajanian and Bloom, 1967; Chattopadhyaya et al, 2004; Deza and Eidelberg, 1967; Lujan et al, 2005; Patel and Balazs, 1970). Attwell and Laughlin (2001) have calculated on the basis of patch clamp and morphometric data that much of the energy consumed in mature cortical synapses is associated with functional activity, whereas maintenance of resting potentials, growth, and non-signaling functions consume quantitatively lesser amounts. Consistent with these calculations, in vivo studies suggest that ∼ 85% of neuronal metabolism in adult rat brain is associated with functional activity (Hyder et al, 2006). Quantitative estimates of the energetics of activity/signaling verses non-signaling processes during development is not known, although parallel changes in the expression of enzymes connected to energy metabolism (e.g., cytochrome oxidase, Na+/K +-ATPase, glycolytic, and TCA cycle enzyme activities) and major neurotransmitter systems (particularly glutamate and GABA) suggest that activity-dependent processes achieve greater quantitative and functional importance by P30. In rat brain slices, glutamate and potassium-evoked increases in oxygen utilization do not appear before P10 (Takagaki, 1974). In vivo studies show that sensory-evoked increases in glucose utilization are detected by P10 in barrel cortex (Melzer et al, 1994) and between about P13 to P18 in auditory and visual areas (Nehlig and Pereira de Vasconcelos, 1993). The present findings are consistent with these studies and extend them by providing the fractional energy use of glutamatergic and GABA neurons. Applying the relationships between cycling and energy metabolism found in the adult rat suggests that even at P10 neuronal energetics is associated mainly with functional activity.
The neuronal TCA cycle produces energy to maintain signaling (neurotransmission) and non-signaling (housekeeping) activities and both components are included in V TCAn, which enters into the ratio, V cyc/V TCAn. Because of the sensitivity of V cyc(Glu/Gln)/VTCA(Glu) to the glutamate concentration (equation 1), and the uncertainty in the neuronal fraction of glutamate in P10 cortex, we could not determine whether the ratio remained constant (assuming that the neuronal glutamate fraction was the same at P10 and P30) or had increased (assuming that the neuronal fraction was less at P10 than P30), although an increase > 50% is considered unlikely. For GABAergic neurons, V cyc(GABA)/V TCA(GABA) was greater at P30 than P10 (+ 39%), but this difference did not reach statistical significance (P = 0.07). Attwell and Laughlin (2001) have noted that basal energy expenditure is dominated by ion pumping to restore ion gradients and maintain resting membrane potentials. The fraction of energy devoted to this task depends directly on the surface area of neuronal and glial membranes, which would be expected to increase as the number of nerve terminals and glia cells (and their corresponding surface area) increased from postnatal day 10 to 30 (Aghajanian and Bloom, 1967; Micheva and Beaulieu, 1996). Although the large increase in metabolism and known proliferation in synapses might be anticipated to increase neurotransmitter cycling above that of the more immature and less active cortex at P10, the expansion in surface area and sodium pump activity will also raise non-signaling energy expenditure.
Estimates of the fraction of oxidative metabolism devoted to non-signaling activities in the anesthetized (resting) adult rat brain range from ∼ 15% to 30% (Choi et al, 2002; Patel et al, 2005; Sibson et al, 1998), although comparable data for the immature cortex is not yet available. Assuming the same constant fraction of VTCAn(tot) for support of non-signaling activities (15% to 30%) at both ages gives values of ∼ 0.04 to 0.07 and ∼ 0.10 to 0.21 μmol per g per min at P10 and P30, respectively. These values are moderately lower than the TCA cycle fluxes measured in P10 (0.17 μmol per g per min) and P30 (0.34 μmol per g per min) rat cortical slices perfused and maintained at rest in vitro (Novotny et al, 2001), a preparation in which glutamate/glutamine cycling flux is very low. Further studies to investigate whether V cyc/V TCAn remains constant or increases during development will require better assessment of the cellular glutamate distribution. The direct measurement of the non-signaling component of VTCAn in developing cortex under isoelectric conditions where Vcyc ∼ 0 (Sibson et al, 1998) should allow the two contributions to be separately assessed.
Conclusions
The current findings indicate that the postnatal increase in glucose oxidation between P10 and P30 is associated with roughly proportional increases in the neurotransmitter cycles of glutamatergic and GABAergic neurons. The incremental changes in total neurotransmitter cycling and neuronal TCA cycle flux between P10 and P30 were ∼ 1:2, consistent with the relationship of 1:2 (or 1:1 in terms of glucose oxidation) measured previously in the adult rat cortex. Although glutamatergic fluxes exceed GABAergic fluxes at P10 (∼ 7 to 11:1) and P30 (∼ 4:1), GABAergic fluxes increased to a greater extent over this period.
Footnotes
Acknowledgements
We thank Mr Xiaoxian Ma for his assistance in the preparation of animals and Dr Prajna Siddiqui for her assistance in the preparation of extracts.