
Abstract
Patients with obstructive sleep apnea (OSA) are at elevated risk of developing systemic vascular disease and cognitive dysfunction. Here, cerebral oxygen metabolism was assessed in patients with OSA by means of a magnetic resonance-based method involving simultaneous measurements of cerebral blood flow rate and venous oxygen saturation in the superior sagittal sinus for a period of 10 minutes at an effective temporal resolution of 1.3 seconds before, during, and after repeated 24-second breath-holds mimicking spontaneous apneas, yielding, along with pulse oximetry-derived arterial saturation, whole-brain CMRO2 via Fick’s Principle. Enrolled subjects were classified based on their apnea-hypopnea indices into OSA (N = 31) and non-sleep apnea reference subjects (NSA = 21), and further compared with young healthy subjects (YH, N = 10). OSA and NSA subjects were matched for age and body mass index. CMRO2 was lower in OSA than in the YH group during normal breathing (105.6 ± 14.1 versus 123.7 ± 22.8 μmol O2/min/100g, P = 0.01). Further, the fractional change in CMRO2 in response to a breath-hold challenge was larger in OSA than in the YH group (15.2 ± 9.2 versus 8.5 ± 3.4%, P = 0.04). However, there was no significant difference in CMRO2 between OSA and NSA subjects. The data suggest altered brain oxygen metabolism in OSA and possibly in NSA as well.
Keywords
Introduction
Obstructive sleep apnea (OSA), a chronic breathing disorder, is characterized by repeated closure or stenosis of the upper airway during sleep. The prevalence of OSA has increased significantly over the past two decades. Currently, OSA afflicts nearly 30 million adults between the ages of 30 and 70 years in the USA, with the disorder being more than twice as common in men than in women.1,2 The recurrent complete or partial airway obstructions (apnea and hypopnea, respectively) result in reduced arterial blood oxygenation and elevated blood carbon dioxide (CO2). As a result of the periodic rise in respiratory effort, conscious or unconscious arousal from sleep occurs. In response, sympathetic nervous system activity subsequently increases to restore airflow. 3 The nocturnal episodes may lead to excessive daytime sleepiness, fatigue, morning headache and memory loss as the most common symptoms stated by OSA patients. Obesity has been reported as a primary risk factor causally linked to the development and progression of OSA. For instance, a 10% increase in body weight has been found to increase the likelihood of moderate-severe OSA up to six-fold. 2
Oxidative stress and concomitant inflammation are thought to be adverse consequences of periodic episodes of oxygen desaturation and resaturation. 4 The long-term outcome of the condition is endothelial dysfunction, with duration, frequency and severity of apnea being key determinants. 4 Some studies have demonstrated an association of intermittent nocturnal hypoxemia and hypercapnia with a greater propensity of hypertension, stroke, cardiovascular disease and type-2 diabetes.5–7 Among neurologic findings in OSA patients is neuronal loss in the hippocampus and frontal cortex. These structural changes have been associated with a decline of memory and executive function, findings that have been attributed to intermittent hypoxia. 8
The brain, as a high energy-demanding and metabolically active organ, receives 15% of cardiac output and consumes 20% of total body oxygen and 25% of total body glucose. 9 During aerobic respiration, conversion of glucose to water and CO2 generates the bulk of the energy needed to synthesize adenosine triphosphate (ATP) to maintain brain activity during the resting states. Investigation of oxygen delivery to and consumption by the brain can thus provide insight into the brain’s metabolic state. The cerebral metabolic rate of oxygen (CMRO2) has therefore become a metric for assessing the rate of energy consumption by the brain.
The normal response to hypercapnia and hypoxia is central vasodilation and concurrent peripheral vasoconstriction.10,11 Physiologically, intracellular calcium concentration is mediated by the elevated partial pressure of CO2 in arterial blood, which subsequently elicits central vasodilation and thus increases blood flow to the brain. Current knowledge suggests that under steady-state conditions, CMRO2 is maintained within a certain range in response to a various physiologic challenges, including short-term hypercapnia and hypoxia. 12 Autoregulation generally maintains cerebral perfusion to meet neuronal metabolic requirements during hypercapnia (which recent work suggests may not be isometabolic 13 ) and hypoxia, therefore preventing brain injury. On the other hand, autoregulation may fail in a variety of disorders, including ischemic and degenerative disease.14–17
Quantification of CMRO2 requires both cerebral blood flow (CBF) and oxygen extraction fraction (OEF). Positron emission tomography (PET) is generally regarded as the gold standard for measurement of CMRO2 achieved by quantifying 15 O-labeled water, converted from the inhaled 15 O-labeled exogenous radiotracers, along with a measurement of blood-flow from injected H215O and 15 O-labeled carbon monoxide for quantification of blood volume. 18 However, the complexity of the method, concerns about radiation dose, along with the relatively long duration of the procedure complicate clinical studies. Recently, magnetic resonance imaging (MRI) has emerged as a non-invasive alternative for whole-brain CMRO2 estimation.19–21 Crucial to these methods is the quantification of venous oxygen saturation relying on deoxyhemoglobin paramagnetism. Techniques either directly quantify magnetic susceptibility20,22 or blood water transverse relaxation rate.19,23,24
The method used in the present work, referred to as susceptometry-based oximetry (SBO), quantifies the venous blood oxygenation fraction (SvO2) in the sagittal sinus based on measurement of the phase difference between intra- and extravascular regions, yielding CMRO2 from a joint measurement of CBF.20,25 In the present implementation of SBO, SvO2 and CBF were obtained with a velocity-encoded radial pulse sequence (referred to as rOxFlow), which quantifies both SvO2 and CBF at a temporal resolution on the order of seconds, suited for dynamic measurement of CMRO2 during breath-hold challenges. 26 Here, we aimed to evaluate the hypothesis that CMRO2 in subjects with established OSA is reduced, both at baseline and in response to a series of cued breath-holds (BH) mimicking spontaneous nocturnal apneas, in comparison to those without OSA, and additionally recruited young healthy participants.
Materials and methods
MRI imaging technique and procedure
Venous oxygen saturation (SvO2) and CMRO2 estimation
Central to the method described previously is the quantification of SvO2 in the superior sagittal sinus, which drains the cerebral cortex. It is based on a measurement of the induced field resulting from paramagnetic deoxyhemoglobin in the vessel relative to the surrounding brain parenchyma by means of field mapping, yielding:
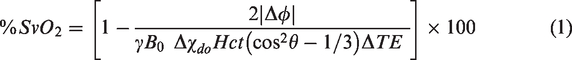
Here Δϕ is the phase difference between intravascular blood and surrounding tissue accrued over a time ΔTE, γ is the proton gyromagnetic ratio, Δχdo is the susceptibility difference between fully deoxygenated and fully oxygenated red blood cells, Hct represents hematocrit, and θ is the angle between the blood vessel and the static magnetic field B0.
27
CMRO2 is then computed by combining measurements of total cerebral blood flow (tCBF) obtained by phase-contrast velocity encoding in the same vein and measurement of arterial oxygen saturation (SaO2) by pulse oximetry via Fick’s Principle:20,21

Radial OxFlow sequence
The radiofrequency (RF) spoiled triple-echo gradient echo sequence with golden angle radial sampling has been described previously. 26 In brief, the pulse sequence collects the two equal-polarity echoes 1 and 3 of inter-echo time ΔTE=TE3–TE1 in a three-echo gradient-echo sequence. The sequence is played out twice for each radial spoke, differing only in the first moment of the gradient along the blood flow direction. This approach enables quantification of blood flow velocity and yields SvO2 from the measured inter-echo phase difference (equation (1)). The radial OxFlow sequence was run with the following sequence parameters: FOV = 2402 mm2; voxel size = 1 × 1 × 5 mm3; flip angle = 15°; sampling frequency bandwidth = 278 Hz/pixel; TR/ΔTE = 19/8 ms and VENC = 76 cm/sec in the direction of blood flow. Successive pairs of views were incremented by 111.25° and continuously collected for 10 minutes.
MR imaging protocol
All imaging was performed at 3 Tesla field strength (3 T Prisma, Siemens Healthineers, Erlangen, Germany), using a standard clinical 20-channel head coil. Subjects were fitted with a finger pulse oximeter (Medrad Veris 8600, Bayer Medical Care Inc., Indianola, PA, USA) to monitor SaO2. The procedure started with a time-of-flight (TOF) MR projection angiogram for slice prescription and computation of the tilt angle θ of the vessel (equation (1)), followed by a T1-weighted magnetization-prepared rapid gradient-echo (MP-RAGE) for brain volume quantification, and a two-slice-interleaved phase-contrast MRI (PC-MRI) 21 conducted once initially during normal breathing to determine SSS blood flow to total CBF ratio (SSSBF:tCBF)cal at baseline (for more detail, see Wu et al, JCBFM 2020). 28 Subsequently, rOxFlow was run to obtain the time-courses of velocity and SvO2 at mid-skull level of the superior sagittal sinus (SSS), as depicted in Figure 1(a). After completion of the MRI exam, hemoglobin level (Hb) was measured for each subject from a fingerstick blood sample (Hemocue Hb 201+, Angelholm, Sweden).
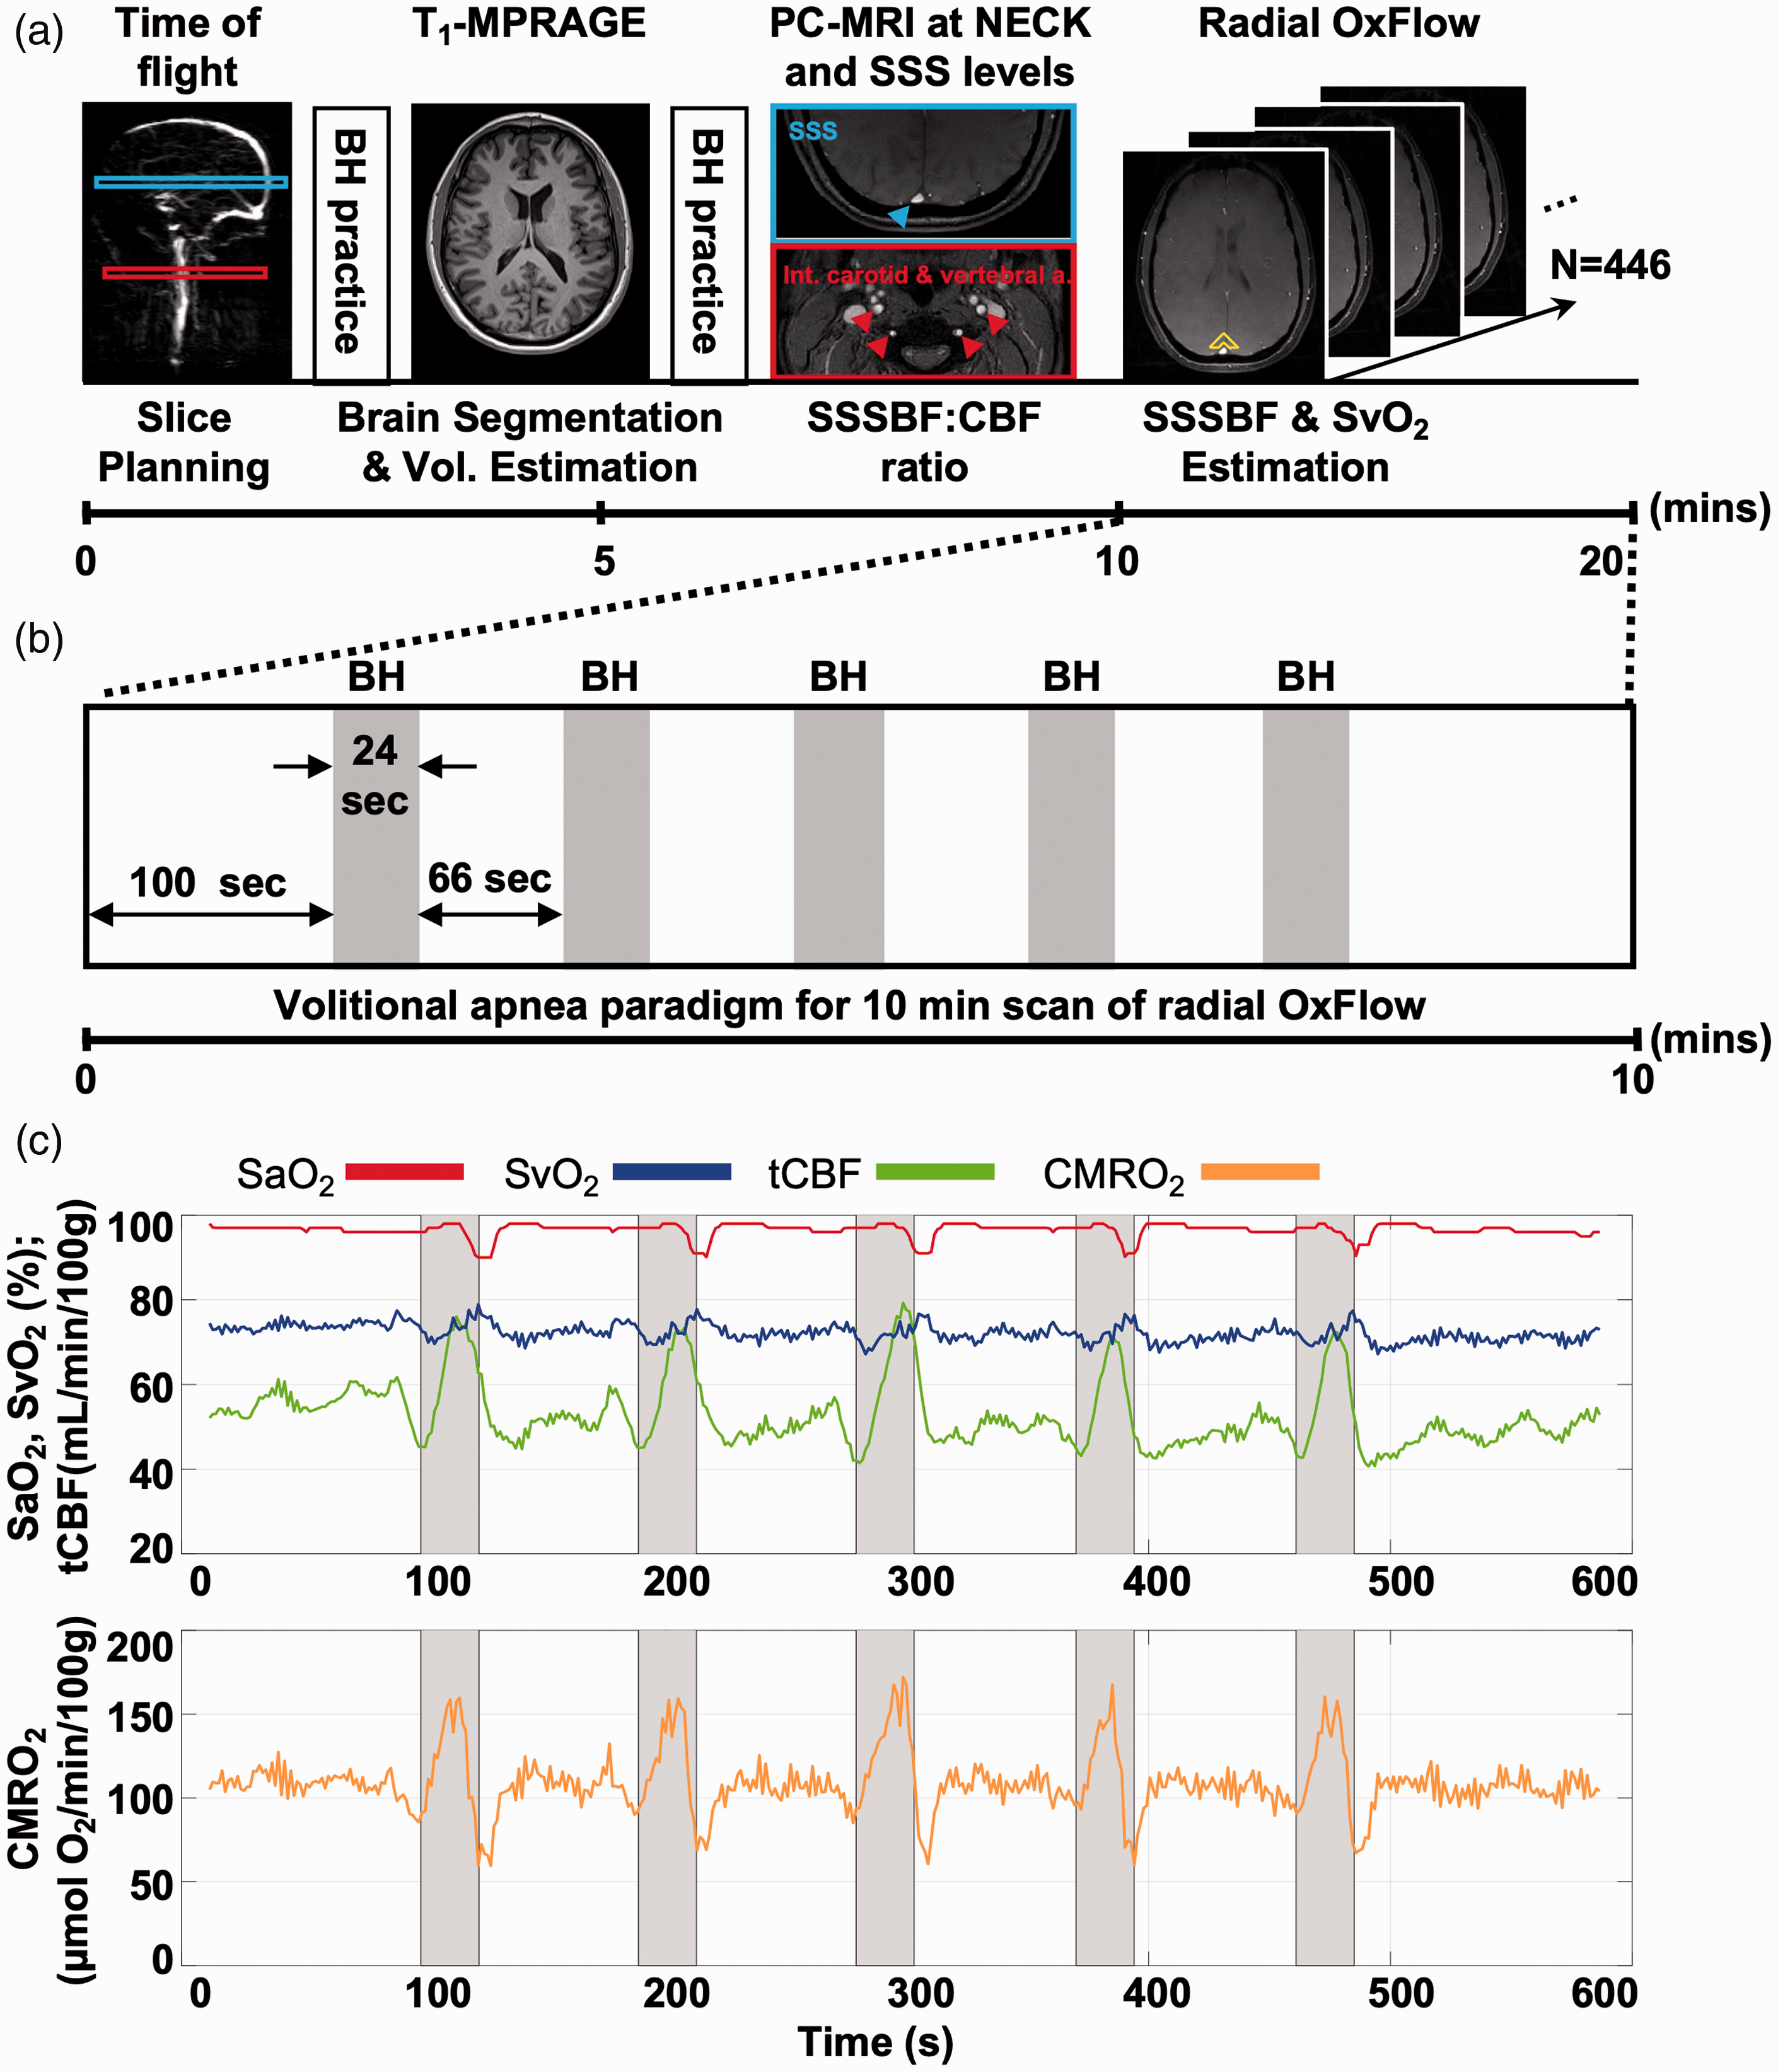
MR protocol for global CMRO2 quantification and volitional apneic paradigm. (a) Time-of-flight MR projection angiogram, T1-weighted MP-RAGE and interleaved phase contrast (PC)-MRI acquired for slice prescription/vessel tilt angle estimation, brain segmentation and calibration ratio, respectively (for detail see text). Two 24-second practice apneas are included in the protocol prior to the 10 minutes of continuous scanning. Reconstructed rOxFlow produced time-courses of velocity and SvO2 at mid-head level of SSS for CMRO2 quantification at rest and in response to volitional apnea. Surrounding tissue used to determine the phase shift Δϕ for SvO2 estimation is encompassed by the yellow structure (see equation (2)). (b) Apnea paradigm consisting of 5 breath-hold (BH) periods followed by 66 s of normal breathing. (c) Temporal response to the BH paradigm in a representative OSA subject (AHI = 27) showing pulse-oximetry-derived SaO2, MRI-based SvO2 and tCBF, as well as computed CMRO2 in absolute physiologic units. Gray shading in (b) and (c) indicates 24-s cued BH periods.
Volitional apnea paradigm
To mimic nocturnal apneas experienced in OSA, volitional apneic challenges (breath-hold) were performed to induce a dynamic vasodilatory response during 10 minutes of continuous scanning. The paradigm consisted of 100 seconds of normal breathing preceding five 24-second breath-hold periods interspersed with 66 seconds of normal breathing (see Figure 1(b)). Subjects were instructed to hold their breath at end expiration following instructions “breathe in”, “breathe out” and “hold” prior to each breath-hold challenge, and “breathe normally” after the final breath-hold challenge. To maximize intra-and inter-subject compliance, visual instructions were presented by projecting the commands onto a screen along with pre-recorded verbal instructions given via MRI-compatible headphones.
Study subjects
The protocol was approved by the University of Pennsylvania Institutional Review Board as guided by the ethical principles set forth in the Belmont Report. Forty-nine subjects with clinically diagnosed OSA and twenty-four non-sleep apnea (NSA) subjects, i.e., 73 subjects total, with their age, height, weight and body mass index (BMI) matched, were enrolled. Subjects were drawn from a pool of patients with abnormal sleep pattern, examined at the University of Pennsylvania’s Sleep Center between February 2016 and November 2019, and grouped on the basis of the apnea hypopnea index (AHI) from polysomnography with AHI > 15 events/h classified as OSA and AHI < 10 events/h as NSA, in whom the highest AHI was 8.4. All OSA subjects were scanned prior to undergoing clinically indicated treatment with continuous positive airway pressure (CPAP). The subjects examined largely coincide with those previously studied to investigate cerebrovascular reactivity. 28 Ten participants were additionally recruited as young healthy reference subjects (YH) with normal BMI (range 20–24.6 kg/m2) and no history of sleep disorders. Subjects were screened for standard MRI exclusion criteria (claustrophobia, pregnancy, metal implants, etc.) and disorders likely to affect cerebral metabolism and blood flow, including congestive heart failure, chronic obstructive pulmonary disease, stroke, head trauma, and other significant neurological conditions. Cigarette smokers and users of other nicotine products were excluded as smoking and/or nicotine use are known to affect vasodilation. 29 Written informed consent was obtained from all study subjects before the examinations.
Data analysis
Image reconstruction and all imaging analysis were performed with in-house scripts written in MATLAB (The MathWorks Inc., Natick, MA, USA). The lumen areas of the carotid and vertebral arteries and the SSS in the following were isolated by means of optimum global thresholds determined by maximizing the between-class variance. 30 Blood flow rate was determined as the product of ROI-averaged velocity and vessel lumen cross-sectional area.
MP-RAGE images used for calculation of brain volume were segmented into grey and white matter using SPM12. 31 The ratio between phase-contrast MRI measurements of blood flow in the SSS (SSSBFcal) and the carotid and vertebral arteries (tCBFcal) was used to derive a calibration ratio to scale SSS flow measurements in rOxFlow to total CBF, as described above (see supplementary Figure S1).
The acquired rOxFlow raw data were first phase-corrected for direction-dependent gradient delays caused by eddy currents. 32 The k-space weighted image contrast (KWIC) filtering was subsequently applied to allow for higher temporal resolution while retaining full spatial resolution. 33 Specifically, 34 views were encoded in the central k-space region, with the number of views increasing gradually toward greater k-values to allow a smoother transition between inner and outer annuli in the k-space regions, and 610 views were used in the outermost annulus of the k-space to satisfy the Nyquist criterion for a 240 × 240 matrix size. A sliding-window reconstruction scheme with 34 views was implemented for the time series, yielding 446 image frames corresponding to a temporal resolution of 1.29 seconds. 26
The reconstructed data were then employed to compute CBF and SvO2 time-courses (see supplementary Figure S2 showing a single time frame at baseline and end apnea). The velocity images were computed from the phase difference between flow-encoded and flow-compensated images. SSSBF was calculated and upscaled to whole-brain CBF by using (SSSBF:tCBF)cal ratio 21 as the SSS drains the cerebral cortex only. Finally, tCBF was normalized by brain mass, converted from the brain volume based on an average brain density of 1.05 g/mL. 34 Maps of inter-echo phase difference between two echoes (ΔTE) with equal polarity, averaged over the two velocity encoding acquisitions, were obtained for SvO2 computation. Images were processed by fitting the brain tissue surrounding the SSS to a second-order polynomial, to correct the phase bias induced by large-scale field inhomogeneity. 35 SvO2 was then computed via equation (1) from the phase difference Δϕ between the blood in the SSS and the surrounding brain parenchyma (yellow structure in Figure 1(a)) obtained from the corrected inter-echo phase difference maps. The area surrounding the SSS was automatically segmented via morphological processing (i.e., dilation and erosion) of the SSS mask, generating an irregular shape of nine pixels length and two pixels removed from the SSS. The SSS vessel tilt angle θ was computed using the TOF images via the measurement of the centroid of the SSS two slices below and above the rOxFlow imaging plane. Hct level was obtained by multiplication of Hb with an empirical factor of 3 through the hemoglobin-hematocrit relationship. 36
From tCBF and arterio-venous difference (AvO2D, i.e., SaO2 - SvO2), CMRO2 was subsequently obtained via equation (2). For each variable of a subject, the time series data were grouped into five 90 s blocks and averaged to remove physiological noise unrelated to the paradigm, and thereby improving overall signal-to-noise ratio. Average baseline values were computed over the last 20 s (16 time points) of the temporal average time-courses. The time span was empirically determined in light of subject compliance with the instructions, showing improved adherence after the first cued “breathe-in”, thereby yielding a more reliable baseline response at the end of each cycle. Because the physiological changes in response to apnea are not expected to occur instantaneously and varied between subjects, average end-apnea (EA) values were quantified by averaging data over the second half (12 s, 9 time points) of the apneic response. The apneic response was obtained as the fractional change relative to average baseline. Mean and standard error (SE) were calculated for each group over the average time courses.
Statistical analysis
Seven OSA subjects withdrew before or during the MR procedure. Sixty-six out of 73 eligible OSA and NSA subjects and 10 YH participants completed the MR volitional paradigm, but in four cases CMRO2 could not be obtained due to disconnection of the pulse oximeter probe during scanning. Further, four subjects with severe OSA were unable to stay awake and experienced spontaneous apneas during the 10-minute continuous scan, and six phase-difference images were corrupted due to subject noncompliance (including bulk body motion) or artifactual signal void in the occipital region. Therefore, 62 study subjects (comprising 10 YH subjects) were included for analysis.
Statistical analysis was performed with SPSS Statistics 24 (IBM, Armonk, NY, USA). One-way analysis of variance (ANOVA) was performed for inter-group comparisons. Post-hoc tests were conducted when appropriate (i.e., when P < 0.05) to examine group differences via unpaired two-sided t-tests. Paired t-tests were done for evaluation of the apneic responses within each group individually. Associations between neurophysiologic parameters and AHI were tested as a means to examine the sensitivity of outcomes to OSA severity, by using Pearson’s correlation coefficient. A P-value <0.05 was considered as the criterion for statistical significance.
As a further step toward understanding potential effects of confounding factors, group analysis was performed using analysis of covariance (ANCOVA) with age and BMI taken into account for assessment of hemodynamic parameters quantified at baseline and during the breath-hold challenge.
Results
Subject demographics and parameters used for group assignment are given in Table 1. Mean values of subjects enrolled after screening for sleep apnea differed in AHI (37.1 ± 17.4 vs. 2.66 ± 2.41 events/hour, P < 0.001, classified as OSA and NSA, respectively). The two groups further differed in SaO2 nadir, i.e., the point of largest arterial desaturation during nocturnal apneas (75.7 ± 9.56 vs. 87.9 ± 4.03%HbO2, P < 0.001, respectively) as expected. However, the two groups did not differ in either age, height, weight, or BMI (all P > 0.05) because they were prospectively matched. Young healthy reference subjects (YH), by definition, were younger than OSA patients (26.4 ± 3.84 vs. 49.4 ± 11.2 years, P < 0.001) and had lower weight and BMI (64.7 ± 9.66 vs. 95.2 ± 15.5 kg, P < 0.001, and 22.4 ± 1.60 vs. 31.8 ± 4.20 kg/m2, P < 0.001) but did not differ in average height. Note that subjects in each group shown in Table 1 were able to complete the MR procedure and their data were subsequently analyzed for group comparisons
Demographics of OSA patients, non-sleep apnea (NSA) subjects and healthy young (YH) reference subjects who were able to complete the MR procedure and yielding evaluable data, with OSA and NSA matched for age, height, weight, and BMI.
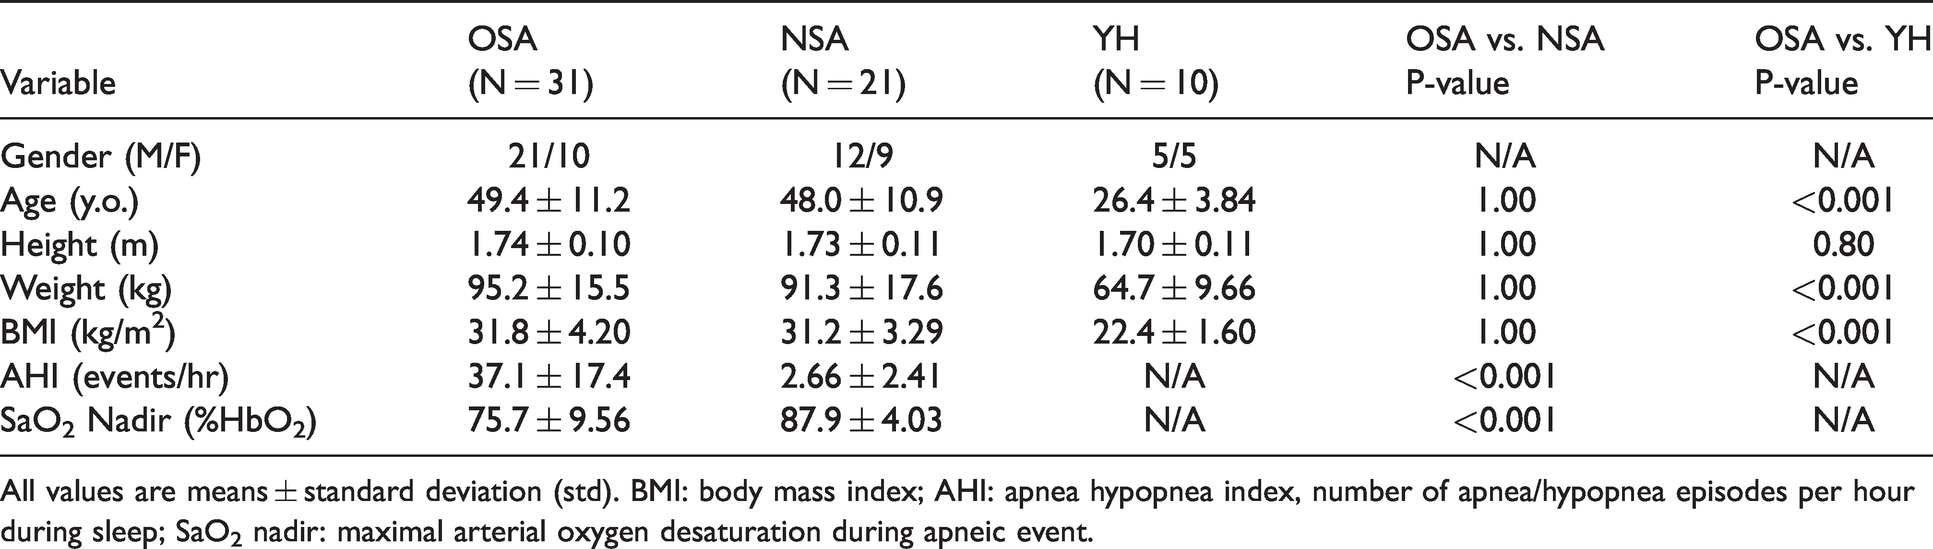
All values are means ± standard deviation (std). BMI: body mass index; AHI: apnea hypopnea index, number of apnea/hypopnea episodes per hour during sleep; SaO2 nadir: maximal arterial oxygen desaturation during apneic event.
Figure 1(a) and (b) illustrate the imaging protocol and breath-hold paradigm. The time-course of measured physiologic parameters across five successive breathing/breath-hold cycles shown in Figure 1(c) exemplifies the overall response seen in the study subjects at baseline and following the apneic challenge. The breath-hold stimulus is known to provoke a hypercapnic as well as hypoxic response, both resulting in increased blood flow. Apnea is clearly not isometabolic as indicated by a significant increase in CMRO2 in all three groups (P < 0.001), analogous to previous observations in healthy subjects. 21
Figure 2(a) displays the averaged time-courses over five blocks from the same subject, illustrating the mean response to the apneic (i.e., breath-hold) stimulus. The group-averaged time-courses of physiologic quantities are shown in Figure 2(b) and (c), suggesting greater SvO2 and lower tCBF as well as considerably lower CMRO2 in the subject groups characterized by disordered sleep (i.e., OSA and NSA) versus YH throughout the BH block. The changes of tCBF, AvO2D and CMRO2 normalized to baseline are depicted in Figure 3. We note that the response follows different kinetics for the three physiologic parameters. Total CBF shows a pre-breath-hold undershoot likely caused by hyperventilation and associated hypocarbia during the “breathe in” – “breathe out” preparation period for the breath-hold. The AvO2D time-course is determined by the temporal changes in SaO2 and SvO2, which are not exactly simultaneous, causing an undershoot following initiation of the breath-hold period. The CMRO2 time-course is essentially the product of AvO2D and tCBF (per Fick’s Principle, see equation (2)), qualitatively matching BOLD kinetics (see, for instance, reference 28). Importantly, the response in CMRO2 is positive in all three groups (see also Table 2), demonstrating the pro-metabolic effect of apnea.
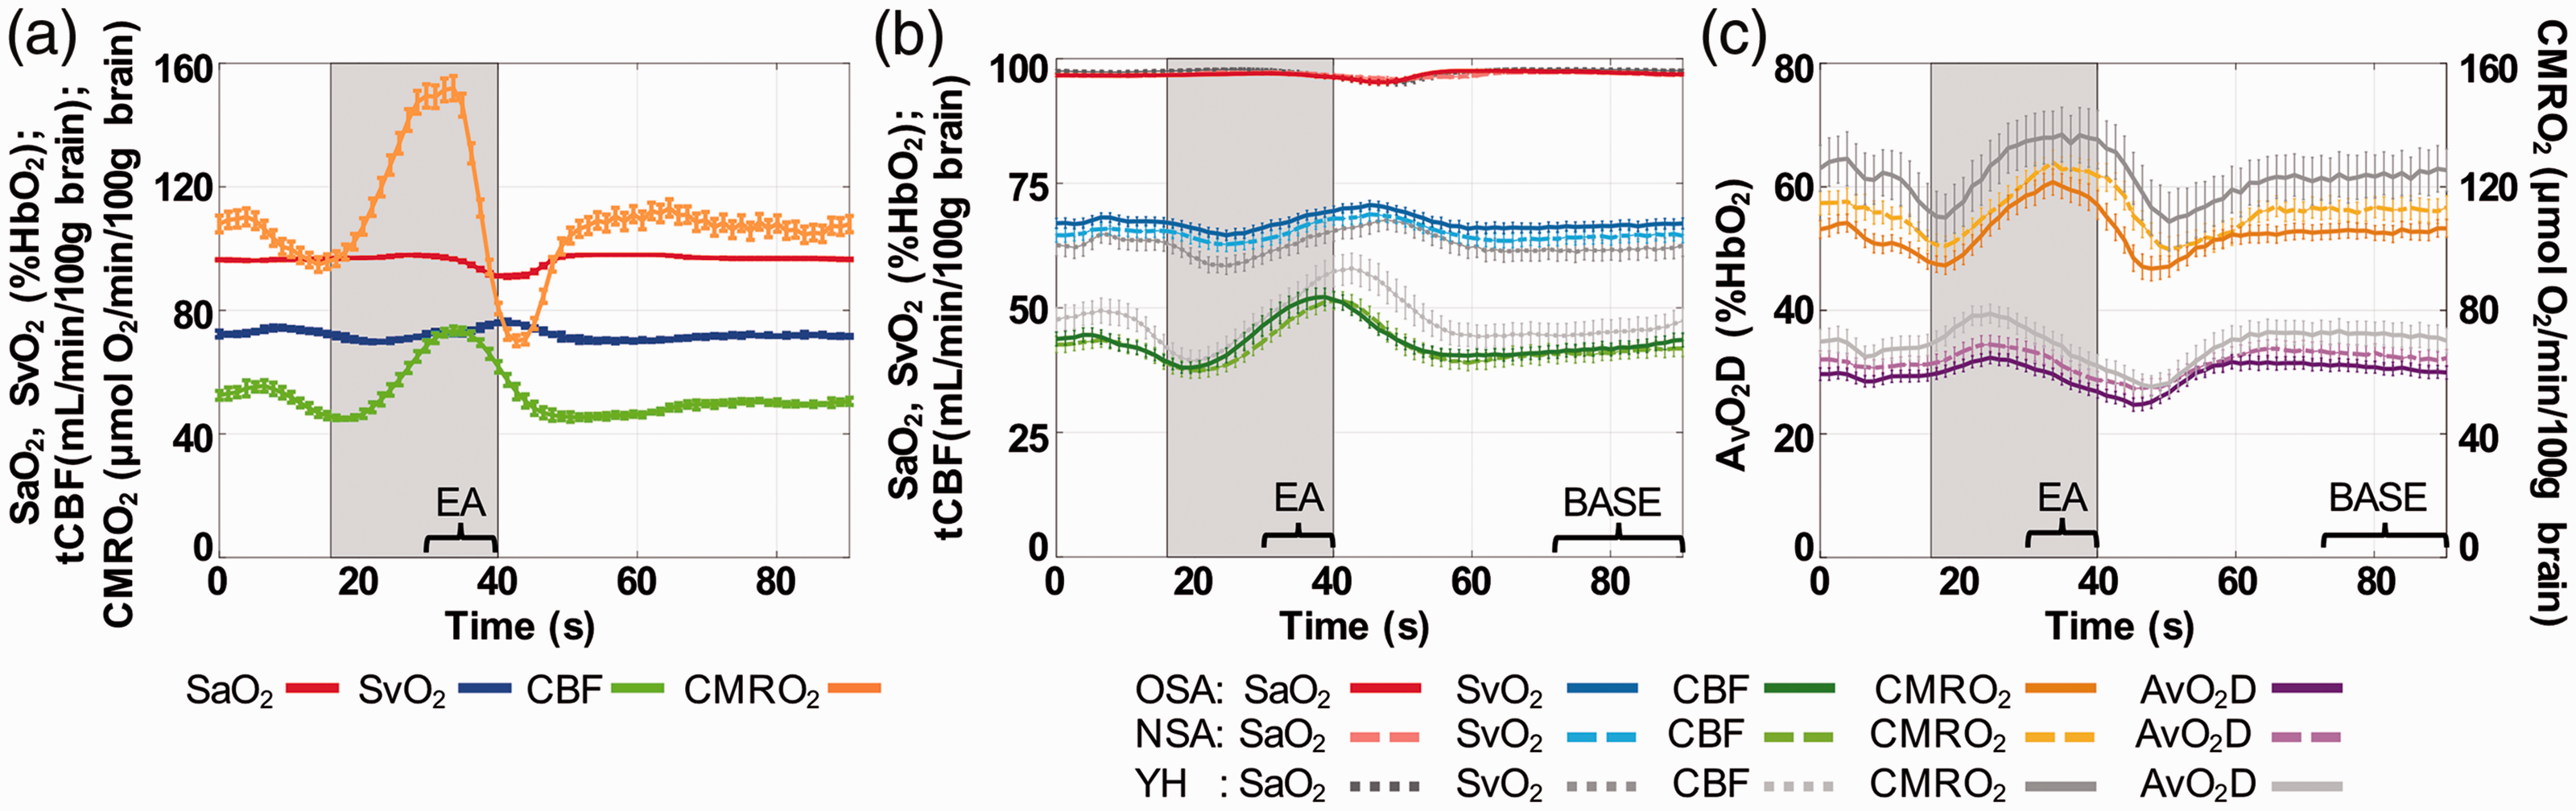
Temporal averages of time-course over five breath-hold blocks. (a) Time-course plot of physiological quantities from the same OSA subject as displayed in Figure 1(c). (b, c) Group-averaged data in OSA (solid lines), NSA (dashed lines) and YH (gray lines) subjects. Error bars represent standard errors. Gray shading indicates 24-s BH period. BASE, the period for data averaged to quantify baseline values; EA, end-apnea, the period for data averaged to quantify EA-averaged values.
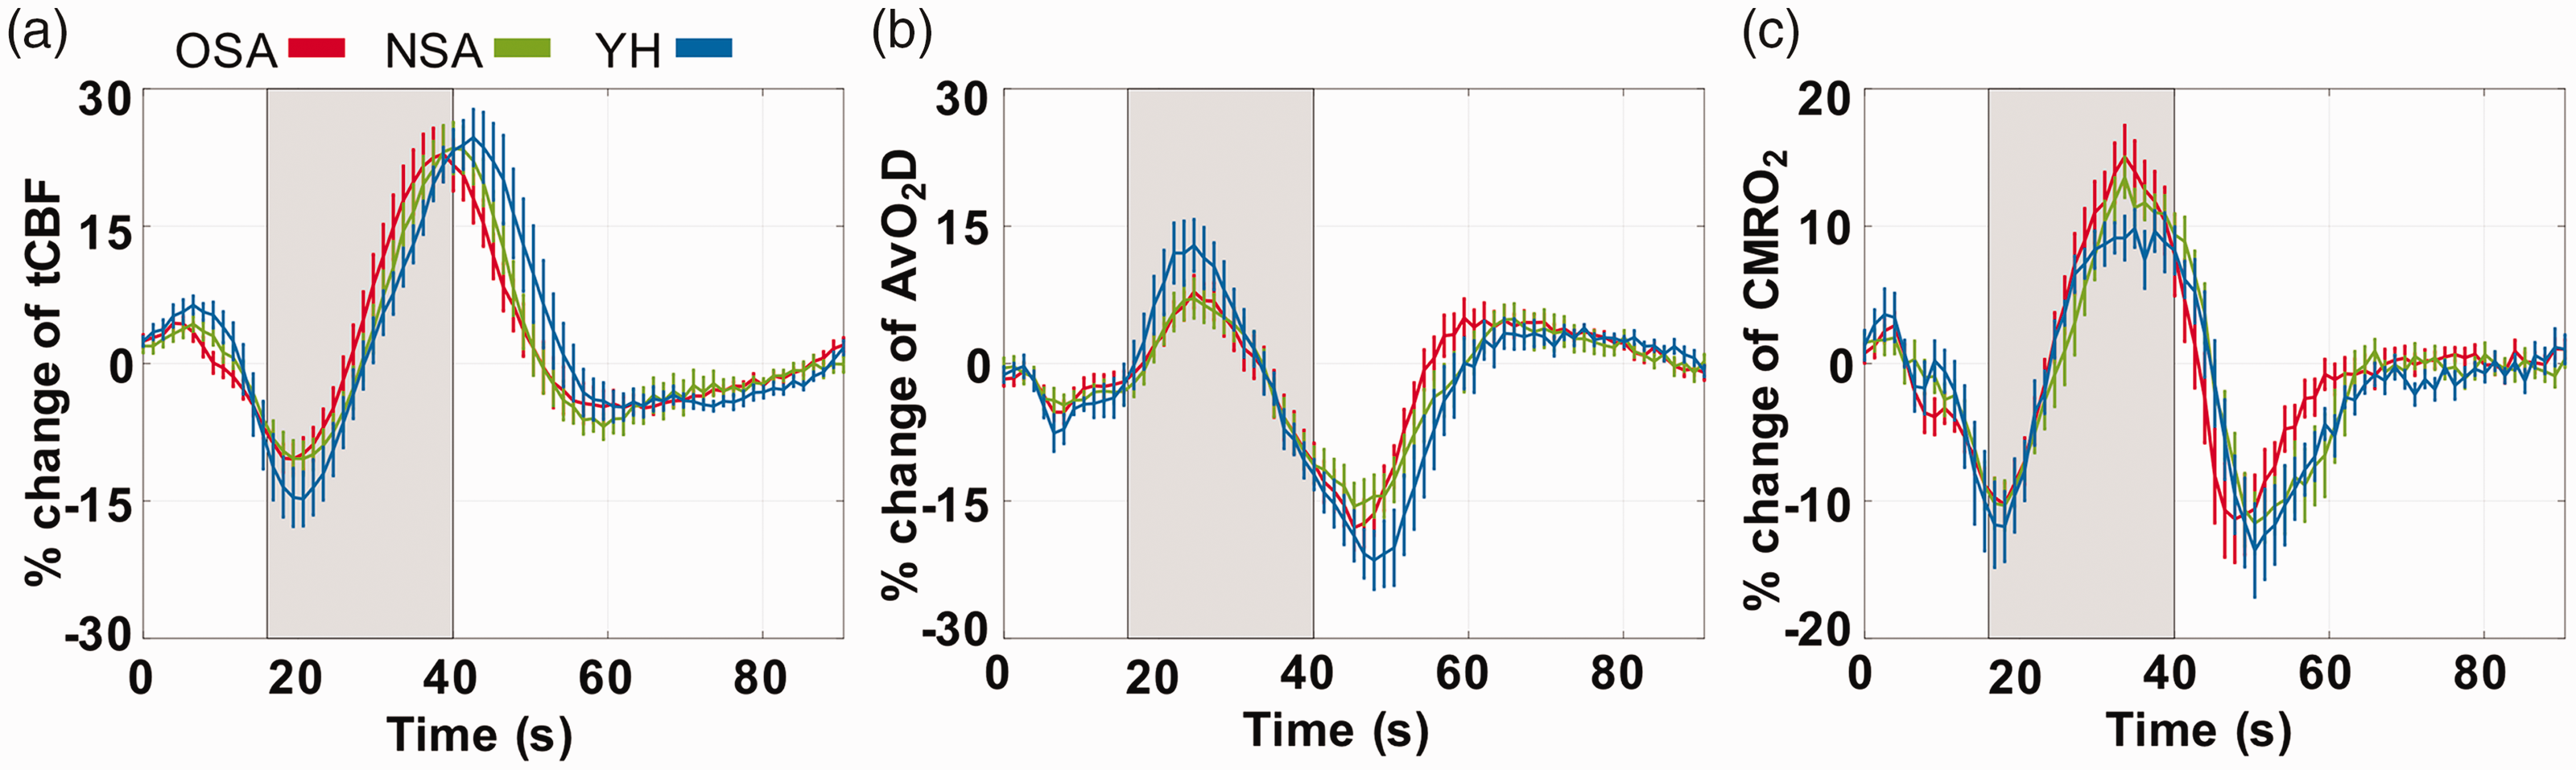
Normalized group-averaged time-course vascular-metabolic parameters of tCBF (a), AvO2D (b) and CMRO2 (c) at rest and during the breath-hold challenge for OSA, NSA, and YH subjects. Data have been averaged over five breath-hold blocks and error bars represent standard errors within groups. Gray shading indicates 24-s BH period.
Averaged physiological parameters evaluated via one-way ANOVA for OSA, NSA and YH subjects at baseline and during end-apnea.
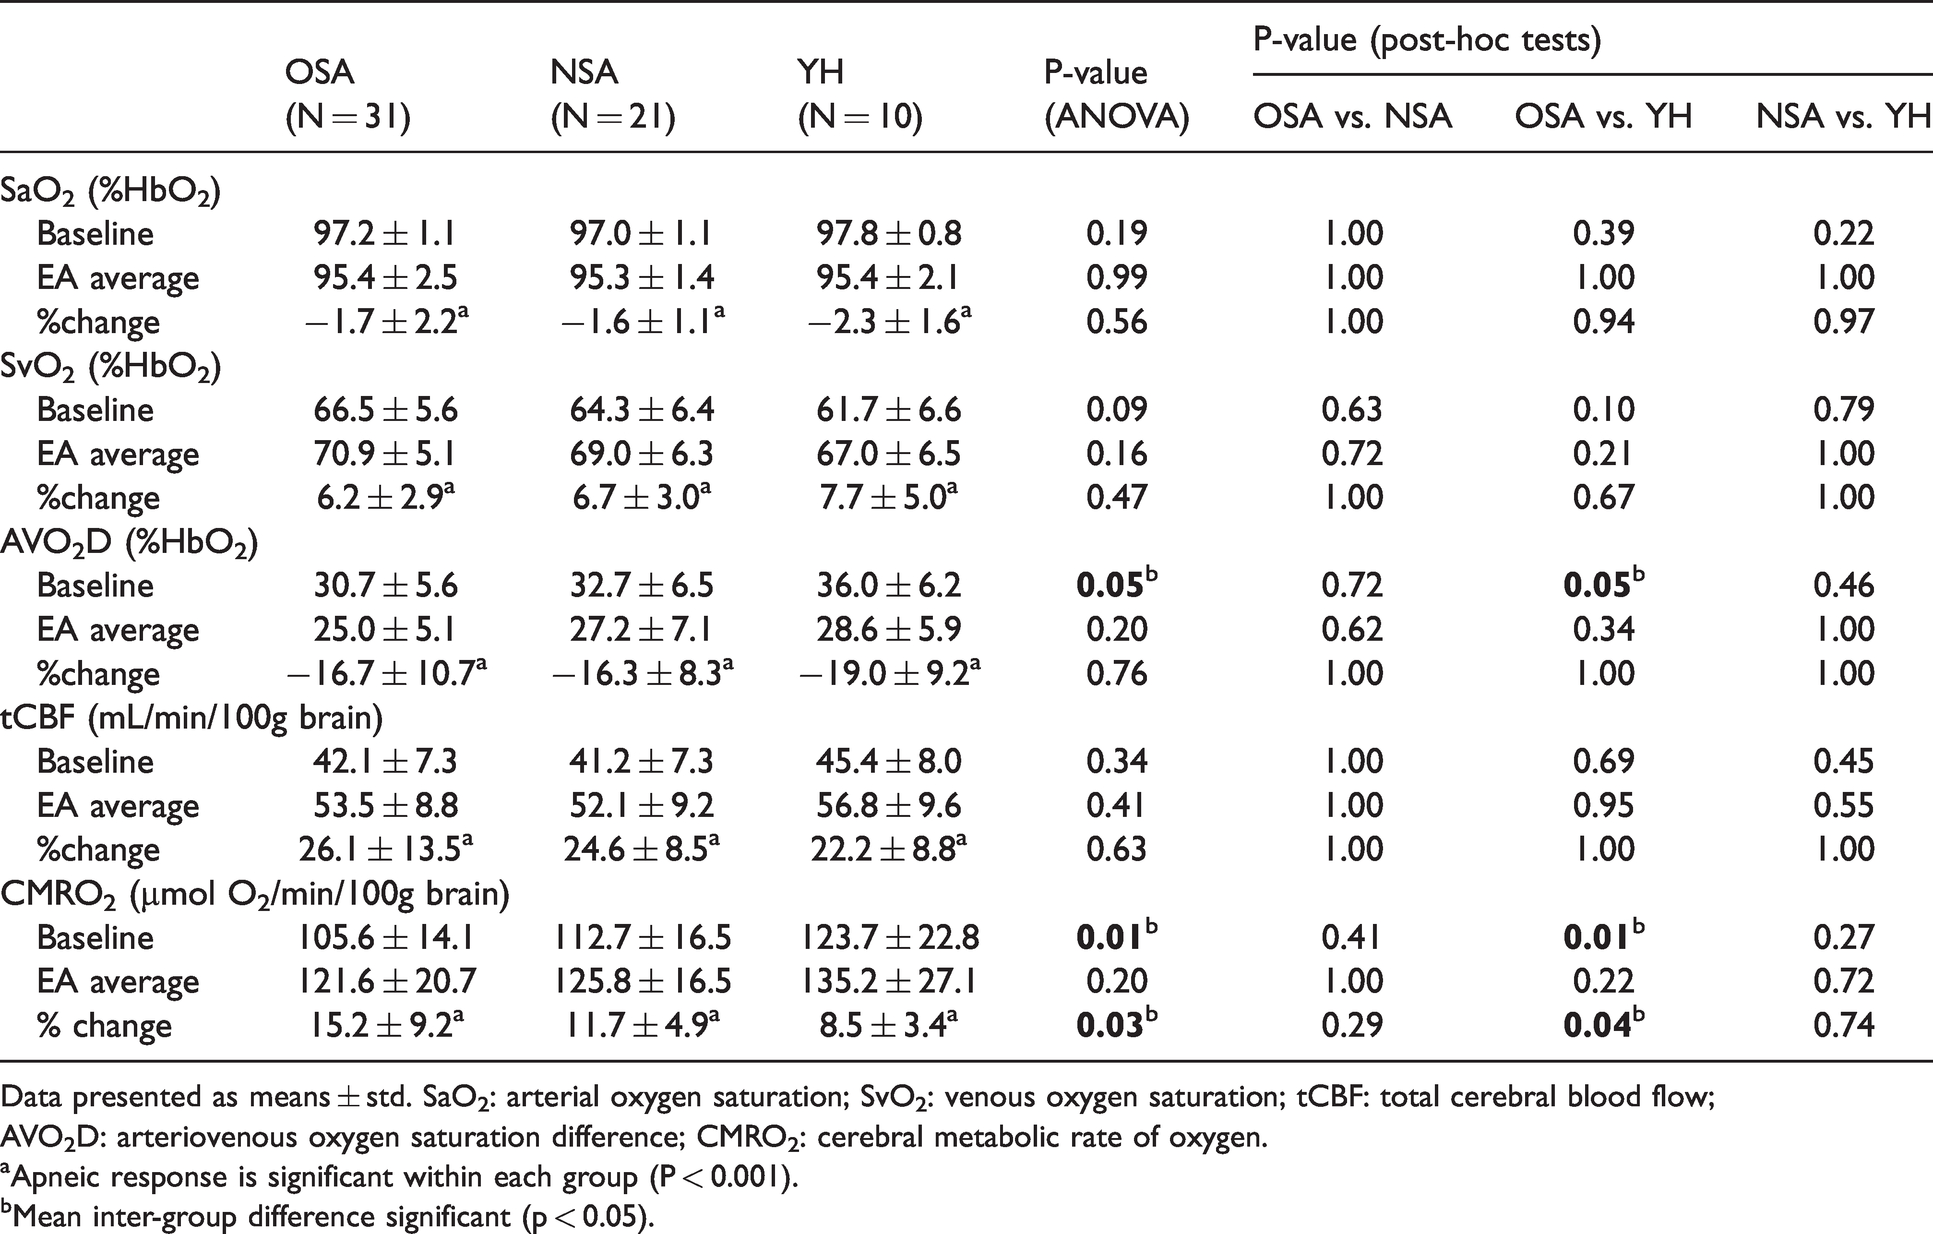
Data presented as means ± std. SaO2: arterial oxygen saturation; SvO2: venous oxygen saturation; tCBF: total cerebral blood flow; AVO2D: arteriovenous oxygen saturation difference; CMRO2: cerebral metabolic rate of oxygen.
aApneic response is significant within each group (P < 0.001).
bMean inter-group difference significant (p < 0.05).
Figure 4(a) displays group comparisons of baseline-averaged tCBF, SaO2, and SvO2, showing no significant differences in tCBF, SaO2 and SvO2 among groups. As Figure 4(b) illustrates, AvO2D was marginally lower (30.7 ± 5.6 vs. 36.0 ± 6.2%, P = 0.05, Table 2) in OSA relative to healthy subjects. Importantly, however, apneics’ baseline CMRO2, even though differing insignificantly from that in NSA subjects, was significantly lower than measurements in YH subjects (105.6 ± 14.1 vs. 123.7 ± 22.8 µmol O2/min/100g, P = 0.01, Table 2). No corrections were made for multiple comparisons since the five variables (tCBF, SaO2, SvO2, AvO2D and CMRO2) at baseline, and their fractional changes from baseline, have potential clinical meaning of their own, i.e., each variable is testing a separate hypothesis at P = 0.05 significance.
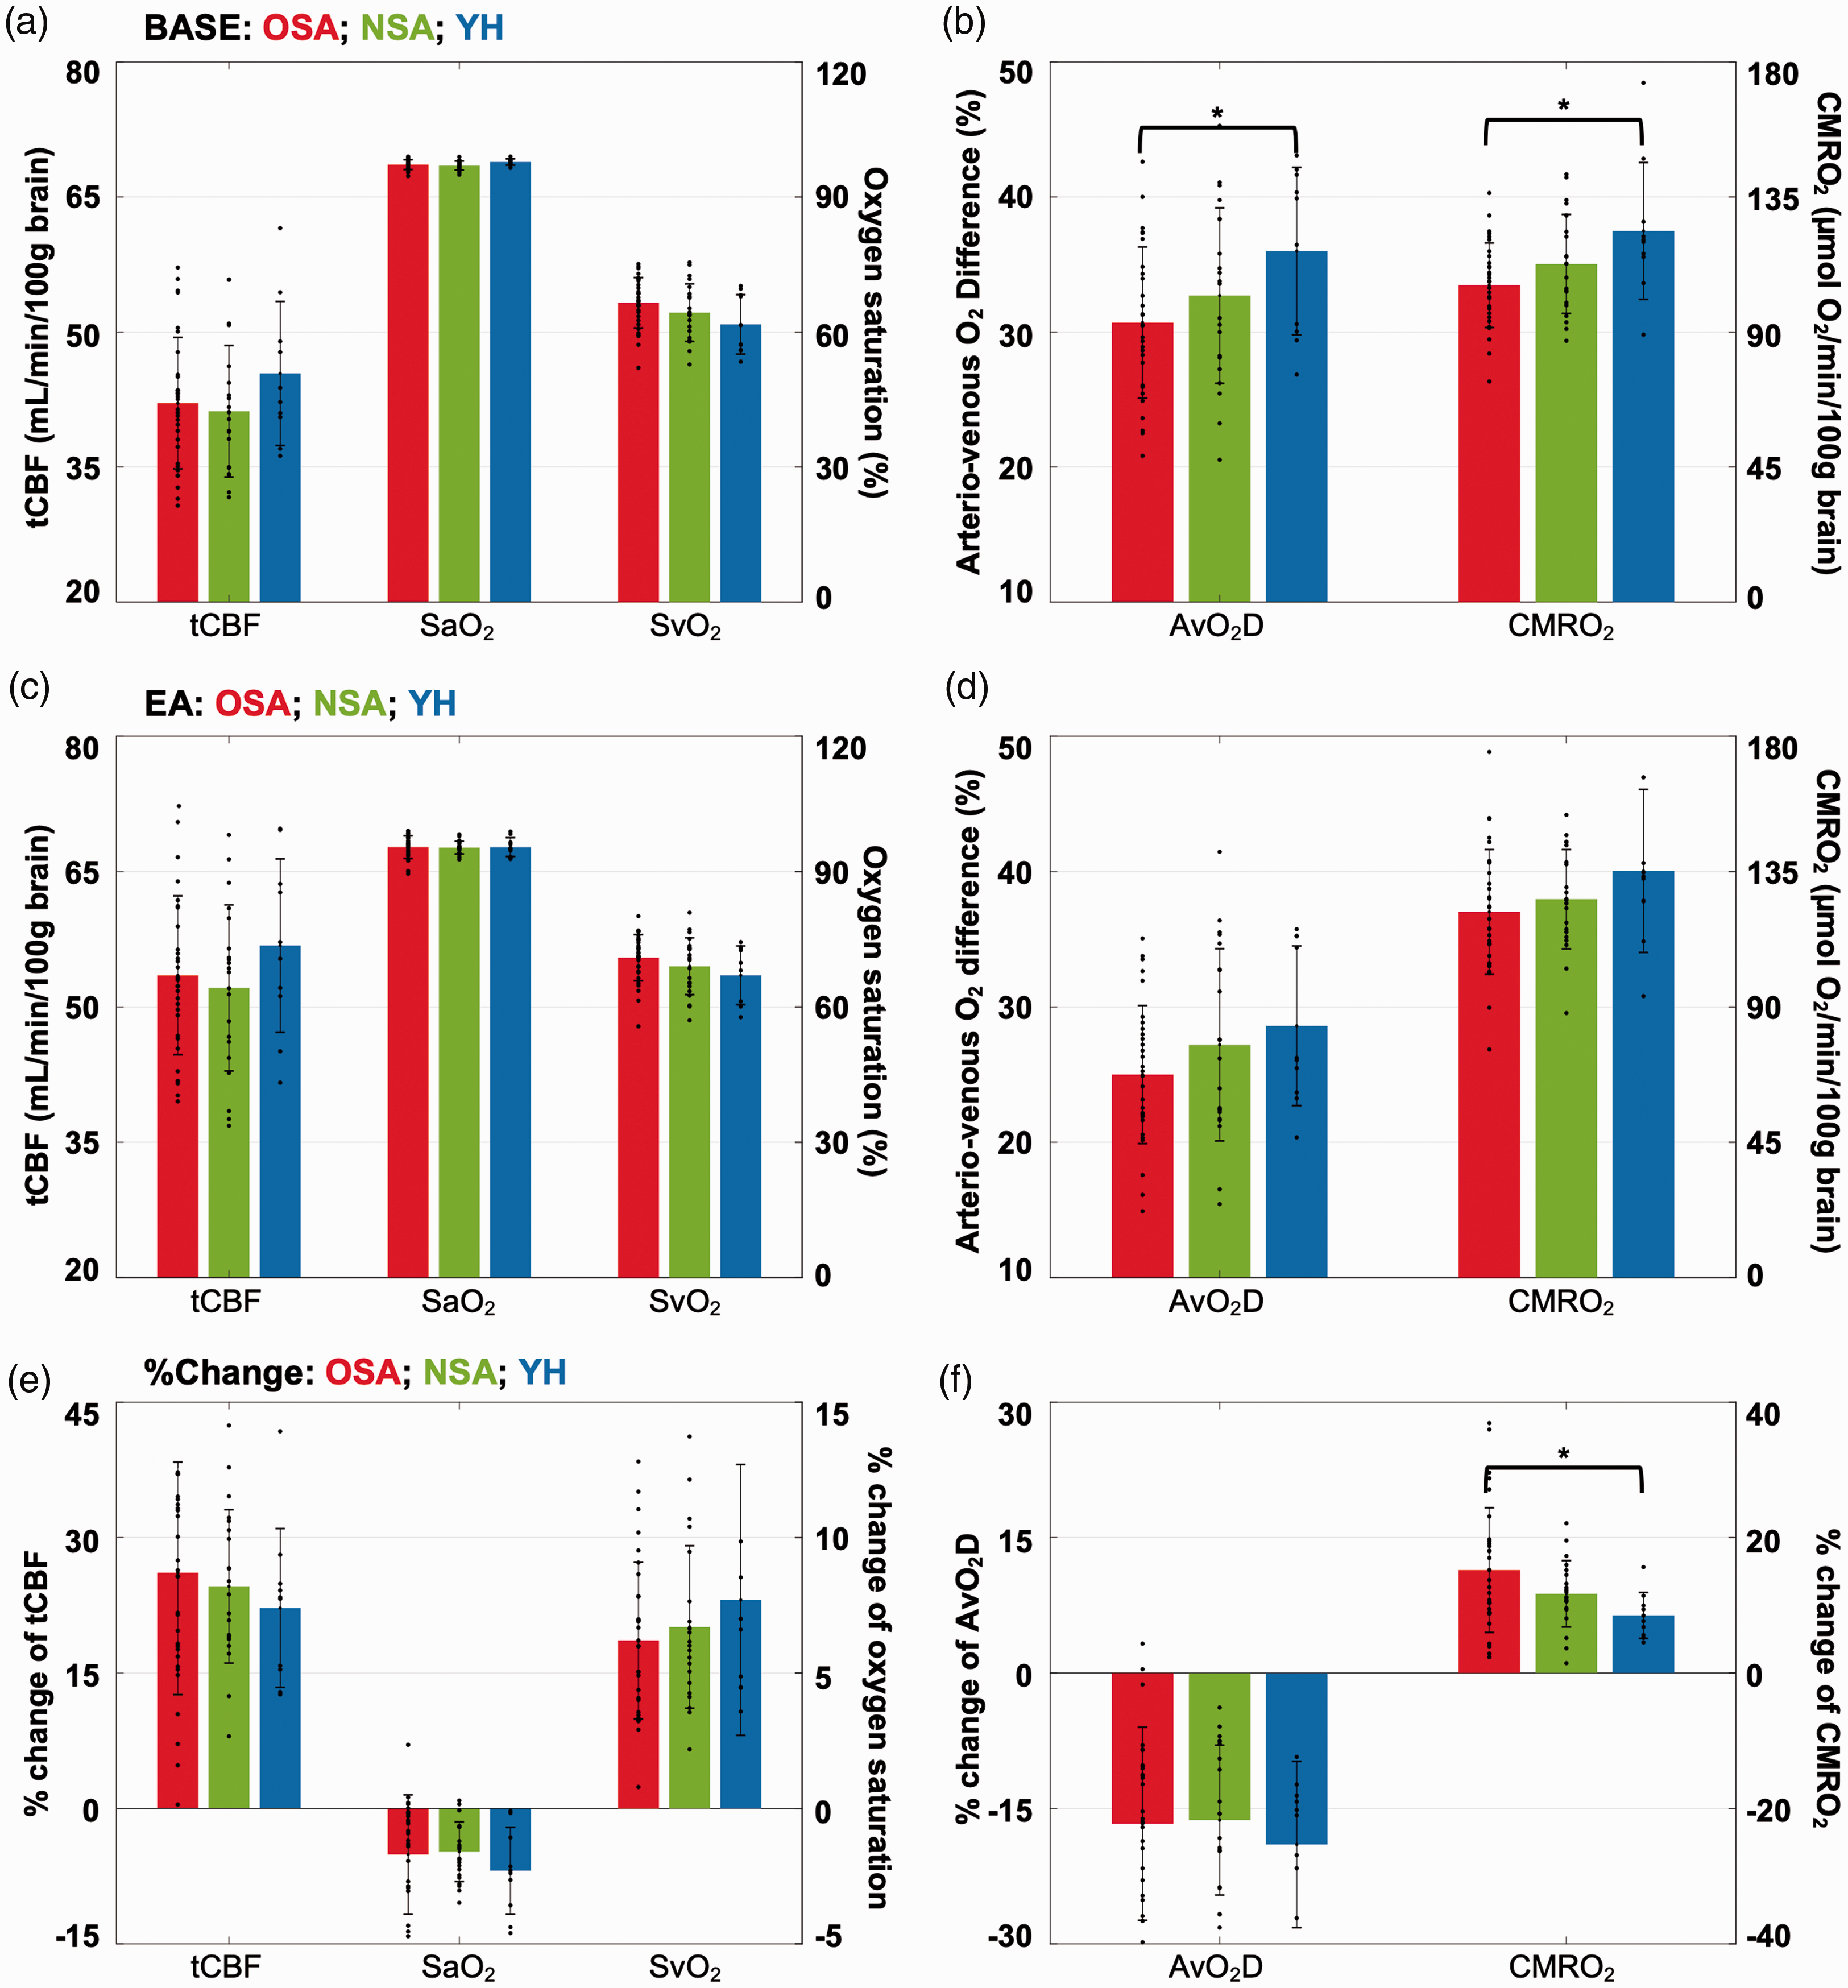
Group averages and distributions of neuro-vascular-metabolic parameters at baseline, i.e., during normal breathing (a, b), end-apnea (c, d) and their corresponding apneic response expressed as fractional changes (e, f) for OSA, NSA and YH subjects. *P < 0.05.
There was no significant difference in the end-apnea (EA)-averaged values for tCBF, SaO2 and SvO2 between groups (Figure 4(c)). EA-averaged CMRO2 trended lower in apneics, but inter-group differences were not statistically significant (121.6 ± 20.7 vs. 125.8 ± 16.5 vs. 135.2 ± 27.1 µmol O2/min/100g in OSA, NSA and YH, overall P = 0.20, Figure 4(d)). In contrast, however, the fractional change in CMRO2 was significantly greater in OSA than found in healthy reference subjects (15.2 ± 9.2 vs. 8.5 ± 3.4%, P = 0.04, Figure 4(f)). The detailed results of the analyses are given in Table 2.
ANCOVA conducted to evaluate the possible role of BMI and age effects related to the group comparison indicated that BMI and age effects were not significant and did not significantly modify the group effects, therefore reducing the analysis to simple one-way ANOVA.
In order to gain insight into the role of disease severity, CMRO2 was regressed against AHI, both during normal breathing and in response to apnea. When all “patients” (i.e., OSA and NSA) were included, AHI was negatively associated with baseline CMRO2 (r = −0.33, P = 0.02, see supplementary Figure S3) and marginally positively with CMRO2 apneic response (r = 0.28, P = 0.05).
Four subjects in the OSA group were unable to stay awake and adhere to the breath-hold instructions. They experienced spontaneous apneas during the 10-minute rOxFlow scan, resulting in quasi-periodic patterns in the time-courses of the measured physiologic parameters. When extrapolating the number of spontaneous responses from 10 minutes to one hour, 66 such events were evident in one of the subjects (supplementary Figure S4), which is of the same order as the AHI examined by polysomnography.
Discussion
In this study, we tested the hypothesis that in untreated obstructive sleep apnea, oxygen metabolism is perturbed. Towards this goal, a series of repeated breath-hold challenges were performed to mimic nocturnal spontaneous apneas experienced in OSA. Time-resolved measures of cerebral blood flow and O2 saturation, from which CMRO2 was derived, were obtained in a cohort of OSA and NSA drawn from the same pool of patients examined for possible sleep apnea, and compared to additionally recruited young healthy reference subjects.
The key result in the present study is the finding of significantly lower baseline CMRO2 in OSA relative to young healthy (YH) subjects during normal breathing (105.6 ± 14.1 versus 123.7 ± 22.8 µmol O2/min/100g, P = 0.01) but there was no significant difference between OSA and NSA subjects or between NSA and YH participants suggesting that NSA patients represent an intermediate group with respect to CMRO2 changes. There was no significant inter-group difference in baseline CBF, which is consistent with another study comparing perfusion between OSA and healthy reference subjects (referred to as “controls”). 37 The observed lower CMRO2 in OSA subjects relative to YH reflects subtle differences in CBF and arteriovenous difference AvO2D. The latter was marginally lower in OSA relative to YH subjects (30.7 ± 5.6 versus 36.0 ± 6.2%, P = 0.05) which, along with somewhat lower trending CBF (42.1 ± 7.3 versus 45.4 ± 8.0 mL/min/100g, P > 0.05) drove the large difference in CMRO2 between these groups (P = 0.01).
The observed depression in oxygen metabolism in OSA relative to healthy reference subjects may be the result of mitochondrial dysfunction or possibly neuronal cell loss. Fewer functional neurons therefore would require less oxygen. Neuronal degeneration, caused by excessive generation of reactive oxygen species, is a well-known consequence of brain hypoxia and hypoxemia occurring during the nightly hypoxia-reperfusion episodes.4,38 The resulting inflammatory response promotes endothelial dysfunction, the initiating process of atherogenesis. There is now compelling evidence that such an etiology is at the core of the elevated risk these patients face for vascular disease 5 and dementia. 39
Even though there was a trend toward greater CMRO2 in NSA relative to their OSA peers matched for age and BMI, the difference was not significant. These subjects, although they failed to meet the criteria for obstructive sleep apnea, suffered from abnormal sleep, which prompted their examination by polysomnography in the first place. Of note, however, is that they were all obese, and obesity itself is well established to promote abnormal levels of reactive oxygen species (ROS) and thus endothelial dysfunction. 40
Breath-hold (BH) is a mixed hypercapnic-hypoxic stimulus. 21 Both hypoxia and hypercapnia are known to enhance cerebral blood flow. 13 It is therefore not surprising that tCBF was significantly elevated at end apnea (>20% in all three groups, P < 0.001). Further, data are indicative of lower CMRO2 in OSA than in NSA subjects at end expiration breath-hold, and more so in YH subjects, but the differences were not significant (121.6 ± 20.7 versus 125.8 ± 16.5, versus 135.2 ± 27.1 µmol O2/min/100g, P = 0.20). The augmented CMRO2 in response to a breath-hold challenge in the young healthy reference subjects agrees with results from an earlier study using similar methods (6.0 ± 3.5%). 21 That study suggested that the pro-metabolic response to breath-hold could represent a physiologic mechanism for buffering the brain energy supply in anticipation of prolonged apnea (which eventually would lead to exhaustion of energy stores and neuronal cell loss).
Fractional changes in CMRO2 from baseline at end apnea were greatest in OSA (15.2 ± 9.2%), lower in NSA (11.7 ± 4.9%), and significantly lower in YH subjects (8.5 ± 3.4%, P = 0.04), see Table 2 and Figure 4(f). Rodgers et al, 25 in a prior small study conducted at 1.5 T using similar methods, found a marginally significant difference between the fractional change in CMRO2 between OSA and NSA groups, but unlike in the present study, the two groups were not matched by age and BMI.
The finding of greater fractional change in CMRO2 in OSA compared to healthy young subjects at end-apnea may be compensatory as a mechanism to offset the greater oxygen deficit in these patients from hypoxia relative to their healthy counterparts. There was no significant difference between OSA and NSA subjects, with the latter’s fractional response being midway between OSA and YH, again suggesting NSA reference subjects having perturbed brain oxygen metabolism.
From the observation that neurometabolic parameters failed to reveal significant differences between OSA and NSA subjects, we can infer that the latter cannot be regarded as healthy given that they were obese and suffered from sleep abnormalities (which prompted their evaluation by polysomnography). Impaired brain metabolism in OSA patients relative to reference subjects has previously been reported by means of FDG PET, 41 in spite of minor or no deficits in memory and executive function, suggesting metabolic changes precede cognitive impairment.
Finally, we found AHI to correlate negatively with baseline CMRO2 (P = 0.02) as well as positively with CMRO2 apneic response (P = 0.05) when pooling OSA and NSA subjects. These associations, however, became nonsignificant when including only OSA patients, again supporting the notion that NSA and OSA patients are on a continuum.
The present study has some limitations. There was a substantial number of dropouts among patients enrolled. When compared with those yielding evaluable data, we found dropouts, who were either unable to tolerate the procedure or adhere to the protocol, to generally have more severe OSA (AHI: 52.2 ± 33.5 versus 37.1 ± 17.4 events/hr; O2 nadir: 71.6 ± 15.0 versus 75.7 ± 9.56%). Further, subjects with greater BMI appeared to be less compliant (N = 7, BMI = 36.4 ± 1.40 kg/m2) or more likely to produce corrupted image data (N = 3, BMI = 34.4 ± 5.01 kg/m2). Since subjects with higher AHI or greater BMI are more likely to yield corrupted or no evaluable data at all, the actual difference in global CMRO2 between all OSA patients enrolled and healthy subjects might actually be greater than that reported here. These observations would suggest more conservative enrollment criteria in similar imaging studies.
Other limitations include the relatively small sample size of young healthy reference subjects who did not undergo polysomnographic testing but attested to having normal sleep pattern as is common in young people below the age of 30 years with normal BMI. The method used yields global neurometabolic parameters, i.e., averages across the entire brain, rather than spatially-resolved information (which is not obtainable at the temporal resolution on the order of 2 seconds even with the most advanced technology). Lastly, the stimulus used in the form of a cued breath-hold challenge, while mimicking spontaneous nocturnal apneas, does not lead to the large desaturations seen in apneics. However, the present technology should be able to study patients during sleep in the scanner, the feasibility of which has been demonstrated recently by some of the present investigators. 42
Conclusion
The study confirms the hypothesis that the global cerebral metabolic rate of oxygen is lower in patients with OSA than in healthy young subjects and further suggests that sleep disordered patients failing to meet clinical criteria for OSA are on the same continuum as evidenced by their intermediate CMRO2 values. In contrast, the fractional change in response to breath-hold was found to be greater in OSA patients than in young reference subjects. While the exact etiology of the vascular-metabolic alterations in these patients requires further scrutiny, the observed results demonstrate the potential of noninvasive MRI-based CMRO2 both for quantifying CMRO2 changes and as biomarkers of metabolic dysfunction in OSA.
Supplemental Material
sj-pdf-1-jcb-10.1177_0271678X211071018 - Supplemental material for MRI evaluation of cerebral metabolic rate of oxygen (CMRO2) in obstructive sleep apnea
Supplemental material, sj-pdf-1-jcb-10.1177_0271678X211071018 for MRI evaluation of cerebral metabolic rate of oxygen (CMRO2) in obstructive sleep apnea by Pei-Hsin Wu, Ana E Rodríguez-Soto, Andrew Wiemken, Erin K Englund, Zachary B Rodgers, Michael C Langham, Richard J Schwab, John A Detre, Wensheng Guo and Felix W Wehrli in Journal of Cerebral Blood Flow & Metabolism
Footnotes
Funding
The authors disclosed receipt of the following financial support for the research, authorship, and/or publication of this article: This work was supported by the National Institutes of Health (R01 HL122754, T32 EB020087); and in part by the Institute for Translational Medicine and Therapeutics’ Transdisciplinary Program in Translational Medicine and Therapeutics (UL1TR001878).
Declaration of conflicting interests
The author(s) declared no potential conflicts of interest with respect to the research, authorship, and/or publication of this article.
Author’s contributions
FW Wehrli designed the overall study and study methods, and reviewed and edited the manuscript; AE Rodríguez-Soto and P-H Wu performed the MRI procedures, optimized processing of the images and analyzed the data; P-H Wu drafted the manuscript; A Wiemken recruited study subjects; EK Englund participated in image data collection and processing; JA Detre, ZB Rodgers, MC Langham, and RJ Schwab reviewed and edited the manuscript; W Guo provided advice on statistical analysis.
Supplemental material
Supplemental material for this article is available online.
References
Supplementary Material
Please find the following supplemental material available below.
For Open Access articles published under a Creative Commons License, all supplemental material carries the same license as the article it is associated with.
For non-Open Access articles published, all supplemental material carries a non-exclusive license, and permission requests for re-use of supplemental material or any part of supplemental material shall be sent directly to the copyright owner as specified in the copyright notice associated with the article.