
Abstract
The blood oxygenation level-dependent (BOLD) functional magnetic resonance imaging (fMRI) method, which is sensitive to vascular paramagnetic deoxyhemoglobin, is dependent on regional values of cerebral metabolic rate of oxygen utilization (CMRO2), blood flow (CBF), and volume (CBV). Induced changes in deoxyhemoglobin function as an endogenous contrast agent, which in turn affects the transverse relaxation rates of tissue water that can be measured by gradient-echo and spin-echo sequences in BOLD fMRI. The purpose here was to define the quantitative relation between BOLD signal change and underlying physiologic parameters. To this end, magnetic resonance imaging and spectroscopy methods were used to measure CBF, CMRO2, CBV, and relaxation rates (with gradient-echo and spin-echo sequences) at 7 Tesla in rat sensorimotor cortex, where cerebral activity was altered pharmacologically within the autoregulatory range. The changes in tissue transverse relaxation rates were negatively and linearly correlated with changes in CBF, CMRO2, and CBV. The multiparametric measurements revealed that CBF and CMRO2 are the dominant physiologic parameters that modulate the BOLD fMRI signal, where the ratios of (ΔCMRO2/CMRO2)/(ΔCBF/CBF) and (ΔCBV/CBV)/(ΔCBF/CBF) were 0.86 ± 0.02 and 0.03 ± 0.02, respectively. The calibrated BOLD signals (spatial resolution of 48 μL) from gradient-echo and spin-echo sequences were used to predict changes in CMRO2 using measured changes in CBF, CBV, and transverse relaxation rates. The excellent agreement between measured and predicted values for changes in CMRO2 provides experimental support of the current theory of the BOLD phenomenon. In gradient-echo sequences, BOLD contrast is affected by reversible processes such as static inhomogeneities and slow diffusion, whereas in spin-echo sequences these effects are refocused and are mainly altered by extravascular spin diffusion. This study provides steps by which multiparametric MRI measurements can be used to obtain high-spatial resolution CMRO2 maps.
Keywords
In the past few years, there has been widespread application of the blood oxygenation level-dependent (BOLD) functional magnetic resonance imaging (fMRI) method in functional neuroanatomic studies of the mammalian central nervous system. In the BOLD fMRI method, deoxyhemoglobin in the microvasculature functions as an endogenous contrast agent as a consequence of stimulus-induced changes in blood oxygenation (Kennan et al., 1994; Ogawa et al., 1993; Weiskoff et al., 1994), which in turn affects the apparent and absolute transverse relaxation rates of tissue water (R2* and R2, obtained by gradient-echo (GE) and spin-echo (SE) sequences, respectively). Although the simplicity of the BOLD fMRI method, both in setup and application, makes it an attractive tool for qualitative functional mapping, a quantitative physiologic understanding of the image contrast is still lacking. For the method to reach its full potential of being able to create images representing cerebral function in a quantitative manner, it is necessary to correlate the changes in the BOLD fMRI signal to the changes in cerebral metabolic rates of oxygen consumption (CMRO2) and cerebral blood flow (CBF) and volume (CBV).
The relation between tissue water relaxation rates (i.e., R2* and R2) and blood oxygenation (Y) has been described in studies of rat brain in vivo (Kida et al., 1996; Ogawa et al., 1993; Prielmeier et al., 1994). However, the relation between the BOLD signal and the value of Y has been difficult to determine because the basal values of R2* and R2 are affected by several parameters (e.g., static magnetic field strength, geometry and density of microvasculature) in addition to the deoxyhemoglobin content. An alternative approach is to calibrate the BOLD signal empirically. Because the value of Y is determined by local values of CMRO2, CBF, and CBV as described by Fick's relation, the BOLD signal can be quantitatively calibrated (at a particular static magnetic field strength for a particular tissue type) by simultaneous measurements of these physiologic parameters along with R2 and R2* at different levels of metabolic/functional activity.
Recent efforts to calculate changes in CMRO2 (i.e., ΔCMRO2/CMRO2) using BOLD image contrast are based on the relation between changes in the BOLD signal (i.e., ΔS/S) and CBF (i.e., ΔCBF/CBF). CBF can be imaged by magnetic resonance imaging (MRI) using magnetically labeled arterial water, which acts as an endogenous perfusion tracer (Calamante et al., 1999), the kinetics of which can be determined by changes in the longitudinal relaxation rate of tissue water (R1) obtained by inversion recovery methods. The resulting BOLD and CBF maps during focal activation can then be used to create ΔCMRO2/CMRO2 maps if certain assumptions are made about magnetic constants or additional calibration experiments are performed (Kim et al., 1999). A quite different approach to calibration of the BOLD signal relies predominantly on literature values of various physiologic constants or parameters and measured R2 changes during hypoxic perturbations (van Zijl et al., 1998). Provided that certain assumptions are adopted for the calibrated R2 signal at a particular static magnetic field strength, ΔCBF/CBF and/or ΔCMRO2/CMRO2 can then be predicted based on SE signal intensity changes. However, these approaches require assumptions regarding the changes in CBV during functional activation, as well as the values of ΔCBF/CBF and/or ΔCMRO2/CMRO2 during the calibration experiments.
The objective of this study was to calibrate the BOLD signal at 7 Tesla for rat cortex based on the direct measurement between changes in R2*, R2, CBF, CBV, and CMRO2 over a wide range of activity, using MRI and magnetic resonance spectroscopy (MRS) methods. Based on the current theoretical understanding of the BOLD phenomenon (Ogawa et al., 1993), it should be possible to predict changes in CMRO2 from measured changes in R2*, R2, CBF, and CBV during a physiologic perturbation. If the measured and predicted changes in CMRO2 are in good agreement, then the BOLD signal can be calibrated without any assumptions of parameters that can modulate the signal. We demonstrate that at 7 Tesla, the predicted changes in CMRO2 in response to changes in cortical activity are in good agreement with measured values in a 48 μL volume of rat cortex. This calibration of the BOLD signal based on multiparametric measurements can be used to generate relative CMRO2 maps with high spatial resolution.
METHODS
Animal preparation
Twenty-eight adult male Sprague-Dawley rats weighing 130 to 240 g were fasted for more than 16 hours and underwent tracheotomy under halothane (0.7% to 1.2%) anesthesia and artificial ventilation (70% N2O and 30% O2). A femoral artery was cannulated for continuous mean arterial blood pressure monitoring and periodic sampling for measurement of blood gases, pH, and glucose. Femoral veins were cannulated for intravenous infusions of nicotine hydrogen tartrate, iron oxide contrast agent (AMI-227; Advanced Magnetics Inc., Cambridge, MA, U.S.A.), and D-[1-13C]glucose (99 atom %; Cambridge Isotopes, Andover, MA, U.S.A.). Intraperitoneal lines were inserted for the administration of anesthetic and paralyzing agents.
The scalp was retracted and removed to reveal the skull around the bregma. The skull was cleaned of all tissues and a layer of Saran Wrap was placed over the exposed wound. The bregma was marked on the skull with ink to ensure accurate placement of the radiofrequency coil and to provide a navigation marker for extraction of regional tissue. The rat was placed prone in a cradle and covered with a water blanket to maintain body temperature at approximately 37°C. The head was secured using a bite-bar and tightly fixed by foam cushions on either side of the head to minimize movement.
The center of the radiofrequency surface-coil receiver was placed above the bregma. The rat was inserted into the magnet and the rat's head was then positioned at the magnet isocenter. Halothane/nitrous oxide anesthesia was discontinued after the positioning, and anesthesia was maintained throughout the experiment with morphine sulfate (initial 50 mg/kg; supplemental 30 mg/kg per 30 minutes, given intraperitoneally); the animal was paralyzed with D-tubocurarine chloride (initial 0.5 mg/kg; supplemental 0.25 mg/kg per 30 minutes, given intraperitoneally).
MRI and MRS setup
All in vivo MRI and MRS data were obtained on a highly modified 7-Tesla Bruker Biospec I horizontal-bore spectrometer (Bruker Instruments, Billerica, MA, U.S.A.) operating at 300.6 and 75.5 MHz for 1H and 13C, respectively, with a 1H resonator radiofrequency transmit (8-cm diameter) for homogeneous transmission and a 1H radiofrequency surface-coil receiver (10-mm diameter) for local reception. The surface-coil receiver experienced a negligible loss in signal because the two 1H coils were oriented orthogonal to one another to minimize inductive coupling. This radiofrequency coil arrangement allows better shimming, minimizes sensitivity loss in the receiver coil, and results in high signal-to-noise ratio. A concentric 13C radiofrequency surface-coil (20-mm diameter) was used for transmission and decoupling for proton observed carbon edited (POCE) experiments.
High-resolution, multislice, fast low-angle shot coronal anatomic R2* or R1 images were acquired (image matrix 128 × 128; in-plane resolution 156 × 156 μm2; slice thickness 500 μm; repetition time [TR] 250 milliseconds; echo time [TE] 20 milliseconds; inversion recovery time [TIR] 300 milliseconds) in the somatosensory area of the rat cortex and to provide coordinates for the placement of a 7.5 × 1.6 × 4.0 mm3 rectangular volume for the POCE experiments (Hyder et al., 1996, 1997). The static magnetic field homogeneity of a region of 8 × 2 × 5 mm3 volume in the sensorimotor cortex was manually shimmed before data acquisition to obtain half-height line-widths of the water signal of 13 to 18 Hz. All multiparametric MRI data were acquired with the echo-planar imaging (EPI) method using sequential sampling (Hyder et al., 1995). Because the total acquisition time of all echoes with EPI was 20.48 milliseconds, the R2* distortions associated with SE EPI are minimal (Farzaneh et al., 1990). All multiparametric MRI measurements were made with coronally oriented multislice EPI acquisition using 1-mm slice separation (image matrix 32 × 32; in-plane resolution 430 × 430 μm2; slice thickness 1,000 μm; TR 5,000 milliseconds). A sinc pulse was used for slice excitation and an adiabatic fast passage hyperbolic secant pulse was used for slice refocusing as well as inversions (slice-selective or not). The localized MRS pulse sequence consisted of four sequential segments: water suppression by inversion recovery followed by crushers (Hyder et al., 1996, 1997); the region of interest (ROI) selection (x × y × z = 7.5 × 1.6 × 4.0 mm3) by image-selected in vivo spectroscopy (Ordidge et al., 1986); surface lipid suppression by application of slice selection followed by orthogonal dephasing gradients (Hyder et al., 1999a); and POCE pulse sequence (Hyder et al., 1996, 1997).
Experimental protocol
MRI and MRS experiments were conducted on rats before and after administration of agents to decrease or increase cortical activity. Three different levels of brain activity were studied: baseline condition of morphine sulfate only, lower-activity condition of morphine sulfate plus sodium pentobarbital (initial 30 mg/kg; supplemental 5 mg/kg per 30 minutes, given intraperitoneally), and higher-activity condition of morphine sulfate plus nicotine hydrogen tartrate (0.17 mg/kg per minute, given intravenously). Values of R2*, R2, CBF, and CBV were obtained (by averaging) from the same ROI as used for the absolute CMRO2 measurements (i.e., 48 μL). The multimodal measurements were conducted according to five protocols, but before the start of each protocol a double spin-tagging using delays alternating with nutations for tailored excitation (DANTE) method (Mosher and Smith, 1991) was used for local estimation of static magnetic field (Bo) distortions, which are referred to as ΔBo.
In protocols 1, 2, and 3, absolute R2*, R2, CBF, and CMRO2 were measured at different activity levels, whereas in protocols 4 and 5 absolute R2* and R2 were measured (with and without contrast agent) at different activity levels to determine relative changes in CBV:
In protocol 1 (n = 6), R2*, R2, CBF, and CMRO2 were measured under baseline morphine anesthesia (condition A). In protocol II (n = 5), initially R2*, R2, and CBF were measured under morphine (condition A), then activity was lowered with pentobarbital (condition B) and R2*, R2, CBF, and CMRO2 were measured again. In protocol III (n = 5), initially R2*, R2, and CBF were measured under morphine (condition A), then activity was increased with nicotine (condition C) and R2*, R2, CBF, and CMRO2 were measured again. In protocol IV (n = 6), initially R2* and R2 were measured under morphine (condition A), and then the contrast agent was infused and R2* and R2 were measured again. Then the activity was lowered with pentobarbital (condition B) and R2* and R2 were measured again. In protocol V (n = 6), initially R2* and R2 were measured under morphine (condition A), and then R2* and R2 were measured again in the presence of the contrast agent. Then the activity was increased with nicotine (condition C) and R2* and R2 were measured again.
R2* and R2 measurements
GE and SE weighted EPI data were acquired with multiple (four to eight) TEs ranging from 10 to 80 milliseconds. Other details of MRI relaxation rate data acquisition parameters were discussed above. A single-exponential fit to the multiple TE data from the GE and SE experiments provided observed values of R2* and R2-that is, R2*(obs) and R2(obs) maps, respectively. In this study, we defined


where R2′(Y) and R2(Y) are the reversible and nonreversible relaxation components resulting from blood oxygenation effects on the tissue water relaxation rate, R2*(ΔBo) is the relaxation component attributed to macroscopic static field inhomogeneity (ΔBo) on the tissue water relaxation rate, and R2(other) is the relaxation component assigned to nonsusceptibility-based effects. The GE contrast is affected by reversible processes such as static inhomogeneities and slow diffusion, whereas SE contrast is mainly altered by extravascular spin diffusion because the other effects are refocused. In Eqs. 1 and 2, it is assumed that the microscopic field effects (i.e., dipole-dipole interactions) on the intrinsic transverse relaxation rate of tissue water-that is, R2(other)-are identical. It is also assumed that the signal changes at 7 Tesla occur in a single extravascular compartment (Bauer and Schulten, 1992), which is supported by recent diffusion-weighted fMRI data at 9.4 Tesla (Lee et al., 1999). The separation of the BOLD relaxation rate into reversible and nonreversible terms is valid under all conditions, but it is incorrect to attribute the reversible component to pure static line-broadening effects alone (Kennan et al., 1994). The removal of static line broadening from the shim-that is, R2*(ΔBo)-allows the estimation of the reversible and nonreversible terms. The R2*(ΔBo) component of R2*(obs) within the ROI was estimated by an MRI sequence (Mosher and Smith, 1991) with double spin-tagging using DANTE pulses. The method uses a DANTE pulse train in the presence of a magnetic field gradient to create spin tags spatially within the sample (they appear as dark lines in the image) just before image acquisition. The thickness of each tag and the spacing between tags (in both orientations) can be adjusted by pulse parameters, and deviations of parallel tags can be attributed to ΔBo (Mosher and Smith, 1991). Because each straight tag of known sensitivity to ΔBo represents a region where total magnetic field is equivalent, shifted tags in number of pixels can be converted into units of R2*(ΔBo). The multislice SE imaging parameters were as follows: image matrix 128 × 128; in-plane resolution 156 × 156 μm2; slice thickness 1,000 μm; TE 28 milliseconds; read gradient strength 800 Hz/cm; DANTE pulse spacing 16.67 milliseconds; number of DANTE pulses (phase-alternated 10-μs hard pulses) 4; DANTE tag time 50.05 milliseconds; gradient strength for DANTE tagging 300 Hz/cm. These parameters contributed to DANTE tags with a thickness of 250 μm to be spaced 1 mm apart. The sensitivity of these parameters enabled a shift of one pixel to be equal to 0.0078 ppm, which is equivalent to approximately 7.4 s−1 in units of R2*(ΔBo).
After acquisition of the DANTE tagged image, the outline of the brain was distinguished and pixels were linearly interpolated to create a smooth contour of the brain. Then the tags (as well as some inner structures) were outlined by use of reversed scaling. By comparison of the high-resolution pseudocontour image to an artificial grid (of 250 μm-thick lines, 1 mm apart), the fractional pixel shifts of the tags throughout the ROI were determined. Shifted pixels in the vicinity of the locally shimmed volume where the CMRO2 measurement was obtained were averaged to represent R2*(ΔBo) for the ROI.
CBF measurement
SE slice-selective and nonslice-selective inversion recovery weighted EPI data were acquired with multiple TIRs ranging from 200 to 2,200 milliseconds. Each slice of the multislice data was acquired separately under relaxed conditions with crusher gradients; the inversion-to-excitation slice thickness ratio was 5 to 1. Other details of MRI perfusion data acquisition parameters were discussed above. A single-exponential recovery fit to the multiple TIR data was used to create R1 maps for the slice-selective (R1s) and nonslice-selective (R1n) images (Schwarzbauer et al., 1996). Determination of absolute CBF required an estimate of the relaxation rate of arterial blood water (R1b), which was determined to be 0.50 ± 0.03 s−1 from high-resolution CBF data (Hyder et al., 2000). The brain-blood partition coefficient for water (λ) was assumed to be 0.95 mL/g. Absolute perfusion (in units of mL/g per minute) was calculated on a pixel-by-pixel basis

where R1app is the apparent relaxation rate given by (R1b + [R1s − R1n]/[1 + ɛ]) and ɛ is a small correction factor, given by 3/4(1 − R1b/R1n), which accounts for the difference between the longitudinal relaxation rates of tissue water and arterial blood water (Schwarzbauer et al., 1996). Ten inversion times were used for each slice separately for nonselective and selective inversions, and a large homogenous radiofrequency coil was used for each spin inversion. Control experiments with normoxia, hypercarbia, and death on the same rat, as described by Schwarzbauer et al. (1996), revealed that the vascular artifacts associated with MRI spin-tagging methods (Calamante et al., 1999) over the wide dynamic range of cerebral perfusion were negligible (5% or less), as determined previously (Hyder et al., 2000). Thus, CBF reported within the 48 μL volume ROI were obtained from the capillary bed.
CMRO2 measurement
Details of the POCE pulse sequence with image-selected in vivo spectroscopy localization have been given previously (Hyder et al., 1996, 1997). Details of localization and lipid suppression were discussed above. Briefly, a 1H SE sequence of 20 milliseconds TE was modified for 13C-1H heteronuclear editing by a 13C-180° phase-cycled pulse centered at 1/2J (= 4 milliseconds; J ≈ 125 Hz) from the 1H-90° pulse. Two balanced crusher gradients were placed in each half of the SE sequence to eliminate nonrefocusing magnetization (Hyder et al., 1999a). Each free-induction decay was acquired in the presence of a broadband 13C decoupling composite pulse where the frequencies of the 13C inversion and decoupling pulses were optimized for the C4-glutamate resonance (2.35 ppm). The recycle time for each scan was 2 s. Consecutive free-induction decays, with and without the 13C inversion, were collected in two different memory blocks (64 scans/block). Before Fourier transformation, one block was subtracted from the other, zero-filled, and exponentially line-broadened (10 to 15 Hz). The POCE difference spectrum was phase-corrected manually between 4.0 and 0.5 ppm (zero- and first-order phase corrections), and the peak height at 2.35 ppm (C4-glutamate) was measured. C4-glutamate turnover data from a 48 μL volume of rat cortex were obtained during a steady-state infusion of [1-13C]glucose.
After the completion of the POCE experiment, the rat brain was frozen with liquid nitrogen and removed from the skull to determine the 13C fractional enrichment of C4-glutamate (Behar et al., 1986). The same ROI of the rat cortex as the in vivo experiment was removed based on the mark of bregma on the skull. Plasma samples (50 μL), drawn every 15 to 30 minutes, were also extracted for quantitation (Behar et al., 1986) of total glucose concentration and 13C fractional enrichment of C1-glucose. Each POCE time course from each rat was then converted into a time course of 13C fractional enrichment of C4-glutamate. The details of the metabolic modeling have been described previously (Hyder et al., 1996, 1997). Best fits of the metabolic model of brain glucose metabolism to the C4-glutamate turnover data from each rat were then used to obtain the values of the tricarboxylic acid cycle flux (VTCA). From each value of VTCA, the value of CMRO2 was determined from an established relation (Hyder et al., 1996):

From our previous studies (Hyder et al., 1996, 1997), it was determined that the major source of dilution to the acetyl CoA pool is the pyruvate/lactate blood-brain exchange. Analyses of other potential sources of error in the modeling revealed less than 5% systematic error for the dynamic range of fluxes covered in this study (Hyder et al., 1996, 1997).
CBV measurement
Relative CBV values from the baseline to lower or higher condition were measured by administration of a high-susceptibility contrast agent to enhance blood volume-induced R2 or R2* signal changes. Blood volume susceptibility was raised through serial injections (2 mg/kg per 0.9 mL bolus) of an iron oxide contrast agent (AMI-227) that remains in the intravascular space for several hours (Kennan et al., 1998). Other details of MRI data acquisition parameters were discussed above. The multislice GE and SE weighted EPI data were obtained in less than 15 minutes. The relative changes in CBV were calculated by
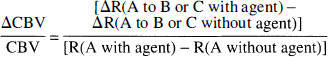
where ΔR is either ΔR2*(obs) or ΔR2(obs) and R is either R2*(obs) or R2(obs). The simultaneous effects of changes in deoxyhemoglobin and contrast agent concentrations during a perturbation are accounted for in Eq. (5), as previously shown by Kennan et al. (1998), by inclusion of absolute (R) and relative rates (ΔR) without the contrast agent. Control experiments with mild hypoxia and hypercarbia revealed that the contrast agent clearance was negligible in series of GE and SE images acquired over an hour-long period.
Prediction of ΔCMRO2/CMRO2
The BOLD fMRI signal can be described by
where R is the transverse relaxation rate of tissue water, Y is the average venous blood oxygenation, b is the blood volume fraction in an MRI voxel, Hct is the blood hematocrit, v is the magnetic field-dependent deoxyhemoglobin susceptibility frequency shift, and C is a BOLD signal proportionality constant (Kennan et al., 1994; Ogawa et al., 1993; Weiskoff et al., 1994). During a transition from one condition to another the difference of BOLD relaxation rate is given by
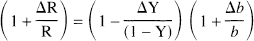
where the terms without and with the Δ indicate basal and relative differences, respectively, due to a physiologic perturbation and Δb/b is equivalent to ΔCBV/CBV (Ogawa et al., 1993). Based on Fick's principle and Eq. 7, it can be shown that
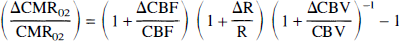
For the BOLD calibration procedure, R in Eqs. 7 and 8 can be defined as


By testing Eqs. 9 through 11, CMRO2 was predicted in three ways. A calibrated BOLD signal at 7 Tesla for rat cortex would lead to an agreement between the predicted and measured fractional changes in CMRO2 for the same physiologic transitions.
Transverse relaxation rate terms are as follows:
R2*(obs), observed apparent tissue water relaxation rate R2(obs), observed absolute tissue water relaxation rate R2′(Y), reversible relaxation component resulting from Y on tissue water relaxation rate R2(Y), nonreversible relaxation component resulting from Y on tissue water relaxation rate R2*(ΔBo), relaxation component attributed to ΔBo on tissue water relaxation rate R2(other), relaxation component assigned to nonsusceptibility-based effects Rα, R2′(Y) + R2(Y) + R2(other) Rβ, R2(Y) + R2(other) Rγ, R2′(Y)
RESULTS
The blood gases (i.e., pO2, pCO2) and pH measured during protocols 2 through 5 were insignificantly different from protocol 1 (pCO2 35 to 45 mm Hg, pO2 more than 100 mm Hg, pH 7.32 to 7.41). However, a trend in the mean systemic arterial blood pressure was observed. Pentobarbital and nicotine resulted in slightly lower (78 ± 29 mm Hg; P < 0.17) and higher (113 ± 31 mm Hg; P < 0.14) mean arterial blood pressures, respectively, compared with the control condition (92 ± 17 mm Hg). This range in mean arterial blood pressure does not affect CBF values in anesthetized rats (Hernandez et al., 1978) and therefore does not affect autoregulation.
Activity-dependent changes in CBF, CMRO2, R2*(obs), R2(obs), and CBV
Alteration of the cortical activity by pentobarbital or nicotine led to changes in the measured parameters-CBF, VTCA, R2(obs), and R2*(obs)-relative to the reference condition of morphine anesthesia (Fig. 1 and Table 1).
Summary of changes in CBF, CMRO2, ΔCBV (%), R2∗(obs), and R2(obs) during pentobarbital and nicotine administration
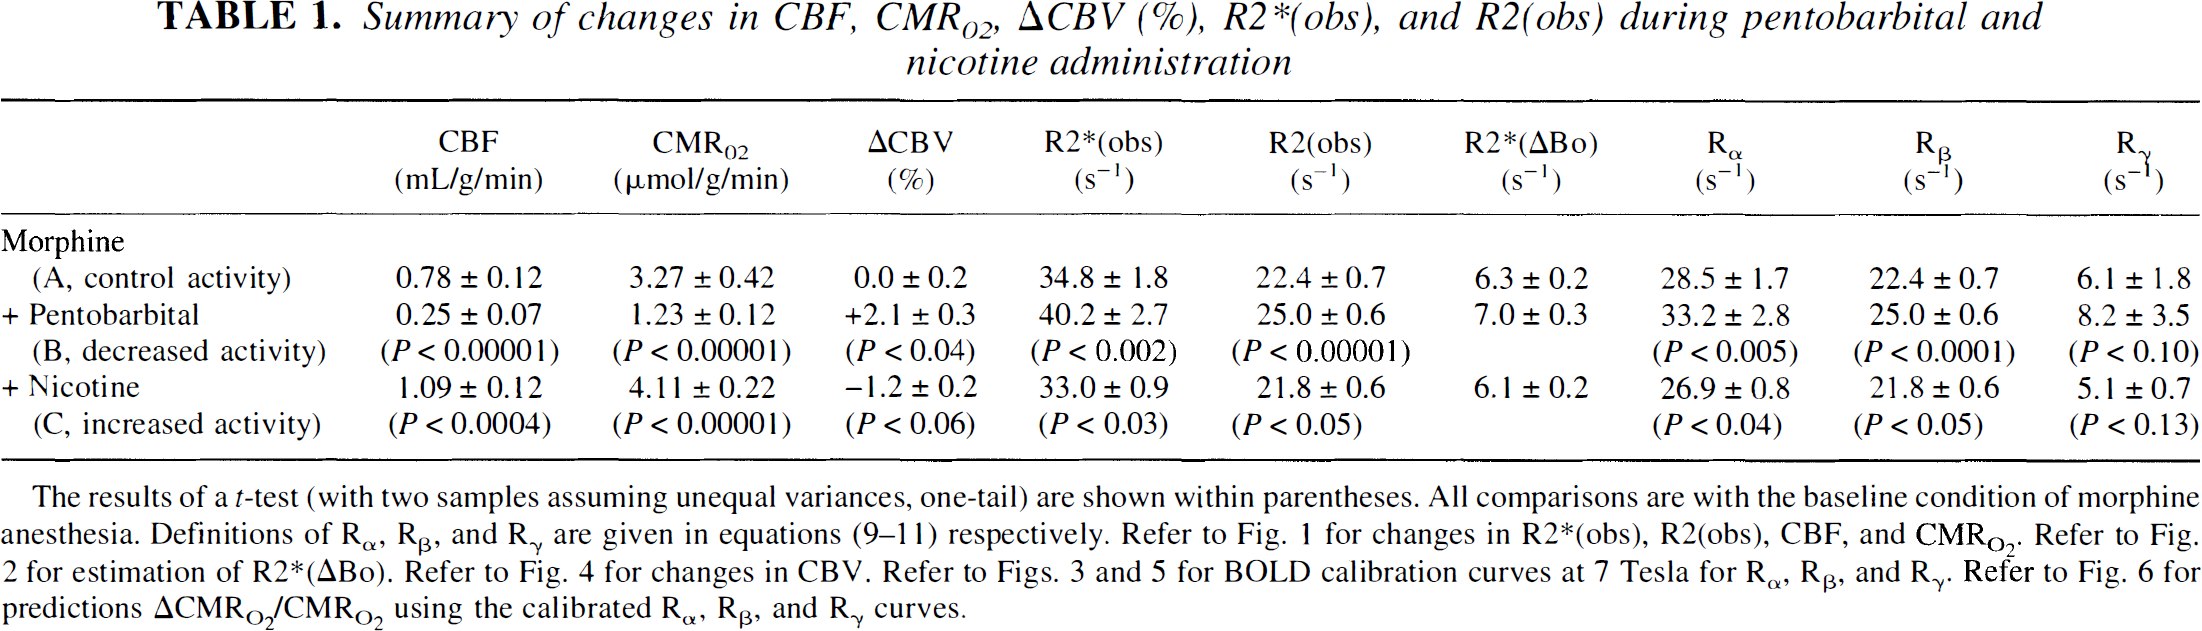
The results of a t-test (with two samples assuming unequal variances, one-tail) are shown within parentheses. All comparisons are with the baseline condition of morphine anesthesia. Definitions of Rα, Rβ, and Rγ are given in equations (9–11) respectively. Refer to Fig. 1 for changes in R2∗(obs), R2(obs), CBF, and CMR
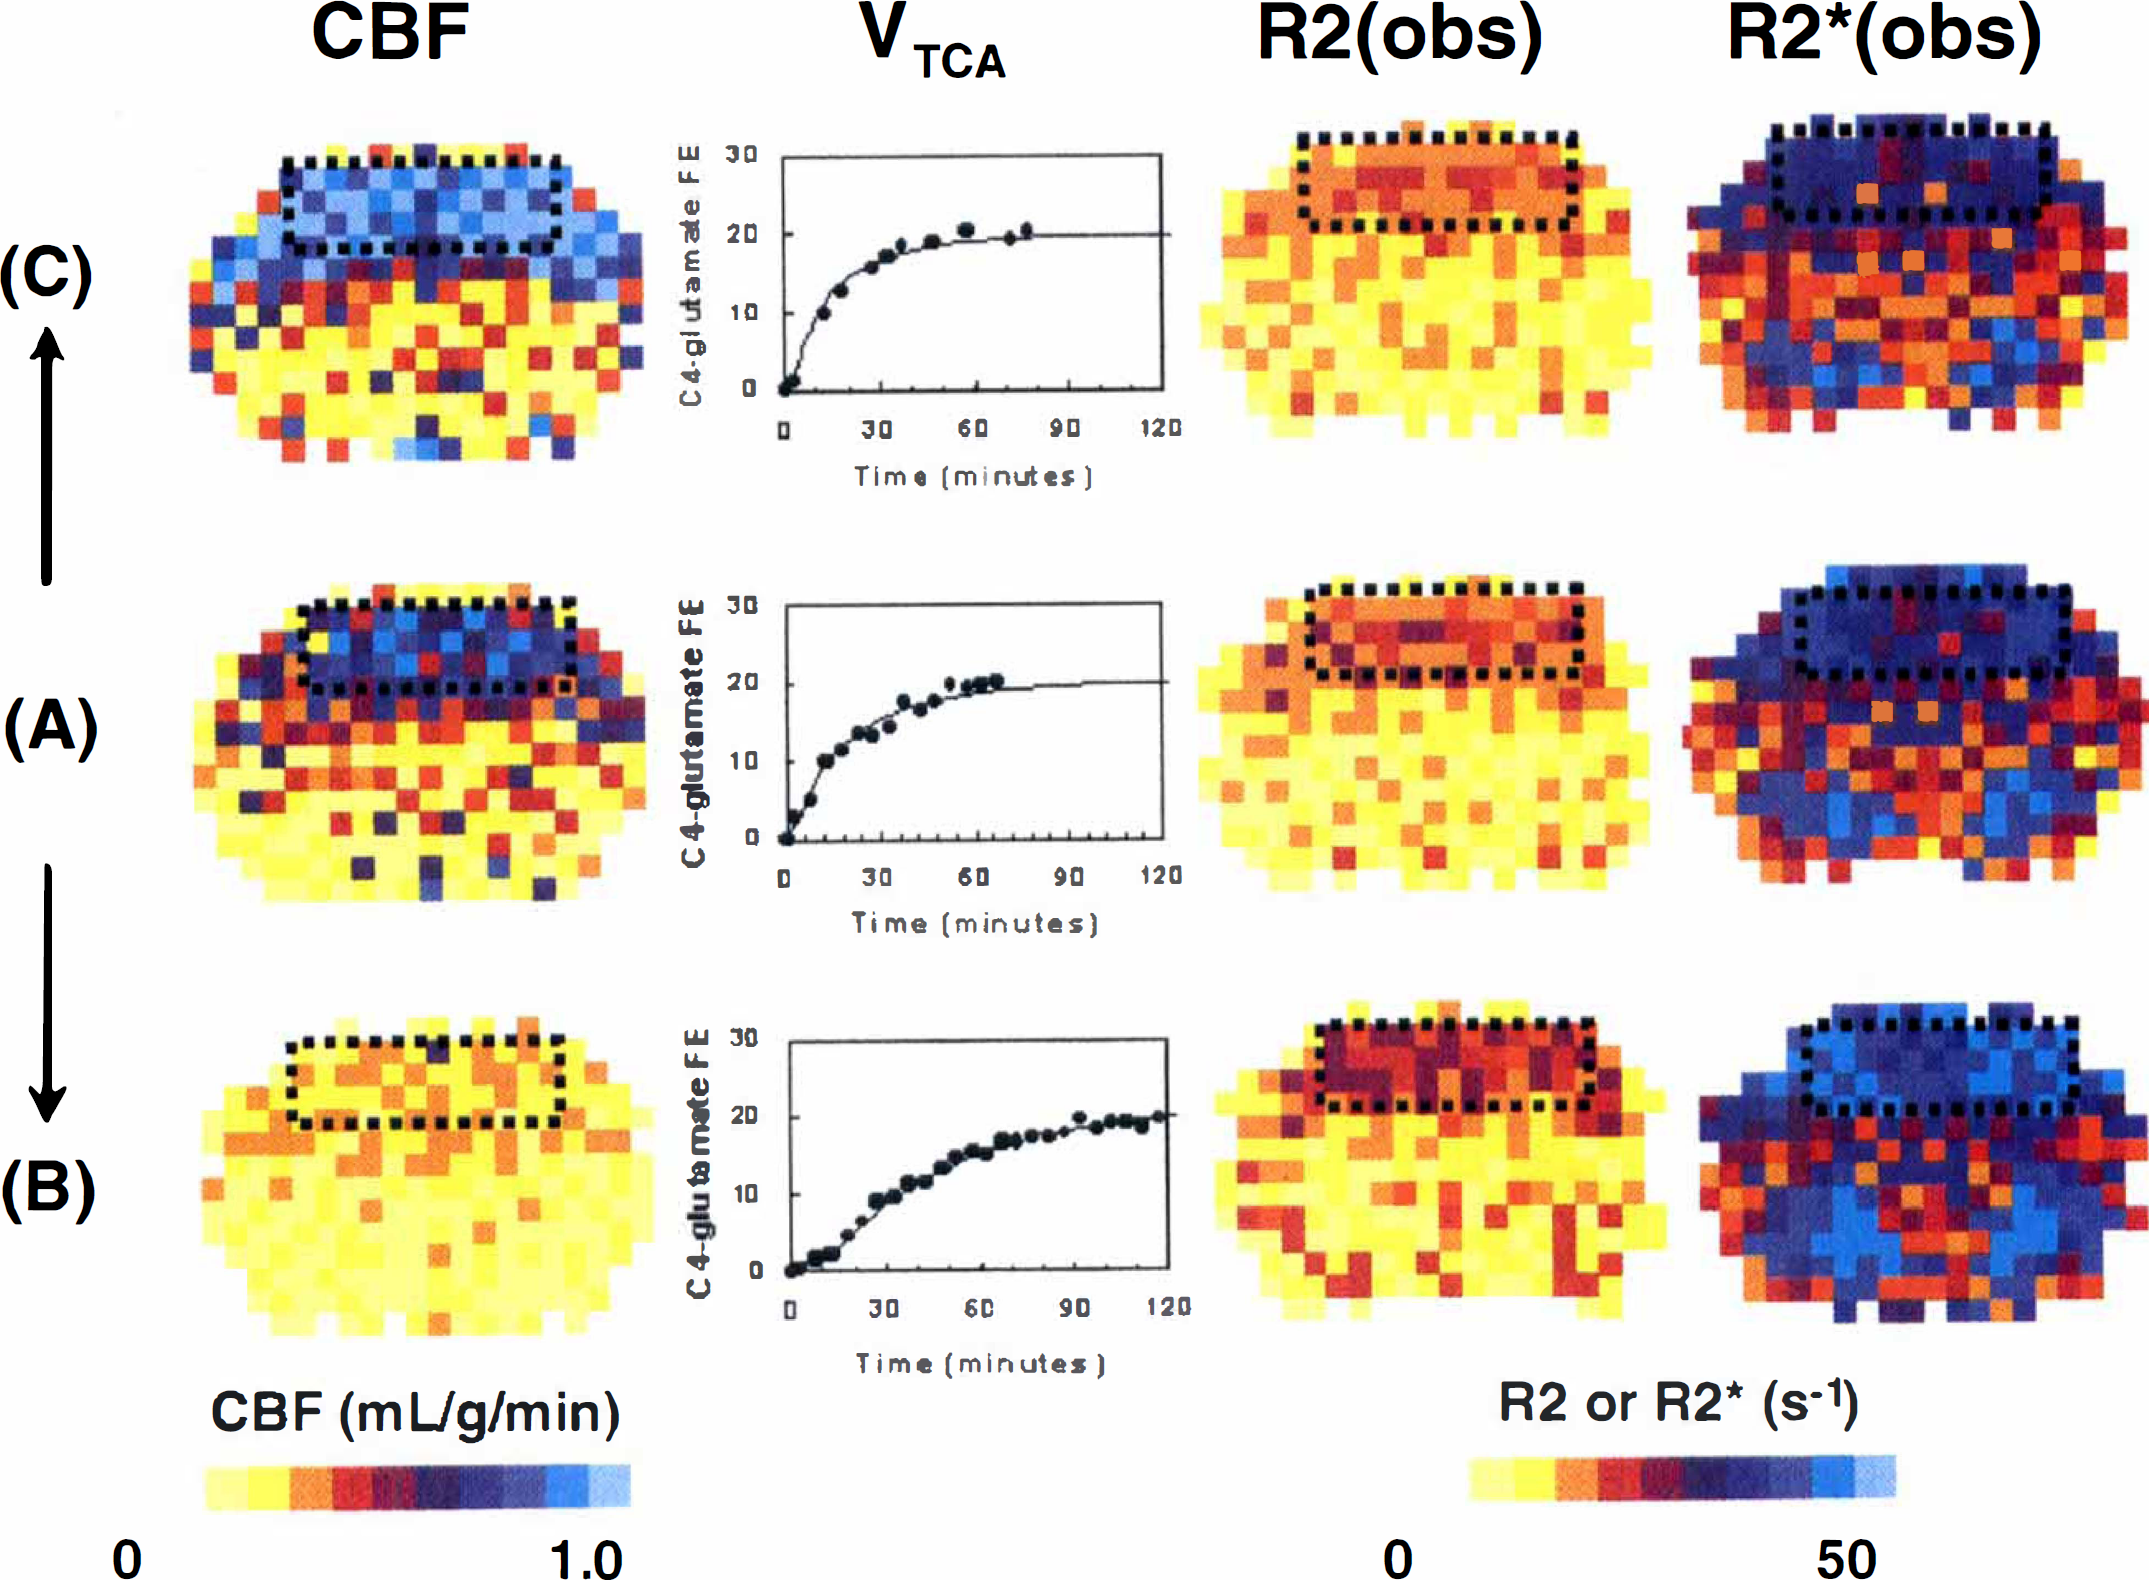
Examples of multimodal data for cerebral blood flow (CBF), tricarboxylic acid cycle flux (VTCA), R2(obs), and R2*(obs), from left to right, obtained from rats during the control condition
Under morphine anesthesia, CBF and VTCA were 0.78 ± 0.12 mL/g per minute and 1.09 ± 0.14 μmol/g per minute, respectively. After pentobarbital administration, CBF and VTCA decreased by 68% ± 9% and 62% ± 4% of the reference levels, respectively. Nicotine, which stimulates cortical activity, increased CBF and VTCA by 40% ± 15% and 27% ± 8% from the reference levels, respectively. The magnitudes of changes in perfusion and metabolism were similar to those reported in the literature for awake rate (Grunwald et al., 1987, 1991; Otsuka et al., 1991a, 1991b) and previously reported by us for adult (Hyder et al., 2000) and 30-day-old (Kida et al., 1999) rats during morphine anesthesia.
Pentobarbital treatment increased the relaxation rates, R2(obs) and R2*(obs), by 12% ± 3% and 16% ± 8%, respectively, whereas nicotine decreased them by 3% ± 3% and 5% ± 3%, respectively (see Table 1). The average contribution of ΔBo to R2*(obs) was 6.5 ± 0.5 s−1 in the locally shimmed ROI of the sensorimotor cortex using the double DANTE-tagging MRI sequence (Fig. 2). The largest shifts in the DANTE tags (approximately 1 pixel) were observed near large blood vessels and near the midline. The value of R2*(ΔB0) was subtracted from R2*(obs) for each animal. Fig. 3 shows that Rα, Rβ, and Rγ, as defined in Eqs. 9through 11, were linearly correlated with the ratio of (CMRO2/CBF). All of these changes were statistically significant.
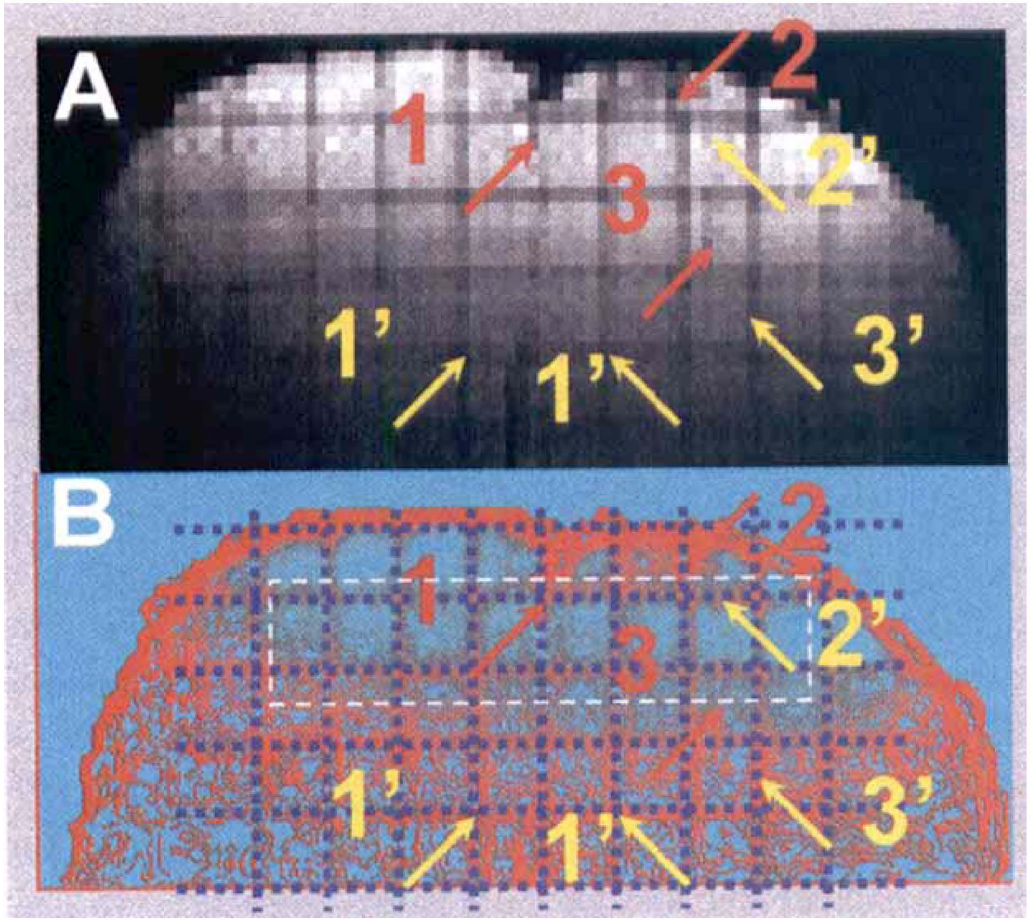
The contribution of ΔBo to R2*(obs), as shown in Eq. 1, within the same region of interest (see black dotted rectangles in Fig. 1) where the cerebral metabolic rate for oxygen consumption (CMRO2) measurements were obtained was quantitatively estimated by a double delays alternating with nutations for tailored excitation (DANTE) tagged method. The DANTE-tagged image
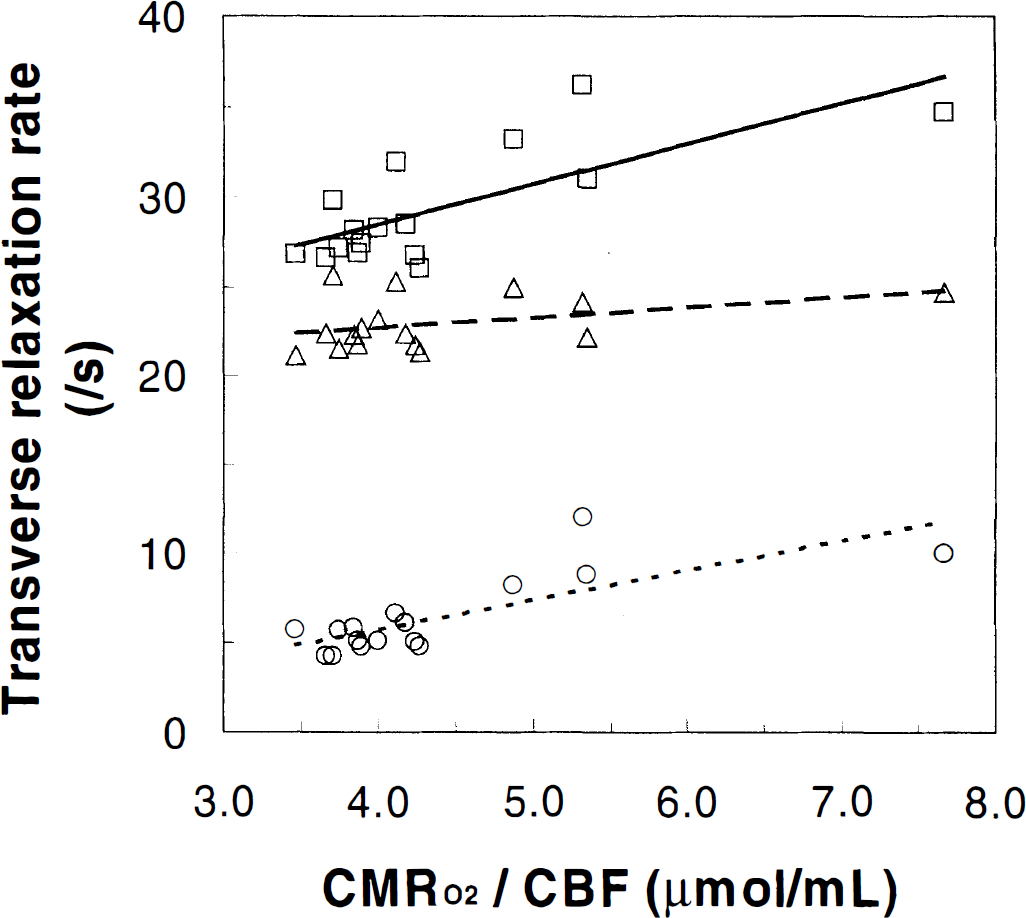
Transverse relaxation rates Rα, Rβ, and Rγ, as defined in Eqs. 9through 11, are plotted against the ratio of the cerebral metabolic rate for oxygen consumption (CMRO2) to cerebral blood flow (CBF) under three levels of cortical activity. The changes in Rα (□), Rβ (▵), and Rγ (○) were positively correlated with changes in (CMRO2/CBF). The lines in each case are the best linear fits to the data: Rα (solid line), Rβ (line with closely spaced dashes), and Rγ (line with widely spaced dashes), where the fitted equations were Rα = 2.25 × (CMRO2/CBF) + 19.49 (r2 = 0.55), Rβ = 0.57 × (CMRO2/CBF) + 20.45 (r2 = 0.16), and Rγ = 1.67 × (CMRO2/CBF) − 0.96 (r2 = 0.60). All of these changes were statistically significant (see Table 1).
Changes in the CBV, as defined by Eq. 5, were determined for the three experimental groups from maps of R2*(obs) and R2(obs) obtained in the absence and presence of an intravascular contrast agent that increases water relaxation rate (Fig. 4). In animals under morphine anesthesia (the reference state), the contrast agent increased both R2*(obs) and R2(obs) in the cortex by +20.5 ± 2.7 and +9.2 ± 0.7 s−1, respectively. Changes in activity had little effect on relaxation rates and, by inference, changes in CBV (see Fig. 4). Under pentobarbital administration, the changes in ΔR2*(obs) with contrast agent from the reference condition were approximately of the same magnitude as without agent (i.e., +5.0 vs. +5.4 s−1, respectively). A similar trend was observed in ΔR2(obs): +2.4 versus +2.6 s−1, respectively. The changes in relaxation rates in response to pentobarbital corresponded to a small decrease in CBV relative to the reference condition: −2.0% (GE images) and −2.1% (SE images). Likewise, with nicotine administration, the changes in ΔR2*(obs) and ΔR2(obs) with the contrast agent were approximately of the same magnitude as without any agent: −1.5 ± 0.6 versus −1.8 ± 0.9 s−1, respectively, for GE data and −0.5 ± 0.4 versus −0.6 ± 0.7 s−1, respectively, for SE data. With nicotine administration, the GE and SE data generated relatively small changes in CBV (+1.4% and +1.1%, respectively). The average CBV change determined by the GE and SE data was used with other multiparametric measurements to calibrate the BOLD signal.
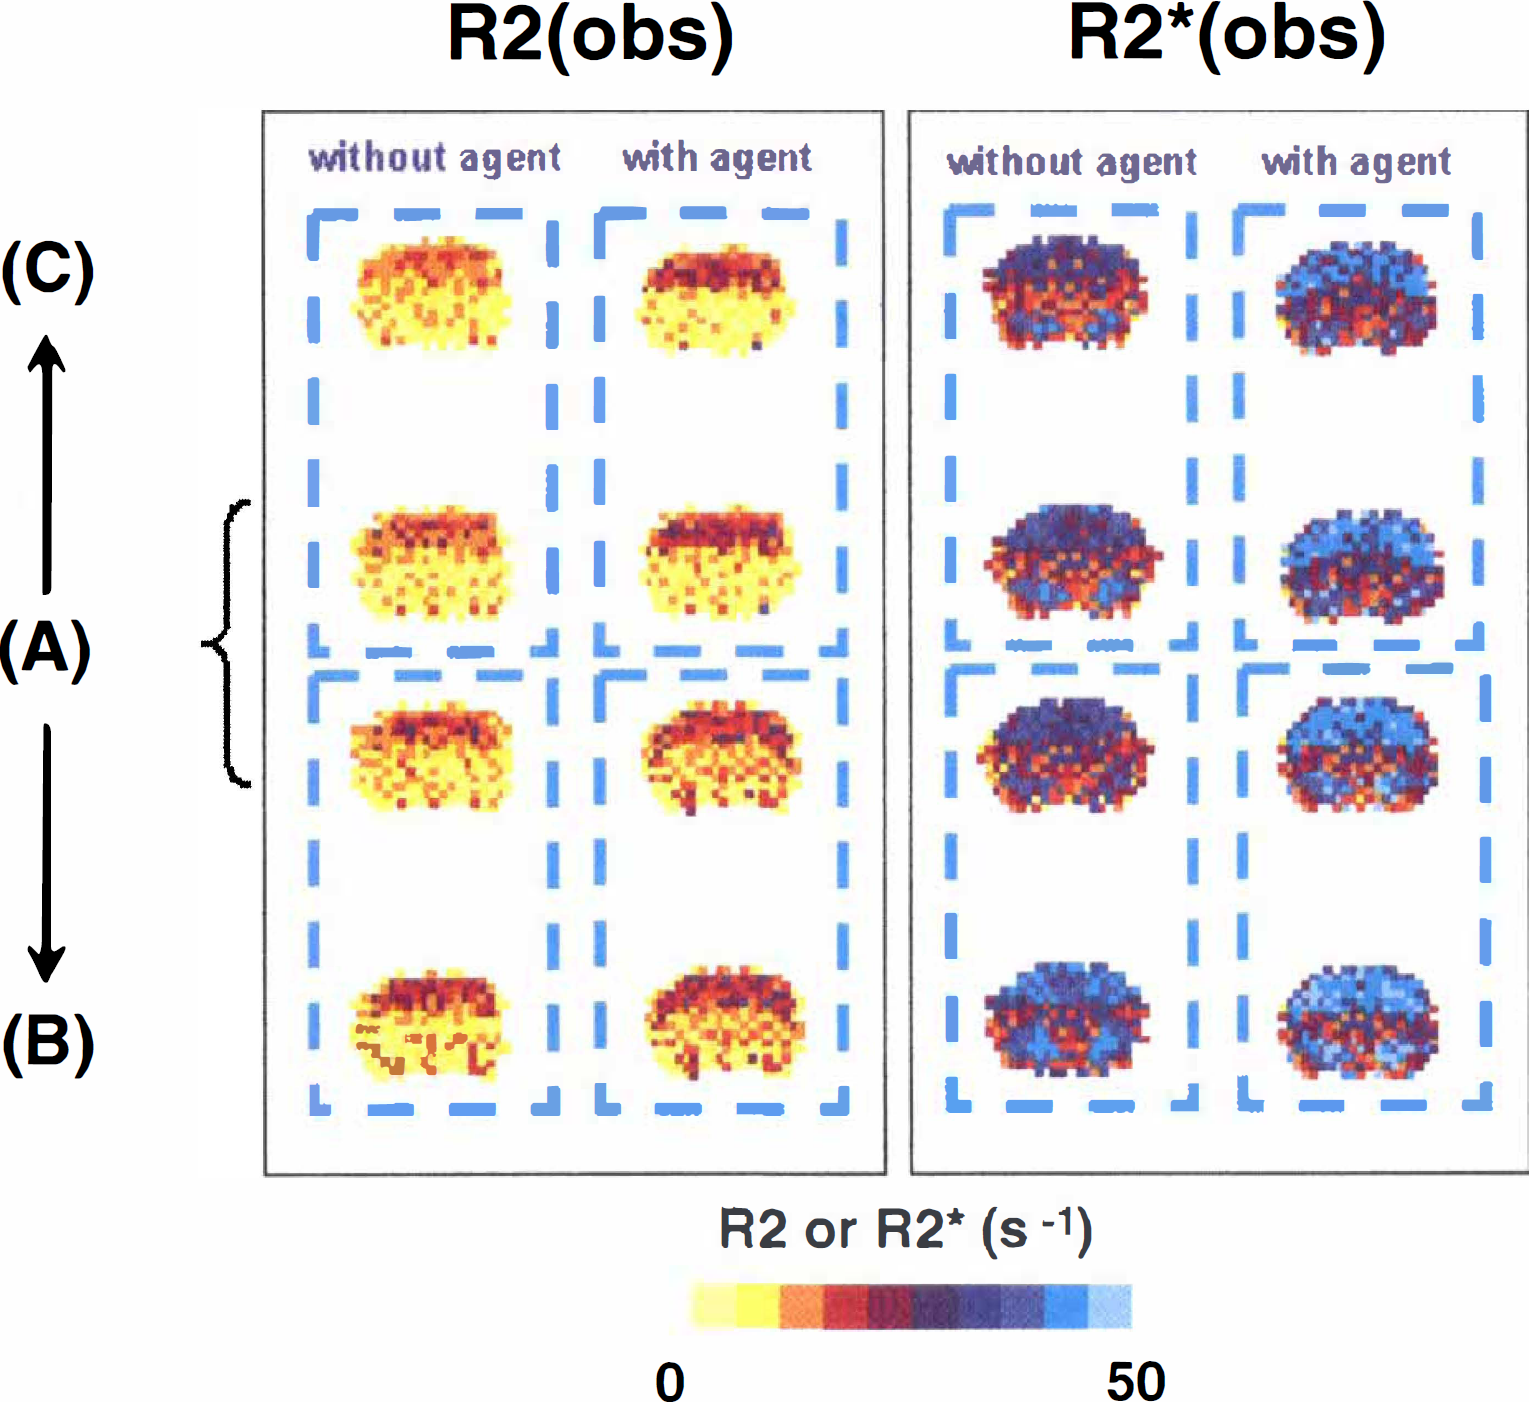
Measurement of relative changes in cerebral blood volume (CBV) from baseline
Correlation between changes in transverse relaxation rate and physiologic parameters
A negative correlation was observed between fractional changes in relaxation rate and each of the physiologic parameters (i.e., CBF, CMRO2, and CBV; Fig. 5; see Table 1), which corresponds to a positive relation between BOLD signal and these parameters. Whereas the fractional changes in CBF and CMRO2 with respect to the relaxation rate were large and of similar magnitudes (see Figs. 5A and B), the change in CBV was considerably less (see Fig. 5C). This finding shows that CBF and CMRO2 play a dominant role in modulation of the BOLD signal. Using the relation between Rα, Rβ, Rγ and CBF, CMRO2, CBV shown in Fig. 5, it was possible to calculate values of Ψ and Λ, defined as (ΔCMRO2/CMRO2)/(ΔCBF/CBF) = 0.86 ± 0.02 and (ΔCBV/CBV)/(ΔCBF/CBF) = 0.03 ± 0.02, respectively.
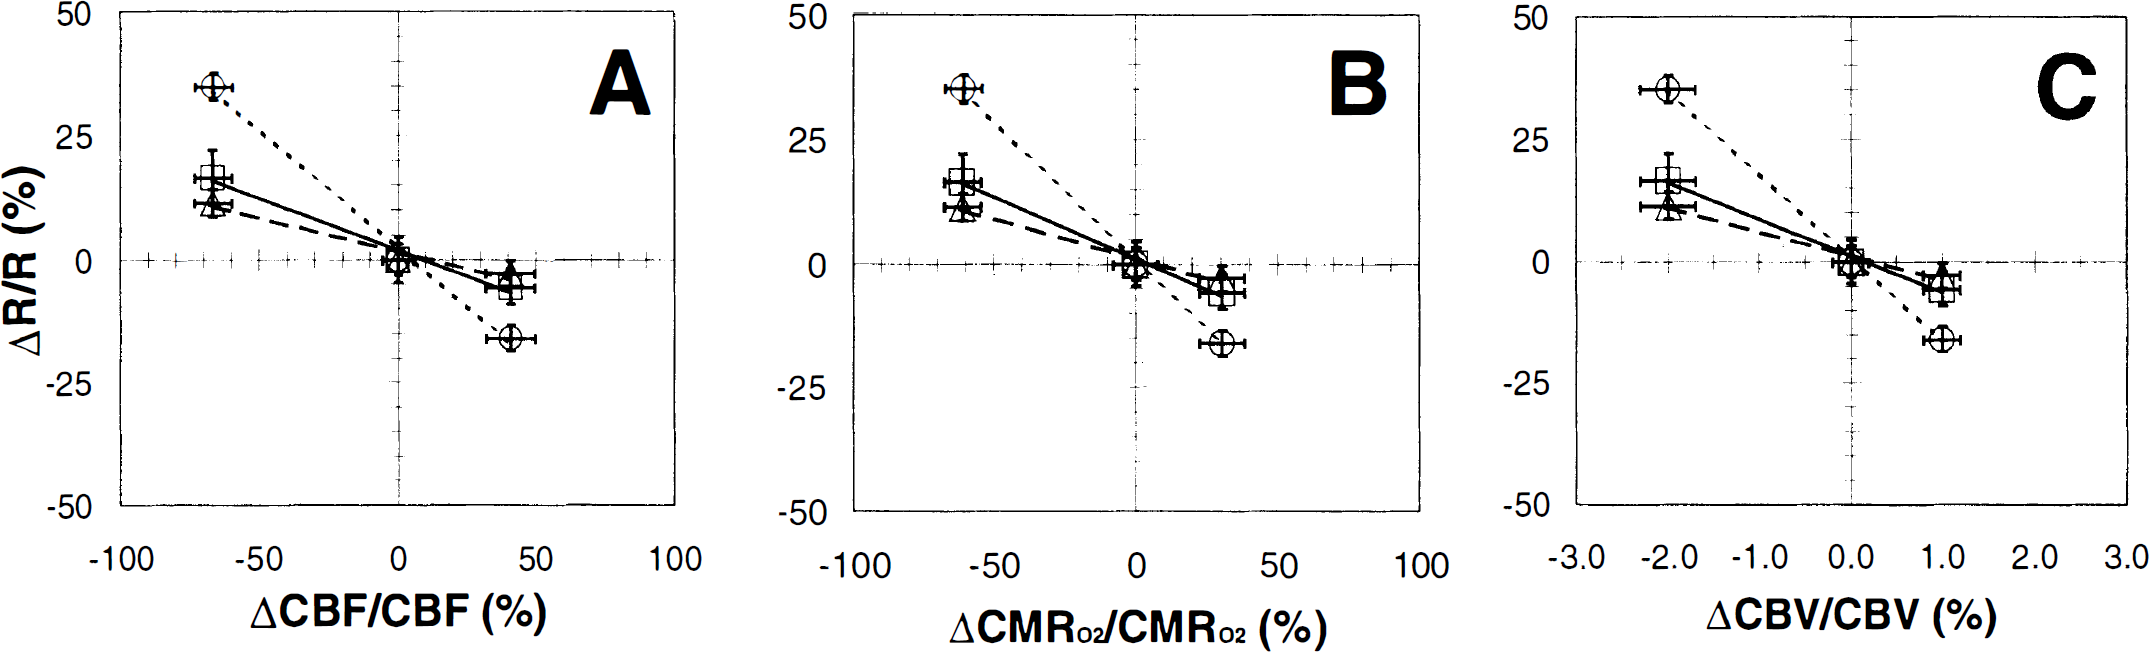
Comparison of the fractional changes in transverse relaxation rates of tissue water (Rα, Rβ, and Rγ, as defined in Eqs. 9through 11) with fractional changes in cerebral blood flow (CBF), cerebral metabolic rate for oxygen consumption (CMRO2), and cerebral blood volume (CBV), respectively, are shown (
Prediction of changes in CMRO2
To gain insight into the relative importance of the terms making up the tissue water relaxation rate in relation to the BOLD signal, tissue water relaxation was expressed in three different ways as defined in Eqs. 9through 11. As shown in Fig. 6, there was good agreement between the measured and predicted values of ΔCMRO2/CMRO2 for Rα (r2 = 0.99), Rβ (r2 = 0.98), and Rγ (r2 = 0.97). Our findings provide experimental verification for the assumptions used in the description of the BOLD phenomenon (Kennan et al., 1994; Ogawa et al., 1993; Weiskoff et al., 1994). Measured and predicted values of ΔCMRO2/CMRO2 for Rα and Rβ (see Fig. 6) were nearly identical, indicating that the R2(other) component is negligible and the R2(Y) component significantly modulates the BOLD signal. Recently, Lee et al. (1999) have demonstrated at 9.4 Tesla in rat cortex that the transverse relaxation rates of tissue and blood near hyperoxygenated conditions are approximately 26 and 25 s−1, respectively, which correspond to values of R2(obs) and R2(Y), respectively, based on our definition in Eq. 2. The difference of these two values-that is, R2(other) of about 1 s−1-can be considered negligible within experimental errors, which indicate that at very high fields, deoxygenation effects in the blood dominate relaxation effects in the tissue. Although the correlation for Rγ was weaker than Rα and Rβ (see Fig. 6), the R2′(Y) component also had a significant influence on the BOLD signal. Because the weaker correlation for Rγ was due to the falloff at the higher activity state only, it is possible that the relation between the physiologic parameters and R2′(Y) is nonlinear. Therefore, we conclude that the strongest modulator of the BOLD signal at 7 Tesla is the R2′(Y) component in the GE images and the R2(Y) component in the SE image.
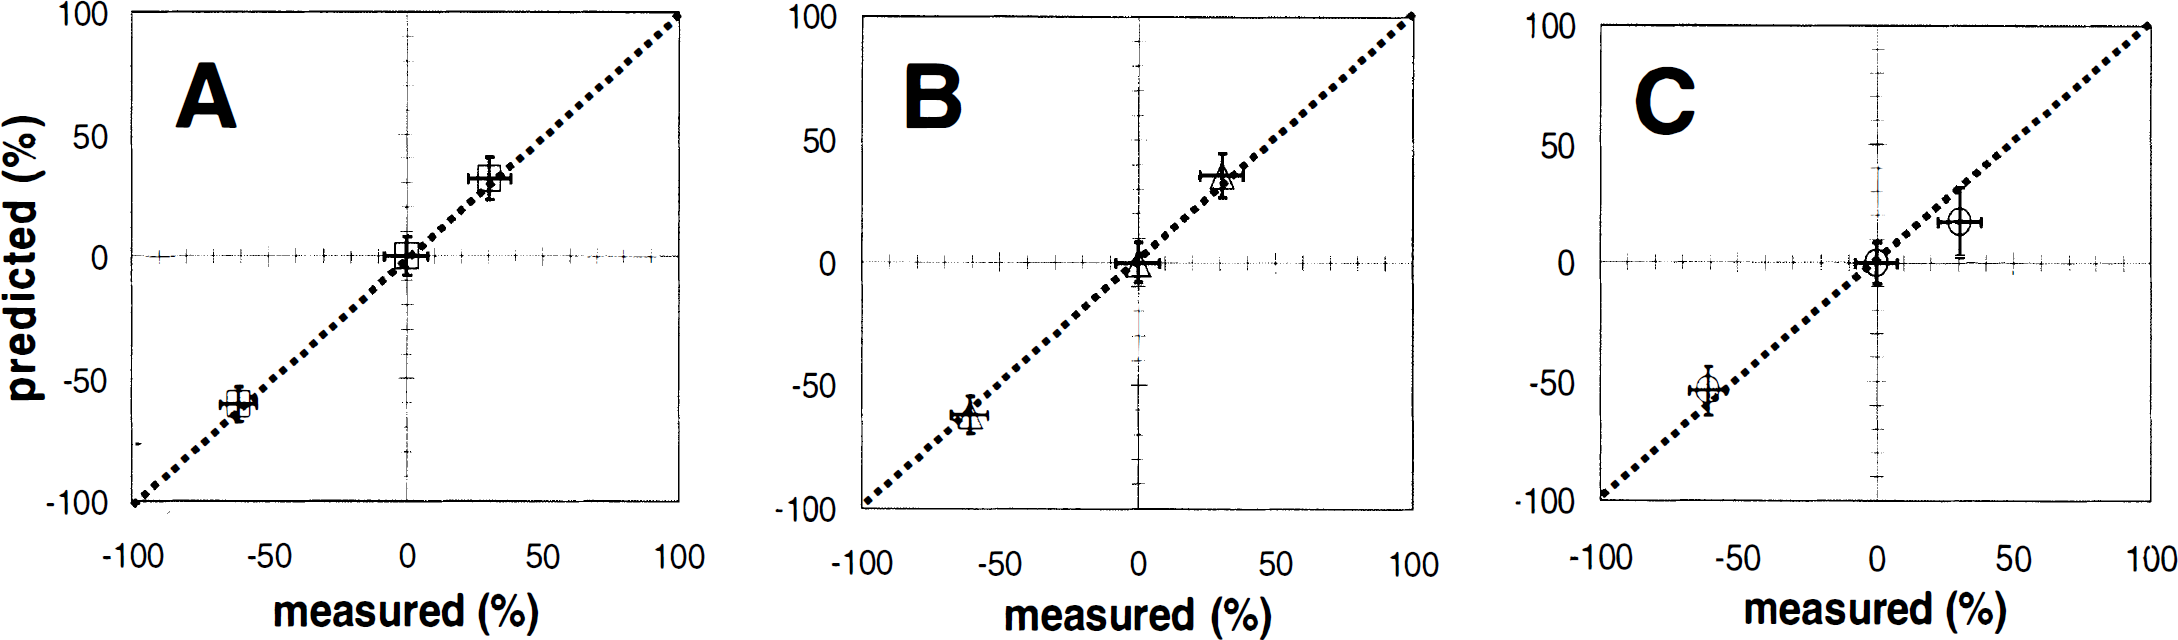
Comparisons of the predicted and measured values of ΔCMRO2/CMRO2, using the three calibrated relaxation rates Rα, Rβ, and Rγ (see Eq. 8) are shown (
DISCUSSION
The changes in perfusion and metabolism determined for the pharmacologic agents (see Fig. 1) agree well with our previous measurements (Hyder et al., 2000; Kida et al., 1999) and reports from the literature (Grunwald et al., 1987, 1991; Otsuka et al., 1991a, 1991b). The linear relation observed between the tissue transverse relaxation rates and the physiologic parameters (see Fig. 5 and Table 1) supports previous qualitative findings in animal studies (Kida et al., 1996; Ogawa et al., 1993; Prielmeier et al., 1994) where CBF, CMRO2, and/or CBV were not measured. In this study, quantitative measurements of changes in CBF, CMRO2, and CBV over a wide range of activity permitted the relations between these parameters to be established. The range of cortical activity studied was within the limits expected for CBF autoregulation in the anesthetized rat (Hernandez et al., 1978). Thus, the results obtained are considered to be relevant to normal physiologic activation.
First and most importantly, this study provides a quantitative relation between changes in physiology (CBF, CMRO2, and CBV) and BOLD signal for rat cortex at 7 Tesla. All previous studies have measured at best two of these parameters and assumed the other parameters under conditions of hypoxia or hypercapnia, which are non-physiologic perturbations. Because the perturbations used in this study were maintained within autoregulatory physiologic limits, this BOLD calibration approach can be used for other types of physiologic perturbations (e.g., functional activation) for rat cortex at 7 Tesla. Therefore, prediction of CMRO2 maps of high spatial resolution is possible with CBF, CBV, and BOLD measurements in rat cortex at 7 Tesla for physiologic perturbations. Recently, we showed (Hyder et al., 2000) that the ratio Ψ, defined as (ΔCMRO2/CMRO2)/(ΔCBF/CBF), with pharmacologic perturbations (as used in this study) and with functional activation in anesthetized rats (e.g., forepaw stimulation) have similar values (∼0.8). These results indicate that under conditions of moderate anesthesia in rat cortex, oxygen delivery is regulated over a wide range of activity (Hyder et al., 1998) and there is no uncoupling between CBF and CMRO2 over that range, which includes functional activation (Hyder et al., 1999c, 2000). Therefore, it is believed that the BOLD calibration at 7 Tesla provided here can be used for functional activation studies in anesthetized rats.
Assumptions, systematic errors, and experimental pitfalls
The major assumptions that affect the calculated rate of VTCA are the kinetic parameters for glucose transport and the rates of exchange between glutamate and glutamine and α-ketoglutarate and glutamate (Hyder et al., 1996, 1997). The parameters for glucose transport obtained from 13C NMR measurements showed that there is less than a 5% effect on the calculated VTCA even for large variations in these parameters (Hyder et al., 1996). The rate of exchange between C4-glutamate and C4-glutamine contributes to a time lag between the 13C turn-over data in C4- and C3-glutamate. The fits performed with large variations in glutamate/glutamine exchange rate resulted in slight variations in VTCA(Hyder et al., 1996), indicating that glutamate/glutamine exchange is not the rate-limiting factor in 13C turnover of C4-glutamate. The accurate measurement of VTCA depends on the large glutamate pool acting as an effective label trap for 13C label passing through the TCA cycle. Studies measuring the in vivo rate of exchange between the TCA cycle and glutamate based on labeling kinetics of C4- and C3-glutamate demonstrated that within the metabolic range under investigation here, the exchange is much more rapid than the TCA cycle, and the label trap assumption is valid (Hyder et al., 1996). Overall, the maximum error of these assumptions on the calculated value of VTCA would be less than 10%.
The conversion of VTCA to CMRO2 depends on the substrate source used for oxidation (Hyder et al., 1996, 1997). Based on previous studies of rats fasted for more than 12 hours (Hyder et al., 1996, 1997, 1999b, 2000), we assumed that all of the net substrate oxidized was from glucose, with dilution of glutamate being from exchange of brain and blood lactate/pyruvate. The error in converting VTCA to CMRO2 introduced by the dilution of glutamate reflecting oxidation of β-hydroxybutyrate, which has a slightly different stoichiometry, would be on the order of 5% (Hyder et al., 1996, 1997).
A potential source of uncertainty in the BOLD calibration may arise from the unknown degree of heterogeneity in metabolism over the 48 μL volume of cortex examined. The CMRO2 measured in the ROI by MRS is equivalent to the average of CMRO2 from all the MRI subvoxels. By calculating ΔCMRO2/CMRO2 in each voxel from the MRI data and then summing, the average value determined from the MRI calibration should agree with the MRS measurement, if the theory is correct. The finding of good experimental agreement between these independent measures strongly supports the ability to use combined BOLD, CBF, and CBV measurements to map CMRO2 at 7 Tesla. A limitation in this approach is that voxels at the MRI spatial resolution with very high or low values of CMRO2, which may not be faithfully characterized by the BOLD method, could be averaged out. Implementation of high-resolution CMRO2 mapping by MRS using EPI (Hyder et al., 1999b) would reduce the uncertainty associated with the current calibration.
The CBV measurements were based on the following assumptions, to the first order: the changes in the tissue water transverse relaxation rate caused by a perturbation are separable in terms of blood volume changes and blood oxygenation changes in hemoglobin, and blood hematocrit is invariant throughout each perturbation (Kennan et al., 1998). The magnetization and susceptibility of the superparamagnetic agent used in this study are far greater than those of paramagnetic agents (e.g., deoxyhemoglobin or gadolinium), although the magnetization and susceptibility enhancements of the iron oxide seem to be more pronounced at lower static magnetic field strengths (Jung and Jacobs, 1995). The effect of a changing agent clearance rate with altered activity appears to be negligible because even at very high perfusion rates the clearance rate of the contrast agent remains unaltered over long periods because the blood half-life of AMI-227 is several hours (Kennan et al., 1998). Because AMI-227 is an intravascular contrast agent that distributes uniformly in blood plasma, the derived changes in CBV based on transverse relaxation rate measurements reflect mainly the changes in plasma. However, under the assumption of constant hematocrit, the changes in plasma and hemoglobin in the vasculature would be equivalent, in turn reflecting changes in CBV. This assumption has been validated by recent multitracer CBV measurements in cerebral cortex (Todd et al., 1993).
Because the CBF measurements were made near ideal conditions for each spin-tagged image, most of the transit time artifacts associated with MRI spin-tagging methods (Calamante et al., 1999) were negligible. The CBF data were obtained by an inversion recovery method that was based on absolute R1 measurements in labeled and control images (Schwarzbauer et al., 1996) with delayed acquisition and crusher gradients to minimize the effects of vascular artifacts in steady-state spin labeling. A systemic error of 5% or less was estimated for the dynamic range covered in this study (Hyder et al., 2000). Similarly, because the BOLD calibration approach here relies on relative changes in magnetic and physiologic parameters, the slight differences in absolute values of relaxation rates produced by single-exponential fits, as opposed to multiexponential fits (Kurland, 1985), will not significantly affect the observed trends.
The value of Ψ, as given by (ΔCMRO2/CMRO2)/(ΔCBF/CBF), was 0.86 ± 0.02, which is in good agreement with the value of 0.88 ± 0.06 deduced from the literature (Hyder et al., 1998, 1999c) and from functional activation MRS/MRI studies of rats under α-chloralose anesthesia (Hyder et al., 2000). Likewise, the value of Λ, as signified by (ΔCBV/CBV)/(ΔCBF/CBF), was calculated to be 0.03 ± 0.02, which is in good agreement with changes detected during functional activation during forepaw stimulation in rats (Hyder et al., 2000; Kennan et al., 1998). However, the value of Λ determined with the current experimental paradigm is less by an order of magnitude than the value of Λ predicted by the relation derived from severe hypercapnic challenge in primates by positron emission tomography (PET) (Grubb et al., 1974). This discrepancy could be attributed to the tracers used in the MRI and PET methods for CBV measurements. Most MRI contrast agents, as in the present study, are entirely intravascular markers of plasma, whereas radioactive C15O, as used in PET measurements, has a high affinity for hemoglobin. Because the parenchymal distribution spaces and blood half-lives of C15O/hemoglobin and AMI-227/plasma are likely to be significantly different from each other, the actual changes in tracer kinetics of each label, which in turn would reflect changes in CBV, could also conflict. In support of this postulate, CBV changes reported by other non-PET/MRI methods show reasonable agreement with changes observed by MRI methods. From the control condition of morphine anesthesia, CBV and CBF change by approximately 20% to 30% and 150% to 250%, respectively, with mild hypercarbia (pCO2 50 to 60 mm Hg) using the MRI methods used in this study (F. Hyder, unpublished results). Other non-PET/MRI methods have reported similar magnitudes of changes in CBV and CBF with hypercapnia (Shockley and LaManna, 1988).
Hypercapnia may induce other potential experimental pitfalls for BOLD calibration. There is evidence of a changing blood hematocrit (Keyeux et al., 1995) and pH (Siesjo et al., 1972) with hypercapnia. Because changes in blood hematocrit and pH affect the oxygen-binding capacity of hemoglobin and the efficiency of oxygen transport to tissue (Hlastala and Woodson, 1983), the signals detected by near-infrared spectroscopy (Pollard et al., 1996) and BOLD fMRI image contrast (Harper et al., 1998) may not provide the proper calibrations. Further, during mild hypercarbic challenges, it has been found that CMRO2 is relatively constant (Artru and Michenfelder, 1980). For these reasons, caution is encouraged when using any relation between CBV and CBF derived from hypercarbia for BOLD signal calibrations. Similar precautions are recommended for hypoxic challenges (Robertson and Hlastala, 1977).
Calibration of BOLD image contrast
The approach we used to calibrate the BOLD signal differs from previous animal studies, which used a nonphysiologic challenge (e.g., hypoxia or hypercapnia) to perturb CBF (Kida et al., 1996; Prielmeier et al., 1994; van Zijl et al., 1998). In these studies CMRO2, CBF, and CBV were not measured, and in some cases changes in CBV were assumed to follow the dependence proposed by Grubb et al. (1974) for hypercapnic challenges in humans. Limitations of this approach are that respiratory challenges such as hypoxia and hypercapnia induce some level of uncoupling between CBF and CMRO2 and alterations in the blood pH and hematocrit, all of which would cause errors in the calibration of the BOLD signal against the unmeasured physiologic parameters. To avoid these unknown factors, we directly measured the physiologic parameters that modulate the tissue water transverse relaxation rates over a wide range of activity where metabolic and hemodynamic autoregulation is maintained (Hernandez et al., 1978). The BOLD calibration provided here is valid for activity changes where autoregulatory mechanisms are intact. Because hypercarbia and hypoxia are nonphysiologic perturbations that break the mechanisms by which autoregulation is maintained in the cortex, separate BOLD calibrations in rat cortex at 7 Tesla would be necessary for nonphysiologic perturbations.
The BOLD fMRI signal is determined by characteristics that influence the microscopic field gradient generated by deoxyhemoglobin in the microvasculature, such as the geometry and density of microvessels, static magnetic field strength, and concentration of deoxyhemoglobin within the microvessels (Kennan et al., 1994; Ogawa et al., 1993; Weiskoff et al., 1994). Although the morphologic features (e.g., size, geometry) of microvessels are important for the basal value of the BOLD signal at a particular magnetic field strength, it is only the change in concentration of deoxyhemoglobin from short-lived and/or transient physiologic perturbation that is important for calibration of the BOLD fMRI signal change. However, for steady-state quantitative BOLD calibration, as in this study, it is necessary to determine the absolute fractional changes in both magnetic and physiologic parameters.
In this study, the contribution of the macroscopic static magnetic field inhomogeneity to the apparent transverse relaxation rates for tissue water obtained with the GE sequence was removed (see Fig. 2 and Table 1) to allow calibration of R2* changes (see Figs. 3 and 5). In contrast, because the absolute transverse relaxation rates for tissue water obtained with the SE sequence are uncontaminated by macroscopic static magnetic field inhomogeneity (van Zijl et al., 1998), the R2 changes can be calibrated readily (see Figs. 3 and 5). The BOLD calibration was tested by defining the transverse relaxation of tissue water in three different ways, as depicted in Eqs. 9through 11. In each case, the changes in the relaxation rate varied linearly with the changes in the respective physiologic parameters (CBF, CBV, and CMRO2; see Fig. 5). These findings confirm and extend some recent observations from functional brain studies of the awake human (Kim et al., 1999) and the anesthetized rat (Hyder et al., 1997, 2000) in which changes in the BOLD signal and CBF and CMRO2 were shown to be correlated. In the van Zijl et al. (1998) study, cats were exposed to a hypoxic challenge, during which CMRO2 remained constant but CBF and CBV increased significantly. Because cerebral oxygen delivery and consumption become uncoupled to perfusion under nonphysiologic challenges such as hypercapnia or hypoxia, the sensitivity of the BOLD effect to changes in CBV and CBF would be different from the relations shown in Fig. 5.
Prediction of changes in CMRO2 based on calibrated BOLD image contrast
Using the relation established in Eq. 8, the fractional changes in CMRO2 were calculated for the three BOLD calibrated transverse relaxation rates, depicted by Eqs. 9through 11. As shown in the correlation plots of Fig. 6, the generally favorable agreement between the measured and predicted values of ΔCMRO2/CMRO2 for each calibration lends strong support to the theoretical description of the BOLD phenomenon (Kennan et al., 1994; Ogawa et al., 1993; Weiskoff et al., 1994). More importantly, comparison of the predicted values of ΔCMRO2/CMRO2 with the three calibrations revealed the following:
• The R2(other) component of R2*(obs) and R2(obs), which is the component assigned to nonsusceptibility-based effects, is negligible.
• The R2(Y) component of R2*(obs) and R2(obs), which is the nonreversible relaxation component resulting from blood oxygenation effects on the tissue water relaxation rate, manifests a significant BOLD dependence.
• The R2′(Y) component in R2*(obs), which is the reversible relaxation component resulting from blood oxygenation effects on the tissue water relaxation rate, is a relatively significant modulator of the BOLD signal but exhibits a nonlinear dependence on the physiologic parameters that modulate the BOLD signal.
• The strongest modulator of the BOLD signal in GE sequences is the R2′(Y) component of R2*(obs), whereas in SE sequences the strongest contributor to the BOLD signal is the R2(Y) component of R2(obs).
The factors that affect the rate of loss of transverse magnetization in GE and SE pulse sequences have been explored using mathematical modeling (Kennan et al., 1994; Ogawa et al., 1993; Weiskoff et al., 1994). At optimal echo times and within the physiologic range of diffusion coefficients, GE contrast is sensitive to small and large vessels, whereas SE contrast is more sensitive to smaller vessels because the motional narrowing effects in large vessels are refocused. However, because the ratio of Rα to Rβ is slightly greater than 1 (see Table 1), the GE signal source is mainly microvasculature at 7 Tesla. These results are in agreement with theoretical findings (Kennan et al., 1994; Ogawa et al., 1993). Further, the excellent agreement between the ΔCMRO2/CMRO2 predictions with Rα and Rβ, as shown in Figs. 6A and 6B, reveal that although GE and SE sequences are affected by slightly different contrast mechanisms, they both may be calibrated to provide accurate measurements of fractional changes in CMRO2 at 7 Tesla because R2(other) is negligible. In support of this, Lee et al. (1999) have demonstrated at 9.4 Tesla in rat cortex that R2(other) is significantly smaller than either R2(Y) or R2′(Y).
At a static magnetic field strength of 4 Tesla and higher, the effects of BOLD image contrast on the GE and SE signals are predominantly associated with the extravascular compartment (Bauer and Schulten, 1992; Kennan et al., 1994; Ogawa et al., 1993; Weiskoff et al., 1994). Recently, it has been suggested that this effect of the extravascular component alone may provide localization of neuronal activation (Zhong et al., 1998). Therefore, the BOLD calibration provided here is relevant to normal physiologic activation using multiparametric studies at 7 Tesla in rat cortex. To extend the calibration to other field strengths or animal models (e.g., hypoxia or hypercapnia), similar calibration studies are required. Because transition from one activity state to another (Shulman et al., 1999) is usually short-lived (Vazquez and Noll, 1998) for functional activation and each multimodal measurement requires a few seconds to several minutes, BOLD calibration of this nature at high temporal resolution may not be possible.
CONCLUSION
In this study, MRI and MRS methods were used for multiparametric measurements at 7 Tesla in rat sensorimotor cortex at a spatial resolution of 48 μL under conditions in which cerebral activity was altered pharmacologically. A linear relation was observed between the fractional changes in tissue transverse relaxation rates and CBF, CMRO2, and CBV, which is in support of previous qualitative findings from animal brain studies. The dominant physiologic parameters that modulate the BOLD fMRI signal are CBF and CMRO2. The calibrated BOLD signal, both with GE and SE sequences, can be used for quantitative predictions of changes in CMRO2 provided that transverse relaxation rate, CBF, and CBV measurements are made. This study provides an approach by which multiparametric MRI measurements can be used to generate relative CMRO2 maps with high spatial resolution.
Footnotes
Acknowledgments
The authors thank Professors R. G. Shulman and O. A. C. Petroff of Yale University for helpful discussions; T. Nixon, P. Brown, and S. McIntyre for maintenance of the spectrometer and the radiofrequency probe design; and B. Wang for technical support.