
Abstract
Injectable hydrogels can generate and support pro-repair environments in injured tissue. Here we used a slow-releasing drug carrying in situ-forming hydrogel to promote post-stroke recovery in a rat model. Release kinetics were measured in vitro and in vivo with MRI, using gadolinium-labeled albumin (Galbumin), which demonstrated prolonged release over multiple weeks. Subsequently, this hydrogel was used for long-term delivery of vascular endothelial growth factor (VEGF) and angiopoietin-1 (Ang1) (Gel VEGF + Ang1, n = 14), in a photothrombotically induced cortical stroke lesion in rats. Control stroke animals were intralesionally injected with saline (Saline, n = 10), non-loaded gel (Gel, n = 10), or a single bolus of VEGF + Ang1 in saline (Saline VEGF + Ang1, n = 10). MRI was executed to guide hydrogel injection. Functional recovery was assessed with sensorimotor function tests, while tissue status and vascularization were monitored by serial in vivo MRI. Significant recovery from sensorimotor deficits from day 28 onwards was only measured in the Gel VEGF + Ang1 group. This was accompanied by significantly increased vascularization in the perilesional cortex. Histology confirmed (re)vascularization and neuronal sparing in perilesional areas. In conclusion, intralesional injection of in situ-forming hydrogel loaded with pro-angiogenic factors can support prolonged brain tissue regeneration and promote functional recovery in the chronic phase post-stroke.
Introduction
Stroke is the second cause of death and a leading cause of adult morbidity, with more than 50% of survivors being chronically disabled.1,2 Ischemic stroke pathology evolves rapidly, and progression of tissue infarction may only be prevented by acute interventions that reestablish blood flow.3,4 Secondary recruitment of the boundaries of the infarction may develop over the following days to weeks. 5 Unfortunately, there are no clinically-approved therapeutic strategies to halt brain tissue degeneration or to stimulate plasticity in the subacute to chronic time-window after stroke. 6 During this phase, brain tissue surrounding the infarct is subject to reorganization, which may involve vascular and neuronal plasticity.7,8 Thus, the window of opportunity for strategies targeting perilesional neurorestorative processes is substantially wider than for acute neuroprotection. 9 After stroke, new vessels may sprout in perilesional tissue, which may lead to improved blood flow to remodeling tissue or areas at risk. 8 Two angiogenic growth factors, vascular endothelial growth factor A (VEGF) and angiopoietin (Ang)1, responsible for the formation and regulation of new blood vessels, have been suggested to play a critical role in brain recovery after stroke.10–13 Moreover, both factors have also been shown to exert neuroprotective effects.10,14,15 Accumulating data suggest that brain neurogenesis and angiogenesis are two interconnected processes, both spatially and temporally.16,17 Therefore, vascular reorganization has been recognized as a promising target for post-stroke therapies to promote neuronal survival or plasticity.10,18–20
VEGF may be the most potent central activator of physiological angiogenesis, with powerful effects on endothelial cell proliferation, migration, and survival. 21 Yet, its systemic or intracerebral administration may promote blood-brain barrier (BBB) opening and edema formation, and overabundance of VEGF could lead to a burst of disorganized and immature vascularization, which may rather worsen the existing stroke pathology.22,23 In contrast, Ang1 has anti-permeability properties that could ameliorate VEGF-induced edema. A previous study in adult mice showed that overexpression of Ang1 together with VEGF fosters functional vasculature without profound vascular leakage. 24 Therefore, combination therapy with VEGF and Ang1 may effectively promote functional revascularization and stimulate neuronal survival and neurogenesis, 10 and could thereby enhance post-stroke brain recovery.
In situ polymerizing injectable hydrogels have been suggested as promising drug carrier systems in several disorders, including stroke. 25 A main advantage of hydrogels is their capacity for sustained delivery of therapeutic doses of proteins after a minimally invasive single injection. Previously it was shown that a surgically implanted biomaterial composite carrying VEGF- and Ang1-containing microparticles could induce neovascularization and recovery after implantation in the injured area of post-stroke mouse brain. 26 Yet, this approach required a craniotomy to embed the rigid material into the brain tissue. Such invasive procedures may be circumvented with the use of in situ-forming gels with controllable release rate. 27 A particular type of injectable hydrogel made from self-assembling peptide sequences (RADA16), 28 has already been successfully used as 3D scaffold for tissue engineering and drug delivery applications.29,30 Such peptide gels have excellent biocompatibility, 31 and the capacity to maintain a high water content allowing for release of proteins of varying molecular weight. 32 A month of sustained VEGF delivery from RADA16, was shown to stimulate sufficient angiogenesis and vasculogenesis to improve cardiac function after myocardial infarction. 33
In the present study, we aimed to develop and apply a hydrogel-based therapeutic approach for sustained delivery of VEGF and Ang1 to promote vascularization and neuronal plasticity in perilesional tissue, and consequent functional recovery, chronically after stroke. MRI was employed for guidance of hydrogel implantation, evaluation of hydrogel characteristics, drug release kinetics, and monitoring of treatment effects.
Materials and methods
Hydrogel delivery system
We used a pH-sensitive peptide nanofiber-based self-assembling hydrogel in 1% (w/v) (10 mg/ml) solution (PuraMatrix™, Corning, Bedford, MA, USA). 34 The liquid to solid transformation of this hydrogel is initiated upon introduction of millimolar amounts of monovalent cations, either through addition of salt solution or injection of the material in vivo (physiological ionic strength and pH). 35
For MRI-based measurement of release kinetics, gadolinium-labeled albumin (Galbumin™, BioPAL Inc., Worcester, MA, USA) was incorporated in the hydrogels. For this, 90 μl of the stock PuraMatrix™ gel was mixed with 10 μl 250 mM pH 7.4 HEPES solution containing 10 nM of Galbumin. The final Galbumin concentration in the hydrogel was 0.01 mmol/l.
For angiogenic factor delivery, the peptide mix was first bath-sonicated for 10 min prior to mixing with growth factors. Recombinant human VEGF and recombinant human Ang1, obtained from R&D Systems (Minneapolis, MN, USA), were diluted in deionized water and mixed with the stock hydrogel to a final hydrogel concentration of 0.9% (w/v). The final concentrations of VEGF and Ang1 in the gel were 500 ng/ml and 1000 ng/ml, respectively.
Animals
Animal procedures were approved by the Ethical Committee on Animal Experiments of the University Medical Center Utrecht and Utrecht University, and conducted in accordance with the guidelines set by the European Community Council Directives 86/609/EEC. Reporting adhered to ARRIVE 2.0 guidelines. 36
For in vivo MRI-based measurement of hydrogel release kinetics, we used male Wistar rats (300–330 g) (Harlan, Horst, the Netherlands) that were endotracheally intubated and mechanically ventilated with a mixture of 2% isoflurane in 70% air/30% O2 for anesthesia, and placed in a stereotaxic apparatus (Kopf Instrument, Tujunga, CA, USA). Five microliters of a hydrogel formulation (blank gel: n = 3; Galbumin-labeled: n = 3) were stereotaxically injected in the right striatum (stereotaxic coordinates from bregma (mm): AP, 0.3; ML, 3.0; DV, 4.0 from dura) over a 10-minute period (procedure described below). For the post-stroke treatment study, 45 rats were subjected to surgery with one death under anesthesia. The remaining 44 rats were included and randomly divided into four groups (a treatment group: Gel VEGF + Ang1, n = 14; and three control groups: Gel, n = 10; Saline VEGF + Ang1, n = 10; Saline, n = 10). Animals were group-housed under standard, controlled conditions (food and water provided ad libitum, room temperature 22–24°C, 12-h light cycle).
Stroke model
Rats were endotracheally intubated and mechanically ventilated with a mixture of 2% isoflurane in 70% air/30% O2, and placed in a stereotaxic apparatus (Kopf Instrument, Tujunga, CA, USA). Blood oxygenation and heart rate were continuously monitored (Nonin Medical, Plymouth, MN, USA) during surgery, and body temperature was maintained at 37.0 ± 0.5°C through a feedback-controlled heating system. Stroke was induced by focusing light on the sensorimotor cortex in Rose Bengal-injected rats. 37 The skin over the skull was opened, 10% lidocaine (Xylocaine®, AstraZeneca, London, UK) was topically applied, after which the periosteum was removed. Using black non-transparent tape, an illumination area was defined between +4 mm to −4 mm AP and 1.5 mm to 4.5 mm ML from bregma. Next, an optic fiber mounted to a cold light source (Schott KL 1500 LCD, Germany) equipped with a green fluorescent filter (28 mm, 515 nm; Schott), was placed over the sensorimotor cortex on the intact skull. The photochemical dye Rose Bengal (Sigma) was infused into the vena saphena via a microinjection pump (25 mg/kg), after which the illumination was turned on for 20 min. The light intensity emitted by the halogen lamp was set to 3200 K/5D. Thereafter, the incision was closed. During surgery, 4 ml saline was subcutaneously injected to compensate for loss of water and minerals. Immediately after surgery, rats received a subcutaneous injection of 0.03 mg/kg buprenorphine (Temgesic®, Schering-Plough, Utrecht, the Netherlands) for post-surgical pain relief, followed by standard postoperative care and recovery in an environmentally controlled incubator.
Hydrogel implantation
14 days after photothrombotic stroke, animals received hydrogel (Gel VEGF + Ang1 and Gel group) or saline (Saline VEGF + Ang1 and Saline group), directly injected in the lesion center at stereotaxic coordinates determined from MR images (see below) and guided by an anatomical rat brain atlas. 38 Rats were endotracheally intubated, anesthetized with a mixture of 2% isoflurane in 70% air/30% O2, and placed in a stereotaxic apparatus. A burr hole was drilled in the skull above the center of the lesioned cortex. The skull was irrigated continuously with 0.9% saline at room temperature to prevent overheating. Based on the lesion volume, determined from MRI one day prior to injection, an equivalent volume of hydrogel or saline with or without VEGF + Ang1 was injected at a rate of 1.5 µl/min, using a 50 µl Hamilton microsyringe with a 26 gauge, 60 degrees-angled custom-made needle (Hamilton Company, Reno, NV, USA). The needle was left in place for 7 min after injection and slowly withdrawn thereafter.
Behavioral outcome measurements
We serially performed a sensorimotor function test in rats before (day 0) and after hydrogel injection at days 2, 7, 14 and 21. 39 The test consisted of seven limb-placing tasks, which assess forelimb and hindlimb responses to tactile and proprioceptive stimulation. 40 Scores ranged from 0 (no deficits) to 9 (severe sensorimotor dysfunction).
For the treatment study, animals were tested before stroke (baseline) and on post-stroke days 3, 7, 13, 21, 28, 49 and 70. Animals were handled daily for one week prior to examination to reduce stress and anxiety during behavioral testing. Behavioral testing included measurement of a modified sensorimotor deficit score from eight tasks, 37 which are described in Supplementary Table 1. The final score was the sum of the eight individual test scores, ranging from 0 (no dysfunction) to 26 (maximum dysfunction).
A cylinder test was applied to evaluate imbalance between impaired and non-impaired forelimb use. 37 Briefly, the rat was placed in a transparent cylinder (∅ 20 cm) on a transparent elevated platform. Exploratory activity for 2–3 minutes was analyzed from HD video recordings. Wall contacts by both forelimbs simultaneously, or by either the impaired or unimpaired forelimb were counted. A score for impaired forelimb use was calculated as: ((impaired forelimb contacts + 0.5(bilateral forelimb contacts))/(total forelimb contacts)) × 100%. Behavioral testing was carried out by a person blinded to group assignment.
Magnetic resonance imaging (MRI)
MRI studies were performed on a 4.7 T/40 cm horizontal bore MR system (Agilent Technologies, Santa Clara, CA, USA).
Longitudinal relaxivity r1 of Galbumin in phosphate-buffered saline (PBS) or Galbumin in hydrogel was measured directly after preparation. Relaxivity values and serial T1 maps were acquired using an inversion recovery protocol (8-shot Look-Locker gradient echo (GE) EPI; image repetition time (TR) = 25 ms; number of images = 100; flip angle = 5°; inversion time (TI) = 10 ms; echo time (TE) = 4.2 ms; total TR = 10000 ms; images per inversion pulse = 2; averages = 2; slices = 3; resolution = 0.188 × 0.188 ×1 mm3) to quantify in vitro Galbumin release from 40 µl hydrogel into 160 µl PBS covering the hydrogel. Sample temperature during MRI and in between MRI sessions was maintained at 37°C up to 27 days after preparation. PBS supernatant was refreshed 24 h before each MRI session to prevent the increasing supernatant concentration from impeding the normal rate of Galbumin diffusion from the gel. MRI measurements of non-labeled hydrogel (n = 3) and Galbumin-loaded hydrogel (n = 3) samples were performed from 1.5 to 24 h after preparation, and at 2, 4, 6, 9, 12, 21 and 27 days after preparation. In addition, GE 3D (TR/TE = 10/2.57 ms; pulse angle = 20°; field-of-view (FOV)=40 × 40 × 40 mm3; voxel resolution = 0.313 ×0.313 × 0.156 mm3) and spin echo (SE) MRI (TR/TE = 500/15.54 ms; averages = 2; slices = 3; resolution = 0.188 × 0.18 × 1 mm3) data were collected for assessment of gel volume and for delineation of regions-of-interest (ROIs), respectively.
To measure in vivo release kinetics and swelling behavior, serial MRI was performed directly after, and at 2, 7, 14 and 21 days after stereotaxic hydrogel injection in the rat brain. GE3D MR images, similar as described for the in vitro release measurement, were collected to localize the injected hydrogel. T1 maps were acquired from a Look-Locker inversion recovery protocol with EPI read-out (8 shots; image TR = 25 ms; flip angle = 5°; TI = 10 ms; TE = 8.75 ms; total TR = 6000 ms; images per inversion pulse = 28; averages = 24; slices = 5; resolution = 0.15 × 0.15 ×1 mm3).
For MRI in the post-stroke treatment study, rats were immobilized in an MR-compatible stereotaxic holder. Anesthesia was maintained in the same manner as described for stroke induction. During MRI, blood oxygen saturation and heart rate were continuously monitored. Capnograph readings of expired CO2 (Multinex 4200, Datascope, Fairfield, NJ, USA) were taken throughout MRI, and core temperature was maintained at 37.0 ± 0.5°C using a feedback-controlled heating pad. End-tidal CO2 levels were kept within the normal range, equivalent to arterial pCO2 levels between 35- and 45-mm Hg (calculated from previous calibration measurements), by adjusting ventilation volume or rate.
To determine size and location of the stroke lesion and to precisely guide biomaterial administration based on stereotactic coordinates, coronal maps of the brain tissue’s apparent diffusion coefficient (ADC) were calculated from diffusion-weighted 8-shot 2D EPI (TR/TE = 2000/35 ms; FOV = 32 × 32 mm2; 19 coronal slices; resolution = 250 × 250 × 1000 μm3; averages = 3; five b0 images; ten diffusion-weighted directions with b = 1274 s/mm2 (δ/Δ=9/15.29 ms, diffusion gradient strength = 21 G/cm)). Additionally, anatomical images were acquired prior to injection and in follow-up sessions with a 3D balanced steady-state free precession (bSSFP) sequence (TR/TE = 5/2.5 ms; flip angle = 20°; FOV = 40 × 32 × 24 mm3; resolution = 250 × 250 × 250 μm3; three averages per pulse angle shift of 0°, 90°, 180° and 270°.
To characterize the pattern of vascular reorganization through measurement of total and microvascular cerebral blood volume (CBV) and microvessel density (MVD), we applied steady-state contrast-enhanced MRI with a long-circulating blood pool agent: carboxy-dextran-coated superparamagnetic ultrasmall particles of iron oxide (USPIO) (Ferumoxytol, Feraheme™, AMAG Pharmaceuticals, Cambridge, MA, USA), with a hydrodynamic diameter of ca. 30 nm. We executed a multi-slice multi-SE (TR/TE1/echo time interval (ΔTE)=3000/12/12 ms; echoes = 12; averages = 3), and a multi-slice multi-GE (TR/TE1/ΔTE = 3000/2.5/2.5 ms; echoes = 25; averages = 2) protocol (19 coronal slices of 1 mm thickness; FOV = 32 × 32 mm2; voxel size = 125 × 250 μm2). SE and GE images were acquired before and after bolus injection of USPIO (300 µmol Fe/kg (15 mg/kg)) into the tail vein. Post-contrast SE and GE MRI was started 5 min after contrast agent injection.
Serial MRI measurements were performed 1 day pre-treatment, at 13 days after stroke, and post-treatment at 21, 28, 49, and 70 days.
MRI data processing and analysis
To assess hydrogel swelling or shrinkage under in vitro and in vivo conditions, hydrogel volumes were automatically segmented on MR images using a region-growing algorithm. 41 A seed pixel was selected in the center of the gel on GE3D images (in vitro study) or T1 maps (in vivo study), after which neighboring pixels with similar intensities were automatically added. 42 T1 maps were obtained by voxel-wise parametric fitting, using MATLAB (MathWorks, Natick, MA, USA).
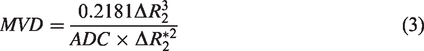
For the in vitro study, two ROIs were manually outlined on the SE images for each sample, i.e. one inside the hydrogel and one in the PBS supernatant. For the in vivo study, two ipsilateral ROIs were manually outlined on the multislice R1 (1/T1) maps, i.e. one inside the hydrogel and one in an adjacent tissue area in the striatum. The border of the ROI inside the hydrogel was kept at 2 voxels distance from the hydrogel’s rim area. The adjacent tissue ROI was drawn at 10 voxels from the outer rim of the hydrogel. For each time-point, mean R1 values for the ROIs were converted to Galbumin concentration, based on the differences in R1 values between the non-labeled and Galbumin-labeled samples and the corresponding relaxivities according to:

The percentage of Galbumin released from the samples was calculated as:


For the post-stroke treatment study, ADC values were calculated from diffusion-weighted MRI data with the dtifit routine of FMRIB’s (Oxford Center for Functional MRI of the Brain) Diffusion Toolbox.43–45 Additionally, a high-quality b0 image of each individual rat brain was obtained by adding all b0 images.
T2 and T2* maps were calculated from the SE and GE MRI data, respectively, by applying a non-linear iterative partial least squares implementation of a derivative-free separable least squares fitting routine on the complex datasets, 46 using MATLAB. Even and uneven echoes were fitted separately and the mean of the two outcomes was retained as the final T2 or T2* value. The ratio of R2* (1/T2*) and R2 (1/T2) relaxation rate changes (ΔR2*/ΔR2) after USPIO injection was used to measure the average MVD within a voxel. 47 ΔR2 reflects primarily the microvascular CBV (e.g. in capillaries and venules), whereas ΔR2* is a measure of the total CBV, including large vessels.48,49
According to Wu et al.,
50
we calculated MVD as:
This equation was used to obtain MVD maps. Voxels with negative ΔR2 or ΔR2* were assigned an MVD value of zero to eliminate non-biological values.
Unless mentioned otherwise, all image co-registrations were done with FMRIB’s Linear and Non-Linear Image Registration Tools (FLIRT and FNIRT, respectively)51,52 of FMRIB’s Software Library (FSL). 53 Brain images were masked out with FSL’s brain extraction tool BET2.
The lesion, defined as tissue having T2 values higher than the mean plus 2 times the standard deviation (SD) of corresponding contralateral T2 tissue values, was automatically outlined on pre-contrast T2 maps. Lesion volume was estimated on ADC maps using the same region-growing algorithm as described for analysis of hydrogel volume changes.
ROIs were manually drawn (blinded to experimental group) on individual MR images acquired at the final time-point, day 70, outside the lesion territory, involving the cortex, medially and laterally to the lesion (Figure 4(a)). ROI delineation was guided by a superimposed rat brain atlas (Paxinos and Watson) 38 using FSL. Homologous ROIs in the contralateral hemisphere were automatically generated using MATLAB, through mirroring across the midline, with corrections for midline shift and tissue shrinkage. Subsequently, the first image of the T2-weighted MRI series at day 70 of each individual rat was registered to the same image at other time-points (days 13, 21, 28, and 49). The ROIs for day 70 were projected on images at the earlier time-points using the registration parameters.
To correct for interindividual variance in USPIO-induced contrast enhancement, we calculated a relative interhemispheric difference in MVD, using the equation:

Positive values indicate that the ipsilateral MVD was higher than contralateral.
Histology
Immediately after the last MRI session (day 70), animals were sacrificed by an overdose of anesthesia, and brains were perfused with saline followed by 4% paraformaldehyde in 0.1 mol/l PBS (pH = 7.4). Extracted brains were stored in PBS with 0.5 g/l sodium azide. Next, brains were cryoprotected by immersion in 15% sucrose (for 48 h) and 30% sucrose solutions (for 48 h). Coronal sections (50 µm) were cut on a freezing microtome.
An observer, blinded to the group assignments, selected for each group six brains with the most pronounced elevation of peri-lesional MVD values as measured with MRI. Those brains were subjected to further histological analyses.
For double immunostaining with bright-field chromagens, sections (free-floating) were first incubated for 1 h at room temperature in a substrate kit [5-bromo-4-chloro-3-indolylphosphate/nitroblue tetrazolium (BCIP/NBT Alkaline-Phosphatase), Vector Laboratories, Burlingame, CA, USA] that stained blood vessels navy blue. Next, sections were rinsed with PBS, and non-specific protein binding was blocked for 2 h by normal goat serum (Vector Laboratories, PK-4001), following incubation overnight at 4°C with anti-neuron-specific nuclear protein (NeuN) (neuronal marker; mouse monoclonal, Millipore, Billerica, MA, USA; 1:500). The remaining primary antibody was washed away, and sections were incubated for 2 h at room temperature with biotinylated goat anti-mouse antibody (Vector Laboratories; 1:500). Positive immunostaining was visualized using a Vectastain ABC Kit (Mouse IgG) (Vector Laboratories, PK-6102) and freshly prepared Nova Red substrate (Vector Laboratories, SK-4800). Sections were mounted and cover-slipped with a xylene-based mounting solution (Permount).
Stereology
Images of complete coronal histological sections corresponding with MRI slices were acquired using digital microscopy (Nanozoomer 2.0-HT Scanner, Hamamatsu photonics, Hamamatsu, Japan). Further analysis was done on 40X images, using Stereo Investigator (version 2017.02.1, MBF Bioscience, Williston, VT, USA). Two peri-lesional cortical ROIs were drawn individually on every 18th section (Figure 4(c)). For the lateral perilesional ROI, the mediolateral width was 3 mm from the edge of the lesion, and the dorsoventral height was the whole extent of the cortex. The medial perilesional ROI included the remaining mediolateral cortex area from the medial edge of the lesion. Homologous ROIs in the contralesional hemisphere were mirrored from the lesioned side, with corrections for midline shift and tissue shrinkage, using the Stereo Investigator software.
NeuN staining was used to identify neurons, which were counted using the same stereological parameters (sampling fractions and counting unit) as in the Alkaline-Phosphatase-stained vessel branching point counts as previously described.
54
The optical fractionator design was used to estimate the numbers (N) of NeuN-positive cells and vessel branching points.
55
Each ROI was systematically, uniformly and randomly sampled in the section plane (the x-y plane) and across the thickness of the sections (the z-axis), superimposing a grid of 3D optical dissectors on top of the acquired multilayer NanoZoomer image. In a pilot setting, we determined that probe sampling parameters for counts of 900–1200 NeuN-positive cells and 200–250 vessel branching points per ROI were sufficient to obtain a Gundersen coefficient-of-error (CE) below 0.07 and 0.1, respectively. To calculate the total number of microvessels (w), we counted the total number for each anastomosis (n) and marked each type of anastomosis depending on its valence (v), reflecting the number of vessels it split into
56
We estimated the density of neurons and microvessels by dividing the numbers obtained with the optical fractionator by the volume of each region based on Cavalieri’s principle. In line with the MRI-based MVD estimation, we calculated the relative interhemispheric difference for the numbers of NeuN-positive cells and vessel nodes, according to equation (4).
Statistical analysis
Statistical analysis was performed blinded to experimental condition. Data were plotted and analyzed using GraphPad Prism 7.0. Differences between experimental groups were analyzed by one-way ANOVA with post-hoc Tukey tests, or two-way ANOVA with Bonferroni post-tests. Deviation from a Gaussian distribution was tested with the D’Agostino-Pearson normality test; alpha = 0.05. P < 0.05 was considered statistically significant.
Results
In vivo and in vitro hydrogel volume changes and protein release
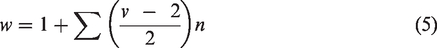
Longitudinal relaxivities (r1) of Galbumin in PBS and the hydrogel, calculated from linear regression of the measured R1 relaxation rate and the contrast agent concentration at 37°C, were 95.5 ± 5.6 and 92.5 ± 5.1 mM−1 s−1, respectively. The release kinetics of the contrast agent-labeled protein, Galbumin, from the hydrogel in PBS were subsequently evaluated with serial T1 mapping (Figure 1(a) and (b)). T1 of the supernatant of the Galbumin-labeled gel decreased over time, reflecting release of Galbumin from the hydrogel (see Supplementary Fig. 1). This was not observed for the blank gel. Within the first two days, the hydrogel released 2.2 ± 3.1% of its load (Figure 1(b)). The gel gradually released more of its protein content over the following days, up to a cumulative release of 45.8 ± 6.6% on day 27.
MRI of in vitro and in vivo Galbumin release from hydrogel. GE3D images (top) and T1 maps (bottom) of test tubes filled with 40 µl Galbumin-labeled or non-labeled (blank) protein hydrogel, covered by 160 µl PBS (a). The images were acquired 70 min (left) and 24 h (right) after initiation of gelation. T1 of the supernatant decreased with time as a result of Galbumin release (white arrows). In vitro cumulative percent release of Galbumin at 37°C between 2–27 days (b). Each point represents the mean value ± SD (n = 3). T1 maps of a coronal rat brain slice at different time-points after stereotaxic injection of non-labeled (blank) or Galbumin-labeled hydrogel in the right striatum (c). In vivo cumulative Galbumin release as a function of time after intracerebral injection (d). Data are shown as mean ± SD (n = 3).
After pipetting of 40 µl liquid state gel formulation, the measured volume upon completion of the first MRI acquisition, 70 minutes after gelation process initiation, was 27.6 ± 6.1 µl (Supplementary Fig. 2 A). The gel displayed a further steady slight decrease in volume over time, and at the final MRI time-point, i.e. 27 days post-preparation, its volume was 21.9 ± 5.1 µl.
After stereotaxic injection of 5 µl hydrogel in the rat brain, the Galbumin-labeled gel was detectable as a mass with short T1, whereas the blank gel had a long T1 (Figure 1(c)). These characteristics remained in MRI follow-up scans up to day 21. The gel volume at 1 h after injection had decreased to 1.6 ± 0.3 µl (Supplementary Fig. 2B). The hydrogel displayed gradual volume loss, possibly due to enzymatic degradation, until the end of the observation period to a volume of 0.43 ± 0.16 µl.
In vivo cumulative Galbumin release, quantified from T1 measurements (corrected for volume changes), was 17 ± 11% of the initial load within the first two days (Figure 1(d)). In the subsequent weeks, Galbumin release continued resulting in a total protein release of approximately 50% at 21 days after injection.
Rat sensorimotor function
The injection of 5 µl gel volume into healthy rat brain did not lead to changes in the sensorimotor function test score, which remained 0 ± 0 (i.e., no deficits) at all time-points.
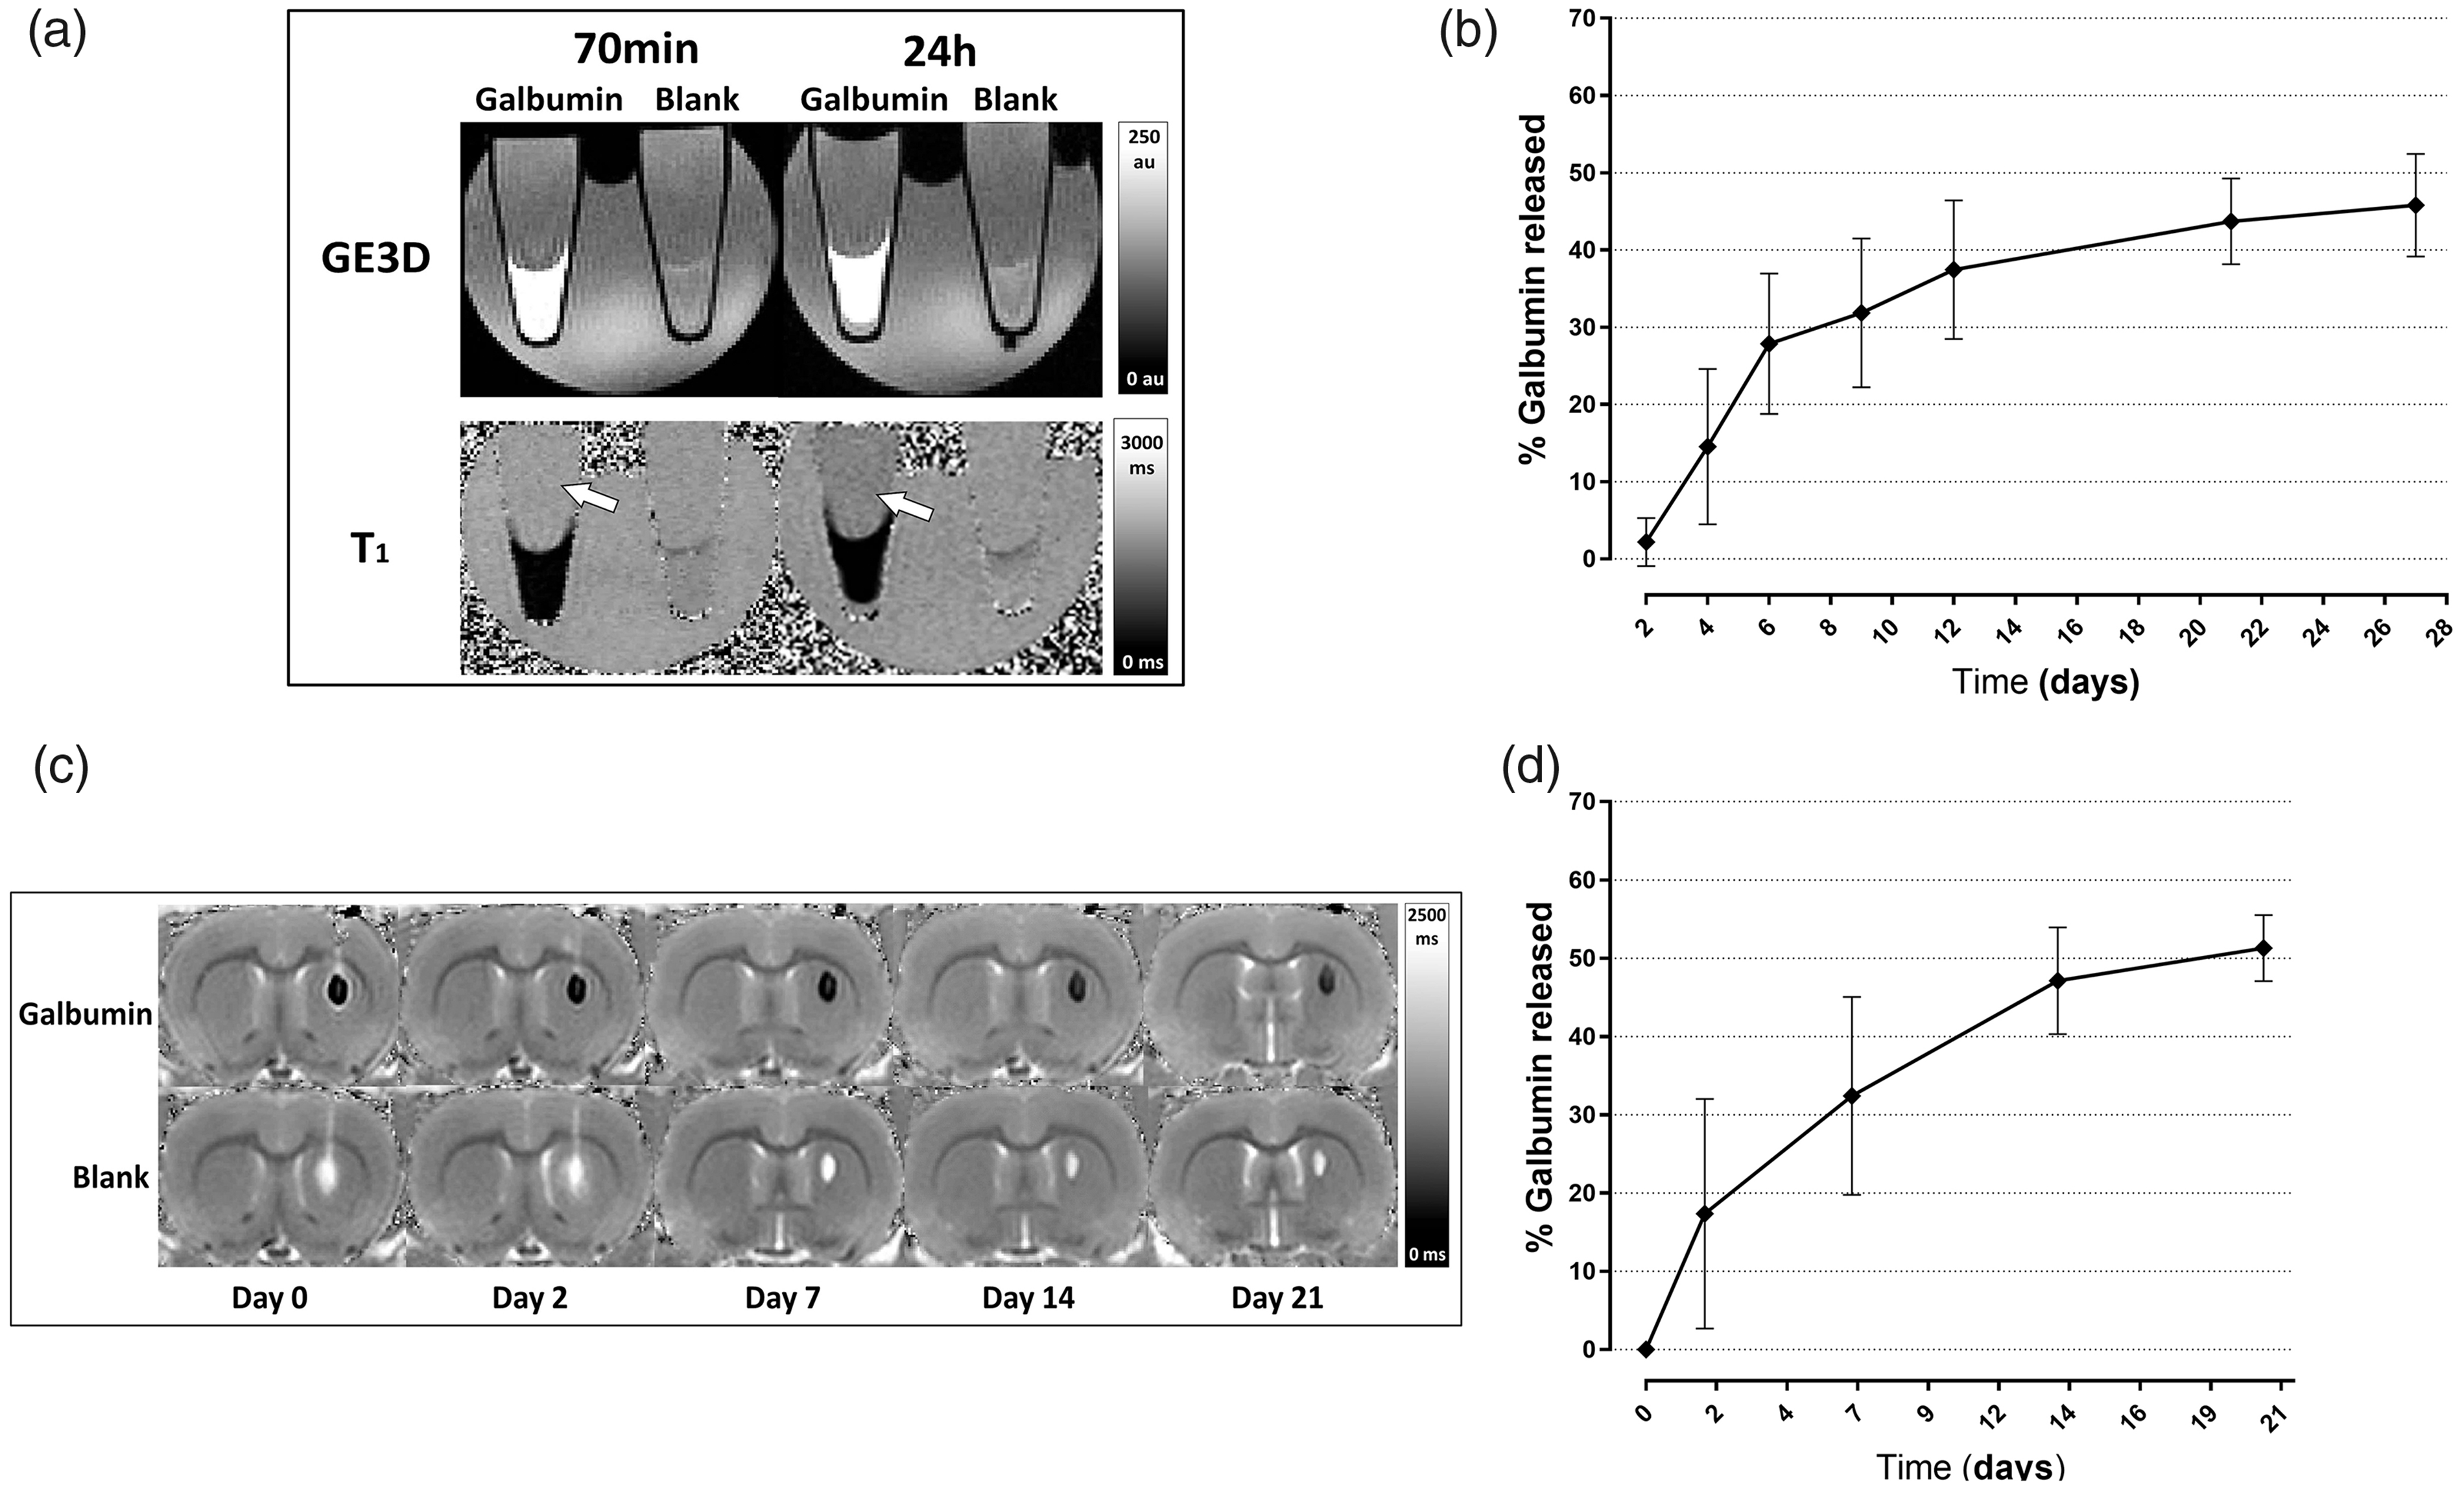
In the treatment study, stroke-induced sensorimotor impairments were not significantly different between the experimental groups prior to treatment (Figure 2). Partial recovery of sensorimotor function was observed in all experimental groups between 3 and 70 days post-stroke (Figure 2(a)). The extent of functional recovery was largest in the Gel VEGF + Ang1 group, in which sensorimotor deficit scores were significantly lower at all post-treatment time-points compared to pre-treatment at post-stroke day 13 (F(7,322) = 230.8 (P < 0.05); P < 0.05 vs. day 13). Moreover, at day 70 post-stroke, sensorimotor deficit scores of animals that were treated with VEGF + Ang1-loaded hydrogel were not significantly different from pre-stroke values.
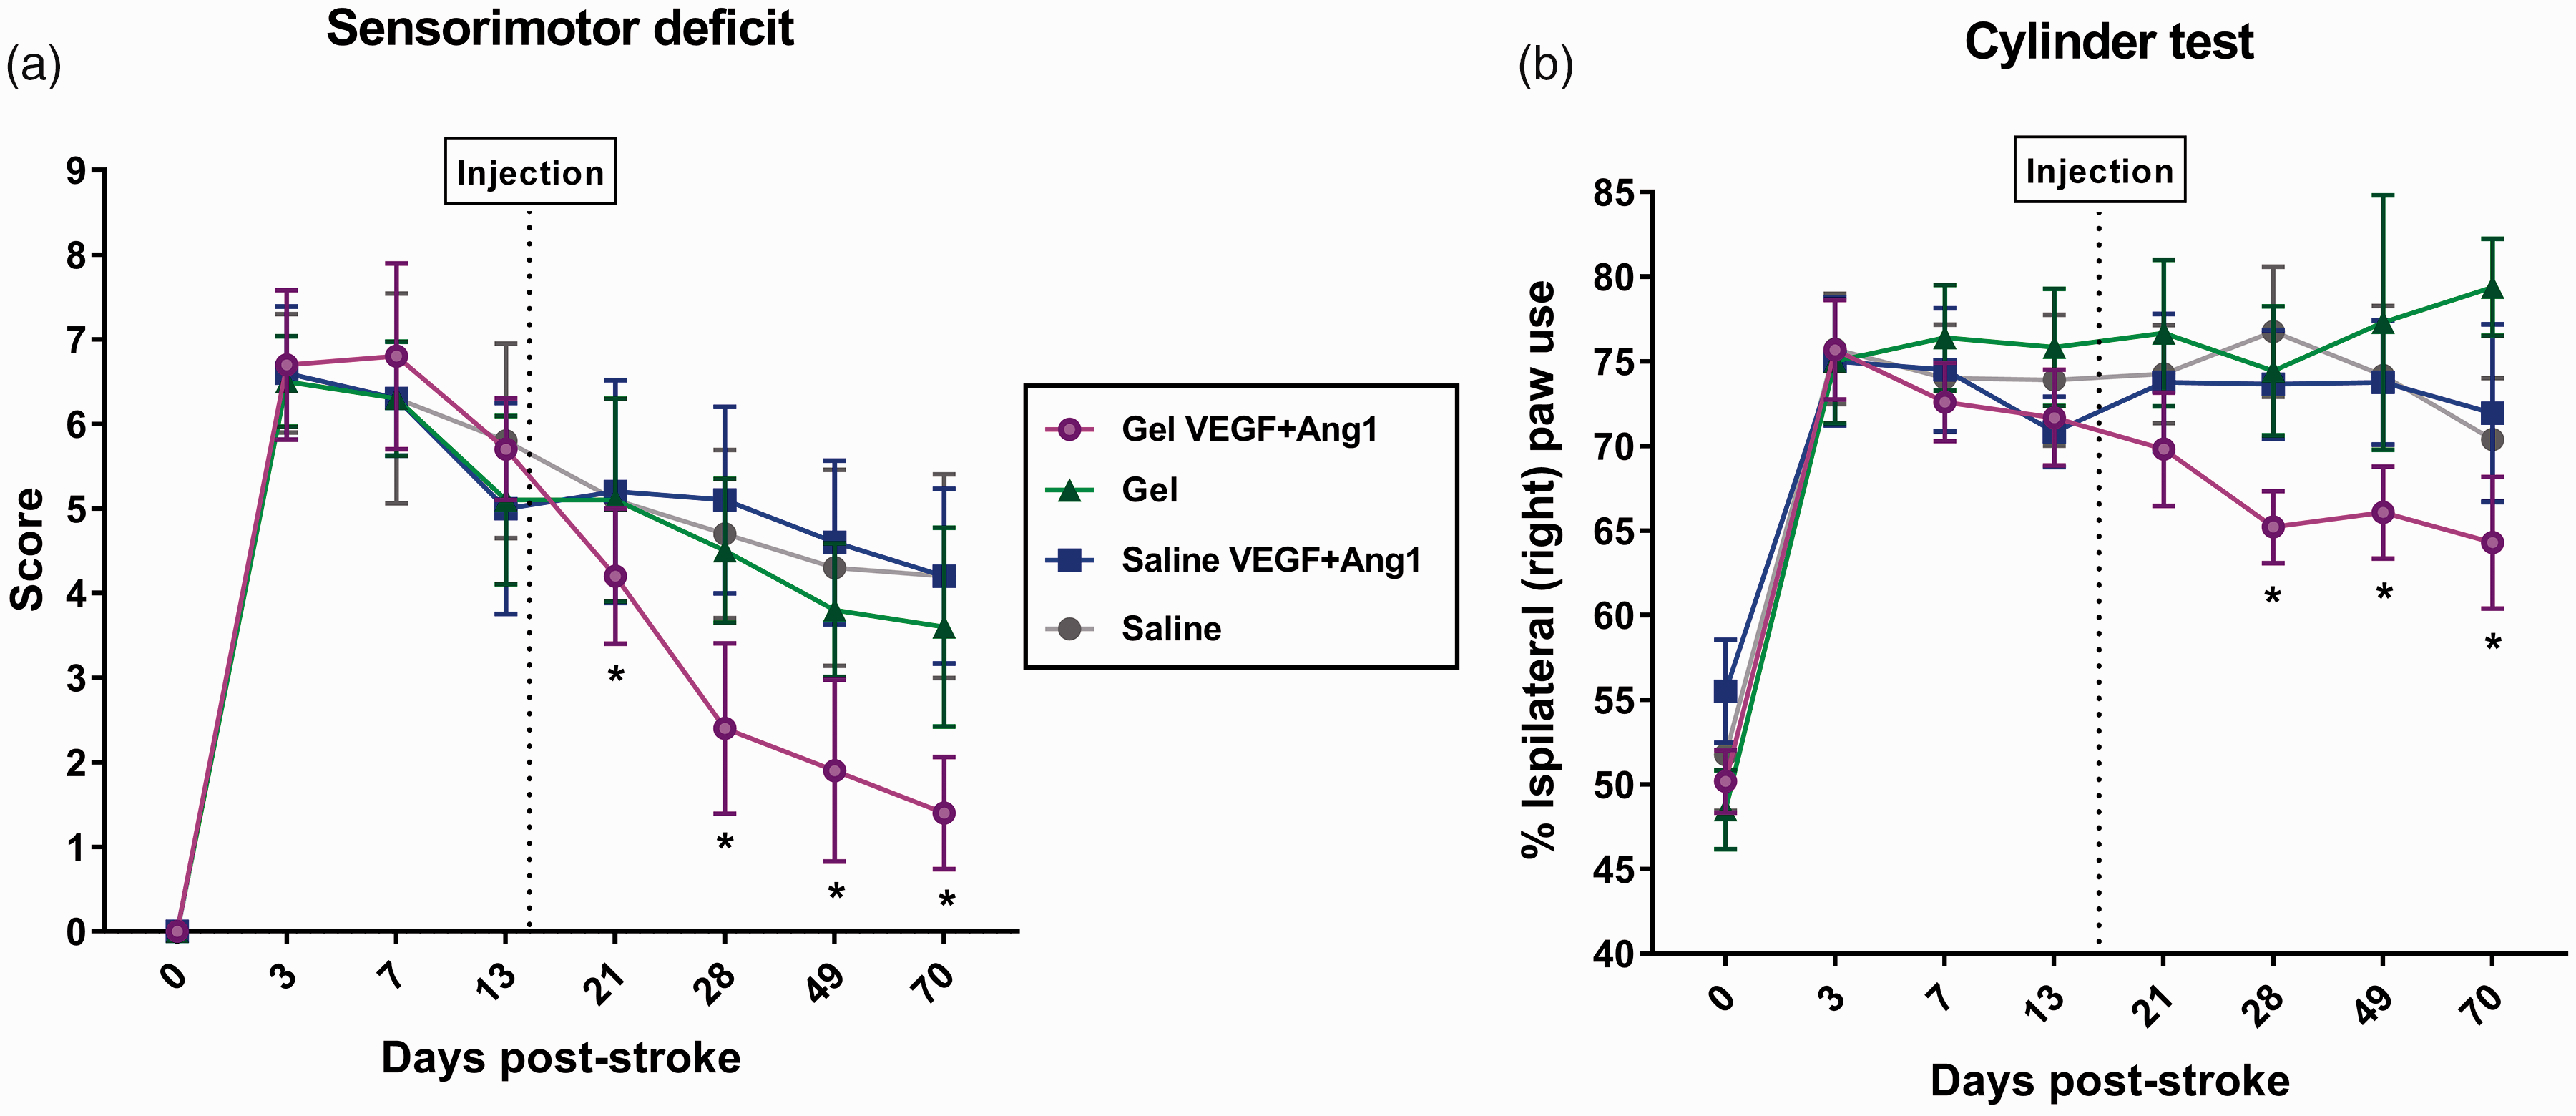
Sensorimotor function over time in post-stroke animals from different treatment groups. The sensorimotor deficit score gradually decreased between days 3 and 70 post-stroke. A statistically significant reduction in post-stroke sensorimotor deficit score after treatment was measured in the Gel VEGF + Ang1 group (a). Forelimb use asymmetry in exploratory rearing was increased after stroke (cylinder test). A significant decrease in forelimb use asymmetry was measured in the Gel VEGF + Ang1 group at post-stroke days 28, 49 and 70, as compared to pre-treatment at post-stroke day 13 (b). Data are shown as mean ± SD (Gel VEGF + Ang1 group: n = 14, control groups: n = 10). *P < 0.05 vs. pre-treatment at post-stroke day 13.
Asymmetry in forelimb use, as assessed with the cylinder test, was significantly increased after stroke and persisted until the end of the measurements at post-stroke day 70 (Figure 2(b)). However, beginning at 28 days post-stroke up to the final time-point at day 70, animals in the Gel VEGF + Ang1 group showed a statistically significant increase in contralateral, impaired, forelimb use compared to pre-treatment at post-stroke day 13 (F(7,280) = 30.63 (P < 0.05); P < 0.05 vs. day 13).
Stroke lesion and hydrogel implantation
Pre-treatment MRI scans were used to determine the lesion cavity size and location. The photothrombotic stroke created a consistent lesion in the sensorimotor cortex, characterized by elevated ADC and prolonged T2 at post-stroke day 13, with occasional involvement of the underlying white matter, but not extending into the striatum (Figure 3). There was no significant difference in lesion size across experimental groups prior to treatment: Gel VEGF + Ang1: 37.8 ± 6.1 µl; Gel: 37.7 ± 4.8 µl; Saline VEGF + Ang1: 37.8 ± 7.2 µl; Saline: 38.0 ± 5.6 µl.
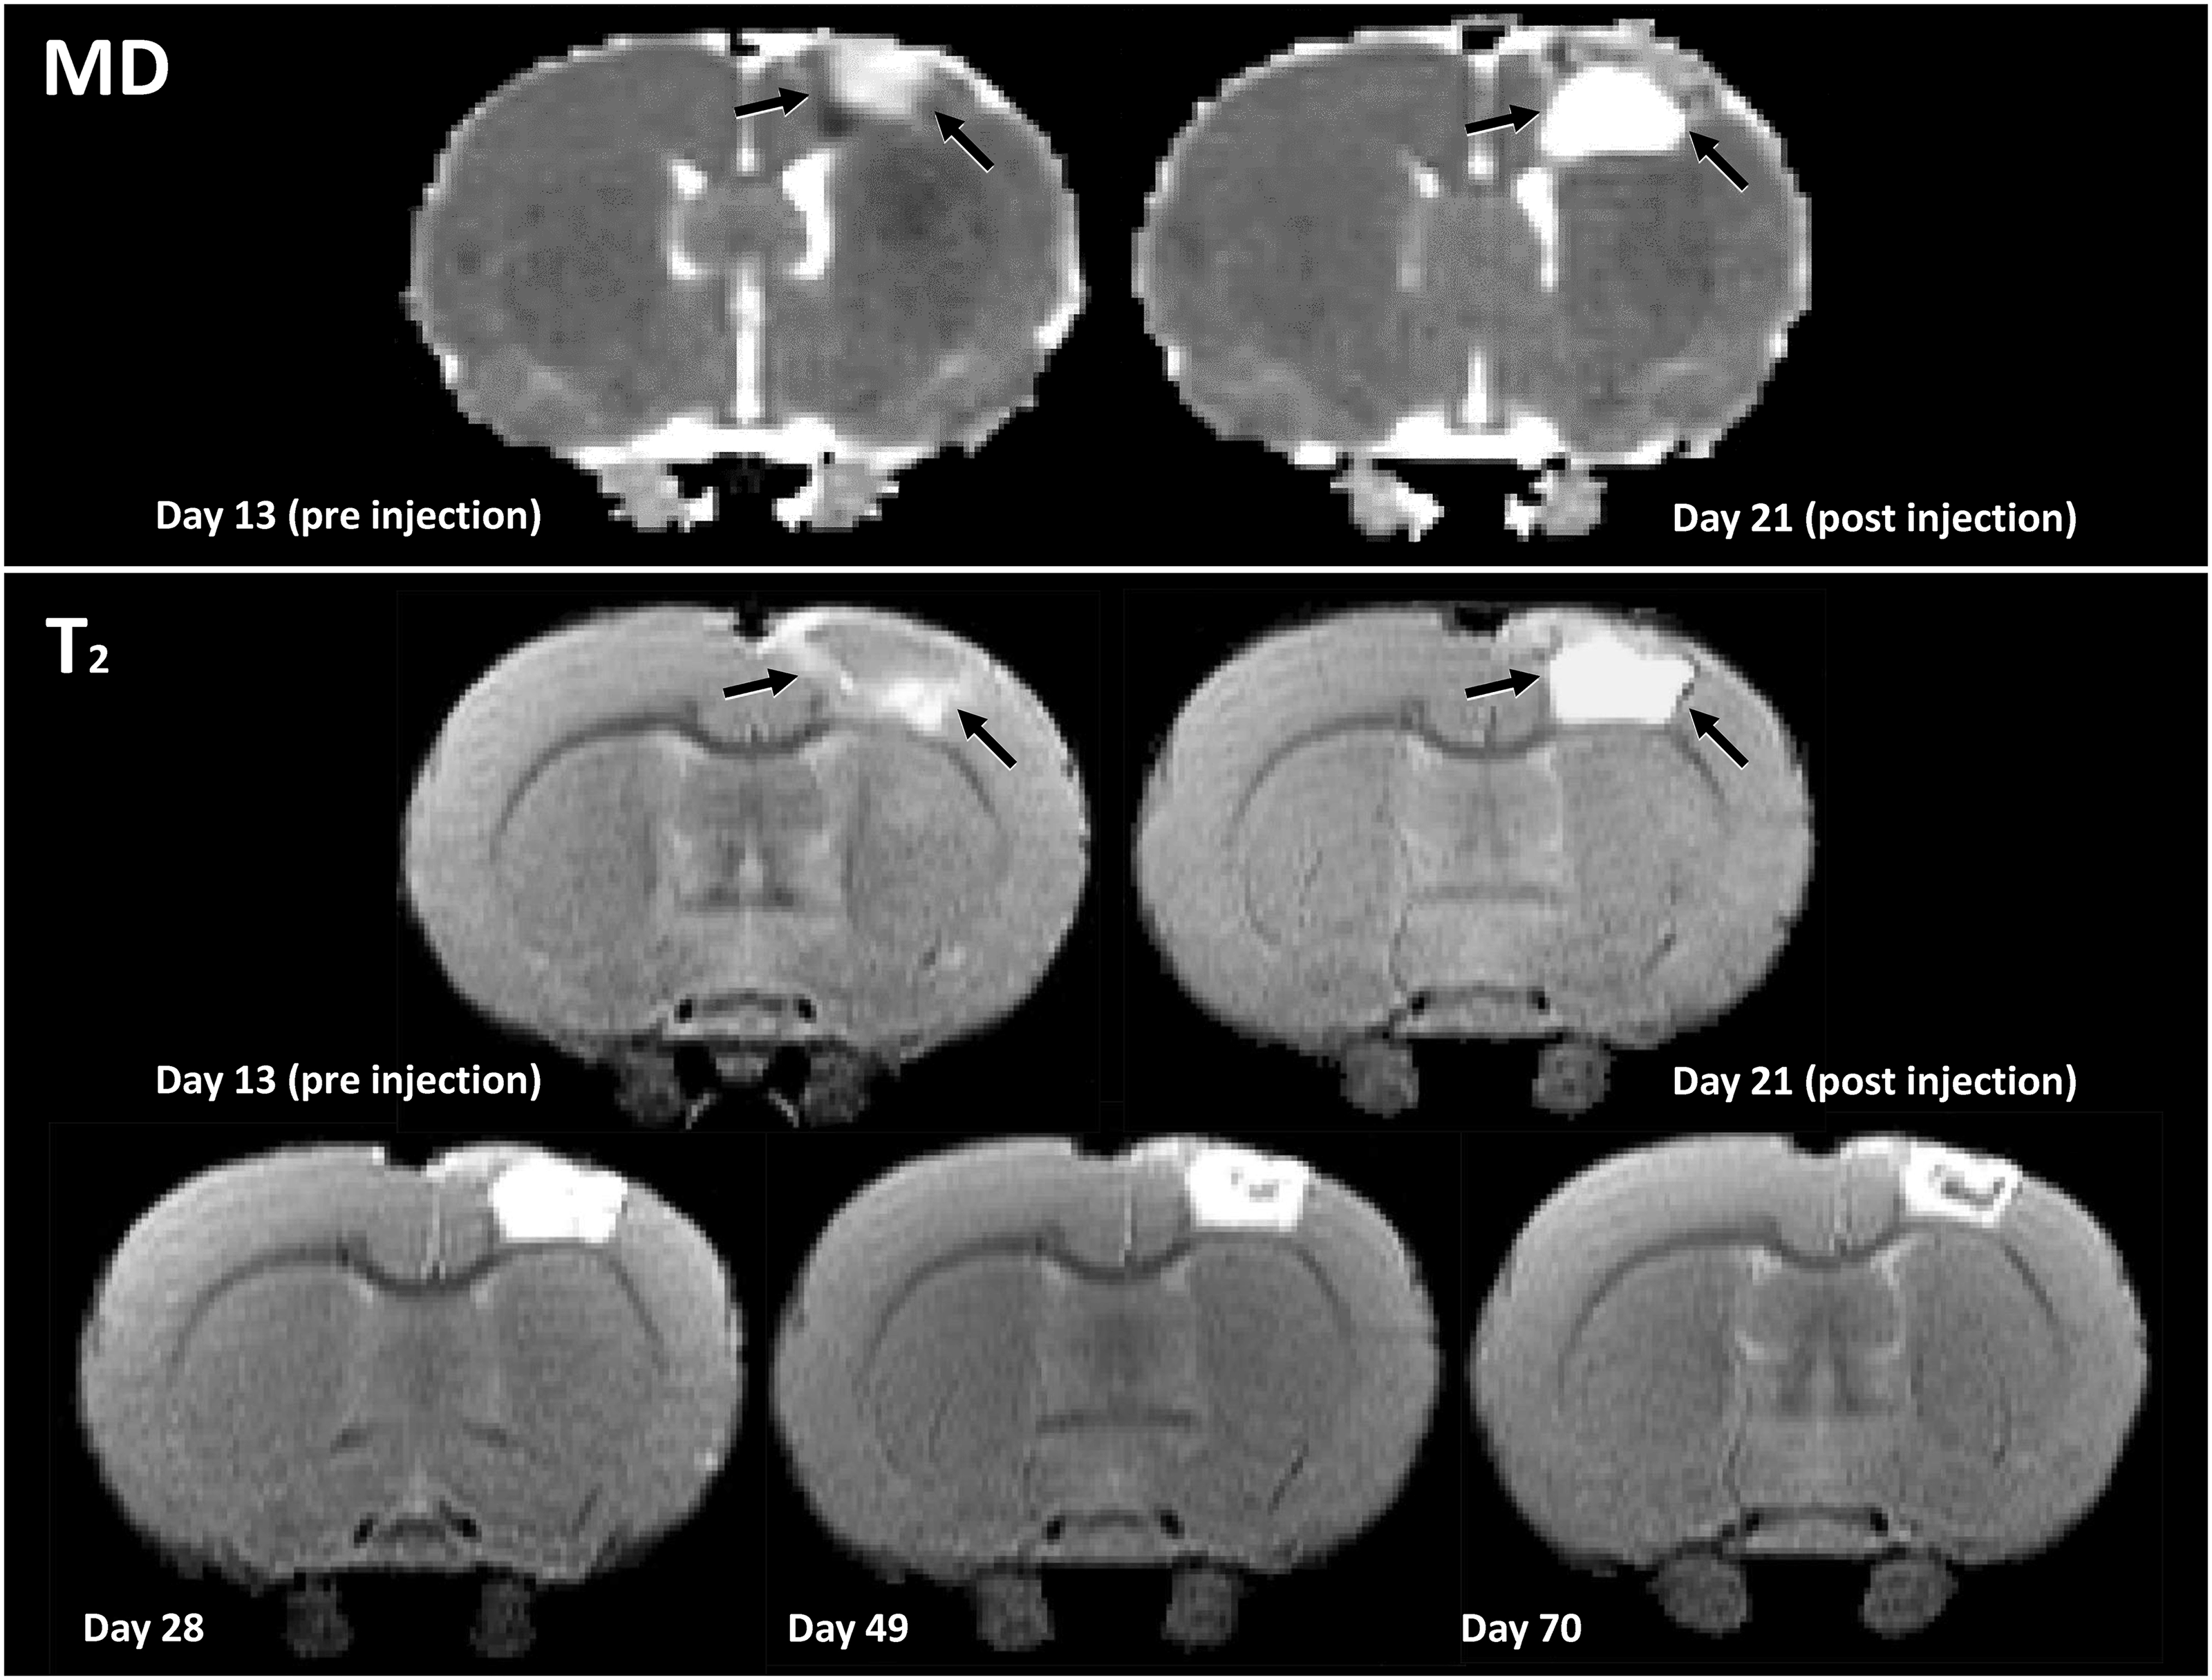
MRI of stroke lesion to guide hydrogel implantation. Representative apparent diffusion coefficient (ADC) and T2 maps of post-stroke coronal rat brain slices before and after hydrogel injection (at post-stroke day 14) in the lesion cavity. The stroke lesion was identified as a region with increased ADC and prolonged T2 in the right sensorimotor cortex. There was no significant difference in lesion size between experimental groups prior to injection: Gel VEGF + Ang1: 37.8 ± 6.1 µl; Gel: 37.7 ± 4.8 µl; Saline VEGF + Ang1: 37.8 ± 7.2 µl; Saline: 38.0 ± 5.6 µl. One week after injection of the hydrogel, T2 inside the lesion was further prolonged due to the hydrogel presence. Subsequent hydrogel degeneration and lesion remodeling were characterized by gradual T2 reduction.
After implantation into the MRI-detected lesion, the hydrogel presence was indicated by an intralesional volume with high ADC and long T2 (Figure 3). In the subsequent weeks after treatment, the gel-filled cavity gradually revealed a heterogeneous pattern with spatial variations in T2, suggesting changes within the implanted hydrogel or lesion. Functional outcome measurements showed no adverse events from the hydrogel injection.
Perilesional vascularization
MRI combined with intravenous USPIO administration was used for quantification of MVD in ROIs, which are displayed in Figure 4(a). An MVD map at 70 days after stroke is shown in Figure 4(b).
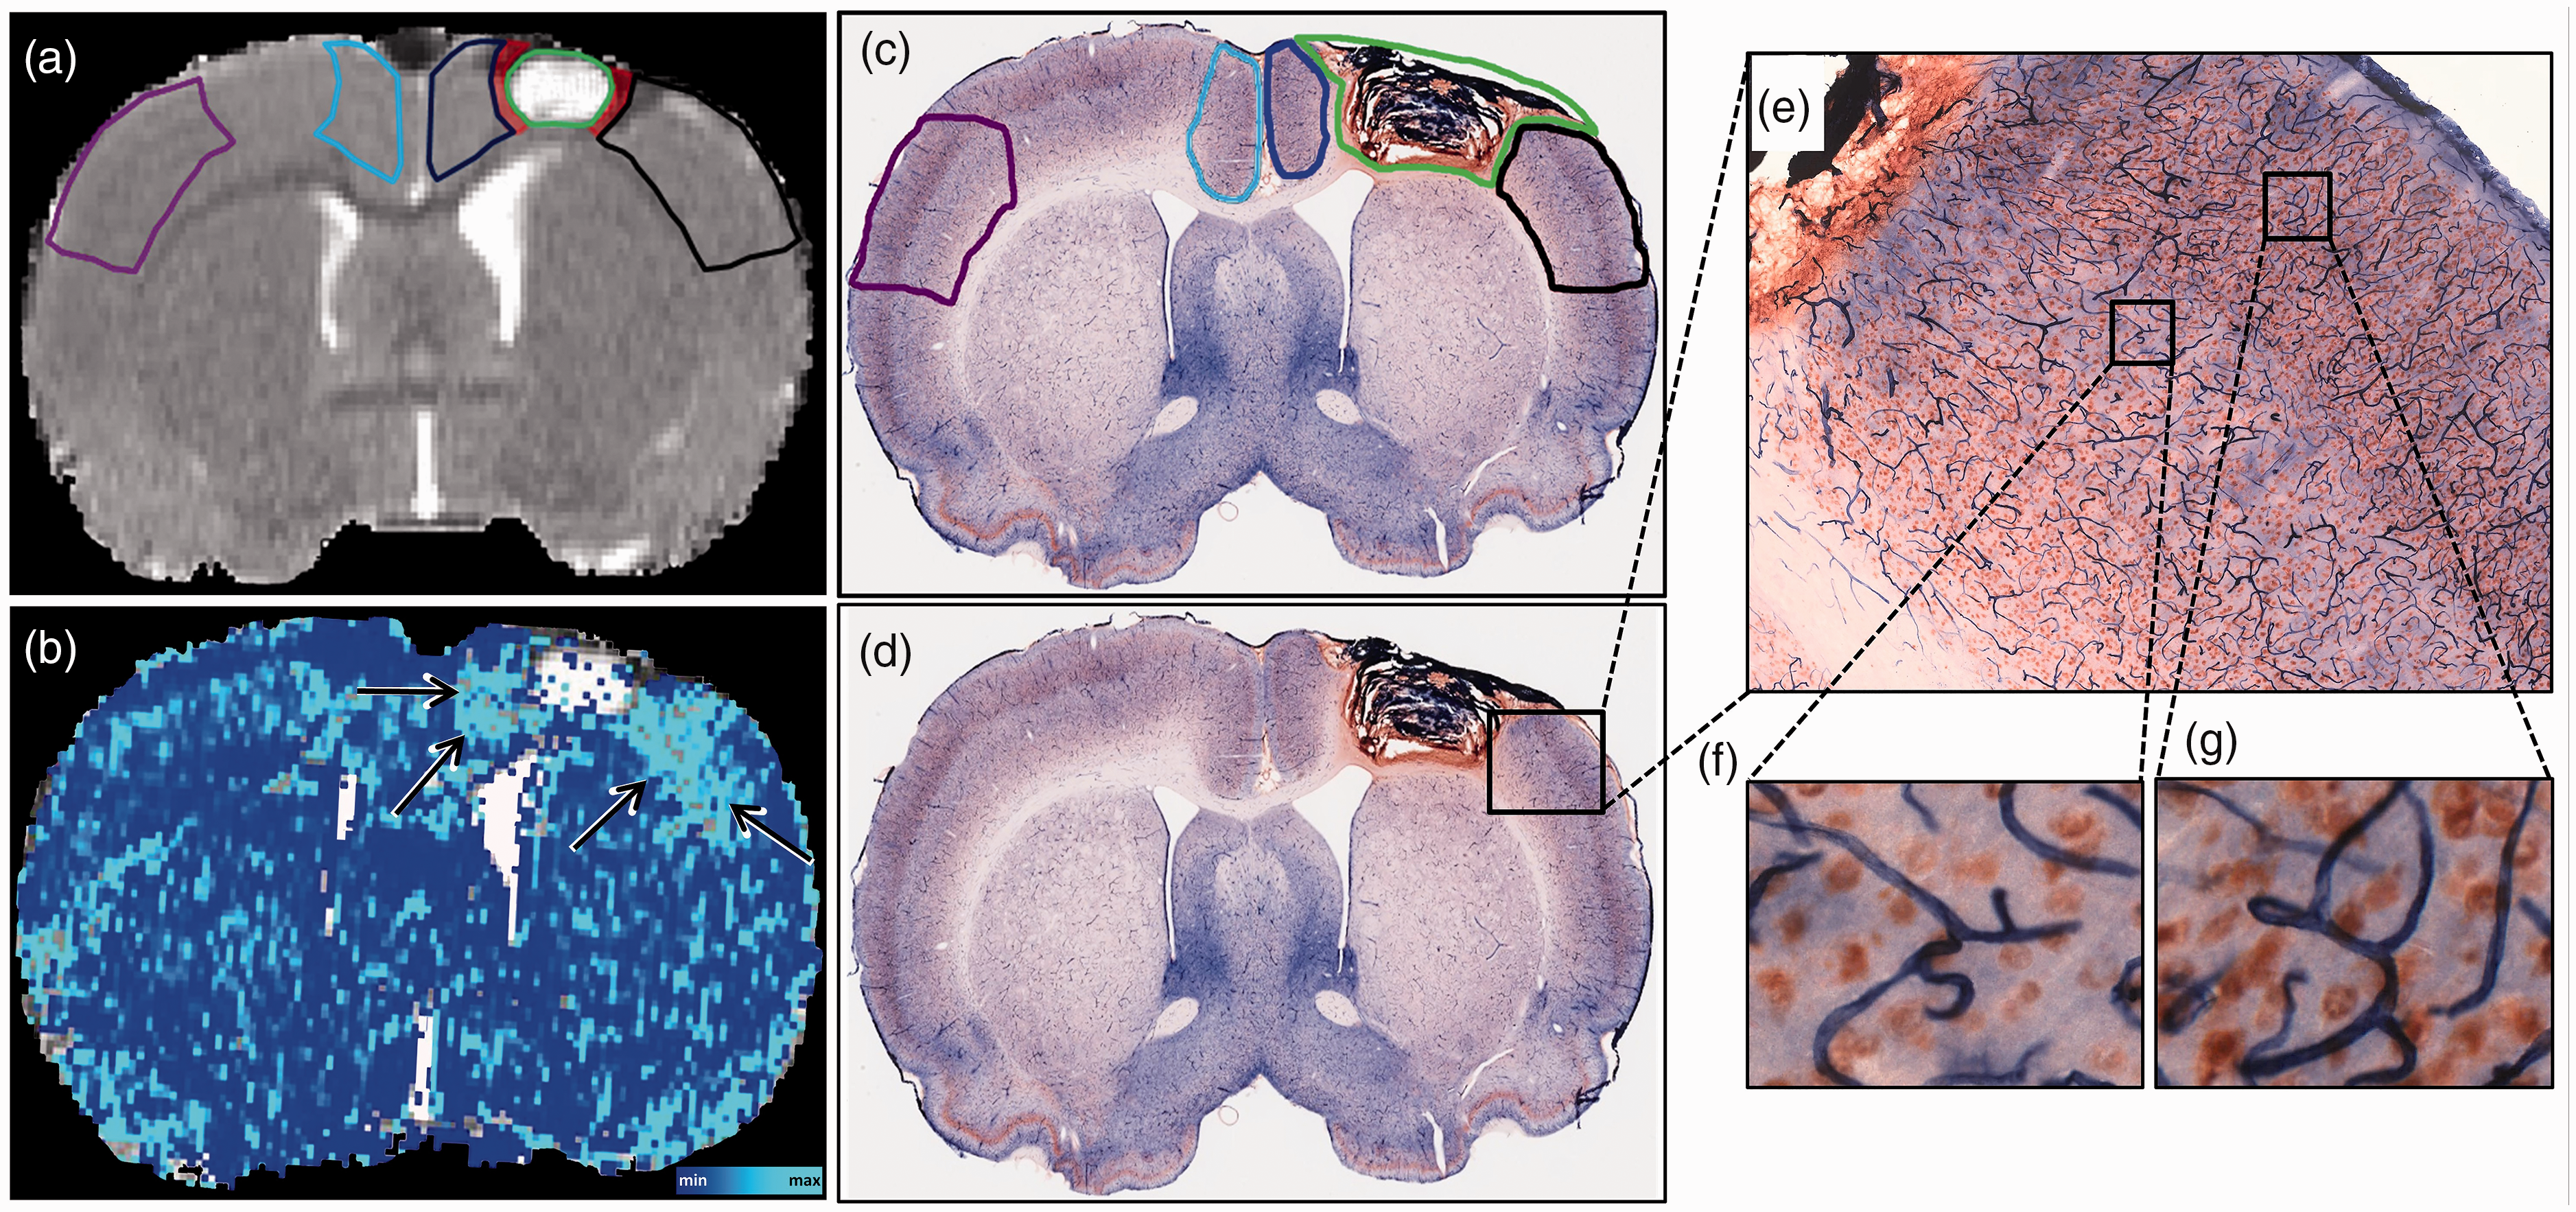
MRI- and histology-based assessment of microvessel density (MVD) and neuronal cell counts. T2 map of a coronal brain slice showing a lesion in the sensorimotor cortex injected with hydrogel, acquired at day 70 post-stroke, with an overlay of cortical regions-of-interests (ROIs) (a; Lateral perilesional ROI (black), medial perilesional ROI (dark blue) and homologous contralesional ROIs (purple and light blue, respectively)). Green color represents lesion outline. An exclusion zone of two voxels between the lesion border and the ROIs is shown in red. MRI-based quantitative MVD map (b), with arrows depicting regions with elevated MVD after treatment with VEGF + Ang1-loaded hydrogel. Alkaline-Phosphatase (navy blue) and NeuN (brown) double stained coronal sections of a rat brain injected with hydrogel (c and d). Cortical perilesional and contralesional ROIs (c; Lateral perilesional ROI (black), medial perilesional ROI (dark blue) and homologous contralesional ROIs (purple and light blue respectively)) used for stereological quantification. Higher magnification of Alkaline-Phosphatase-stained cerebral microvessels and NeuN-positive neuronal cells (e, f and g).
MRI at the first time-point, 13 days after stroke, revealed reduced perilesional MVD compared to contralateral, as expressed by a negative relative hemispheric MVD difference in the medial and lateral perilesional ROIs for all groups (Figure 5(a) and (b)). In the lateral perilesional ROI, this persisted over the next two weeks in all groups, except for the group treated with VEGF + Ang1-loaded hydrogel, in which the relative hemispheric MVD became positive. In the medial perilesional ROI, MVD increase in the Gel VEGF + Ang1 group became apparent at day 21 post-stroke, i.e. one week after injection, while in all control groups, the perilesional MVD remained reduced compared to contralateral. At the end of the follow-up period, the relative hemispheric MVD difference was maximally increased in the group that received the VEGF + Ang1-loaded hydrogel: 19 ± 11% and 31 ± 12% in the lateral and medial perilesional cortex, respectively (F(3,196) = 19.43 (P < 0.05) and F(3,195)=33.49 (P < 0.05); P < 0.05 vs. control groups), indicative of an increased number of perfused microvessels around the infarct site due to treatment.
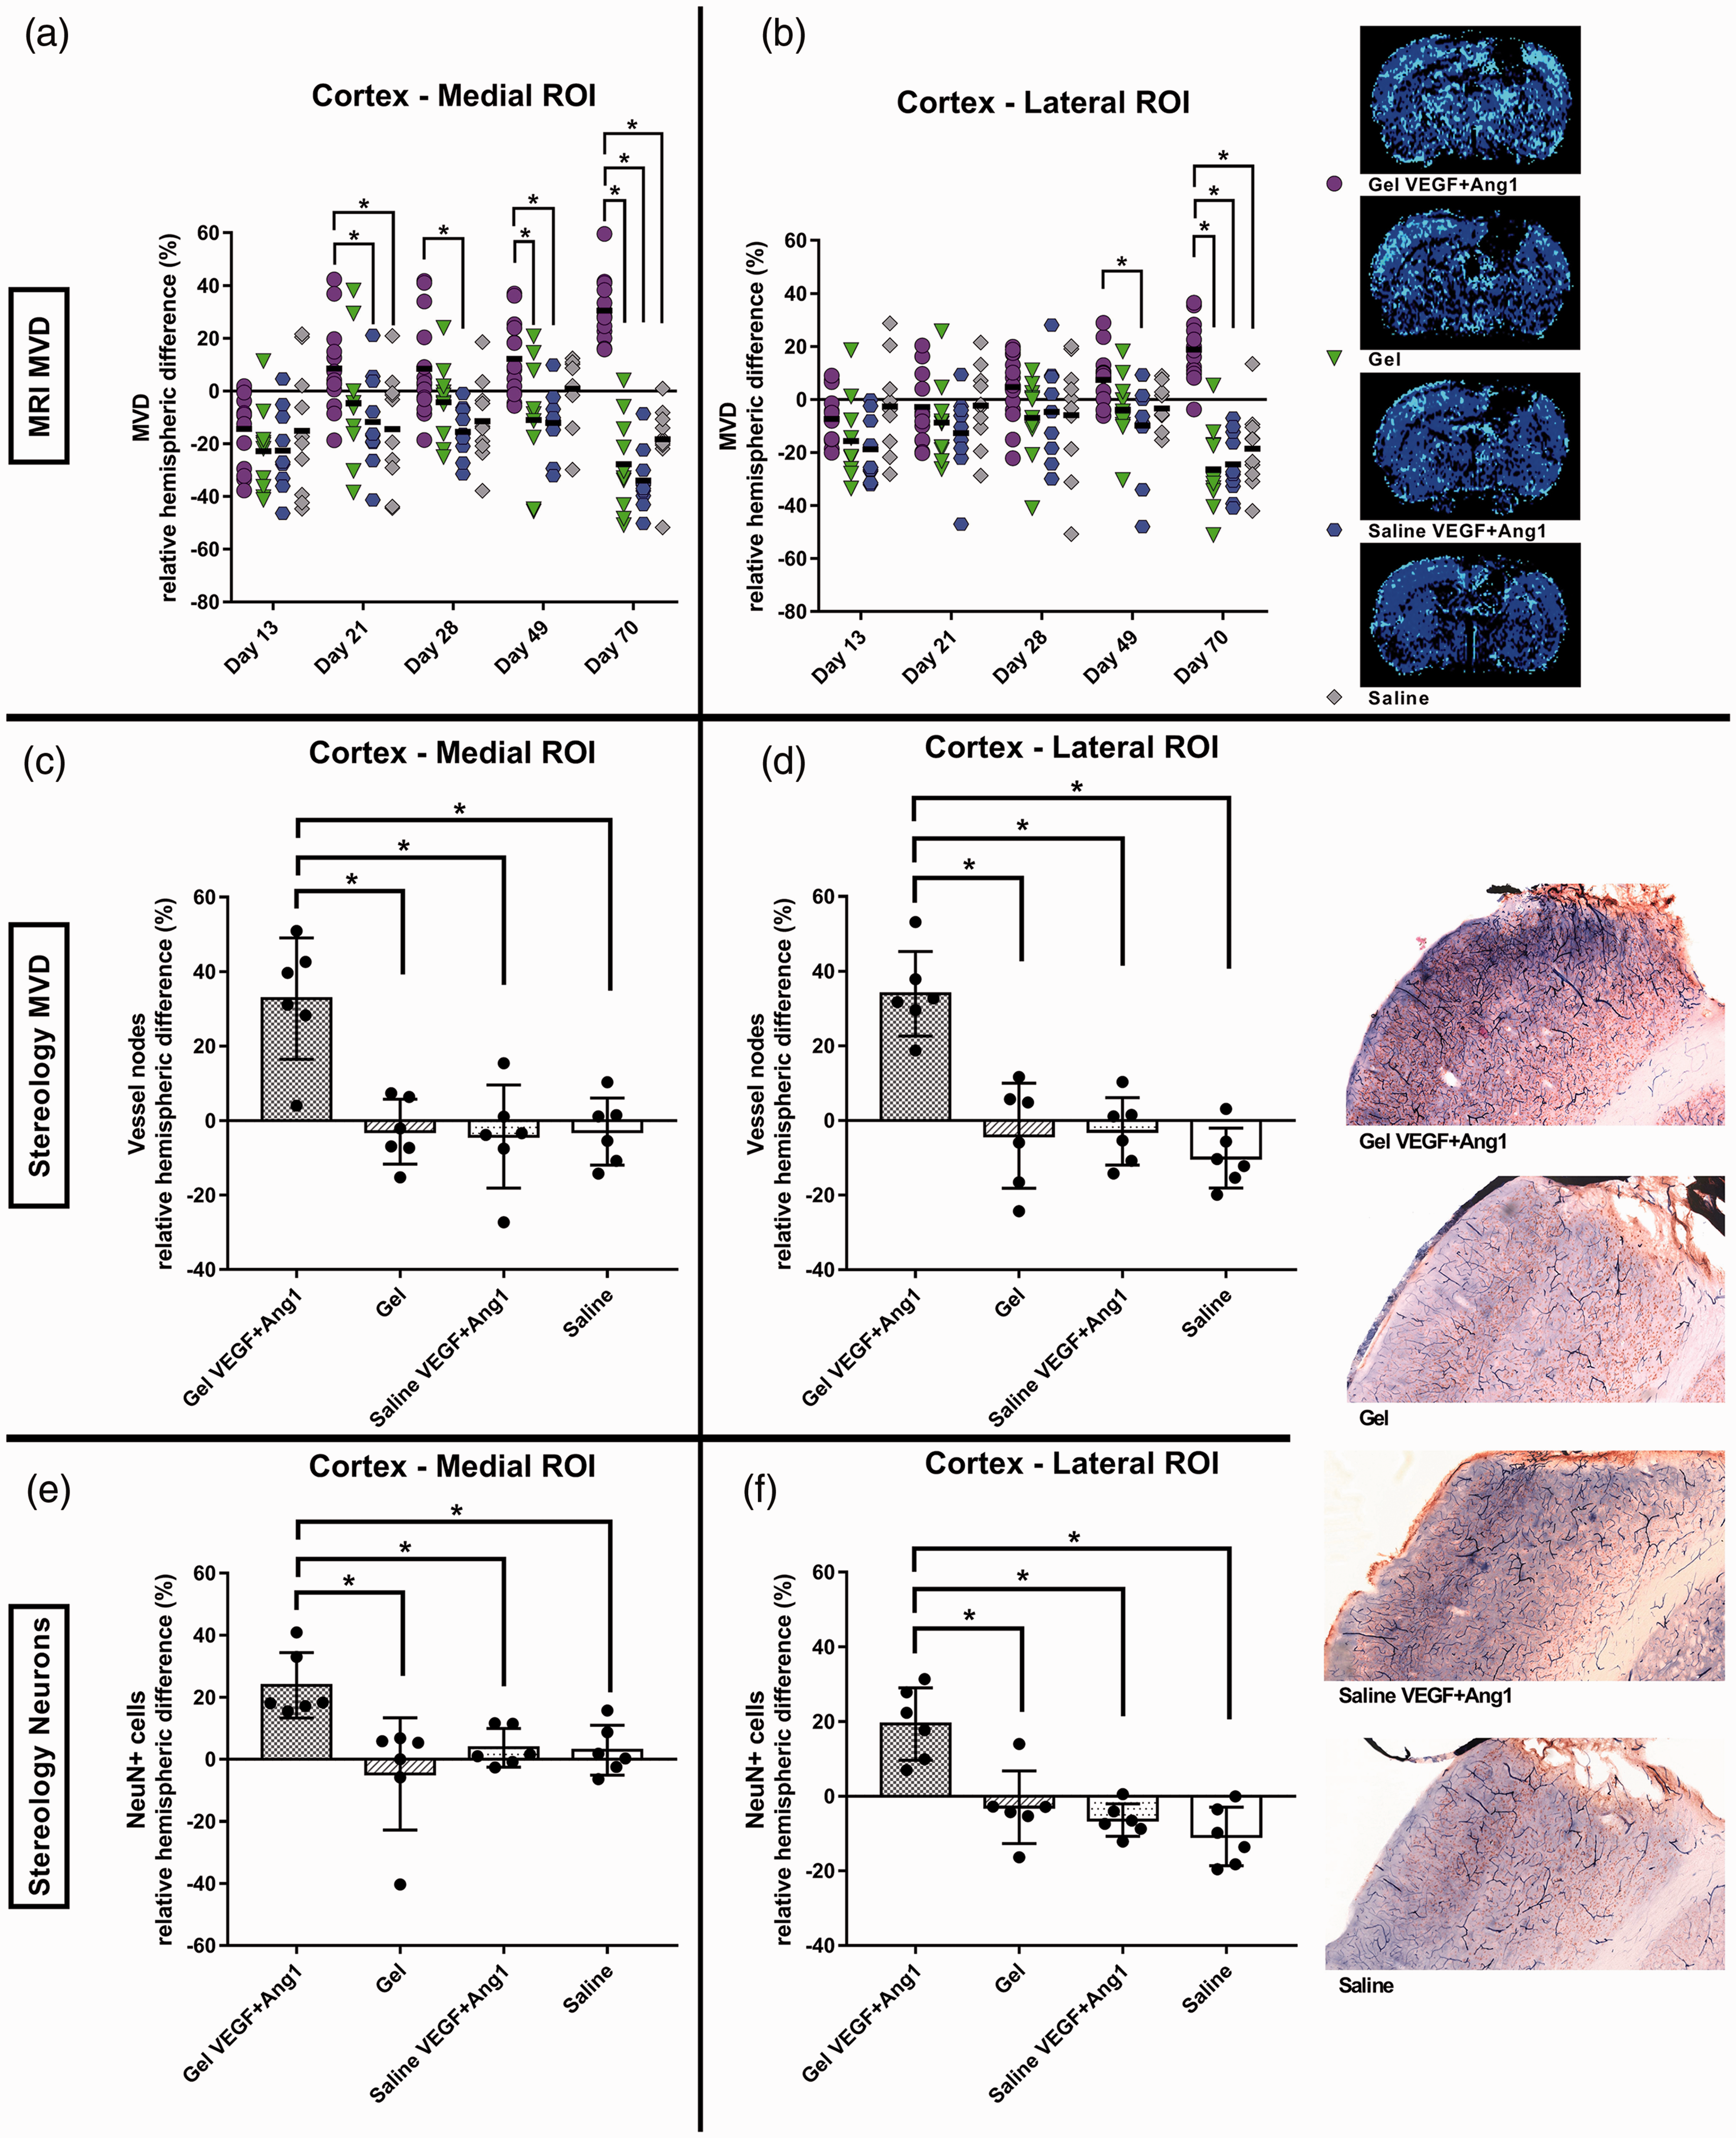
Relative difference in microvessel density (MVD) and NeuN-positive cell counts between peri- and contralesional brain tissue in different treatment groups. MRI-based assessment revealed decreased MVD in the perilesional cortex as compared to the contralesional cortex at post-stroke day 13 (a, b). Treatment with VEGF + Ang1-loaded hydrogel resulted in a significant MVD increase in the medial and lateral perilesional cortex starting from day 21 and day 49, respectively, up to day 70 (Gel VEGF + Ang1 group: n = 14, control groups, n = 10). A representative MVD map of a coronal brain slice encompassing the stroke lesion is shown for each experimental group. Histology-based stereology confirmed the significantly higher perilesional MVD in the Gel VEGF + Ang1 group at post-stroke day 70 (c, d). A higher number of NeuN-positive cells was counted in the perilesional ROIs as compared to contralesional in the Gel VEGF + Ang1 group, based on stereology at 70 days post-stroke (e, f). The relative hemispheric difference in neuronal cell counts in the Gel VEGF + Ang1 group was significantly higher than in the control groups (n = 6 per group). A representative lateral perilesional ROI of a rat brain coronal section with Alkaline-Phosphatase-stained cerebral microvessels and NeuN-positive cells is shown for each experimental group. Values are means ± SD. *P < 0.05 compared with control group(s).
Overlays of the ROIs on histological sections at 70 days post-stroke are shown in Figure 4(c). Illustrative double immunostaining of neurons and vessels, with anti-NeuN and Alkaline Phosphatase, respectively, in lateral perilesional tissue is shown in Figure 4(e) to (g).
The relative hemispheric difference of vessel nodes was significantly increased in both peri-lesional ROIs, medial and lateral, in the animals treated with VEGF + Ang1-loaded hydrogel as compared to animals in the control groups (F(3,20) = 20.49 (P < 0.05) and F(3,20) = 12.81 (P < 0.05) for the medial and lateral perilesional cortex respectively; P < 0.05 vs. control groups, Gundersen (m = 1) CE < 0.1; Figure 5(c) and (d)). Furthermore, animals treated with VEGF + Ang1-containing hydrogel demonstrated significantly greater relative hemispheric difference in the number of NeuN-positive neurons in the medial and lateral perilesional ROIs as compared to the control groups (F(3,20) = 16.05 (P < 0.05) and F(3,20) = 6.576 (P < 0.05) for the medial and lateral perilesional cortex respectively; P < 0.05 vs. control groups, Gundersen (m = 1) CE < 0.07; Figure 5(e) and (f)).
Discussion
The present study demonstrates that implantation of a hydrogel containing VEGF and Ang1 into the lesion cavity chronically after experimental stroke, promotes perilesional vascularization and neuronal survival, and improves recovery of sensorimotor function. In vitro and in vivo MRI measurements demonstrated sustained protein release from the hydrogel for weeks. Thus, sustained supply of VEGF and Ang1 (assuming similar release patterns to Galbumin) can stimulate (re)vascularization and (consequent) neuronal sparing and/or neurogenesis in the perilesional cortex, ultimately promoting functional recovery. Our study shows that this can be achieved with an injectable hydrogel that can slowly release therapeutic compounds from inside the lesion.
In situ polymerizing hydrogel carrier system for growth factor delivery
Even though VEGF has already shown promise as a therapeutic agent for ischemic stroke, its short blood half-life (approximately three minutes in circulation) 57 and poor BBB penetration when administered systemically, are prominent obstacles. 14 Intracerebral bolus injections can circumvent the BBB, but this is not a preferred method, as it would require consecutive invasive injections to maintain therapeutic levels for prolonged periods of time. In the present study, a single intralesional injection of VEGF and Ang1 at 2 weeks post-stroke did not result in significant changes in vascular and neuronal density, nor in significant improvement of functional recovery.
Our study shows that implantable polymer scaffolds offer a means for slow and sustained delivery of therapeutic molecules at the site of cerebral ischemic damage. A peptide hydrogel administered as a liquid through a microinjection needle, polymerizing in situ after filling the lesion void, creates a biocompatible medium with similar mechanical properties as the extracellular matrix, which could aid regeneration of nervous tissue. 58 Such an approach allows injection of relatively large volumes and targets the actively reorganizing peri-lesional tissue in need of support, without affecting healthy brain. Therefore, intracranial delivery into the necrotic cavity was selected as the most favorable injection site for our study. In the rat photothrombotic stroke model, the lesion undergoes necrotic transformation towards day 7.59,60 Accordingly, the treatment could be delivered into the necrotic cavity at two weeks post-stroke, when edema has mostly subsided, 61 and tissue plasticity has been instigated. 62
To assess the drug delivery potential of the peptide hydrogel, we first measured gel properties and the in vitro and in vivo release of a model protein labeled with MR contrast agent. MRI measurements showed that the implanted hydrogel was uniformly integrated inside the lesion cavity. Following injection in the brain (or activation with PBS in the in vitro study), the peptide hydrogel decreased in volume, precluding any potentially negative mechanical effect on surrounding brain tissue, in contrast to other types of hydrogels that swell after injection. 63 Shrinkage of the peptide hydrogel under physiological conditions can be explained by the peptide nanofiber nature, and particularly the hydrophobicity of the RADA16 gel amino acids. 64
The peptide hydrogel displayed favorably slow (e.g., no initial burst release) and prolonged protein delivery. It retained about two-thirds of its initial load until the end of the first week after intracerebral injection, while at the end of the follow-up, i.e. almost four weeks after injection, only around 50% of the original Galbumin content had been released. This slow diffusion out of the hydrogel matrix could be explained by electrostatic and hydrophobic interactions between the loaded protein and the peptide nanofibers (protein–protein interactions). 65 We presume a similar kind of release for VEGF and Ang1, which have comparable sizes to Galbumin. To quantify the specific releases of VEGF and Ang1, future studies could include in vivo microdialysis procedures.
Interplay between vascular and neuronal changes after stroke
Brain plasticity in relation to post-stroke recovery involves a tight interaction between vascular, neuronal, glial, and extracellular matrix reorganization.13,66–72 VEGF and its receptors are present in endothelial, glial, and neuronal tissue throughout the brain, 15 and are involved in neurite outgrowth in cerebral cortical neurons. 73 After transient stroke, neuronally derived VEGF levels are upregulated in the ischemic core and penumbra regions, possibly participating in endogenous neuroprotective events. 74 In transgenic mice overexpressing VEGF, increased neurogenesis has been found in association with reduced infarct volume and improved motor function after permanent focal cerebral ischemia. 75 Furthermore, several lines of evidence indicate a substantial role of VEGF in tissue repair and recovery after stroke,76–81 with a recent study demonstrating improved post-stroke sensorimotor and cognitive recovery through enhanced angiogenesis via the disinhibition of VEGFA and VEGFR2 protein expression. 82 While stimulation of angiogenesis acutely after stroke may stabilize brain perfusion and promote neuronal survival within the infarct, delayed angiogenesis later during recovery could support plasticity and functional reorganization.19,20
In addition to VEGF, Ang1 may play an important role in neuroprotection and neurogenesis following stroke. Reports show that post-stroke induction of Ang1 in the peri-lesional neurovascular niche may stimulate angiogenesis, neuroblast migration, and vessel remodeling. 83 Thus, the combination of VEGF and Ang1 could reinforce the process of revascularization. 84 Their complementary angiogenic relationship has already been addressed in gene therapy approaches for cardiovascular diseases and ischemic stroke,85,86 and applied in vitro in biomaterial delivery systems.87,88 In the present study, the injection of a hydrogel containing VEGF and Ang1, which facilitated prolonged slow release of these growth factors, promoted long-term vascularization and neuronal survival in the ipsilesional hemisphere. Beginning from 1 week after injection, our MRI measurements revealed a gradual increase in MVD in the medial perilesional tissue, and at later time-points also in the lateral perilesional cortex, suggestive of therapeutically enhanced angiogenesis. Moreover, post mortem stereology revealed stable vessels at 56 days after hydrogel injection, demonstrating that delivery of VEGF and Ang1 through a hydrogel resulted in lasting mature vessel formation. This was accompanied by an increased number of neurons in the same perilesional areas. Speculatively, a vascular niche, supported by VEGF and Ang1 supply, could have created favorable conditions for the prevention of neuronal degeneration and/or the proliferation and differentiation of neuronal precursors. 89 In fact, because of neurovascular coupling, changes in vascularity have been linked to local gain or loss of neurons. 20 Accordingly, an overall increase in cortical neuronal sparing after treatment with hydrogel containing VEGF and Ang1 could explain the observed improvements in sensorimotor function. While we focused on assessing motor recovery based on lesion location, these therapeutic effects may be pleiotropic. Thus, future studies should include evaluation of other functions, such as cognition. Future directions could also include assessment of the contribution of the immune system to post-stroke neurovascular remodeling and functional recovery, as suggested in prior studies. 90
MRI guidance of hydrogel-based treatment
The execution and monitoring of intracranial treatment with biomaterials may be optimized when the location and fate of the implanted material can be detected with imaging techniques. In our experimental setup, MRI was effective in guiding the delivery of the hydrogel and visualizing its subsequent status after injection into the lesion cavity. Non-invasive visualization and quantification of drug release properties were carried out by employing a model protein labeled with contrast agent. Furthermore, contrast-enhanced MRI enabled non-invasive serial monitoring of the treatment effect on perilesional (re)vascularization. The use of imaging techniques, such as MRI, which are available in experimental and clinical settings, bridge the gap between pre-clinical and clinical research. This can aid in the translational development of candidate drugs and drug delivery vehicles for improved treatment of stroke and other brain disorders.
Conclusion
Ischemic stroke causes complex, multicellular brain injury with limited ability for self-repair. Injection of bio-compatible and -degradable hydrogels loaded with therapeutic drugs provides a potent treatment approach for neurorepair, in which drug delivery can be sustained for prolonged periods of time. The ischemic lesion cavity is a fibrotic region devoid of neurons and with sparse, disordered vasculature. Our results show that gradual and long-term release of VEGF and Ang1 from an intralesionally injected hydrogel reinforces post-stroke vascularization and neuronal survival in the perilesional region, ultimately resulting in improved functional outcome. This therapeutic strategy, which can be non-invasively guided and monitored with MRI, awaits testing in clinical settings.
Supplemental Material
sj-pdf-1-jcb-10.1177_0271678X211069927 - Supplemental material for Prolonged release of VEGF and Ang1 from intralesionally implanted hydrogel promotes perilesional vascularization and functional recovery after experimental ischemic stroke
Supplemental material, sj-pdf-1-jcb-10.1177_0271678X211069927 for Prolonged release of VEGF and Ang1 from intralesionally implanted hydrogel promotes perilesional vascularization and functional recovery after experimental ischemic stroke by Pavel Yanev, Geralda AF van Tilborg, Annette van der Toorn, Xiangmei Kong, Ann M Stowe and Rick M Dijkhuizen in Journal of Cerebral Blood Flow & Metabolism
Supplemental Material
sj-pdf-2-jcb-10.1177_0271678X211069927 - Supplemental material for Prolonged release of VEGF and Ang1 from intralesionally implanted hydrogel promotes perilesional vascularization and functional recovery after experimental ischemic stroke
Supplemental material, sj-pdf-2-jcb-10.1177_0271678X211069927 for Prolonged release of VEGF and Ang1 from intralesionally implanted hydrogel promotes perilesional vascularization and functional recovery after experimental ischemic stroke by Pavel Yanev, Geralda AF van Tilborg, Annette van der Toorn, Xiangmei Kong, Ann M Stowe and Rick M Dijkhuizen in Journal of Cerebral Blood Flow & Metabolism
Supplemental Material
sj-pdf-3-jcb-10.1177_0271678X211069927 - Supplemental material for Prolonged release of VEGF and Ang1 from intralesionally implanted hydrogel promotes perilesional vascularization and functional recovery after experimental ischemic stroke
Supplemental material, sj-pdf-3-jcb-10.1177_0271678X211069927 for Prolonged release of VEGF and Ang1 from intralesionally implanted hydrogel promotes perilesional vascularization and functional recovery after experimental ischemic stroke by Pavel Yanev, Geralda AF van Tilborg, Annette van der Toorn, Xiangmei Kong, Ann M Stowe and Rick M Dijkhuizen in Journal of Cerebral Blood Flow & Metabolism
Footnotes
Funding
The author(s) disclosed receipt of the following financial support for the research, authorship, and/or publication of this article: This work was supported by the Netherlands Organization for Scientific Research (VICI 016.130.662 to R.M.D.), Texas Institute for Brain Injury and Repair (TIBIR to A.M.S.), and The Beatrice Menne Haggerty Center (UTSW to A.M.S.).
Acknowledgments
The authors thank Erik Plautz, Ph.D. and Laura Doss, M.S. for input and feedback on the evaluation of the behavioral data.
Declaration of conflicting interests
The author(s) declared no potential conflicts of interest with respect to the research, authorship, and/or publication of this article.
Authors’ contributions
P.Y., R.D., A.S and G.T. conceived and planned the experiments. P.Y. carried out the experiments. X.K. contributed to histological analysis. P.Y., R.D., G.T., A.T. and A.S. contributed to the interpretation of the results. P.Y. took the lead in writing the manuscript. All authors provided critical feedback and helped shape the manuscript. All authors revised and approved the final submission.
Supplemental material
Supplemental material for this article is available online.
References
Supplementary Material
Please find the following supplemental material available below.
For Open Access articles published under a Creative Commons License, all supplemental material carries the same license as the article it is associated with.
For non-Open Access articles published, all supplemental material carries a non-exclusive license, and permission requests for re-use of supplemental material or any part of supplemental material shall be sent directly to the copyright owner as specified in the copyright notice associated with the article.