
Abstract
This study aimed to characterize brain activation and perfusion early after stroke within cortical regions that would later change activation during recovery. Patients were studied serially after stroke (mean t1, = 16 days after stroke, t2 = 3.5 months later) using perfusion-weighted imaging and functional magnetic resonance imaging during finger movement. Controls (n = 7) showed no significant change in regional activation volumes over time. Among stroke patients (n = 8), however, recovery was accompanied by several patterns of functional magnetic resonance imaging change, with increased activation volumes over time in five patients and decreased in two. Most regions increasing activation over time were in the stroke hemisphere. Of the five patients showing increased activation over time, specific activation foci enlarged at t2 were already activated at t1 in four patients, and at least one focus growing from t1 to t2 was in a different arterial distribution from the infarct in all five patients. Perfusion of sensorimotor cortex at t1 was generally not reduced in the stroke hemisphere (94% of noninfarcted hemisphere). Improved clinical outcome was related to increased activation within sensory cortices of both brain sides, including bilateral secondary somatosensory areas. Early after stroke, cortical activation that will later increase in parallel with recovery is often already identifiable, can be remote from the vascular territory of the infarct, and is not likely hindered by reduced perfusion. The findings may be useful for restorative interventions introduced during the weeks after a stroke.
Most patients show clinical improvement in the weeks to months after a stroke. Human brain mapping studies performed serially during this recovery period have described increased activity in a number of regions that are structurally intact. Many of these changes arise in parallel with behavioral improvement and thus may reflect restorative events. Such events can be amplified by a range of exogenous treatments (Chen et al., 2001; Kawamata et al., 1997; Ren et al., 2000; Stroemer et al., 1998) and are therefore logical targets for human studies.
The current study performed serial functional magnetic resonance imaging (fMRI) evaluation of stroke patients to address two questions regarding brain function early after stroke. Functional MRI was first performed approximately 2 weeks after stroke, a time (Duncan et al., 1992, 2000; Nakayama et al., 1994) before motor function generally returns. This fMRI scan was supplemented by measurement of CBF. Functional MRI was then repeated approximately 3 months later.
The first question evaluated in this study was whether activation was present 2 weeks after stroke in those brain regions that would later increase function in parallel with behavioral recovery. If so, this finding would suggest that therapeutic targets relevant to recovery might be identifiable at early time points, before behavioral gains. A second question evaluated CBF in bilateral sensorimotor cortex to determine whether perfusion is normal or reduced early after stroke in noninfarcted regions that increase activity during the recovery period. This might clarify the nature of diaschisis in the weeks after stroke, as well as the potential utility of strategies that aim to increase CBF at this time point. Measurement of CBF was also done to aid interpretation of fMRI measurements, because reduced CBF would add complexity to interpretation of current fMRI methods. A secondary aim of the study was to characterize in detail the heterogeneity of regional changes in brain activation across patients recovering from stroke.
MATERIALS AND METHODS
Subjects
Patients had experienced a stroke less than 28 days prior and distal arm weakness, defined as ≤ 4+ strength in affected wrist extensor or hand interossei. Control subjects had no history of cerebrovascular disease or active neurologic disease. All were right handed (Oldfield, 1971) and gave informed consent.
Prescan evaluation
Within 1 day of imaging, subjects underwent clinical evaluation including scoring on arm motor section of the Fugl-Meyer and NIH stroke scales. In the hour before scanning, each subject rehearsed fMRI procedures. Bipolar surface electromyography (EMG) leads were placed over 10 muscles: right and left pectoralis major, biceps, wrist flexors, wrist extensors, and first dorsal interosseus. Subjects performed two active-rest cycles for each task. EMG signal was amplified (Nihon-Kohden, Foothill Ranch, CA, U.S.A.), filtered from 5 to 3,000 Hz, recorded at 1,000 samples/s per channel, and digitized using Labview software (Austin, TX, U.S.A.) and a National Instruments (Austin, TX, U.S.A.) analog-to-digital converter card.
MRI acquisition
Subjects were placed on the 1.5-T scanner bed, pillow under knees, eyes closed, and strap across the forehead. When subjects consented, an intravenous catheter was placed to perform perfusion-weighted MRI. Bilateral splints kept wrists mildly extended, provided a slot for index finger movement, and restricted movement to the index finger metacarpophalangeal joint.
Imaging included volumetric images and anatomical images in plane with functional images (7 mm thick, in-plane resolution: 0.94 mm). These were followed by fMRI scanning using a gradient echo echoplanar pulse sequence with T2* weighting for blood oxygenation level dependent contrast. Each fMRI scan used a boxcar design (20-second rest alternating with 20-second active state), a repetition time of 2,000 milliseconds, an echo time of 50 milliseconds, 14 axial brain slices of 7 mm thickness with no gap, in-plane resolution of 3.75 × 3.75 mm, extending from the vertex to the inferior temporal lobe. All fMRI scans began with four repetition times to establish steady state, after which either 200 images/slice (10 rest—active cycles, passive finger movement) or 100 images/slice (five cycles, active finger movement) were obtained.
Active index finger flexion/extension was performed in control and in patients capable of index finger movement. Rest was contrasted with 25 degrees of movement on the right (controls, at 2 Hz) or the affected side (patients). Patients tapped at 50% of the t1 maximum tap rate, no faster than 2 Hz. Tapping was driven by an auditory metronome delivered through headphones. A single light touch on the knee toggled subjects between rest and tapping. Passive index finger flexion/extension at the metacarpophalangeal joint, 2 Hz, over a 25-degree range was performed in all controls and patients, using the right (controls) or stroke-affected (patients) side, as described previously (Cramer et al., 2002). An examiner stood at the subject's side during scanning to verify that tasks were performed as instructed.
Resting cerebral perfusion was measured using standard perfusion-weighted imaging methods, a repetition time of 2,000 milliseconds, echo time of 40 milliseconds, and 14 axial brain slices of 6 mm thickness with 1 mm gap in-plane with the fMRI slices. A total of 34 volumes were acquired, with a 20-mL bolus of gadolinium rapidly injected intravenously after the first five volumes.
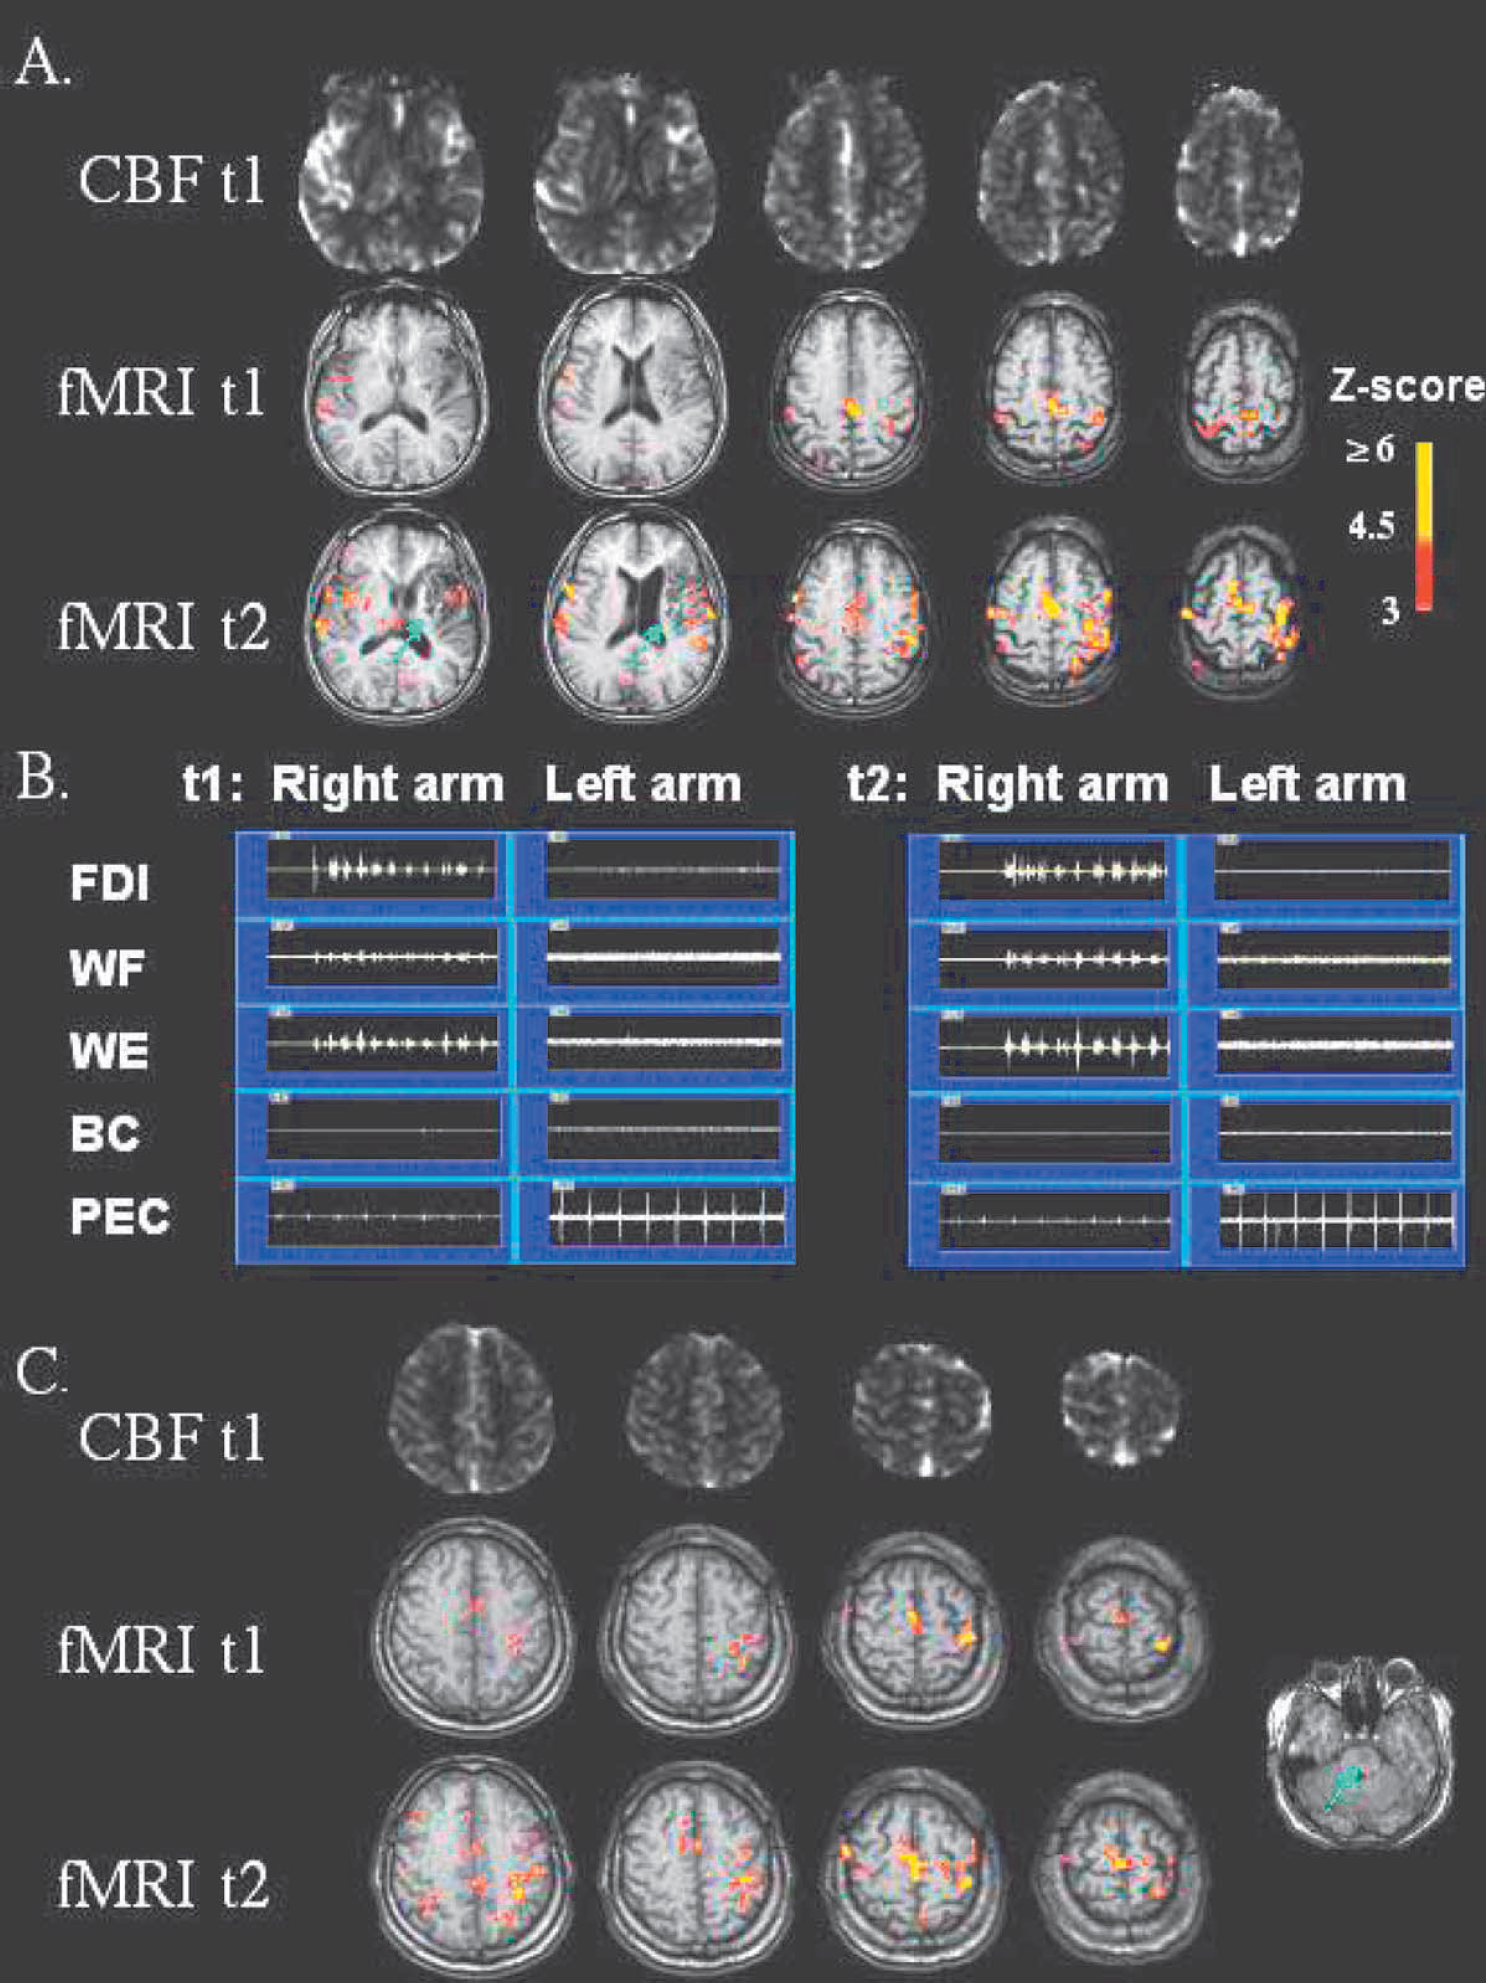
Slice locations were matched as close as possible from t1 to t2, with very good results in general (see Fig. 1). This was achieved by attempting to place each subject's head into the MRI head cradle at the same angle within and across subjects; also, slice selection during scanning consistently selected the dorsal-most slice to be immediately atop the most dorsal aspect of brain substance. Identical imaging parameters were used at the second MRI session (t2). The same finger movement rate was used at t1 and t2, except that the first patient studied tapped at different rates at t1 (0.6 Hz) and t2 (1.4 Hz).
(
Data analysis
The EMG data were digitally filtered in forward and reverse directions using a first-order, high-pass Butterworth filter with a 20-Hz cutoff for each direction. Root mean square values were determined for the first 10 seconds of each rest and active epochs. For each task, mean values for rest cycles were averaged, as were mean values for active cycles. For each muscle during each task, the ratio of active:rest EMG signal was then determined.
For each fMRI task, all images were motion corrected using Automated Image Registration and MEDx 3.3 (Sensor Systems, Sterling, VA, U.S.A.). Images were linear detrended, then a t-test was performed on each voxel, contrasting the rest and active states, with results expressed as a Z-map. Studies with excess head motion, evident as a circumferential ring of activation or total absence of any activated voxels, were excluded.
The number of significantly activated voxels was measured within the precentral gyrus, postcentral gyrus, supplementary motor area, premotor cortex, and secondary somatosensory area (SII) of each hemisphere using regional definitions published elsewhere (Cramer et al., 2002). Activated voxels with Z > 3 and belonging to an activation cluster with size greater than that expected by chance (P < 0.05) (Friston et al. 1994) were identified. This method considers the significance of activation in the voxel of interest as well as in adjacent voxels to identify a voxel as significantly activated, and also corrects for multiple comparisons. The number of significantly activated voxels belonging to such significant clusters was then counted in each region. Regions were drawn on the high-resolution anatomical scans in-plane with functional images, without knowledge of fMRI activation data, and excluded infarcted tissue.
A laterality index (LI) was generated for activation volume for each region (Calautti and Baron, 2003; Cramer et al., 1997; Lee et al., 2000). The LI was defined as (contralateral activation – ipsilateral activation)/(contralateral activation + ipsilateral activation). Contralateral and ipsilateral are in reference to the hand active during fMRI scanning. A positive LI indicates relatively greater activation in the contralateral side, and a negative LI indicates relatively greater activation in the ipsilateral side.
An arterial input function using the M1 segment of the middle cerebral artery on the noninfarcted side was used to create maps of relative CBF from the perfusion-weighted MRI scans using methods described previously (Ostergaard et al. 1996). In each hemisphere, a sensorimotor cortex region encompassing noninfarcted portions of the five regions of interest was superimposed upon CBF maps. A mean value was determined for relative CBF in sensorimotor cortex of each hemisphere. Results were then expressed for each patient as the ratio of the stroke-affected/nonaffected side. This was then repeated for each individual region of interest.
Statistics
A two-tailed Wilcoxon rank sum test was used to compare results between controls and patients. A two-tailed Wilcoxon signed rank test was used to determine if there was a significant difference between t1 and t2 values. The Spearman correlation coefficient was used for all correlation analyses. An α of 0.05 was used, without correction for multiple comparisons given the small number of subjects in each group.
RESULTS
Serial fMRI data were available from eight patients, the clinical features of whom are described in Table 1. One patient has been previously described (Cramer and Bastings, 2000). There were no significant differences between controls (n = 7) and patients in age (42 ± 15 vs. 56 ± 15 years, mean ± SD) and number of days between first scan (t1) and second scan (t2) (206 ± 132 vs. 112 ± 26). The first fMRI scan in patients was performed a mean of 16 ± 5 days after stroke. Patients spent an average of 25 ± 9 days as inpatients on the rehabilitation medicine ward. All but one of the strokes was in the left brain. All but one of the patients had no significant carotid artery disease (patient 8 had carotid occlusion ipsilateral to infarct).
Clinical findings in the eight stroke patients
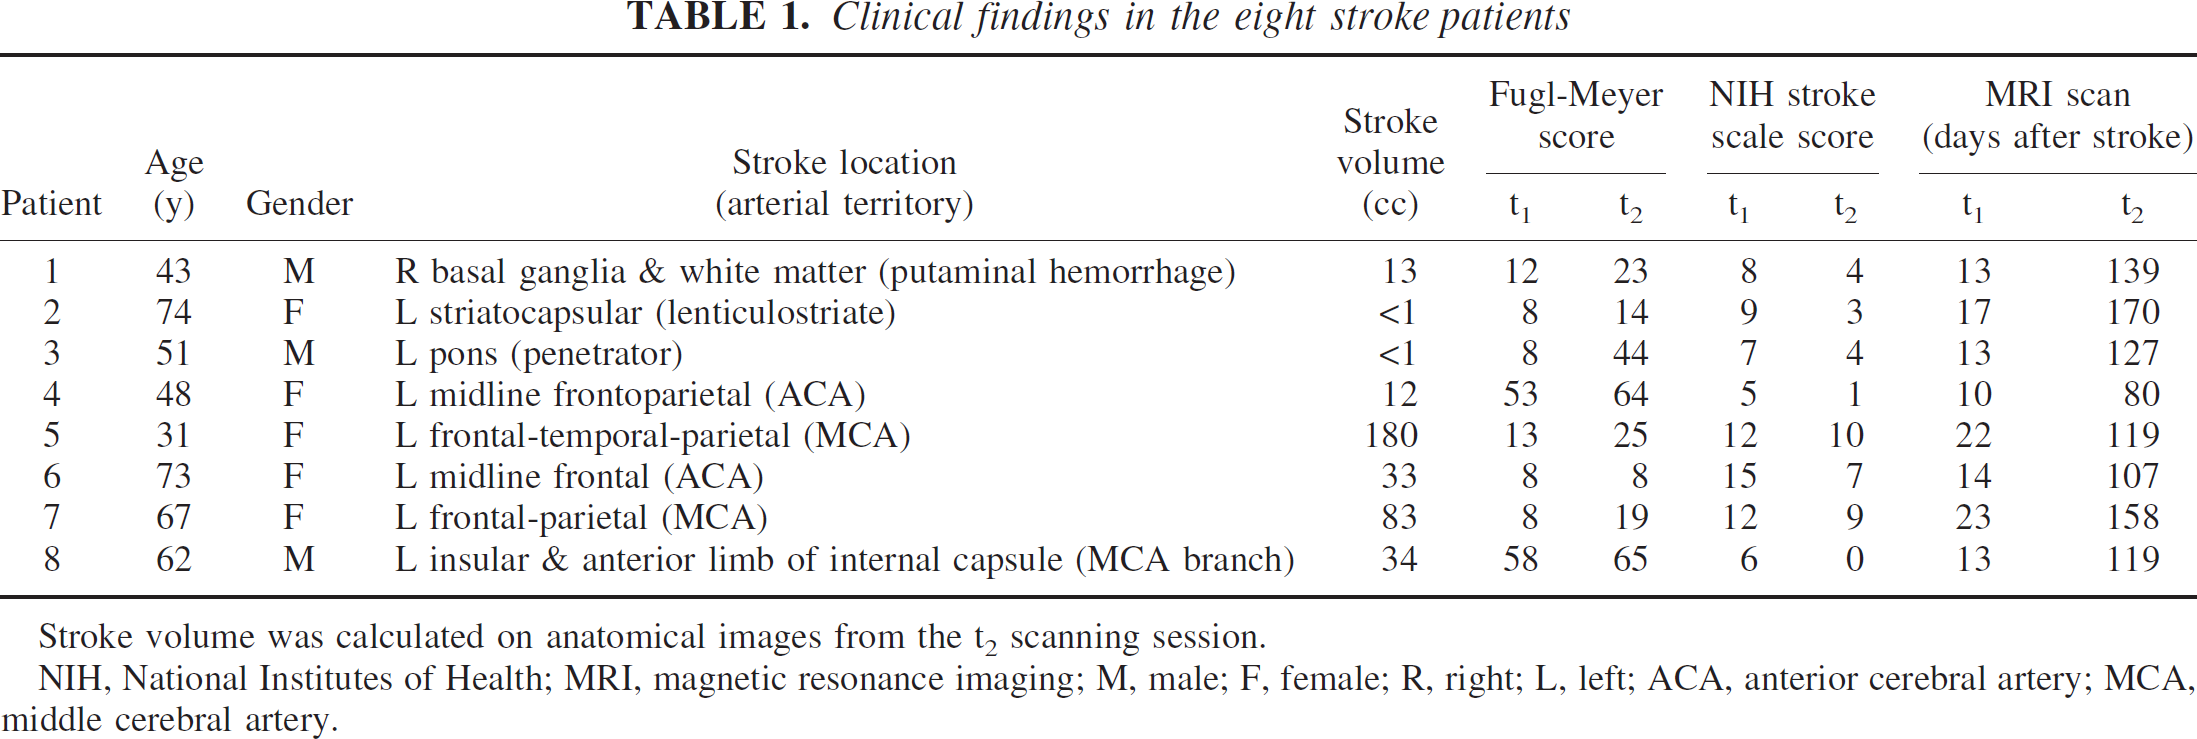
Stroke volume was calculated on anatomical images from the t2 scanning session.
NIH, National Institutes of Health; MRI, magnetic resonance imaging; M, male; F, female; R, right; L, left; ACA, anterior cerebral artery; MCA, middle cerebral artery.
Five patients could not move the index finger at t1, and thus only passive index finger movement fMRI data were serially collected. Three patients were able to move the index finger at t1, and thus fMRI data during active index finger tapping were serially collected; for these three patients, serial data during passive finger movement were not available because excess head movement corrupted passive index finger fMRI at one or both scans. Across controls, serial fMRI data were available in six for the active task and in six for the passive task.
Patients showed significant clinical improvement between t1 and t2 on Fugl-Meyer (median 11-point gain, P < 0.02) and NIH Stroke Scale (median 4-point reduction, P < 0.009; Table 1) scores. All patients showed gains in the Fugl-Meyer scale measures of arm motor function except one, in whom a substantial reduction in NIH Stroke Scale score was measured. In parallel with these clinical gains, all but one patient showed a change in regional activation volume over time (Fig. 1 and Table 2).
fMRI findings in patients and controls
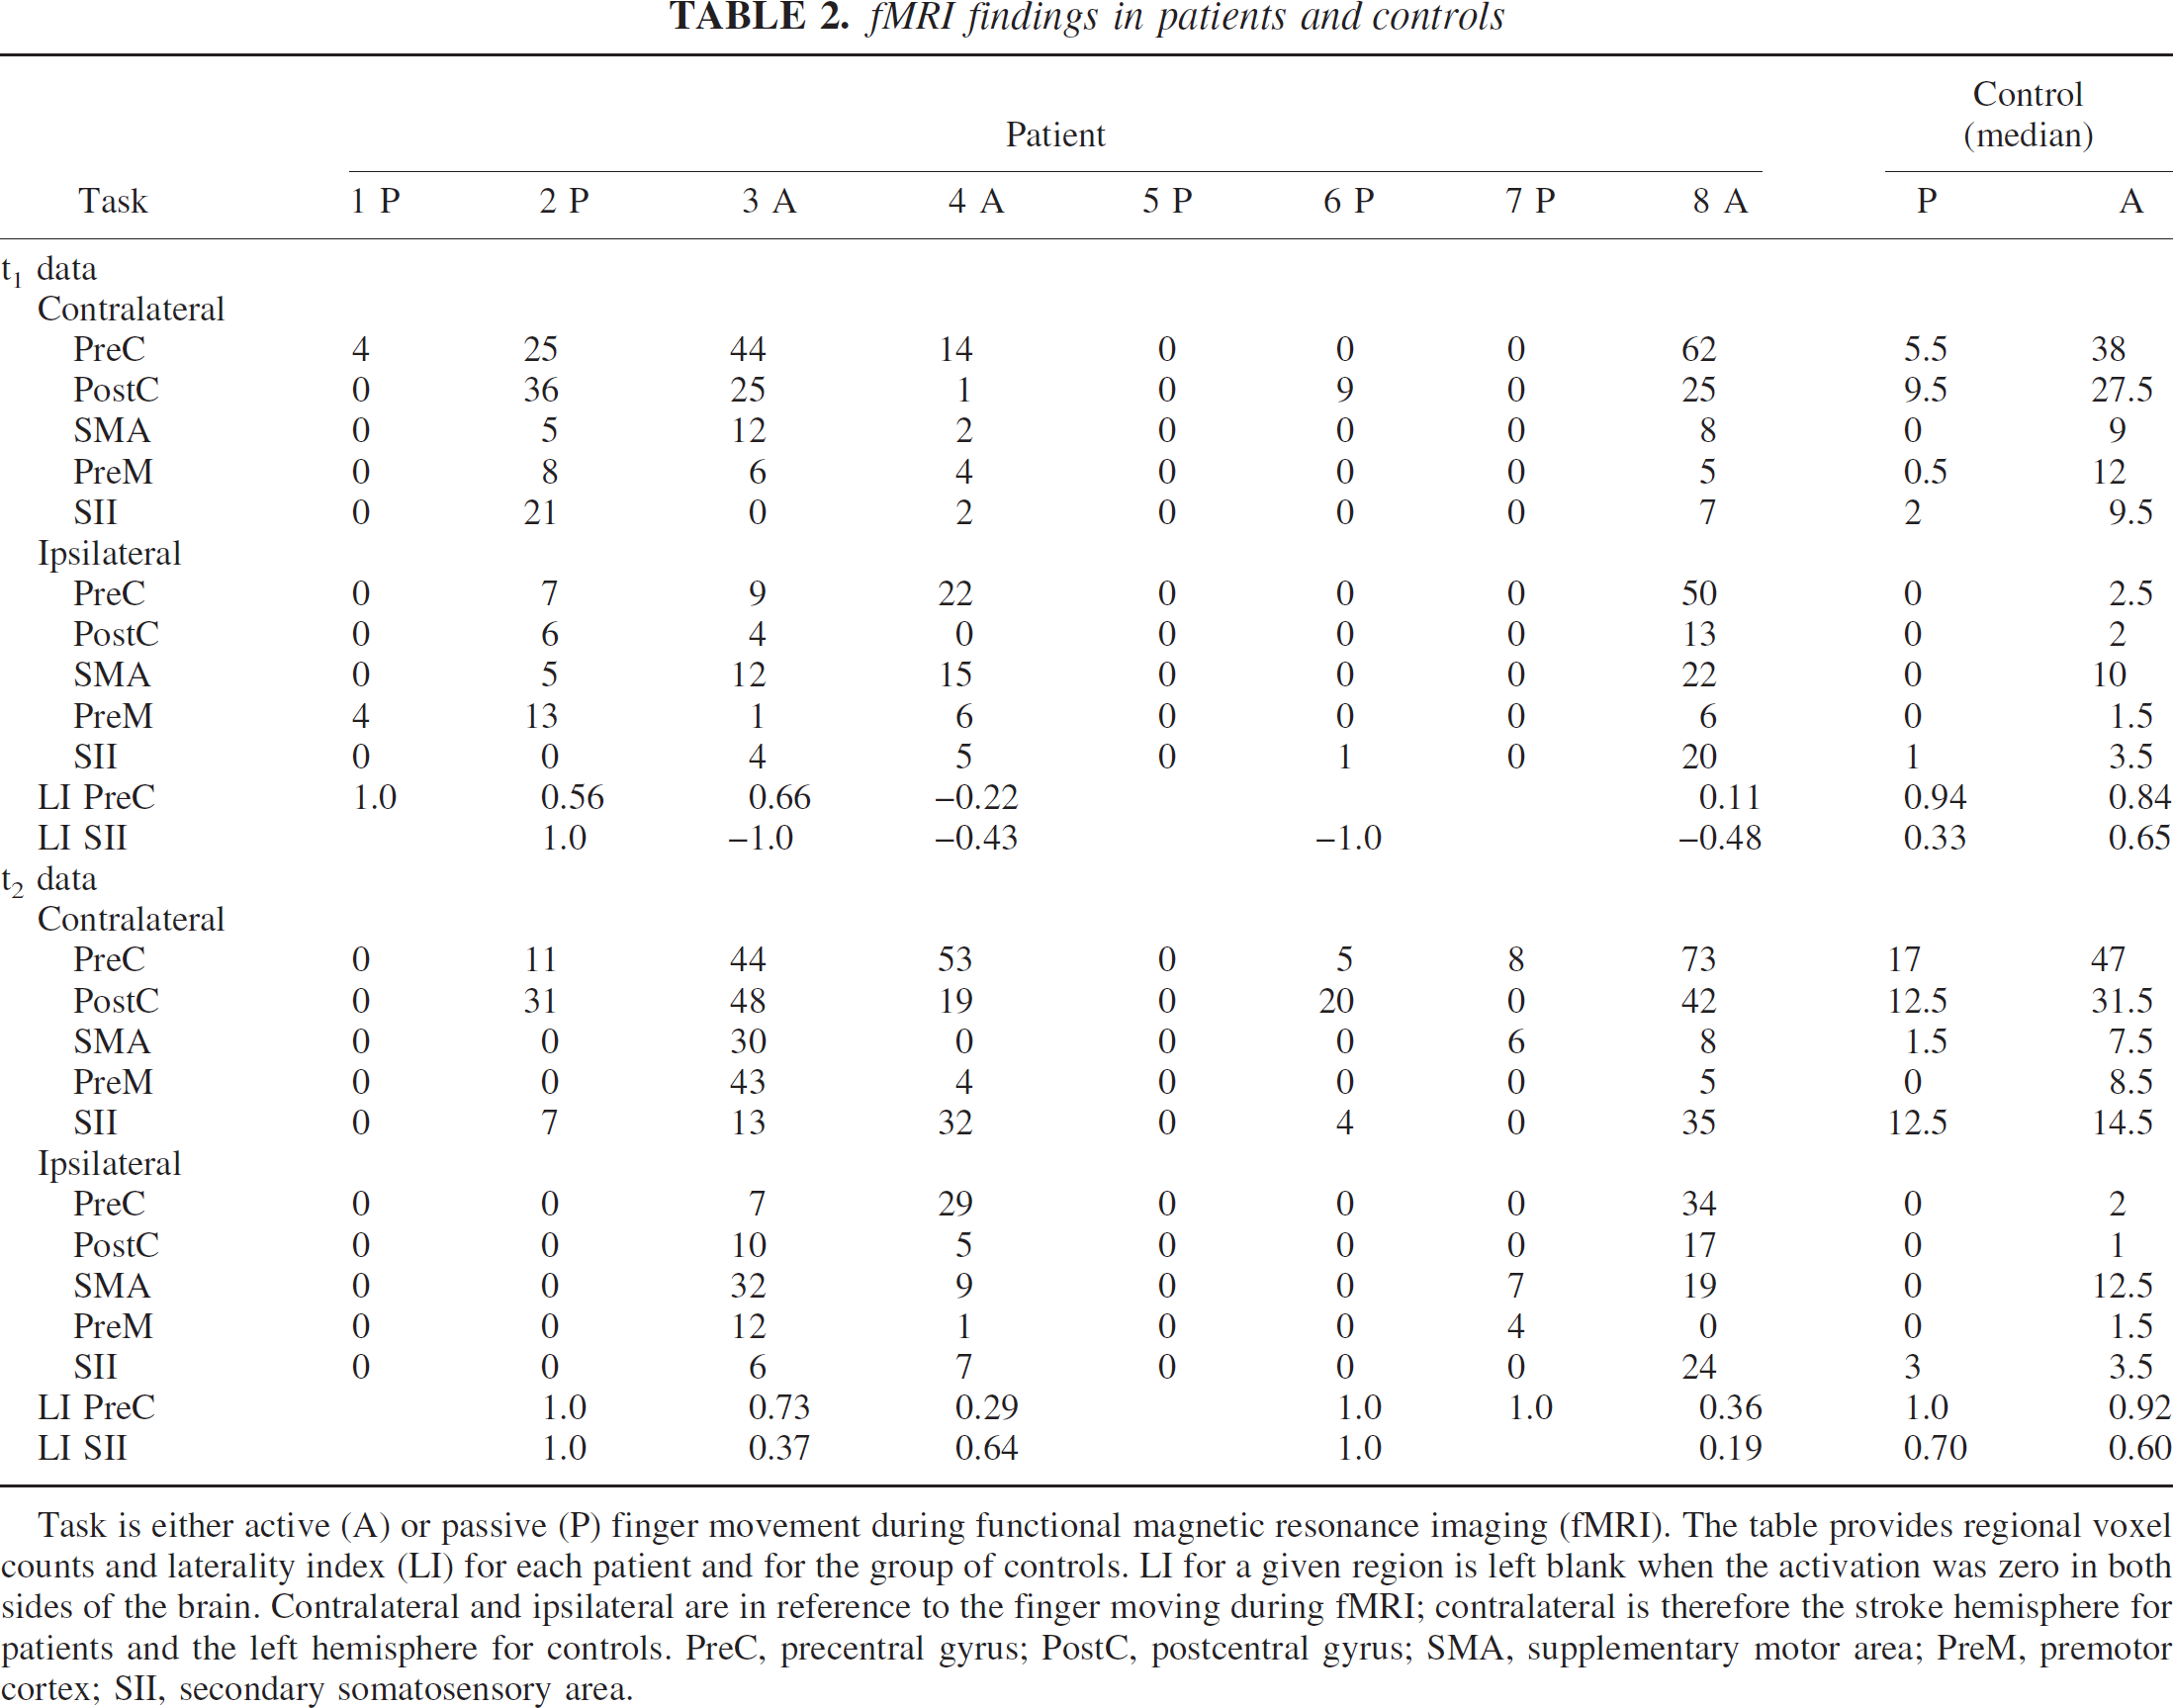
Task is either active (A) or passive (P) finger movement during functional magnetic resonance imaging (fMRI). The table provides regional voxel counts and laterality index (LI) for each patient and for the group of controls. LI for a given region is left blank when the activation was zero in both sides of the brain. Contralateral and ipsilateral are in reference to the finger moving during fMRI; contralateral is therefore the stroke hemisphere for patients and the left hemisphere for controls. PreC, precentral gyrus; PostC, postcentral gyrus; SMA, supplementary motor area; PreM, premotor cortex; SII, secondary somatosensory area.
There was heterogeneity in the pattern of fMRI change seen among patients. Five patients (patients 3, 4, 6, 7, and 8) showed primarily increased regional activation over time, whereas two patients showed only decreases in activation over time (patients 1 and 2) and one patient showed no change over time (patient 5, Table 2). For each of the 10 brain regions, there were examples of increased activation over time as well as decreased activation over time among patients. Across all regions and patients, there were 26 instances of increased volume over time, most (16) of which were in the stroke hemisphere, and 18 instances of decreased volume over time, most (12) of which were in the nonaffected hemisphere. Across the group of control subjects, paired testing found no significant change over time in activation volume or LI for any region, during either task.
Increased activation volume over time, the most common pattern among stroke patients, was examined in greater detail. The three sites with the largest increase are presented in Table 3. Review of fMRI maps disclosed two important features of activation increases over time. First, nearly all of the areas that were going to increase fMRI activation volume during the period of stroke recovery were not in the same vascular territory (Damasio, 1983) as the infarct, and indeed showed no evidence for infarct-related injury on structural images. Second, in four out of five patients, activation at t1 was present within at least one of the areas that would later increase activation over time (Fig. 1).
Observations related to increased fMRI over time
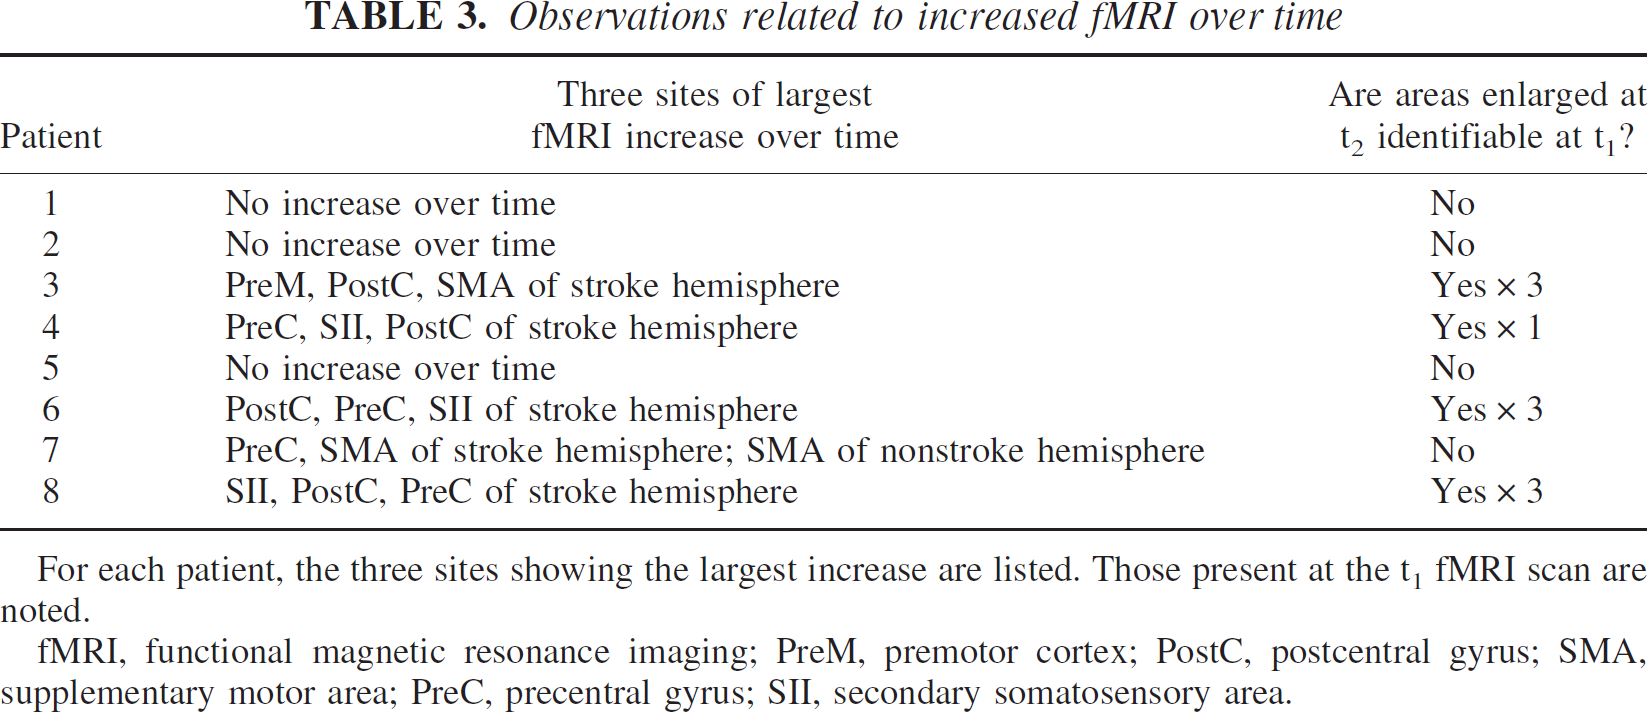
For each patient, the three sites showing the largest increase are listed. Those present at the t1 fMRI scan are noted.
fMRI, functional magnetic resonance imaging; PreM, premotor cortex; PostC, postcentral gyrus; SMA, supplementary motor area; PreC, precentral gyrus; SII, secondary somatosensory area.
The change in activation volume over time was found to correlate with final motor status (final Fugl-Meyer arm motor score) for three regions, each of which showed a positive correlation: SII in the stroke hemisphere (r = 0.71, P < 0.05, see Fig. 2), SII in the nonstroke hemisphere (r = 0.93, P < 0.001), and postcentral gyrus in the nonstroke hemisphere (r = 0.77, P < 0.05). There were no significant correlations when change in Fugl-Meyer score was used instead of final score, and there were no significant correlations when LI was used instead of activation volume due to missing values (several patients had no LI because of a zero in both numerator and denominator).
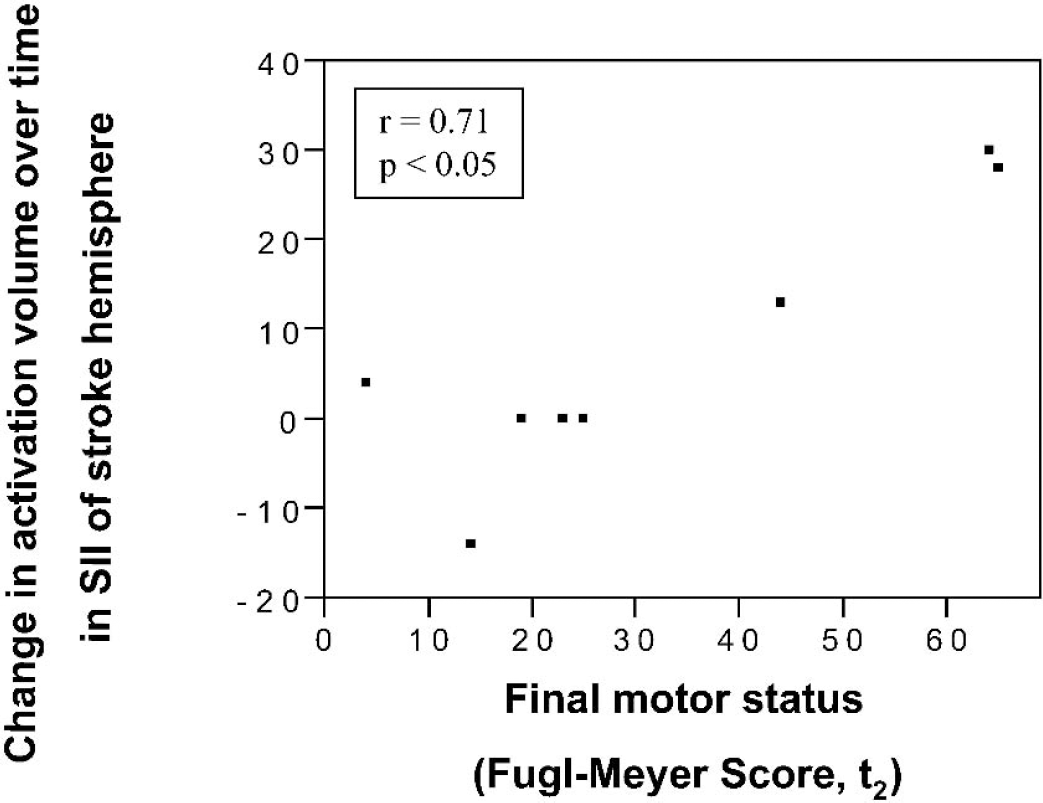
Across all eight patients, a significant correlation was found between final motor status (arm motor Fugl-Meyer score) and change in activation volume (number of significantly activated voxels) within SII of the stroke-affected hemisphere.
The EMG data from both sessions was available from four patients (three with passive and one with active finger movement) and six controls (two with passive and four with active finger movement). A separate analysis of patients and controls disclosed that EMG measures from t1 to t2 were not significantly different from zero in any of the 10 leads for either group.
Sensorimotor cortex perfusion MRI data were available from seven patients at t1. In these patients, hemispheric CBF within noninjured sensorimotor cortex regions of the stroke-affected hemisphere was 94% ± 6% as compared with the nonstroke hemisphere. For individual cortical regions that were not injured by stroke, CBF in the stroke hemisphere at t1 remained at more than 90% of the value in the nonstroke hemisphere in all cases for precentral gyrus and SII, though results were divided for postcentral gyrus, supplementary motor area, and premotor cortex. Overall, among brain regions not injured by the infarct, CBF in the stroke hemisphere at t1 was at least 90% of the value in the nonstroke hemisphere in 13 instances. Stroke hemisphere regional CBF at t1 was less than 90% of nonstroke hemisphere values in nine instances (three of which were from the sole patient with large artery disease), among which two showed an increase in activation volume over time, one showed a decrease, and six showed no change.
DISCUSSION
In the current study, use of multiparameter MRI provided insights into cortical function early after stroke, at a time before most motor recovery occurs. There was heterogeneity of fMRI evolution pattern across patients, with regional activation volumes during movement of the stroke-affected index finger showing an overall increase over time in some patients, and a decrease in other patients. EMG results suggest that muscle activity was similar from t1 to t2, and therefore suggest that results reflect changes in brain function, rather than changes in finger movement, over time. Many cortical areas that would later increase activation at t2 were already activated at t1. CBF in the stroke hemisphere was generally preserved at t1, despite a heterogeneous study population, a result that provides insights into the physiology of stroke recovery an average of 16 days after stroke.
The current study found that, across all patients, the majority of regions showing an increase over time were in the stroke hemisphere, and the majority of regions showing a decrease over time, were in the nonstroke hemisphere. This is in agreement with some, but not all, previous studies. Increased activity over time within stroke hemisphere sensorimotor cortices was associated with improved outcome by Marshall et al. (2000) using upper extremity movement, by Wikstrom et al. (2000) using median nerve stimulation, and by Calautti et al. (2001) using index-thumb tapping. Studies using transcranial magnetic stimulation serially after stroke are concordant (Traversa et al., 1997; Turton et al., 1996), as are data from animals with experimental stroke (Dijkhuizen et al., 2001). Other studies, however, have found no relation between degree of recovery and hemispheric distribution of sensorimotor cortex activation (Feydy et al., 2002), or increased activation over time only in premotor cortex of nonstroke hemisphere (Nelles et al., 1999) or in cerebellum (Small et al., 2002). Alternatively, a recent study found that brain activation generally decreased over time in eight patients studied with serial fMRI during a hand-gripping task (Ward et al., 2003). The divergence of findings across these studies may in part reflect differences arising from characteristics of the patients studied, use of different brain mapping modalities, and use of divergent tasks for probing sensorimotor function. Also, most patients reach a plateau in motor recovery 11 weeks (Nakayama et al., 1994) to 12 weeks (Duncan et al., 1992, 2000) after stroke. Some studies include measurements substantially beyond this time point, and thus may be describing brain function related to different neurologic events.
The current study provides several insights into the physiologic state early after stroke within cortical regions whose function later changes in parallel with recovery. First, in this population with little disease of cerebral arteries, most brain areas where activation volume would later increase were found to have normal or near normal perfusion, relative to the nonstroke hemisphere. A finding of reduced perfusion might have complicated interpretation of current fMRI methods, but this was generally not the case.
Second, brain areas where activation volume would later increase were often outside the arterial territory of infarction and thus suffered no ischemic insult. These two findings suggest several conclusions. The processes responsible for enlargement of activation volume over time in some patients after stroke are not likely hindered by reduced CBF, though a few exceptions were noted. As an extension of this, if the process of diaschisis contributes to reduced cortical activation early after stroke, it might be best measured using glucose metabolism (Cappa et al., 1997; Heiss et al., 1993) or spectroscopic changes (Chu et al., 2002) rather than CBF. Based on these observations, we believe that low perfusion is not likely an important therapeutic target for promoting brain reorganization early after stroke.
Third, many areas that increase activity in parallel with recovery are already identifiable 10 to 23 days after stroke. Such information may be useful in therapeutic trials involving patients with subacute stroke (Cole and Lieberman, 1996; Dobkin, 1996). For therapies that aim to improve function by directly stimulating specific sites of cortical function (Lefaucheur et al., 2001; Siebner and Rothwell, 2003), the current results suggest that the possibility exists to identify, at early time points after stoke, those target areas that will later be important to recovery.
More regions showed increased rather than decreased activation volume over time, and the strongest correlations between this increase and clinical gains were present in sensory cortices including bilateral SII. Caution must be exercised when interpreting these correlations given that results of active and passive finger movement have been combined, as in prior studies (Feydy et al., 2002; Marshall et al., 2000), and given that brain activation with these two tasks normally incompletely overlaps (Cramer et al., 2000; Mima et al., 1999; Weiller et al., 1996). Areas with increased activity over time in parallel with motor gains—particularly SII in each hemisphere—may represent therapeutic targets of particular importance to motor recovery after stroke. Increased SII activation with serial brain mapping studies during the period of stroke recovery has been previously reported (Carey et al., 2002). SII shares reciprocal connections with the portion of primary motor (Leichnetz, 1986) and sensory (Manzoni et al., 1986) cortex in which arm movements are represented, is a source of corticospinal tract fibers (Galea and Darian-Smith, 1994), possesses a rich amount of bilateral receptive fields (Petit et al., 1990), and has substantial callosal connections between hemispheres (Barbaresi et al., 1994). The findings in SII may support a role for sensorimotor integration (Huttunen et al., 1996), attention (Mima et al., 1998), and bilateral hemispheric interactions in motor recovery after stroke.
There are several limitations to the current study. The small number of patients reduced statistical power. A range of circumstances further reduced the number of observations for some data such as EMG collection. Strokes were located in a variety of locations, which may have contributed to heterogeneity of findings. Perfusion was measured as a hemispheric ratio, making unclear the contribution of any nonstroke hemisphere perfusion changes to the final estimate of stroke hemisphere perfusion. At both t1 and the t2, there was variability in the time from stroke to investigation that, while relatively limited compared with the overall time course of motor recovery after stroke (Duncan et al., 2000), nevertheless might have contributed to intersubject variance.
Cortical areas that normally contribute to sensorimotor function often increase activity when part of the distributed network is injured by stroke. Animal studies suggest the ability to improve behavioral outcome by administering therapies that, at least in part, increase restorative changes in these areas. The current results provide insights into the nature of these events in humans at early time points after stroke.