
Abstract
Our aim is to investigate the association of cerebral deep medullary veins (DMVs) with white matter microstructural integrity and regional brain atrophy in MRI. In a community-based cohort of 979 participants (mean age 55.4 years), DMVs were identified on susceptibility-weighted imaging. Brain structural measurements including gray matter and hippocampus volumes, as well as diffusion tensor metrics, were evaluated. The mean (SD)number of DMVs was 19.0 (1.7). A fewer number of DMVs was related to lower fractional anisotropy and higher mean diffusivity in multiple voxels on the white matter skeleton (threshold-free cluster enhancement corrected p < 0.05, adjusted for age and sex). Also, fewer DMVs were significantly related to a lower gray matter fraction and a hippocampal fraction (0.10 and 0.11 per DMV, respectively; SE, 0.03 for both; p < 0.001 for both). A significant correlation between DMVs’ reduction and cortical atrophy was observed in the bilateral occipital lobes, temporal lobes, hippocampus, and frontal lobes (p < 0.001, adjusted for age, sex, and total intracranial volume). Our results provided evidence that cerebral small venules disease play a role in brain parenchymal lesions and neurodegenerative processes.
Keywords
Introduction
Pathological changes of cerebral venules were hardly described in previous literature until Moody et al. identified periventricular venous collagenosis (VC) in autopsy cases. 1 Since then, the pathological changes in deep medullary veins (DMV) have been described in both patients with leukoaraiosis and those with Alzheimer’s disease.2,3 Recently, due to the reported involvement of perivenous glymphatic drainage in neurodegenerative diseases, 4 cerebral venules have attracted considerable research interest; however, direct evidence from human studies is lacking.
A few MRI studies with small sample sizes have described the correlation between the venules seen on MRI and cerebral small vessel disease (CSVD); however, the results are inconsistent.5–7 Guio et al. found that the density of visible DMVs was significantly lesser in 12 patients with cerebral autosomal-dominant arteriopathy with subcortical infarcts and leukoencephalopathy compared to that in healthy controls. 8 However, our previous study in a population-based cohort discovered that having fewer DMVs is not associated with conventional CSVD changes on MRI, such as lacunes, white matter hyperintensities (WMH), or cerebral microbleeds, but is strongly related to brain atrophy as indicated by the brain parenchymal fraction (BPF). 9 Thus, further research is in need on white matter (WM) microstructural alternation related to DMV. Meanwhile, changes in cerebral venules are possibly involved in different pathogenic mechanisms compared to those of other CSVD markers, and the potential role of neurodegenerative processes deserves more research attention.
Herein, to further understand the relationship between cerebral venules and structural abnormalities in the brain, we investigated whether lesions in DMVs are related to the WM microstructural integrity in a large population-based sample. We also investigated which brain regions susceptive to atrophy were related to fewer DMVs via voxel-based morphometry (VBM).
Material and methods
Study population
This study is part of the Shunyi Study, an ongoing prospective community-based cohort study designed to investigate the risk factors and associated brain imaging of cardiovascular and age-related diseases. The design and methods of the Shunyi study have been described previously. 10 Between June 2013 and April 2016, a total of 1,586 participants underwent a baseline assessment including structured questionnaires, physical examinations, and blood tests. Among them, a total of 1,257 participants underwent a baseline MRI. We excluded individuals with large periventricular infarcts, hemosiderin deposition, and enlarged lateral ventricles that hindered the measurement of the DMVs (n = 167), and further excluded those with a history of stroke (n = 34). Also, 77 individuals were excluded due to poor image quality. Finally, a total of 979 participants were included in the present analysis (Study flow diagram provided in Figure 1).
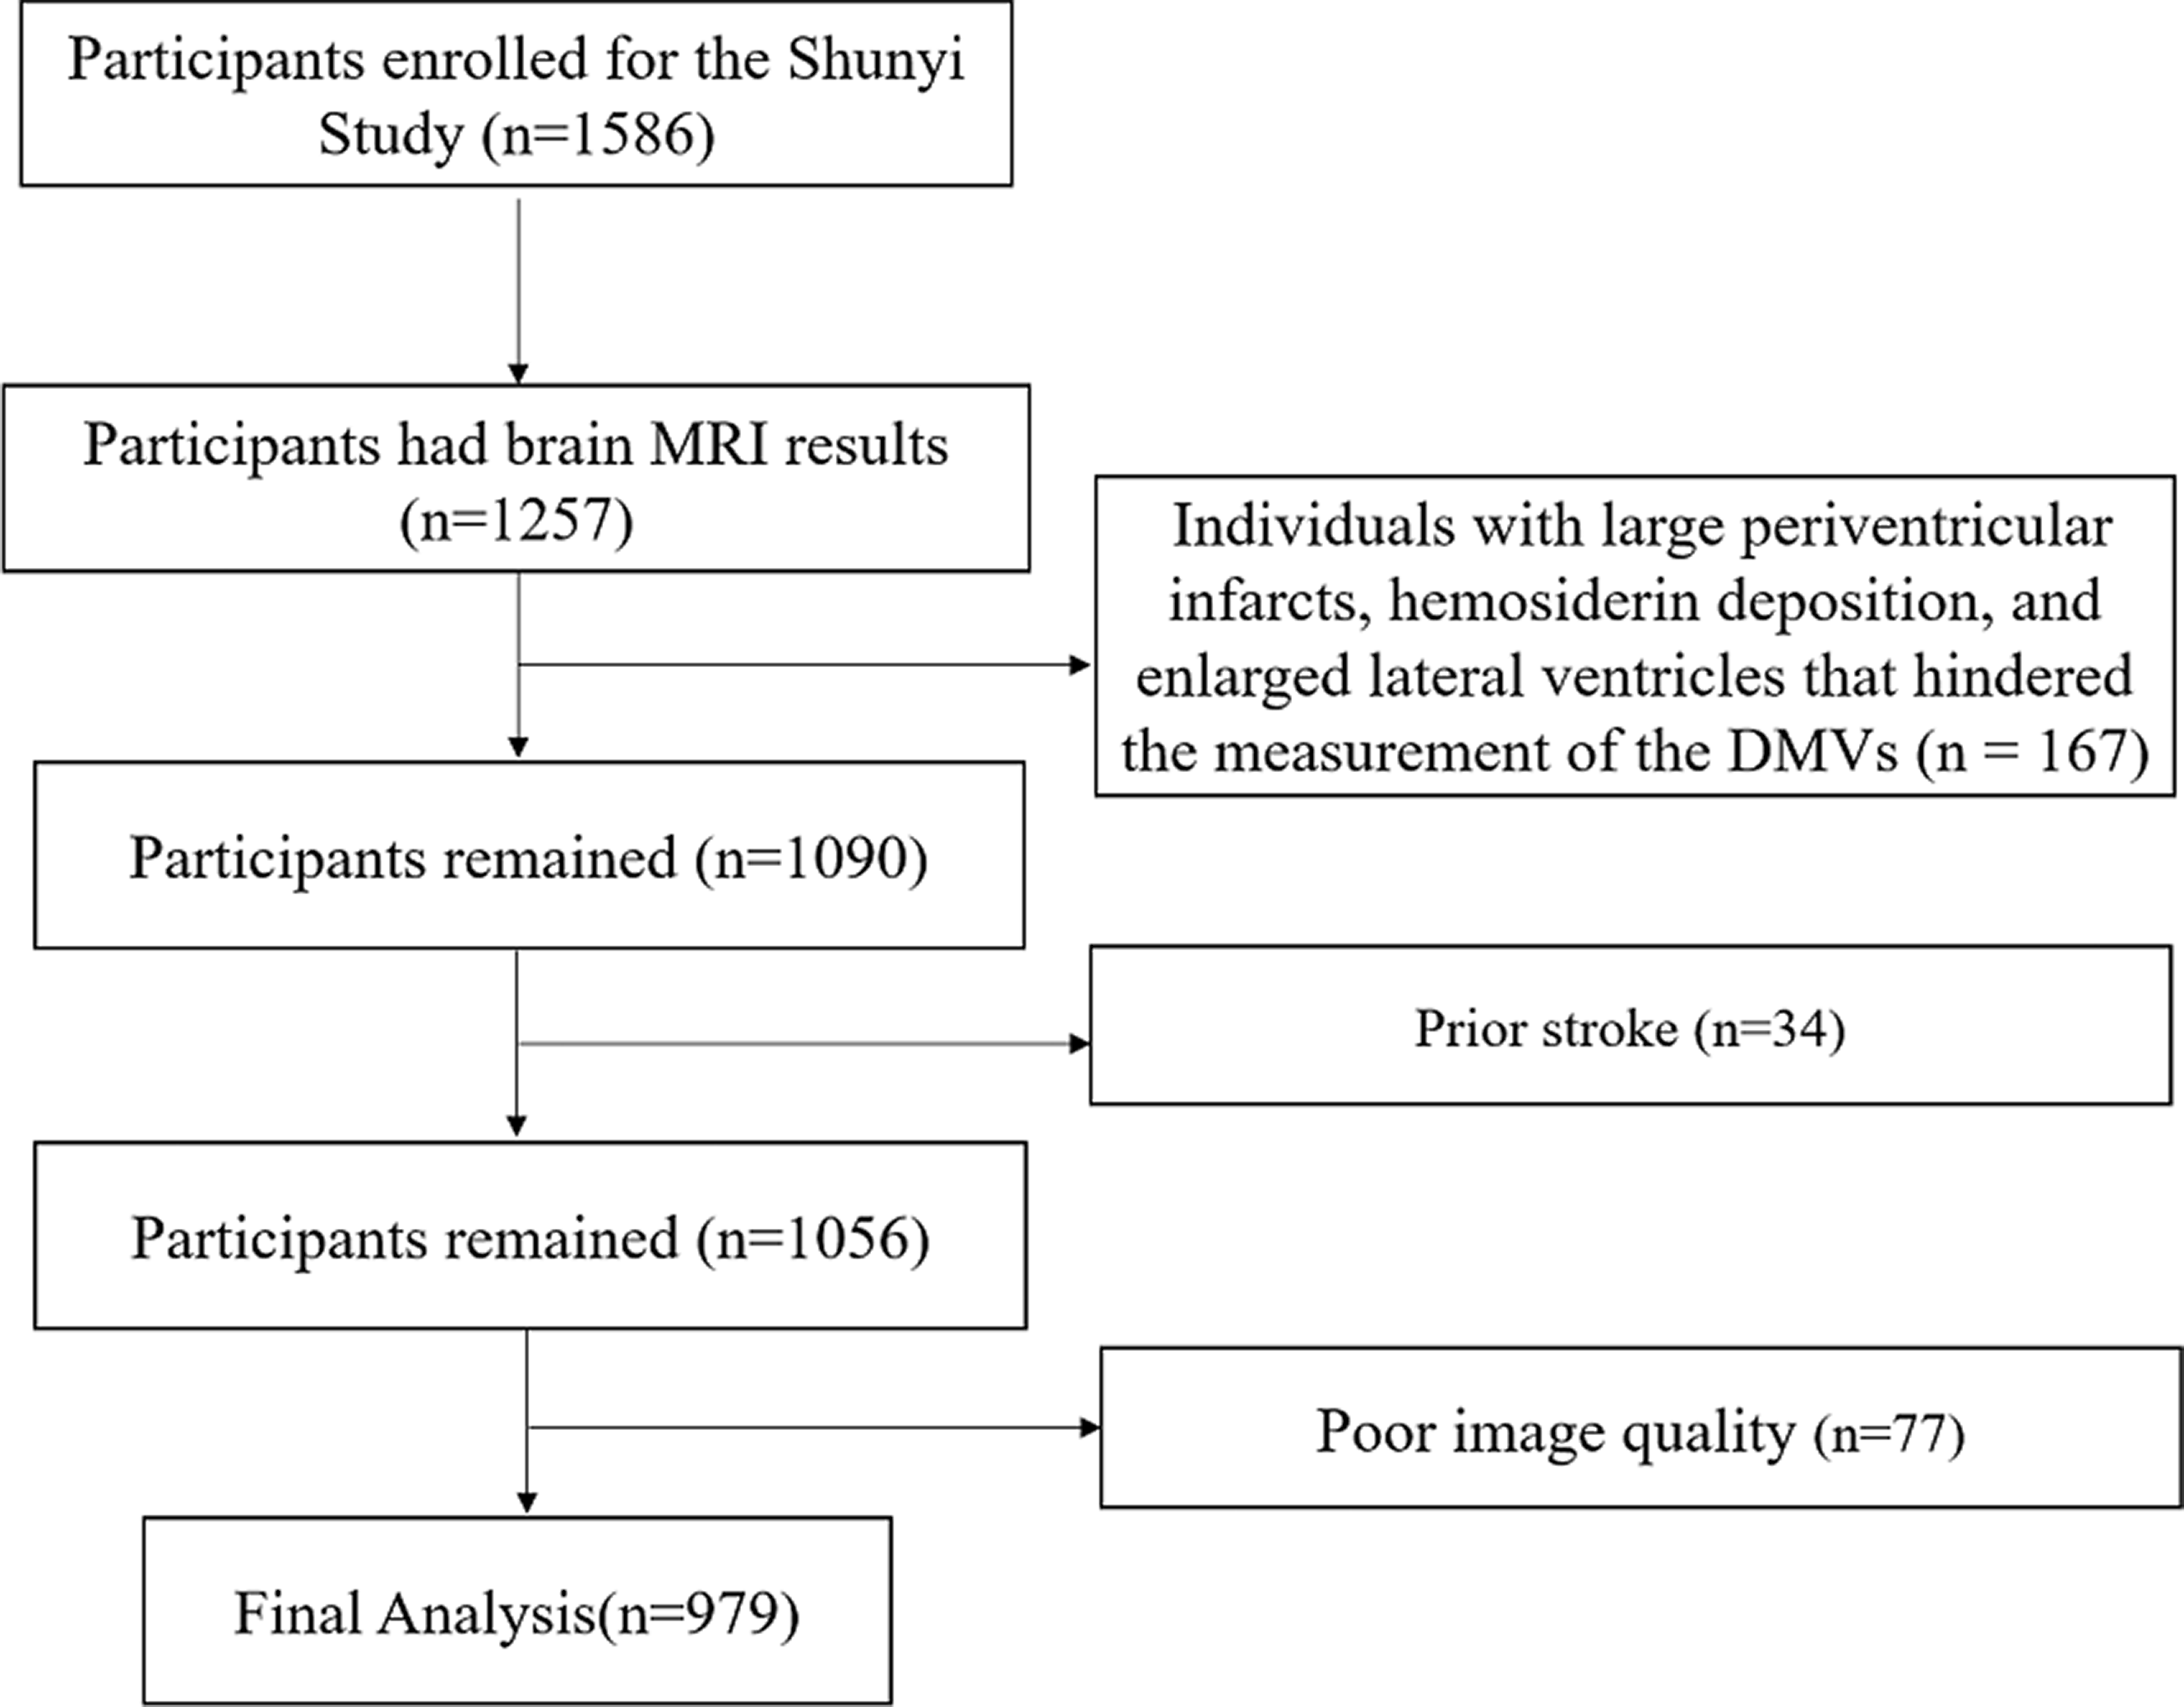
Study flow diagram.
All the participants provided written informed consent. The study was approved by the Ethical Committee at Peking Union Medical College Hospital (reference number: B-160). All clinical investigation has been conducted according to the principles expressed in the Declaration of Helsinki. Anonymized data will be shared by request from the qualified investigator after ethics clearance and approval by all members of the project group.
MRI protocol
All the MRI data were obtained using a 3-T Skyra scanner (Siemens, Erlangen, Germany). Three-dimensional (3D) T1-weighted, T2-weighted, fluid-attenuated inversion recovery, and susceptibility-weighted imaging (SWI), and diffusion tensor images (DTI) were performed as described in detail in the Supplemental method.
Assessment of the number of DMVs
The number of DMVs was assessed by visual inspection on SWI, based on the protocol described by Ao et al (eFigure 1). 9 Briefly, a trained investigator (DHA) blinded to all clinical data rated veins that traversed perpendicularly to the lateral ventricular and crossed the region of interest placed in the periventricular WM between the frontal and occipital horn in each cerebral hemisphere. The number of DMVs was defined as the average count of both hemispheres.
Intra-rater reliability was assessed (by YCZ) using a random sample of 50 individuals with an interval of more than one month between the first and second readings. Kappa values for the intra-rater and inter-rater reliability were 0.76 and 0.79, respectively, and inter-class correlations for the intra-rater and inter-rater were 0.68 and 0.75, respectively. For automatic segmentation of WMH using the LST toolbox, the Dice coefficient was 0.62 at threshold κ = 0.15 when compared with manual segmentation.
Assessment of CSVD markers and other structural measurements
Trained physicians who were blind to all clinical data rated lacunes (by FH), enlarged perivascular spaces (EPVS, by SYC), and cerebral microbleeds (CBM, by QW) independently. Definitions of CSVD markers were described previously by Zhai et al. 11 Presence of lacunes and presence of CMB was defined as dichotomous variables. The severity of PVS was trichotomized because of the small number of participants with degree 4 EPVS (mild [degree 1]; moderate [degree 2]; severe [degree 3 and 4]). WMH volumes were automatically segmented by the lesion growth algorithm as implemented in the lesion segmentation tool toolbox (statistical-modelling.de/lst.html) for Statistical Parametric Mapping 12 (SPM 12, fil.ion.ucl.ac.uk/spm/). WMH volume was natural log-transformed to reduce the skewness. Intra-rater agreement for CSVD markers was provided previously by Zhai et al. 11
The gray matter (GM), WM, and cerebrospinal fluid were automatically segmented on structure T1-weighted images using Statistical Parametric Mapping 12 (http://www.fil.ion.ucl.ac.uk/spm/) and CAT12 toolbox (http://www.neuro.uni-jena.de/vbm/). WMH was automatically set as WM to minimize segmentation errors. Total intracranial volume (TIV) was the sum of the volumes of GM, WM, and cerebrospinal fluid. BPF was the ratio of brain tissue volume (GM + WM) to TIV. GM fraction and WM fraction were calculated as the GM and WM volume divided by TIV. The FSL/FIRST (FMRIB Software Library, v5.0) software was used to segment the subcortical nucleus, and the average of left and right nucleus volumes was taken as the nucleus volume.
Assessment of covariates
Demographic and clinical information including age, sex, smoking status, blood pressure, history of hypertension, diabetes mellitus, hyperlipidemia, body mass index (BMI), and current medication were collected using a structured questionnaire and physical examination. Blood pressure was measured 3× and the mean value was used. Diabetes mellitus was defined as fasting serum glucose ≥7.0 mmol/L, self-reported diabetes mellitus, or use of oral antidiabetic drugs or insulin. Smoking status was classified into current smoker (at least within the past 1 month) and noncurrent smoker.
DTI data processing
The DTI data were processed using the Pipeline for Analyzing Brain Diffusion Images toolkit (PANDA, www.nitrc.org/projects/panda), a software for fully automated processing of brain diffusion images. 12 Fractional anisotropy (FA) and mean diffusivity (MD) maps, representing WM microstructural integrity, were generated for each participant in the native space and the standard Montreal Neurological Institute space. Global mean DTI metrics were calculated by all the voxels within the WM mask generated with the threshold FA > 0.2 using PANDA. Furthermore, mean DTI metrics in the normal-appearing white matter (NAWM) region were calculated using masks created by excluding the individual WMH segmentation mask from the WM mask.
Statistical analysis
To investigate correlations between the number of DMVs and brain structural parameters, both numerical calculations and voxel-wise analysis were performed.
Firstly, the association between the number of DMVs and DTI metrics were assessed using linear regression in a univariate model (model 1) and a multivariate model adjusted for age, sex, hypertension, current smoker, hyperlipidemia, body mass index and diabetes mellitus status, and TIV (model 2). In the assessment of correlation between the number of DMVs and brain structural volumes, additional adjustment was performed for the severity of EPVS, presence of lacunes, cerebral microbleeds, and lg (WMHvolume) (model 3). The covariates in the multivariate regression models were selected based on prior knowledge and univariate analyses. To avoid overadjustment of the actual influence of DMV on WM structures, we did not include CVSD markers in the covariate list in analysis of DTI metrics. In the analysis of mean FA and MD values in the NAWM region, 62 (6.3%) participants were excluded for processing error.
For the voxel-wised analysis of DTI metrics, we performed tract-based spatial statistics (TBSS, FMRIB Center, Oxford, UK). General linear model analysis was performed using a permutation-based statistical interference tool for a non-parametric approach (‘randomize'). A threshold of 0.2 was applied for the creation of the skeletonized FA image. The number of the permutation tests was set at 5000 and the threshold for significance was set at threshold-free cluster enhancement corrected p < 0.05, adjusted for age and sex. Data of 8 participants were excluded due to processing errors in tract-based spatial statistics analysis.
Patterns of regional GM atrophy were assessed using VBM. The 3D T1-weighted images were processed using the Statistical Parametric Mapping (SPM12; http://www.fil.ion.ucl.ac.uk/spm/) software and Computational Anatomy Toolbox 12 (CAT-12; http://www.neuro.uni-jena.de/vbm/) running on MATLAB. A multiple linear regression model was applied to investigate the linear association of GM density and the number of DMVs. The statistical threshold for significance was set at uncorrected p < 0.001. Clusters composing over 50 significant neighboring voxels were extracted and displayed on the background of Montreal Neurological Institute brain. Data of 5 participants were excluded for tract-based spatial statistics analysis due to processing error.
All the numerical calculations were performed using the statistical software package SPSS (version 25.0; IBM Corp., Armonk, NY). A two-sided p-value less than 0.05 was defined as the threshold for statistical significance.
Results
The baseline characteristics are listed in Table 1. Among the 979 participants, the mean (SD) age was 55.4 (9.1) years and 341 (34.8%) of them were male. The mean (SD) number of DMVs was 19 (2). The mean (SD) values of the GM fraction and WM fraction of the participants were 0.35 (0.02) and 0.44 (0.03), respectively. The median (interquartile range) values of WMH volumes were 0.79 (0.23 to 2.57) ml. A comparison of the characteristics between the participants in the final analysis and subjects that were not included is provided in supplemental eTable 1.
Baseline characteristics of the 979 participants.
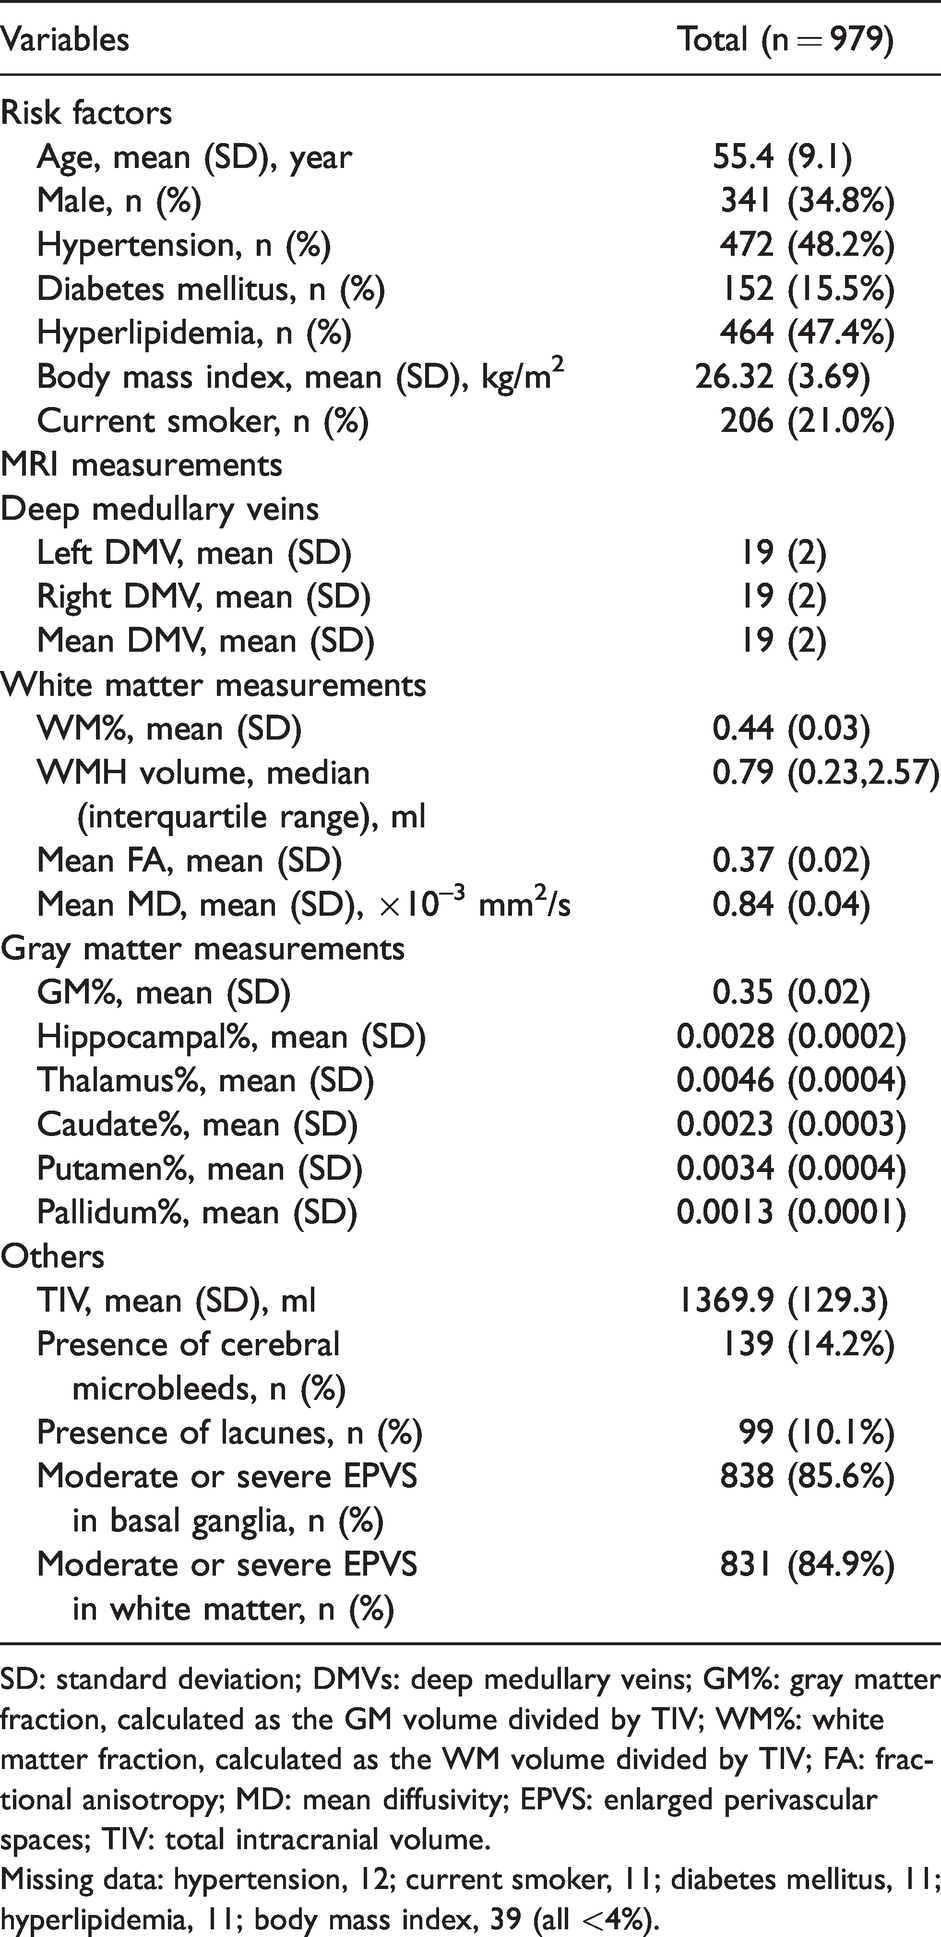
SD: standard deviation; DMVs: deep medullary veins; GM%: gray matter fraction, calculated as the GM volume divided by TIV; WM%: white matter fraction, calculated as the WM volume divided by TIV; FA: fractional anisotropy; MD: mean diffusivity; EPVS: enlarged perivascular spaces; TIV: total intracranial volume.
Missing data: hypertension, 12; current smoker, 11; diabetes mellitus, 11; hyperlipidemia, 11; body mass index, 39 (all <4%).
Relationship between WM microstructure and number of DMVs
Table 2 shows the associations between the number of DMVs with the WMH volume and global mean DTI metrics. After adjusting for age, sex, hypertensive status, smoking status, diabetes mellitus status, and TIV, a low number of DMVs was strongly associated with global mean DTI metrics (b coefficient, 0.19 for FA and −0.20 for MD, per DMV; SE, 0.03 for both; p < 0.001 for both) but not with lg WMH volumes. Also, the mean MD and FA in the normal-appearing WM region had a similar relationship with the number of DMVs, indicating diffused WM microstructural integrity loss.
Associations of the mean number of DMVs with WMH volume and white matter microstructure integrity presented by DTI metrics.
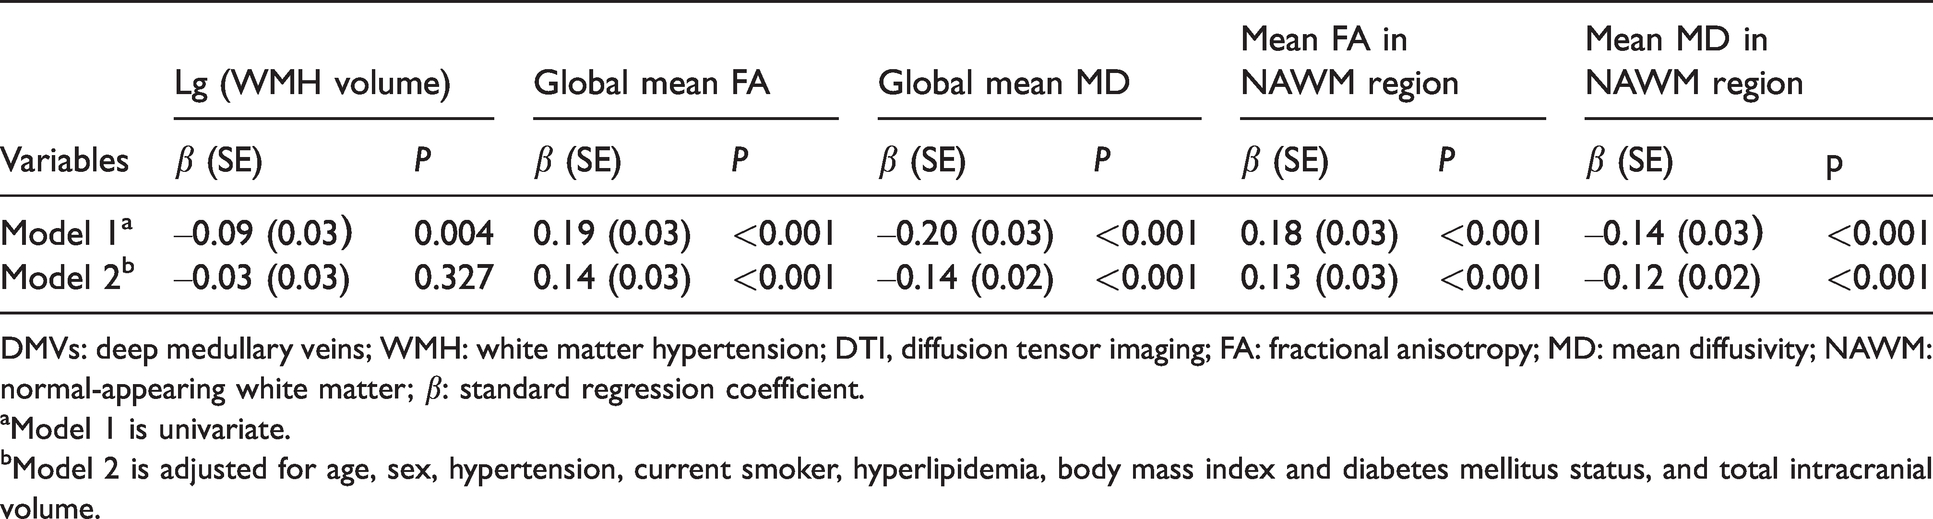
DMVs: deep medullary veins; WMH: white matter hypertension; DTI, diffusion tensor imaging; FA: fractional anisotropy; MD: mean diffusivity; NAWM: normal-appearing white matter; β: standard regression coefficient.
aModel 1 is univariate.
bModel 2 is adjusted for age, sex, hypertension, current smoker, hyperlipidemia, body mass index and diabetes mellitus status, and total intracranial volume.
The TBSS analysis of the association between the number of DMVs and DTI metrics is presented in Figure 2. We found that a lower number of DMVs was strongly correlated with reduced FA and increased MD in multiple regions on the WM skeleton, including the internal and external capsule, corona radiata, posterior thalamic radiation, and inferior and superior longitudinal fasciculus (threshold-free cluster enhancement corrected p-value <0.05, adjusted for age and sex).
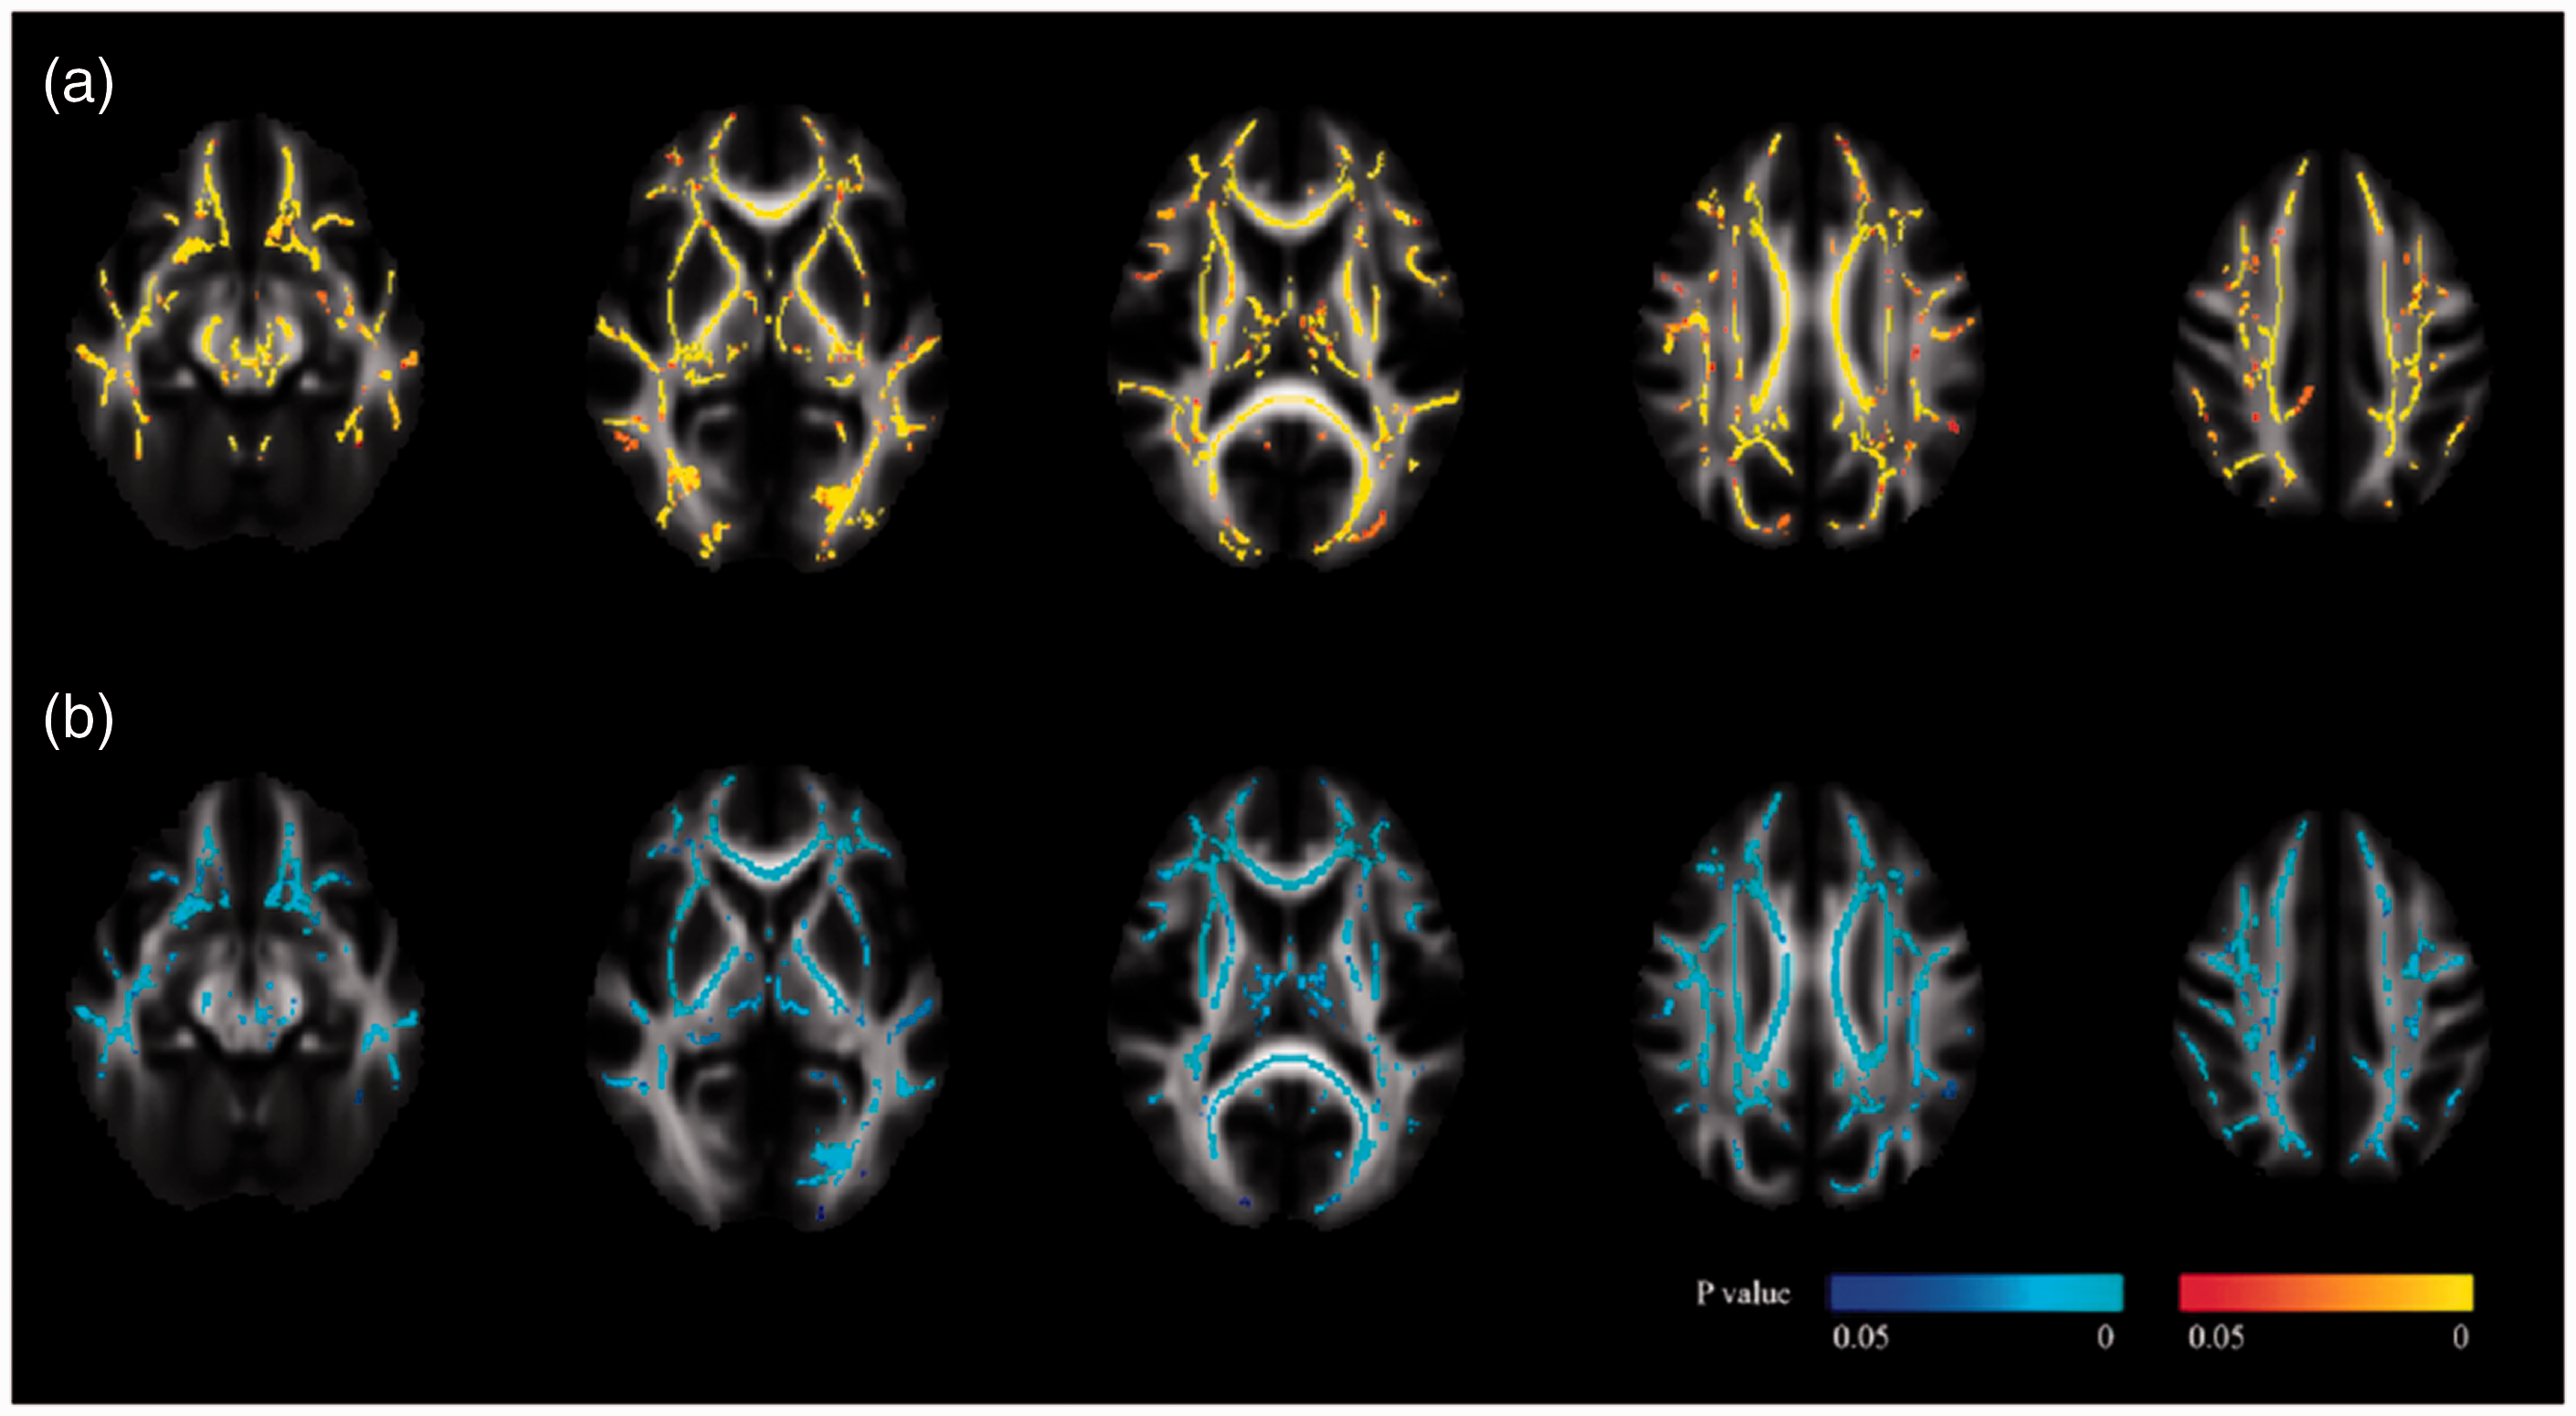
The relationship between the number of deep medullary veins (DMVs) and diffusion metrics. Transversal brain slices show the regions on white matter skeleton where mean diffusivity (a) and fractional anisotropy (b) are related to the number of DMVs (threshold-free cluster enhancement corrected p < 0.05, adjusted for age and sex). The red color map indicates a positive relationship and the blue color map indicates a negative relationship. We found a strong correlation between a higher DMV count and changes in diffusion metrics, including increased fractional anisotropy and reduced mean diffusivity, across various regions on white matter skeleton.
Relationship between brain atrophy and lower number of DMVs
Table 3 summarizes the associations between the number of DMVs and brain structural volumes including the GM fraction, WM fraction, and BPF. In the crude model (model 1), a lower number of DMVs was associated with a lower GM fraction, WM fraction, and BPF (b coefficient, 0.10, 0.10, and 0.12 per DMV, respectively; SE, 0.03, 0.03, and 0.02, respectively). Additional adjustment for age, sex, hypertension, current smoker, hyperlipidemia, body mass index, diabetes mellitus status, the severity of EPVS, presence of lacunes, cerebral microbleeds, and l g (WMHvolume) did not change the significance (model 3).
Associations of the number of DMVs with fractional brain structural volumes.
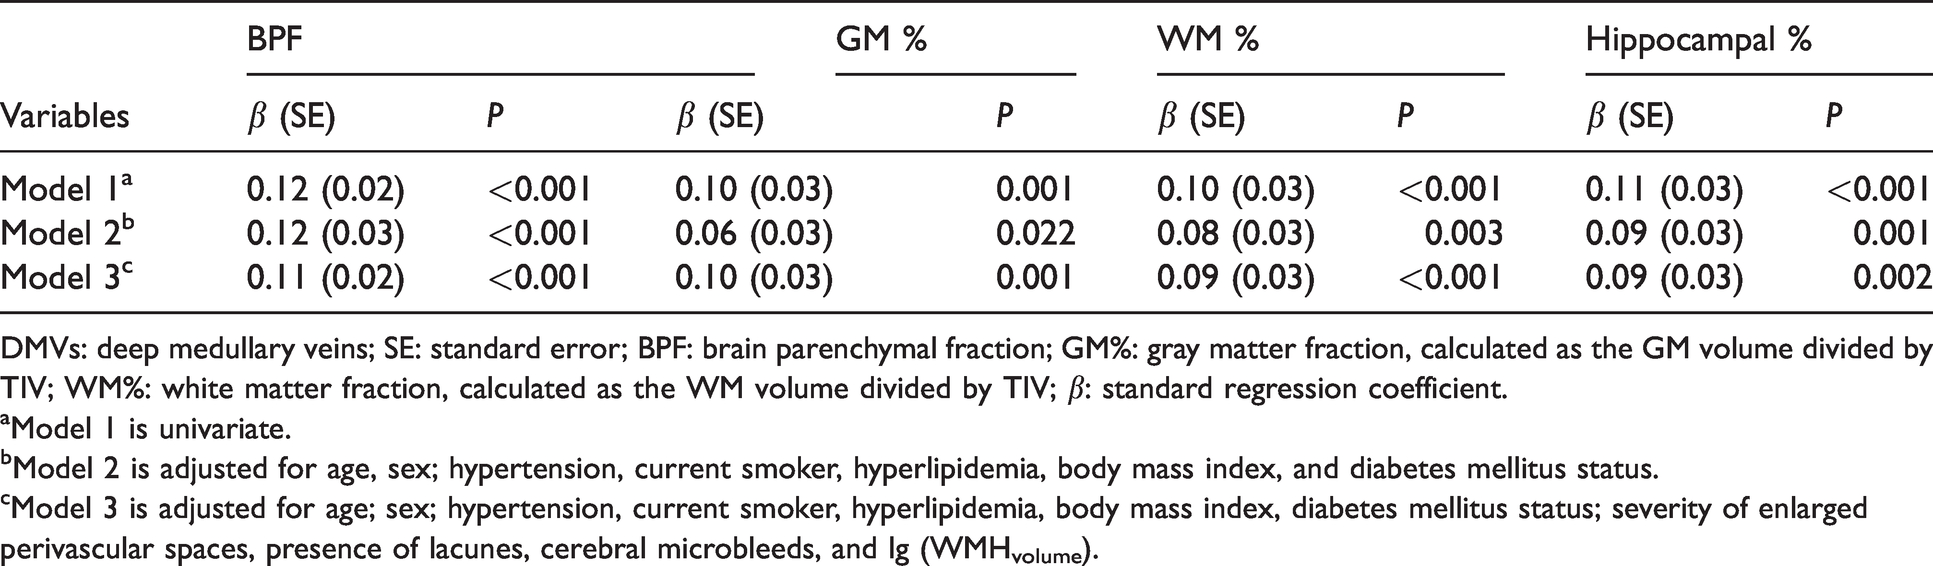
DMVs: deep medullary veins; SE: standard error; BPF: brain parenchymal fraction; GM%: gray matter fraction, calculated as the GM volume divided by TIV; WM%: white matter fraction, calculated as the WM volume divided by TIV; β: standard regression coefficient.
aModel 1 is univariate.
bModel 2 is adjusted for age, sex; hypertension, current smoker, hyperlipidemia, body mass index, and diabetes mellitus status.
cModel 3 is adjusted for age; sex; hypertension, current smoker, hyperlipidemia, body mass index, diabetes mellitus status; severity of enlarged perivascular spaces, presence of lacunes, cerebral microbleeds, and lg (WMHvolume).
Additionally, a significant association was observed between the number of DMVs and the hippocampal fraction (b coefficient, 0.11 per DMV; SE, 0.03; p < 0.001) (model 1); this association remained significant after adjustment for age, sex; hypertension, current smoker, hyperlipidemia, body mass index and diabetes mellitus status (b coefficient, 0.09 per DMV; SE, 0.03; p, 0.001) (model 2). Further adjustment for severity of EPVS, presence of lacunes, cerebral microbleeds, and lg (WMHvolume) did not change this association (b coefficient, 0.073 per DMV; SE, 0.03; p, 0.015) (model 3).
After excluding 47 (4.8%) individuals with large artery stenosis (over 50% of artery diameter), we found associations between the number of DMVs with the WMH volume and DTI metrics, and also with fractional brain structural volumes, including the GM fraction, WM fraction, hippocampal fraction, and BPF, remained the same in all the models.
The brain atrophy regions related to fewer DMVs are presented in Figure 3. VBM results showed several significant clusters of decreased GM density along with fewer DMVs (p < 0.001, adjusted for age, sex, and TIV). The significant regions included the bilateral occipital lobes, middle and inferior temporal lobes, hippocampus, and frontal lobes. A listing of the information of GM atrophy regions is provided in Table 4.
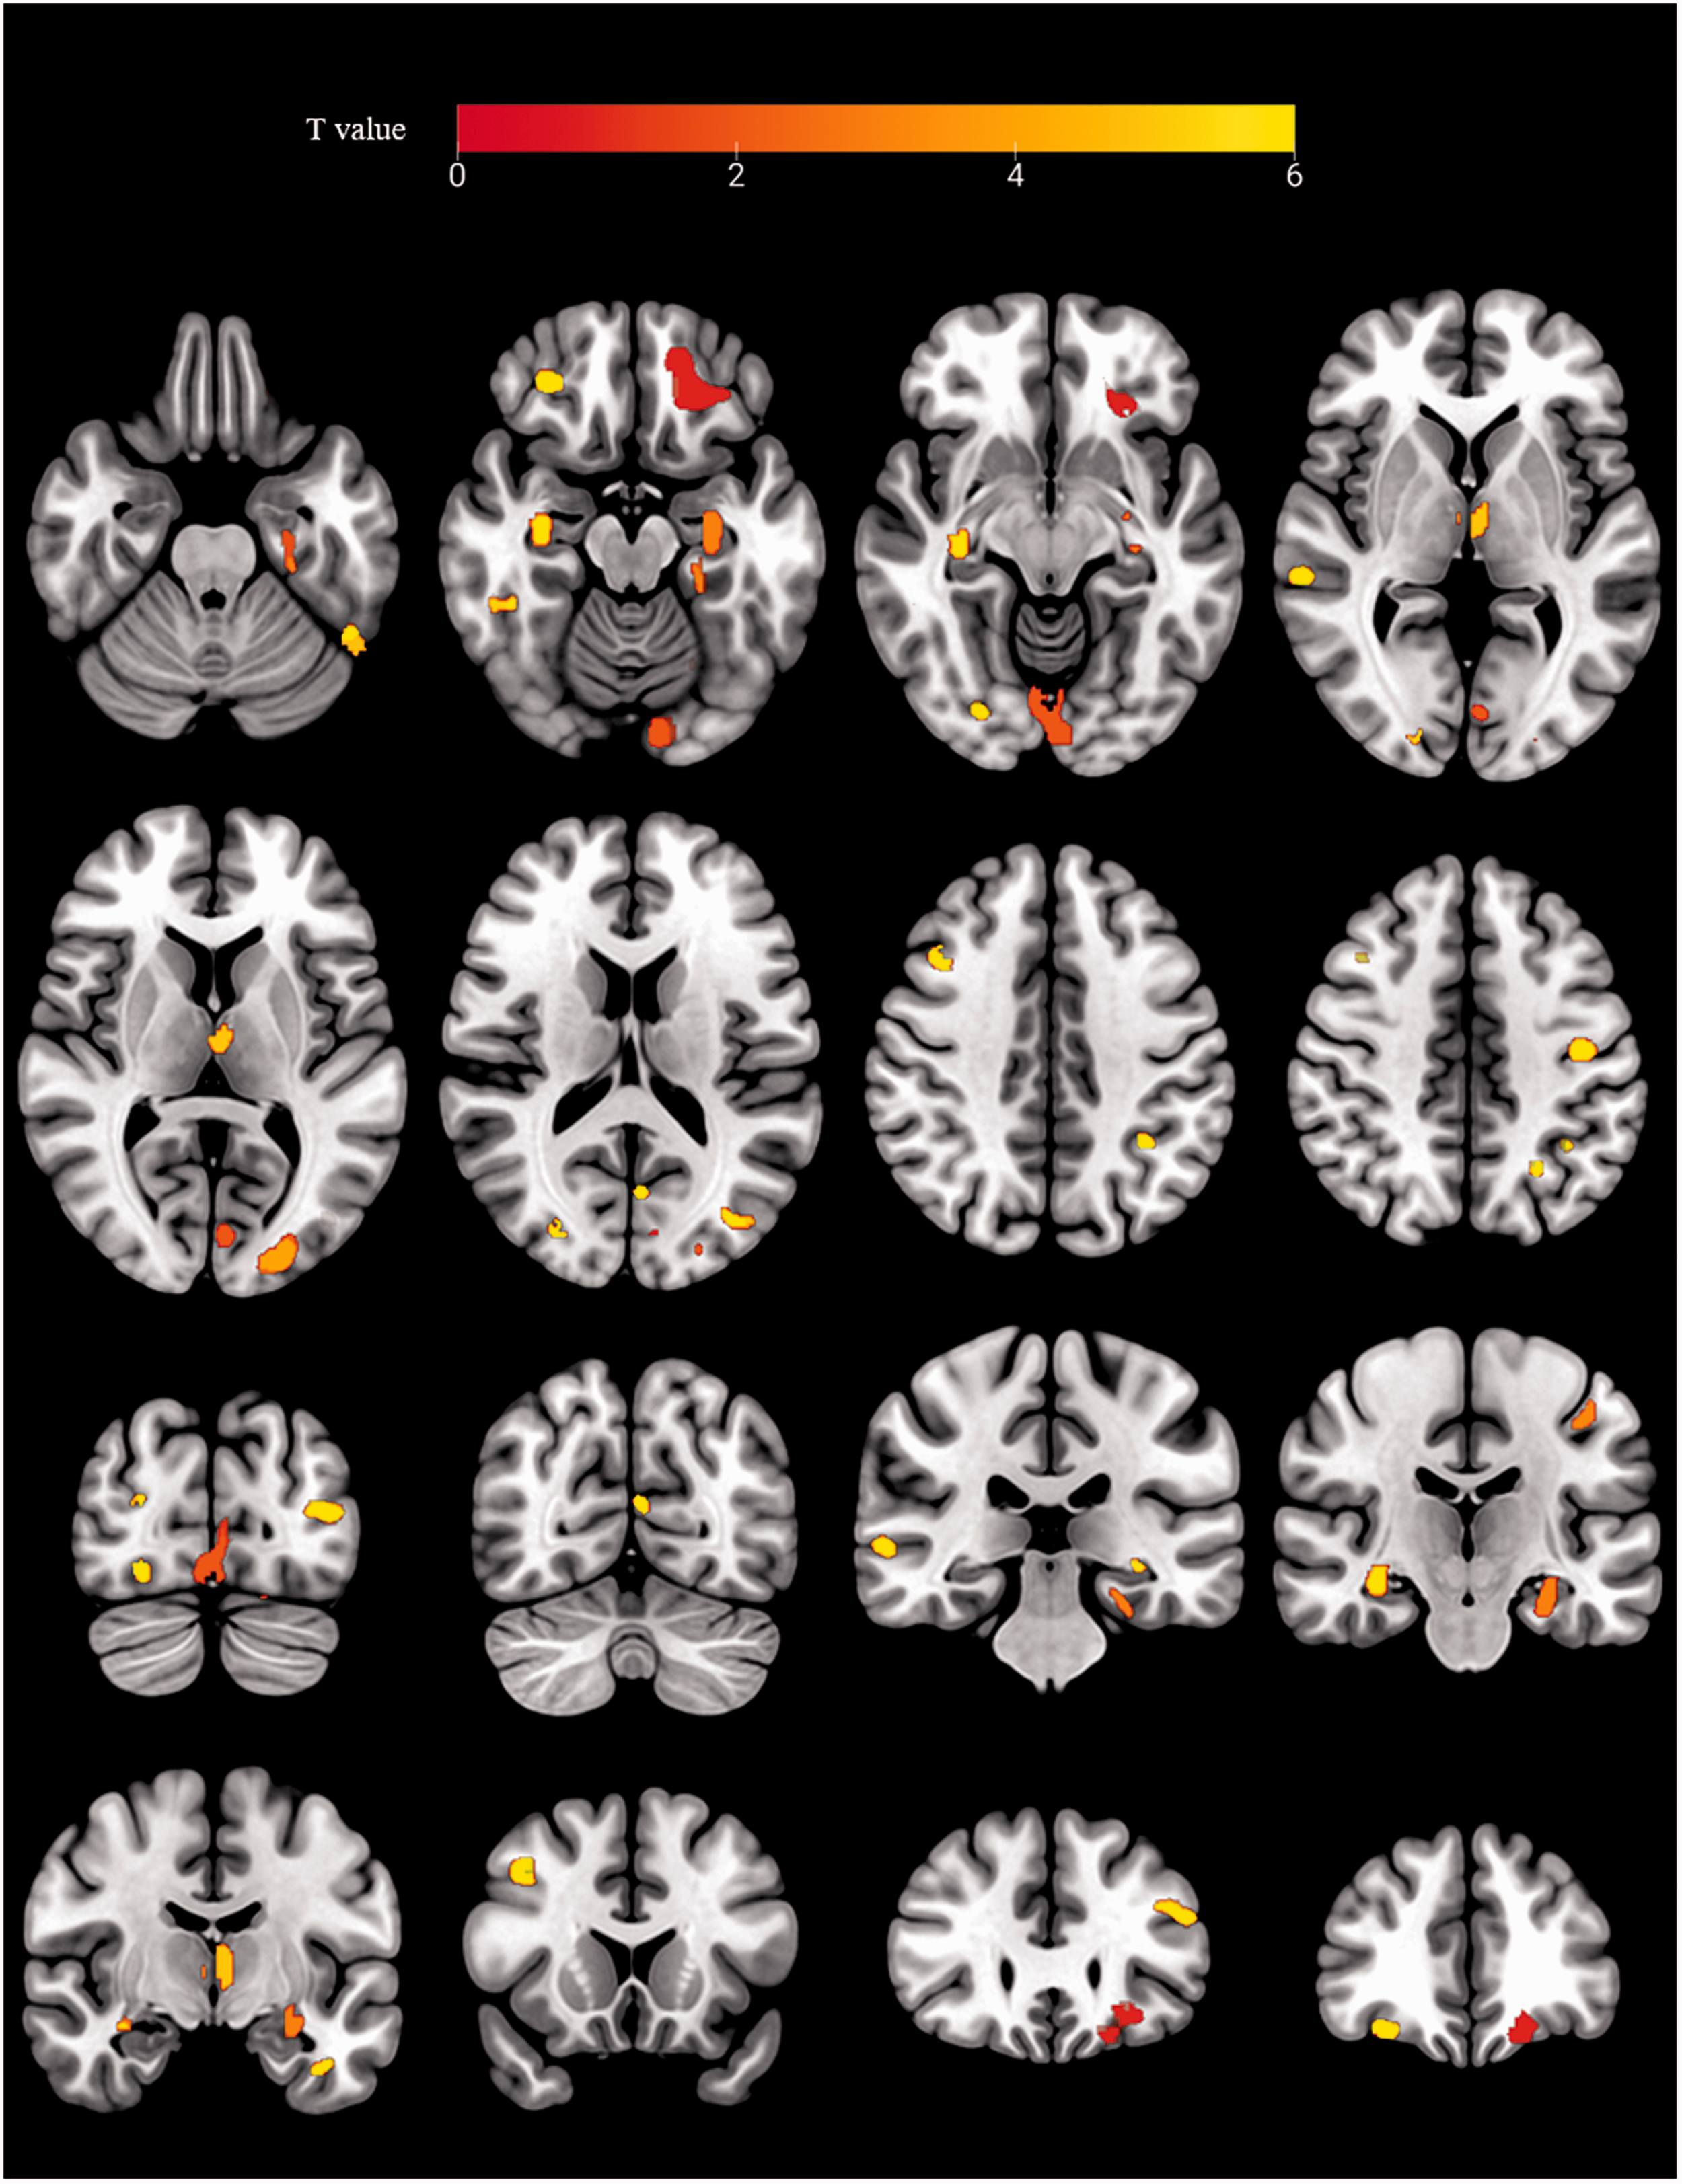
Brain atrophy regions linked to fewer deep medullary veins (DMVs). Transverse and coronal brain slices show the brain regions of atrophy in correlated with lower number of DMVs. Individuals with fewer DMVs showed reduced cortical volumes in various clusters, including the bilateral occipital lobes, middle and inferior temporal lobes, hippocampus, and frontal lobes (p < 0.001, adjusted for age, sex, and total intracranial volume).
Listing of gray matter atrophy regions related to fewer DMVs' number.
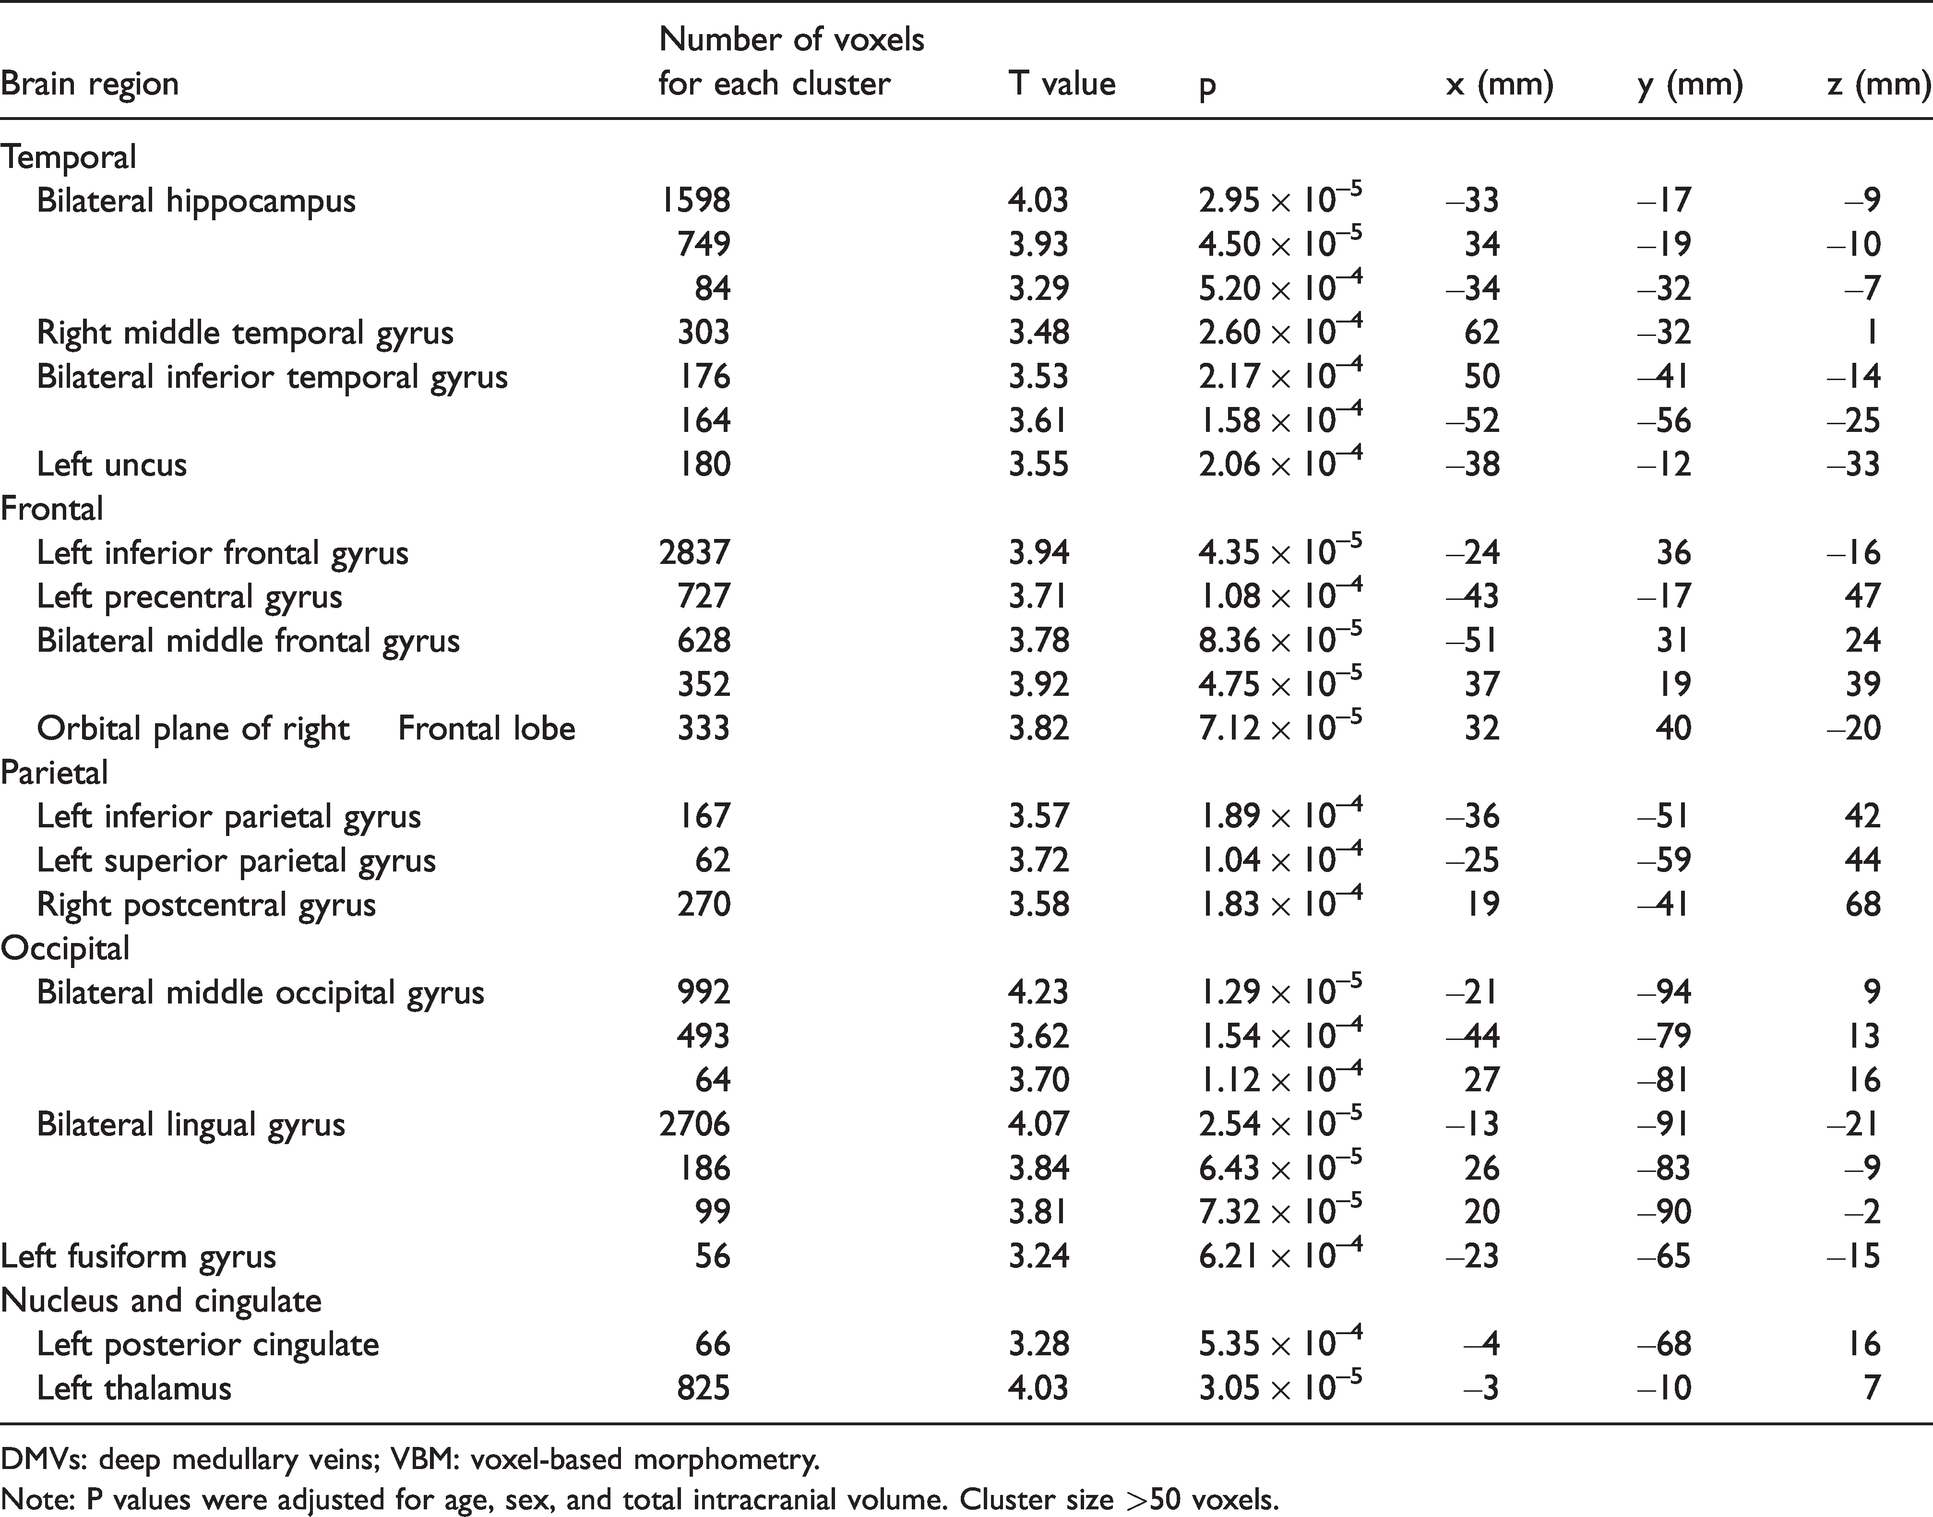
DMVs: deep medullary veins; VBM: voxel-based morphometry.
Note: P values were adjusted for age, sex, and total intracranial volume. Cluster size >50 voxels.
Discussion
In a population-based sample, we observed both cortical and subcortical brain changes related to the number of DMVs. Firstly, a lower number of DMVs was related to lower FA and higher MD in multiple voxels on the WM skeleton, suggesting diffused white matter microstructural integrity loss. Moreover, a lower number of DMVs was significantly related with not just whole brain atrophy, but also GM, WM, and hippocampal atrophy, represented by the fractional volumes. This association was independent of cerebrovascular risk factors and conventional CSVD imaging markers. A significant correlation of DMVs’ reduction and cortical atrophy was observed in multiple clusters, including the bilateral occipital lobes, middle and inferior temporal lobe, hippocampus, and frontal lobes.
Our findings suggest that fewer DMV strongly correlates with the global mean DTI metrics independent of age, sex, vascular risk factors, and TIV, but it does not correlate with WMH volumes. This is in accordance with previous studies which found that the DTI metrics could recognize minor WM damage at an early stage before the appearance of imaging-recognized WMH.13,14 Additionally, widespread WM microstructural damage was found in those with relatively less-visible DMVs; this is consistent with the observation by Guio et al. that the visible DMVs, both within and outside WMH, were significantly lesser in patients with cerebral autosomal-dominant arteriopathy with subcortical infarcts and leukoencephalopathy compared with those in healthy controls. 8 A potential explanation for this is that the pathological changes in venules, such as VC, cause the dysfunction of interstitial fluid drainage and edema in deep WM areas.2,3,15,16 As a result, the accumulation of interstitial fluid is likely accompanied by an accumulation of toxic wastes, which might provoke an inflammatory response toward myelin. 17 Additionally, the stenosis or occlusion of venules might increase vascular resistance and exacerbate the hypoperfusion of WM. However, the causality of the relationship between DMV and WM structural changes should be investigated in future longitudinal studies.
Recently, there has been an increased interest in studying the pathology of veins and venules in the context of CSVD and dementia. 18 We found it interesting that a lower number of DMVs is significantly related to brain atrophy, especially in the middle and inferior temporal lobes and hippocampus; these are regions predisposed to atrophy in patients with Alzheimer's disease, and they are distinguished from the regions affected by normal aging. 19 The findings of the present study, as well as findings of a previous 7-T MRI study that DMVs abnormality is more prominent in patients with early cognitive impairment than healthy controls, 20 indicate that neurodegenerative processes may play a role in the pathogenetic mechanisms of cerebral small venules disease. In the light of the recent studies on the perivenous lymphatic drainage system, we surmise the potential mechanism is that the decreased distribution or stenosis of venules leading to the impedance of the efflux of perivenous glymphatic fluid and inadequate drainage of glymphatic clearance, which further cause toxic accumulation and structural injury in the cortex.18,21 However, no pathological study has investigated whether the change in venules is associated with brain atrophy. Considering the present evidence and the limited number of studies that have investigated this topic, cerebral venules deserve more attention and further investigation.
There is an issue that needs to be considered while interpreting the number of DMVs counted on SWI. Since the detection of veins using SWI largely relies on intravascular deoxyhemoglobin, the visibility of venules may be significantly high when there is severe stenosis in upstream arteries because of the increased concentration of deoxyhemoglobin related to low perfusion. 22 In this population-based sample, the prevalence of large artery stenosis (over 50% of artery diameter) was just 4.8%; thus, it had minimal impact on our results. However, the images of venules in stroke patients need to be interpreted with caution, as the prevalence of large artery stenosis in these patients could be much higher.
Another methodological issue of the present study is the ignorance of co-localization between DMV in WM regions which may impact the DTI metrics. Due to the small volume of vessels, the corresponding interference on global mean DTI metrics is considered low. Also, bias from this co-localization has been diminished by analysis of DTI metrics on the WM skeleton.
The strengths of our study include the large sample size and middle-aged community population-based design, in contrast to most previous studies that have investigated specific populations with dementia or manifest CSVD. Furthermore, to the best of our knowledge, this is the first voxel-based study of DMVs and cerebral structure in a large population. However, several limitations should be considered. First, it was a cross-sectional study. The causality of the conclusions drawn above was difficult to prove, and follow-up studies are required to clarify the impact of the disruption of DMVs on brain structure. Second, the visual assessment method of counting DMVs could have some errors, However, the intra- and inter-rater agreement in our study indicated good reliability of this method. To date, neither manual nor automatic segmentation has been accepted as a unified method because of the lack of studies in this field. In addition, the global venules apart from DMV were not assessed, thus, analysis of the DMVs’ regional disruption and brain structural abnormality was not available. Future studies are expected on regional analysis of the morphology of DMV and brain structures.
In conclusion, the disruption of DMVs is associated with widespread structural abnormalities in the brain including WM microstructural damage and GM atrophy in the general population. Our result indicates that cerebral small venules disease may play a role in both WM lesions and GM degeneration, whereas previous studies on brain vessels have mainly focused on arteries and arterioles. Considering that disease processes may substantially differ between small venules and arterioles, the pathogenic mechanisms involving venules deserves more research attention and further investigation.
Supplemental Material
sj-pdf-1-jcb-10.1177_0271678X211065210 - Supplemental material for Deep medullary veins are associated with widespread brain structural abnormalities
Supplemental material, sj-pdf-1-jcb-10.1177_0271678X211065210 for Deep medullary veins are associated with widespread brain structural abnormalities by Zi-Yue Liu, Fei-Fei Zhai, Dong-Hui Ao, Fei Han, Ming-Li Li, Lixin Zhou, Jun Ni, Ming Yao, Shu-Yang Zhang, Li-Ying Cui, Zheng-Yu Jin and Yi-Cheng Zhu in Journal of Cerebral Blood Flow & Metabolism
Footnotes
Funding
The author(s) disclosed receipt of the following financial support for the research, authorship, and/or publication of this article: National Natural Science Foundation of China (No. 81971138), the Chinese Academy of Medical Sciences (CAMS) Innovation Fund for Medical Sciences (CIFMS) (CIFMS #2017-I2M-3-008) and the Strategic Priority Research Program “Biological basis of aging and therapeutic strategies” of the Chinese Academy of Sciences (grant XDB39040300).
Declaration of conflicting interests
The author(s) declared no potential conflicts of interest with respect to the research, authorship, and/or publication of this article.
Authors’ contributions

| Name | Contribution |
|---|---|
| Zi-Yue Liu | Analyzed the data; Major role in the acquisition of data; drafted/revised the manuscript for content. |
| FeifeiZhai | Analyzed the data; Major role in the acquisition of data; Interpreted the data; revised the manuscript for content. |
| Dong-Hui Ao | Analyzed the data; Major role in the acquisition of data. |
| Fei Han | Analyzed the data; Major role in the acquisition of data. |
| Ming-Li Li | Analyzed the data; Major role in the acquisition of data. |
| Lixin Zhou | Major role in the acquisition of data. |
| Jun Ni | Major role in the acquisition of data. |
| Ming Yao | Major role in the acquisition of data. |
| Shuyang Zhang | Design and conceptualized study. |
| Liying Cui | Design and conceptualized study. |
| ZhengyuJin | Design and conceptualized study. |
| Yi-Cheng Zhu | Design and conceptualized study; Major role in the acquisition of data; Interpreted the data; revised the manuscript for content. |
Supplemental material
Supplemental material for this article is available online.