
Abstract
Blood oxygenation level-dependent (BOLD) or arterial spin labeling (ASL) MRI with hypercapnic stimuli allow for measuring cerebrovascular reactivity (CVR). Hypercapnic stimuli are also employed in calibrated BOLD functional MRI for quantifying neuronally-evoked changes in cerebral oxygen metabolism (CMRO2). It is often assumed that hypercapnic stimuli (with or without hyperoxia) are iso-metabolic; increasing arterial CO2 or O2 does not affect CMRO2. We evaluated the null hypothesis that two common hypercapnic stimuli, ‘CO2 in air’ and carbogen, are iso-metabolic. TRUST and ASL MRI were used to measure the cerebral venous oxygenation and cerebral blood flow (CBF), from which the oxygen extraction fraction (OEF) and CMRO2 were calculated for room-air, ‘CO2 in air’ and carbogen. As expected, CBF significantly increased (9.9% ± 9.3% and 12.1% ± 8.8% for ‘CO2 in air’ and carbogen, respectively). CMRO2 decreased for ‘CO2 in air’ (−13.4% ± 13.0%, p < 0.01) compared to room-air, while the CMRO2 during carbogen did not significantly change. Our findings indicate that ‘CO2 in air’ is not iso-metabolic, while carbogen appears to elicit a mixed effect; the CMRO2 reduction during hypercapnia is mitigated when including hyperoxia. These findings can be important for interpreting measurements using hypercapnic or hypercapnic-hyperoxic (carbogen) stimuli.
Introduction
Advanced MRI techniques provide an avenue to image functional parameters such as oxygen extraction fraction (OEF), cerebral blood flow (CBF), cerebral blood volume (CBV), and the cerebral metabolic rate of oxygen consumption (CMRO2). Thereby, these MRI techniques can provide metabolic and hemodynamic metrics similar to those obtained using PET, but non-invasively and at higher spatial and temporal resolution. One such approach is calibrated fMRI (or calibrated BOLD) that can be used to scale task-related BOLD fMRI responses to the underlying CMRO2 changes. 1 This technique has found applications to examine metabolic demands associated with functional tasks but also ageing and brain disease.2–5
The BOLD calibration models rely on measurements of both BOLD and CBF signal changes during either hypercapnic respiratory challenges or a combination of hypercapnic-hyperoxic challenges.6–9 Modulations in arterial gas tensions evoke predictable physiological responses that are used to contextualize fMRI signal changes.10–13 In short, hypercapnia is a potent vasodilator that leads to significant increases in CBV, CBF, and accompanying increases in venous blood oxygenation, while hyperoxia is thought to only modulate the blood oxygenation through plasma-dissolved O2 and increased hemoglobin (Hb) bound O2. This dual-action convolutes the net hemodynamic and metabolic response through its influence on the oxygen saturation curve via the Bohr effect (i.e. how CO2 affects the binding affinity of Hb for O2) and the Haldane effect (i.e. how O2 affects the binding affinity of Hb for CO2). An original assumption during the early development of the calibration model was that increasing arterial levels of CO2 and O2 had a negligible effect on neuronal metabolism and thus CMRO2. 4 This notion has since been challenged, and correction methods have been devised to account for the possibility that changing arterial O2 or CO2 tensions do indeed modulate neuronal functioning and CMRO29,11–18 Previous simulation work on calibrated BOLD models has reported that for non iso-metabolic hypercapnic challenges for calibration, one can find a significant error in estimating the basal OEF and activation-induced CMRO2 changes in calibrated BOLD studies.10,19,20 Correction methods for situations in which arterial O2 and CO2 tensions change simultaneously have not yet been adopted.
Quantitative assessment of venous oxygenation (Yv), while considering the combined effects of changing CBF and OEF, provides an avenue to examine the iso-metabolic assumptions associated with respiratory stimuli via inferred changes in CMRO2. This can be performed non-invasively using a technique known as T2 -Relaxation-Under-Spin-Tagging (TRUST) MRI. 21 Direct knowledge of the effects that changing arterial O2 and CO2 tensions have on CMRO2 has widespread implications. For instance, appropriate corrections can improve the accuracy of fMRI techniques for neuroscientific applications, refine BOLD signal models that simulate magnetic susceptibility effects under different physiological conditions,22–24 and improve the interpretation of CVR for clinical applications via a more robust understanding of concomitant CMRO2 changes.25–28
The use of respiratory challenges during MRI in various patient populations is becoming more widespread. In many of these cases, the pathophysiology of neurological and cerebrovascular disease leads to altered cerebral metabolism. With this in mind, it becomes essential to identify co-factors that influence cerebral metabolism and are accounted for accordingly. Therefore, this study aimed to evaluate the assumption that hypercapnic stimuli applied in healthy adults are iso-metabolic. To achieve this, we used ASL and TRUST MRI for measures of global CBF and Yv to compare measures of CMRO2 under two commonly used hypercapnic conditions (‘CO2 in air’: 5% CO2 + 21% O2 + 74% N2; and carbogen: 5% CO2 and 95% O2). The CMRO2 value for each condition was calculated and compared with the CMRO2 value obtained during the breathing of medical air (referred to as ‘room-air’).
Methods
Volunteer demographics
Healthy volunteers (n = 10; 3 F/7 M; age = 29.4 ± 3.4 years) provided informed, written consent following the ethical standards of the Vanderbilt University Institutional Review Board, the Vanderbilt University Human Research Protection Program, as well as with the Helsinki Declaration of 1975 (and as revised in 1983). All components of this study were performed in compliance with the Health Insurance Portability and Accountability Act. All study components were reviewed and approved by the local Institutional Review Board (IRB Study 111116).
MRI experiment
All MRI measurements were performed at 3.0 T (Philips Healthcare, Best, The Netherlands). For a schematic overview of the MRI experiment see Figure 1. Participants were fitted with a nasal cannula (Salter Labs, Arvin, CA, USA, no. 4000) to monitor the end-tidal partial pressure of CO2 (pEtCO2) and a custom non-rebreathing face mask (Salter Labs, no. 8005) for gas stimulus administration. The masks were close-fitting and covered the nose and mouth. Elastic straps were used to reduce leakage. Gases were delivered from compressed cylinders outside the scan room and administered at 12 L/min. This flow rate was optimized in preliminary studies and was found to provide sufficient gas delivery in the presence of potential small leaks in the mask, while also maintaining comfort. Physiological monitoring was performed using an Invivo Research (Gainesville, FL, USA, 3150 MRI) monitor and a remote monitor (Millenia Vital System, Gainsville, FL, USA, 3115 MVS). Monitored parameters included partial pressure of end-tidal CO2 (pEtCO2 in mmHg), and peripheral arterial oxygenation (Ya). The repeatability of this setup has been reported previously 29 and a similar setup is used in a previously reported work. 24
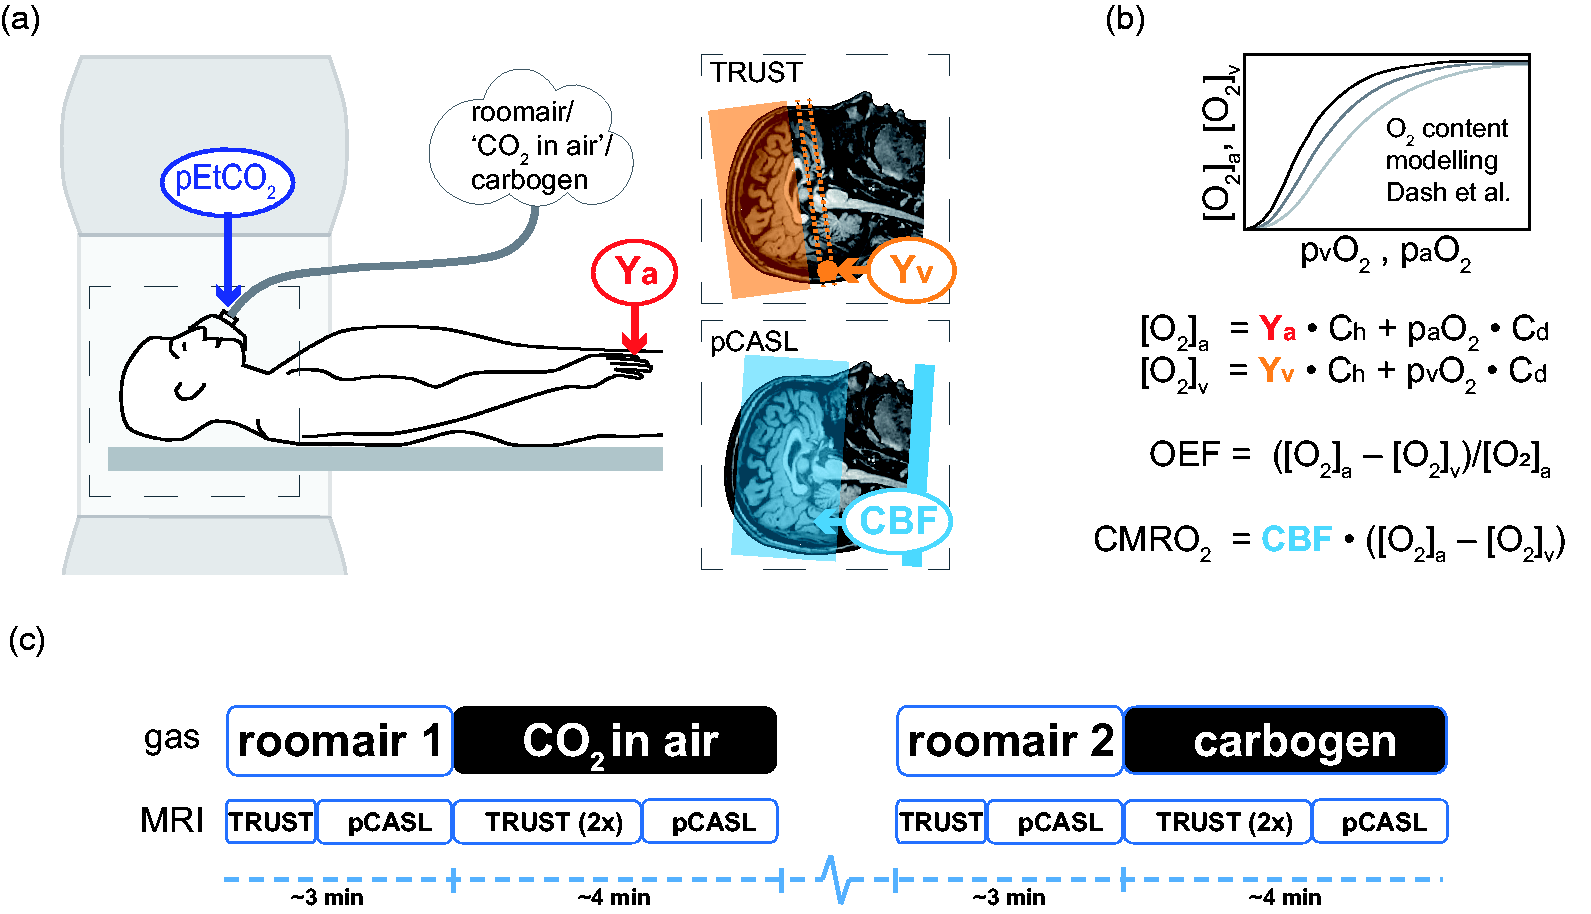
Schematic overview of the experimental design. a) the subject in the MRI with the three different inspired gases and the physiological measurements of pEtCO2 (purple) from the breathing mask, arterial oxygenation Ya (red) from a pulse-oximeter, venous oxygenation Yv (orange), and CBF (blue). Conceptual planning for cerebral venous oxygenation (Yv) using T2-relaxation-underspin-tagging (TRUST) MRI is depicted by the orange region, where the dotted lines represent the measurement plane and the circle the location of the occipital part of the superior sagittal sinus. Whole-brain CBF values were acquired using a pseudo-continuous arterial spin labeling pCASL sequence (planning depicted in blue). b) The [O2]a, [O2]v, paO2, and pvO2 values were calculated using a physiological blood oxygen content model (Dash et al.) and were applied for computing CMRO2 and OEF using the formulas shown. c) Experimental design of the gas delivery paradigm. The dashed blue line represents the rest period (∼30 s) given to allow pEtCO2 and Yv to equilibrate. The order of ‘CO2 in air’ and carbogen conditions and the TRUST and pCASL scan was randomized between subjects.
Venous oxygenation (Yv) MRI measurements were performed on the occipital part of the superior sagittal sinus using TRUST MRI (TR = 3s, TI = 1.2s, voxel size = 3.4 × 3.4 × 5 mm3, four T2 weightings (effective TEs: 0, 40, 80, and 160 ms), with a τCPMG = 10 ms, and 3 averages per T2 weighting yielding a total scan duration of 1 min 12 s.30,31 CBF measurements were performed using pCASL MRI with a multi-slice echo-planar imaging readout. Acquisition parameters were post-label delay (PLD) = 1.7 s, label duration =1.5 s, TR/TE = 3900/13.1 ms, measurements = 13, field-of-view = 240 × 240 × 119 mm3, spatial resolution = 3 × 3 × 7 mm3, slices = 17, SENSE factor = 1.8. The TRUST scan was repeated once for the hypercapnic breathing conditions but was only performed once for the room-air conditions. TRUST and pCASL data were sequentially acquired throughout the following paradigm: 3 min room-air (‘room-air 1’) – ∼4 min of 5% CO2 balanced with medical-grade atmospheric air (5% CO2/21% O2/74% N2; ‘CO2 in air’: as described earlier 24 ) – 3 min room-air (‘room-air 2’) – ∼4 min carbogen (5% CO2, 95% CO2; Figure 1). For each hypercapnic breathing condition, the two Yv values were first estimated from the two TRUST measurements and subsequently averaged into a single Yv value per condition. In addition, a calibration M0 scan was acquired for both groups for CBF quantification, using identical acquisition geometry as the pCASL scan, but with TR = 15 s, and the spin labeling pulse train turned off. The order of ‘CO2 in air’ and carbogen and the TRUST and pCASL scan was randomized between subjects and time (∼30 s) was allowed for pEtCO2 and Yv to equilibrate between the two hypercarbic conditions.
Analysis
CBF quantification
CBF quantification was performed using FSL BASIL; 32 pCASL label and control images were pair-wise subtracted, and a single-compartment kinetic model was applied to the data using tissue-blood partition coefficient of water λ = 0.9 ml/g and pCASL labeling efficiency α = 0.85. 33 Slice time correction was incorporated by using slice-specific PLD values. For equilibrium blood water magnetization, the calibration M0 image was used. An arterial blood water T1 (T1a) reduction from 1.65 s (used for the normoxic conditions) to 1.49 s (hyperoxic conditions) was used to account for hyperoxia-dependent changes related to the carbogen condition, as reported previously. 34
For tissue T1 and arterial (bolus) arrival time, gray matter values (GM) were used in BASIL FSL, 1.3 s 35 and 1.3 s29,36 for pCASL, respectively, including a GM arrival time reduction of 5% for the hypercapnic conditions.29,36 Global CBF was estimated using subject-specific brain tissue segmentation masks and associated tissue probability maps of GM and white matter (WM). We focused on global CBF as opposed to solely GM CBF as the TRUST measurement for Yv(%) also samples a global value. Tissue segmentation was performed on the M0 image that exhibited adequate GM and WM contrast using FSL FAST. 37 The global CBF estimation excluded subarachnoidal space and ventricular cerebral spinal fluid (CSF), cerebellum and brainstem regions. CSF regions were removed using the subject-specific segmentations masks from FSL FAST, the cerebellum and brainstem regions were removed using the MNI Structural Atlas and the Harvard-Oxford Structural Atlas 38 MNI based (Montreal Neurological Institute) ROIs, respectively, available in FSL. 39 Segmentation and atlas ROIs were constrained by the subject’s whole-brain mask obtained from the M0 image using FSL BET. 40 Note that GM values were used for the tissue T1 and arterial arrival time for all voxels using FSL BASIL for the CBF quantification. However, these values are not appropriate for WM CBF included in this study to obtain global CBF and can lead to an underestimation for WM CBF (See Supplementary Material Figure 1). We computed a correction factor for WM CBF using the WM tissue T1 and arterial arrival time, 0.84 s 35 and 1.7 s, 36 respectively, as recently reported by Juttakonda et al. 36 (see Supplementary Material for computation). Average global CBF was recomputed by summing the GM and WM CBF maps weighted by the tissue probability maps and the WM correction factor for WM (∼1.20, see Supplementary Material and Supplementary Figure 1). Voxels with outlier CBF values were discarded for absolute CBF values larger than two standard deviations above the mean global CBF, i.e. |CBFvoxel| > mean (global CBF) ± 2 std (global CBF). To visualize the group average CBF map results, the subjects’ CBF maps were first spatially normalized to the standard MNI 2 mm3 stereotaxic space using FSL FLIRT with 12 degrees of freedom affine registration and sinc interpolation. 41 The subject averaged pCASL control image was used as an intermediate step.
CMRO2 and OEF estimation
Calculation of Yv from the TRUST MRI data was done using the method described previously.
13
For the repeated scans, i.e. for the ‘CO2 in air’ and ‘carbogen’ conditions, the fitted Yv values were averaged. To account for the plasma dissolved O2 present during the hyperoxic condition, we computed the total arterial O2 content ([O2]a), venous O2 content ([O2]v), and partial pressure of venous O2 (pvO2) using the physiological model by Dash et al.
42
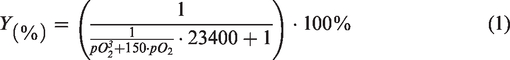
that models the blood O2 and CO2 content by generating the hemoglobin-O2 and CO2 dissociation (saturation) curve and computing the plasma-dissolved O224,42 The model takes into account the Bohr effect for which O2 binding to hemoglobin is inversely related to the presence of CO2 by using the measured pEtCO2 (see Table 1). This will yield subject-specific and breathing condition-specific hemoglobin O2 saturation curves, dependent on blood pO2 and pCO2. We will show the O2 saturation curve by Dash et al.
42
and the commonly used saturation curve by Severinghaus (1), that depends only on the pO2:
43
Group average cerebral blood flow (CBF), venous oxygenation (Yv), oxygen extraction fraction (OEF), and cerebral metabolic rate of oxygen (CMRO2) results for the room-air, ‘CO2 in air’ and carbogen breathing conditions. The group average change in end-tidal CO2 (pEtCO2), global CBF, Yv, OEF, and CMRO2 are also shown.
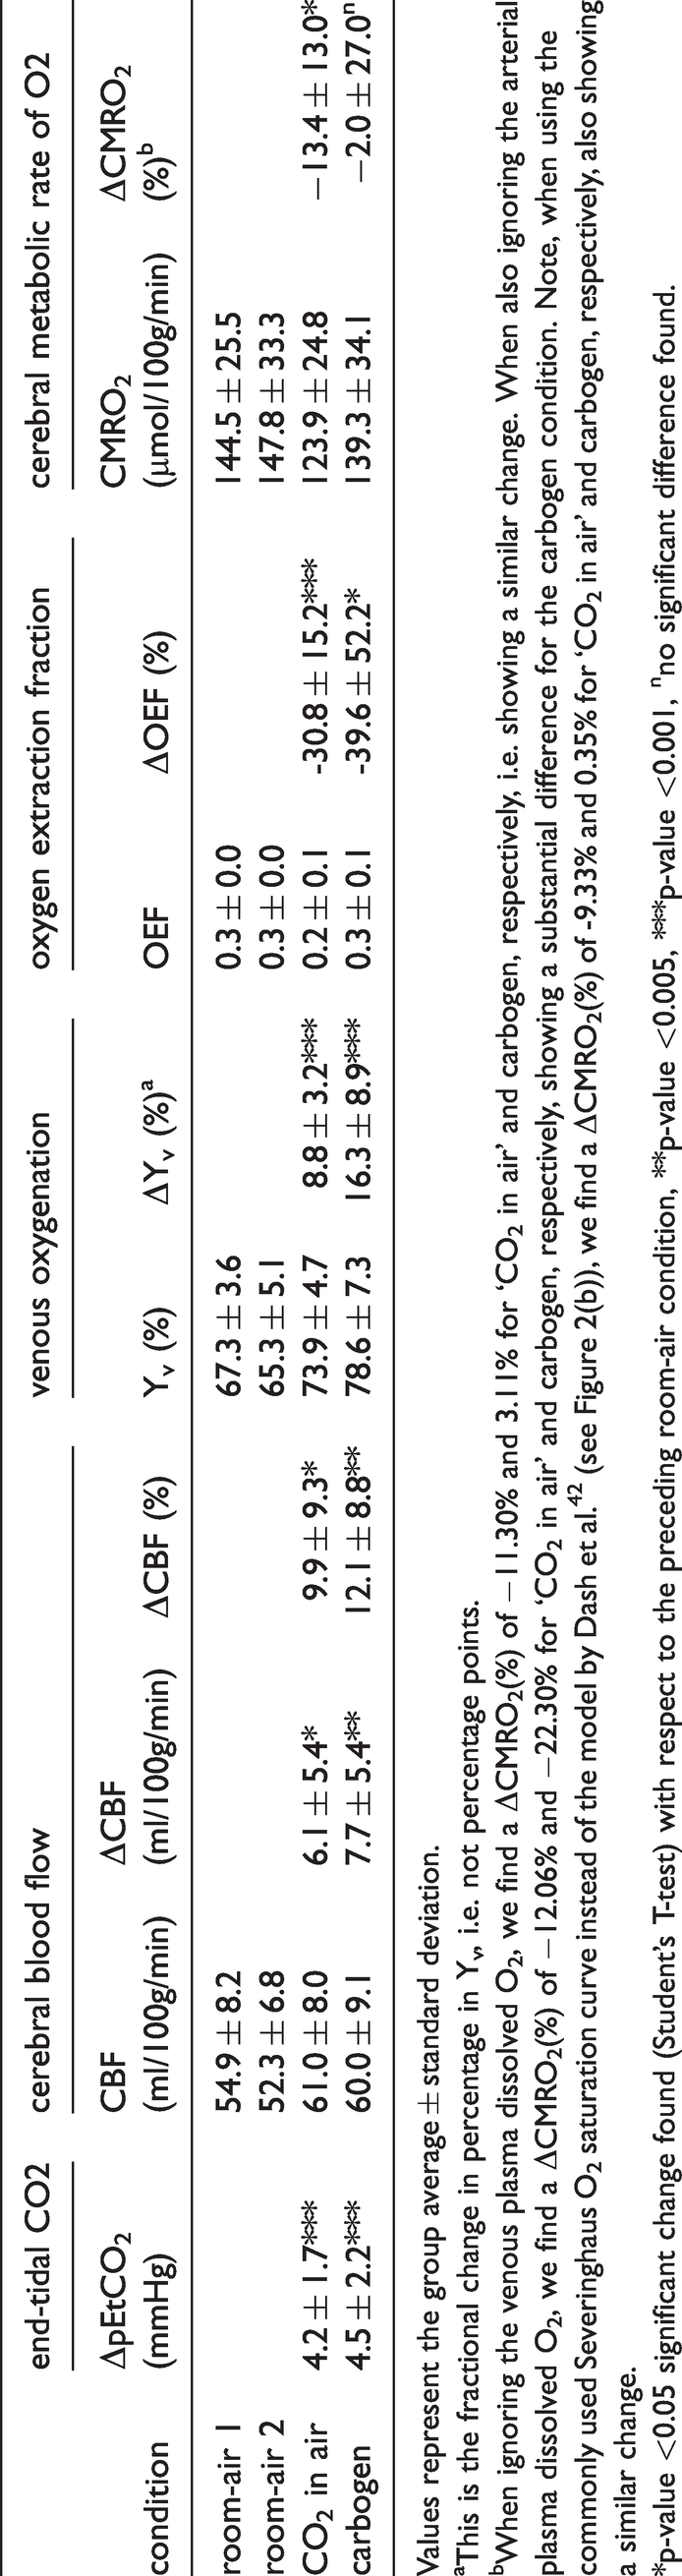
Values represent the group average ± standard deviation.
aThis is the fractional change in percentage in Yv, i.e. not percentage points.
bWhen ignoring the venous plasma dissolved O2, we find a ΔCMRO2(%) of −11.30% and 3.11% for ‘CO2 in air’ and carbogen, respectively, i.e. showing a similar change. When also ignoring the arterial plasma dissolved O2, we find a ΔCMRO2(%) of −12.06% and −22.30% for ‘CO2 in air’ and carbogen, respectively, showing a substantial difference for the carbogen condition. Note, when using the commonly used Severinghaus O2 saturation curve instead of the model by Dash et al. 42 (see Figure 2(b)), we find a ΔCMRO2(%) of -9.33% and 0.35% for ‘CO2 in air’ and carbogen, respectively, also showing a similar change.
*p-value <0.05 significant change found (Student’s T-test) with respect to the preceding room-air condition, **p-value <0.005, ***p-value <0.001, nno significant difference found.
The partial pressure of alveolar O2 (pAO2) was assumed 104 mmHg respectively for the ‘CO2 in air’ and room-air conditions. 44 For these normoxic conditions, alveolar, pAO2, was converted to arterial O2 pressure (paO2) using the alveolar-arterial O2 pressure gradient, which depends on the pAO2 and age. 12 For the carbogen condition, we used the values from previous reports on direct measurements of arterial partial pressure PaO2 for carbogen in healthy subjects that used an arterial line during PET examination:
paO2,carbogen = 460 mmHg.45,46 The venous partial pressure of CO2 (pVCO2) was offset by +5 mmHg compared to the measured pEtCO2. 44 The pvCO2 estimates are needed to incorporate the Bohr effect; when locally CO2 partial pressure is increased, the hemoglobin affinity for O2 is decreased, which we can expect in peripheral and cerebral tissue and under hypercapnic conditions resulting in a right shift of the HbO2 curve. The mathematical model put forward by Dash et al. 42 incorporates the pvCO2 in the KHbO2 factor, the apparent equilibrium constant for binding O2 to hemoglobin. The KHbO2 factor itself is a complex equation describing the binding kinematics of O2 to hemoglobin (see equations 1a,b and 3a,b in Dash et al. 42 ) Note that changes in pH, temperature, and 2,3 -DPG will also shift the HbO2 curve and can in principle be incorporated into the physiological model. Hematocrit (Hct) values of 0.42 for males and 0.4 for females were assumed.
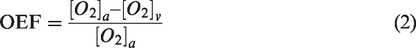
OEF and CMRO2 were computed using formulas (2) and (3) using equations (4) and (5) for the calculation of [O2]a and [O2]v, i.e. the sum of the hemoglobin bound O2 and plasma dissolved O2 content.

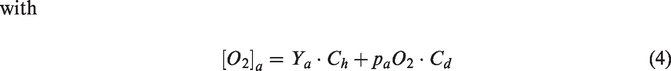
Constants Ch (912 μmol O2/100 ml blood for a Hct of 0.45, but adjusted for the assumed Hct values for male and female subjects 42 ) and Cd (0.138 μmol O2/100 ml blood/mmHg paO2) are the hemoglobin O2 carrying capacity and blood plasma O2 dissolving capacity, respectively. 13 Dash et al. 2016 model 42 can be downloaded (JSIM and Matlab code) from the NSR Physiome Project repository that contains integrative and descriptive models on human physiology: www.imagwiki.nibib.nih.gov/physiome/jsim/models/webmodel/NSR/SHbO2CO2Dash2016/.
Effect of arterial blood water T1a on CBF and CMRO2 quantification
The choice of arterial blood water T1a can have a considerable impact on the absolute CBF and CMRO2 quantification, and especially during hyperoxic conditions where substantial T1a changes can be expected. 34 Therefore, we performed a sensitivity analysis to investigate the influence of varying T1a on CBF and CMRO2 quantification, caused by for instance hyperoxia but also Hct variations (see Supplementary Figure 2).
In addition, we investigated whether different T1a scenarios impacted the CBF, ΔCBF, and importantly the CMRO2 and ΔCMRO2 quantification, using commonly used values at 3T for normoxic (T1,NO) and hyperoxic (T1,HO) conditions. For the normoxic conditions, T1a values were used as reported by Lu et al. 47 (T1,NO = 1.65s, bovine blood, recommended ASL Whitepaper value 48 ) by Pilkinton et al. 49 (T1,NO = 1.669s, rat blood) commonly used in calibrated BOLD studies, 50 and the recently modelled and measured value by Li et al.51,52 for human blood (T1,NO = 1.898s, human blood).
For the hyperoxic condition (assuming a paO2 = 460 mmHg for carbogen), we used the values as reported by Siero et al., 34 T1,HO = 1.49s based on T1,NO = 1.65 s (Scenario I), the reported hyperoxic T1a relativity by Ma et al., 53 yielding a T1,HO = 1.472s based on T1,NO = 1.65 s (Scenario II), the report by Pilkinton et al., 49 T1,HO = 1.527s based on T1,NO = 1.669 s (Scenario III), and the model by Li et al. 51 where we incorporated the hyperoxic relaxivity by Ma et al., 53 yielding a T1,HO = 1.743s based on T1,NO = 1.898 s by Li et al. 51 (Scenario IV). In summary, four scenarios with different T1,NO and T1,HO combinations were used to assess the effect on the CBF, ΔCBF, CMRO2 and ΔCMRO2 quantification (see Supplementary Figure 3).
Statistical analysis
Statistical analysis was performed to assess significant differences in the change in hemodynamic parameters for each separate hypercapnic condition (‘CO2 in air’ versus preceding room-air and carbogen versus preceding room-air) using Student’s T-test in SPSS Statistics version 26 (IBM Business Analytics, New York, USA). The distribution of the data was visually checked with histograms and Q-Q plots, and formally with the Kolmogorov-Smirnov test. A p-value <0.05 was considered significant.
Results
All ten subjects completed the study with no reported adverse effects. All data were normally distributed. The pEtCO2 averaged across subjects increased significantly (p < 0.001) from the ‘room-air 1’ (45.0 ± 3.6 mmHg) to the ‘CO2 in air’ conditions (49.2 ± 2.7 mmHg) and from the ‘room-air 2’ (43.7 ± 3.6 mmHg) to the carbogen (48.1 ± 3.0 mmHg) conditions. The change in pEtCO2 (ΔpEtCO2) is shown in Table 1 for all subjects. Arterial oxygenation (Ya) for ‘room-air 1’, ‘room-air 2’, ‘CO2 in air’ and ‘carbogen’ conditions were 98.2 ± 0.6%, 98.4 ± 0.4%, 98.5 ± 0.6% and 98.9 ± 0.4%, respectively. Relative to the corresponding room-air conditions, Ya increased less for ‘CO2 in air’ than for the carbogen (p = 0.01) condition.
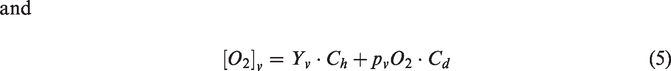
Figure 2(a)
Oxygen saturation and content in blood for the different breathing conditions. The measured pEtCO2 values and assumed hematocrit values were used as input for the Dash et al. model to generate the subject-specific curves on saturation, hemoglobin bound and plasma dissolved O2 content over a range of pO2 between 0 and 550 mmHg. a) Group average hemoglobin bound O2 saturation curve (light blue) as computed using Dash et al. physiological model
42
and the plasma dissolved O2 curve (magenta) as a function of the partial pressure of O2 (pO2). On the right y-axis, the measured ranges of hemoglobin blood oxygenation Ya(%) and Yv(%) for the different breathing conditions (room-air in blue, ‘CO2 in air’ in orange, carbogen in red, and the corresponding O2 content in μmol/ml blood on the left y-axis ([HbO2]a and [HbO2]v ranges). The associated partial pressure ranges of O2 (pvO2 and paO2) found via the O2 saturation curve (light blue) are shown on the x-axis. Note the high paO2 for the carbogen condition and the associated plasma dissolved O2 content shown on the bottom left (red). b) A zoomed part of the O2 saturation curve (light blue in a)) showing the traditional O2 saturation curve by Severinghaus (dotted light-blue) compared to the revised model by Dash et al. with dependency on the subject’s pCO2 and Hct. The hypercapnic conditions induce a right shift caused by the Bohr effect, shown by the arrow (‘CO2 in air’ in orange, carbogen in red). The effect of this right shift, however, on the arteriovenous O2 difference is negligible for all breathing conditions. See Figure 3 for the O2 content and the arteriovenous difference values (boxplots) for all breathing conditions.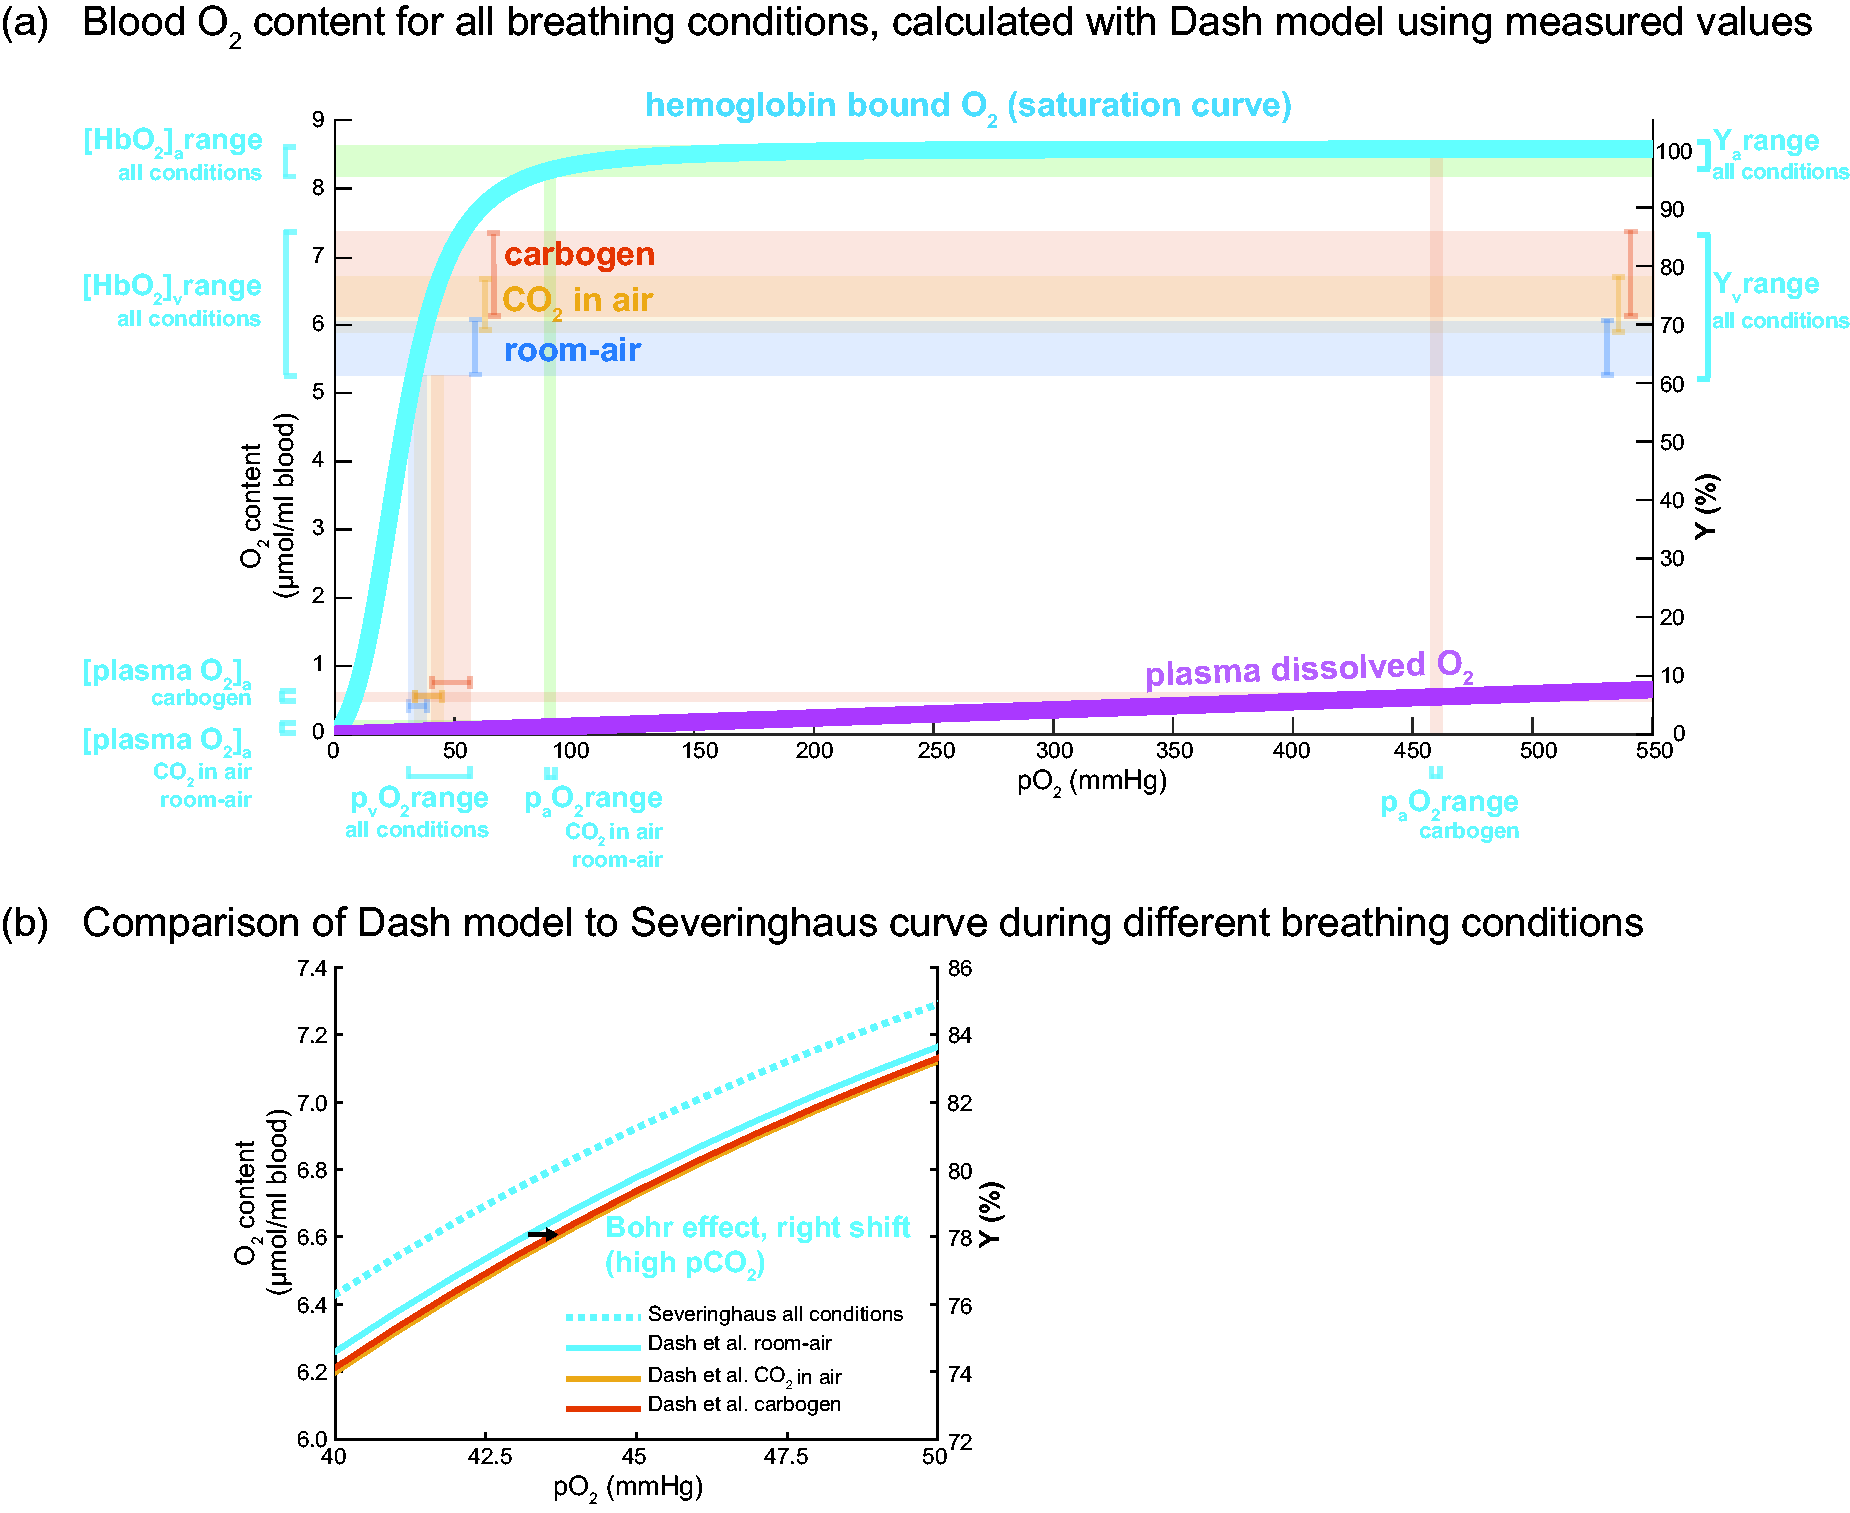
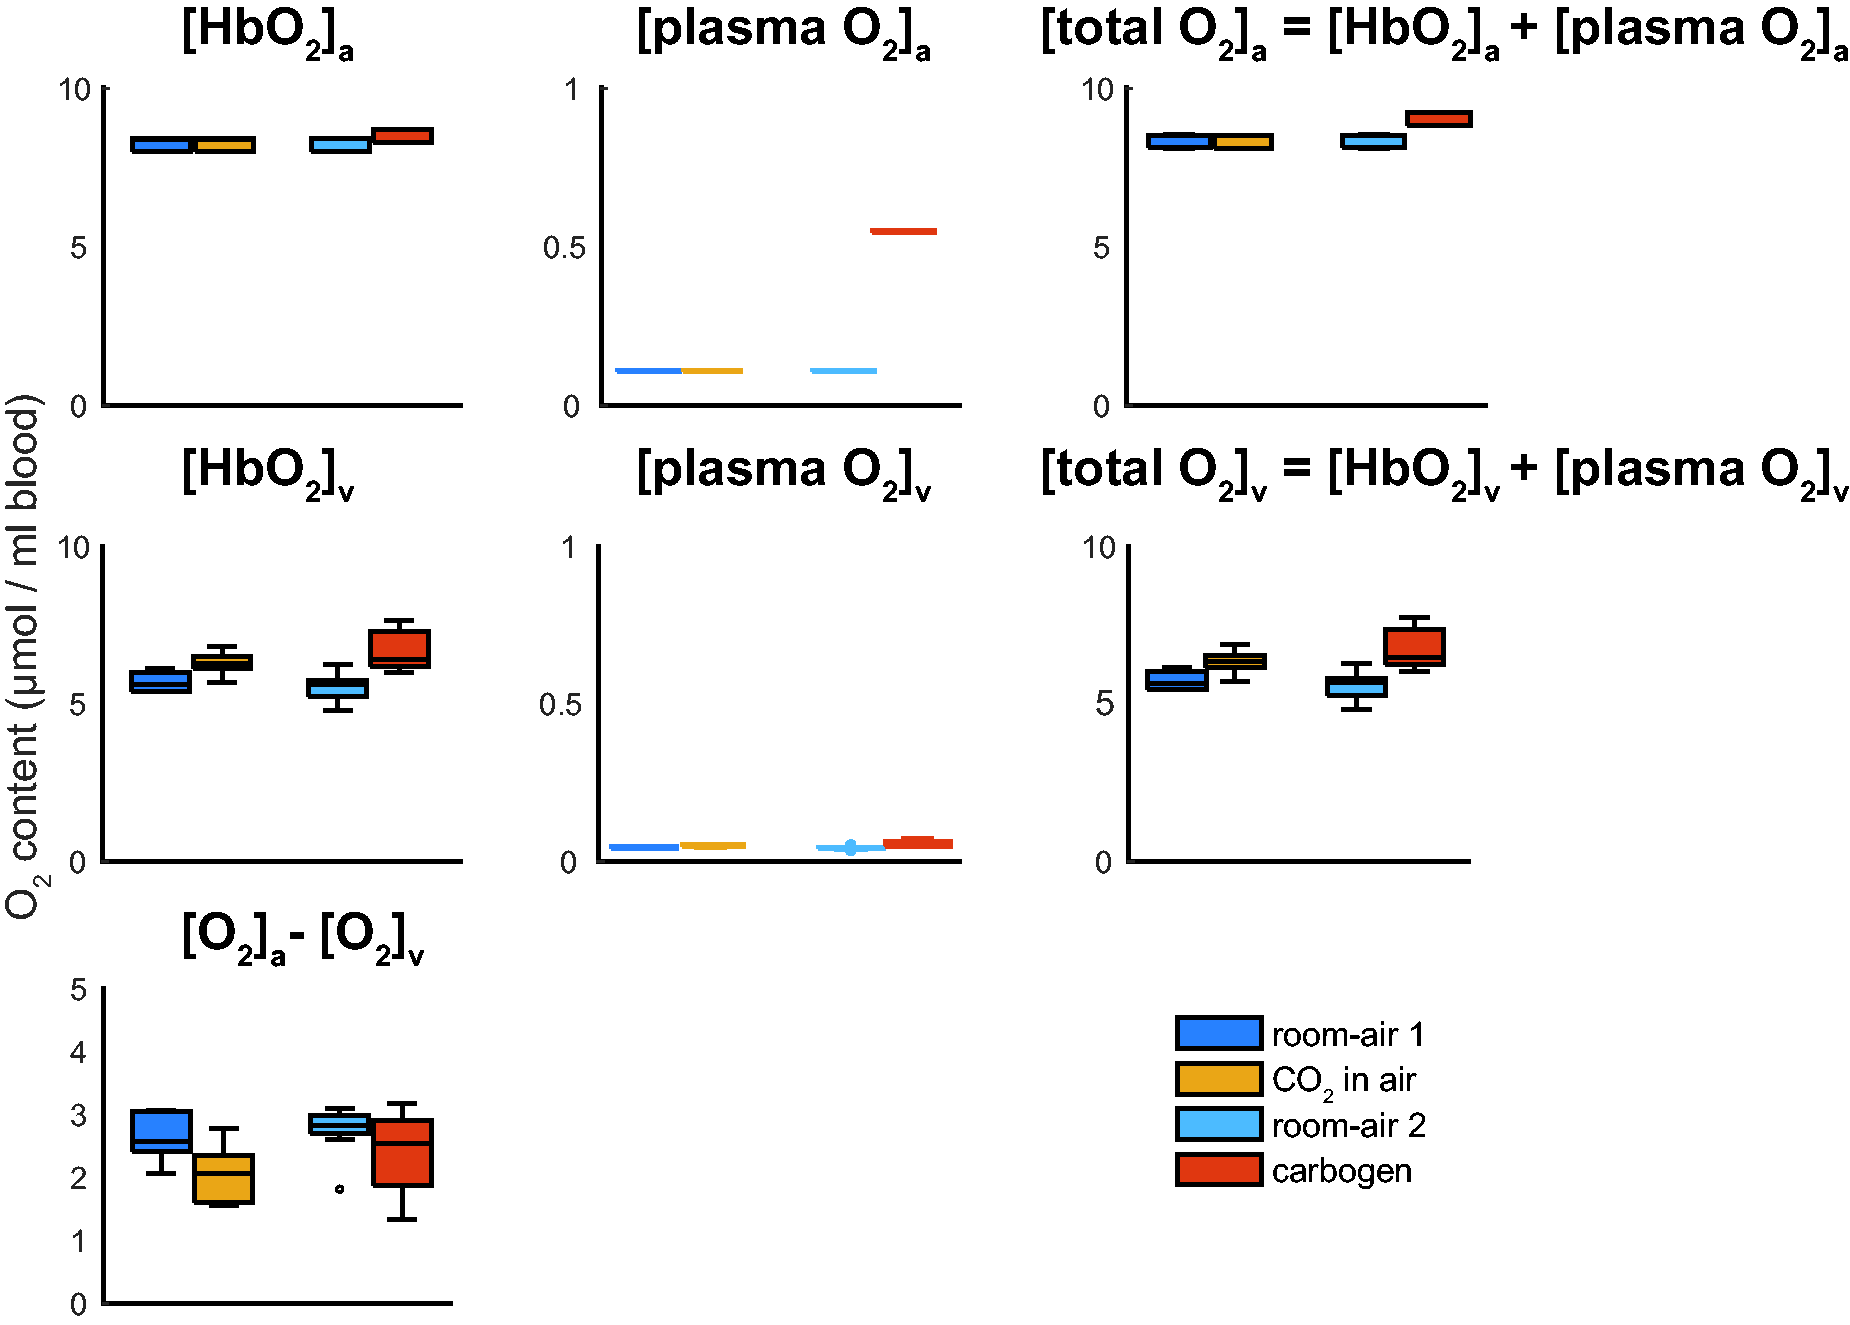
Boxplots showing the group average O2 content in μmol per ml blood for hemoglobin bound O2 and plasma dissolved O2 for the arterial and venous blood respectively, and the arteriovenous difference in O2 content needed to compute the CMRO2; [HbO2]a and [HbO2]v, [plasma O2]a, and [plasma O2]v, the total blood O2 content [O2]a and [O2]v, and [O2]a-[O2]v for the different breathing conditions. Noticeable is the increased venous hemoglobin bound O2 ([HbO2]v) for the hypercapnic conditions and the much-increased plasma dissolved O2 (arterial, [plasma O2]a) content for the carbogen condition. Also, note the much smaller y-axis scale for the plasma dissolved O2 content, showing that the venous plasma dissolved O2 plays a negligible role in the arteriovenous difference to compute CMRO2 for all breathing conditions. The boxplots show the minimum, maximum, median and interquartile range, open circles denote outliers.
The group average global CBF maps showed similar increases in CBF during the ‘CO2 in air’ and carbogen conditions compared to room-air (Figure 4). Significant changes in global CBF, Yv and OEF for ‘CO2 in air’ and carbogen were observed (Figure 5, Table 1). The percentage CBF increase for ‘CO2 in air’ and carbogen was 9.9 ± 9.3% and 12.1 ± 8.8%, respectively. The absolute CBF increase per mmHg pEtCO2 for ‘CO2 in air’ and carbogen were 1.7 ± 1.5 and 2.8 ± 3.2 ml/100g/min/mmHg, respectively. Relative and absolute CBF changes between each hypercapnic condition were not statistically significant (Table 1). Compared to the room-air condition, venous oxygenation Yv increased by 8.8 ± 3.2% (p < 0.001) for the ‘CO2 in air’ condition. As expected, a more considerable increase in Yv was observed for the carbogen condition (16.3 ± 8.9%, p < 0.001) due to the hyperoxic gas mixture in addition to the increased blood flow. No significant differences in OEF were found between ‘CO2 in air’ and carbogen conditions; the reduction in OEF was 30.8 ± 15.2% (p < 0.0001) and 39.6 ± 52.2% (p < 0.05) respectively compared to room-air (see Table 1). Note that the amount of plasma dissolved O2 was included in the computation of the OEF and CMRO2 for both conditions (see Methods).
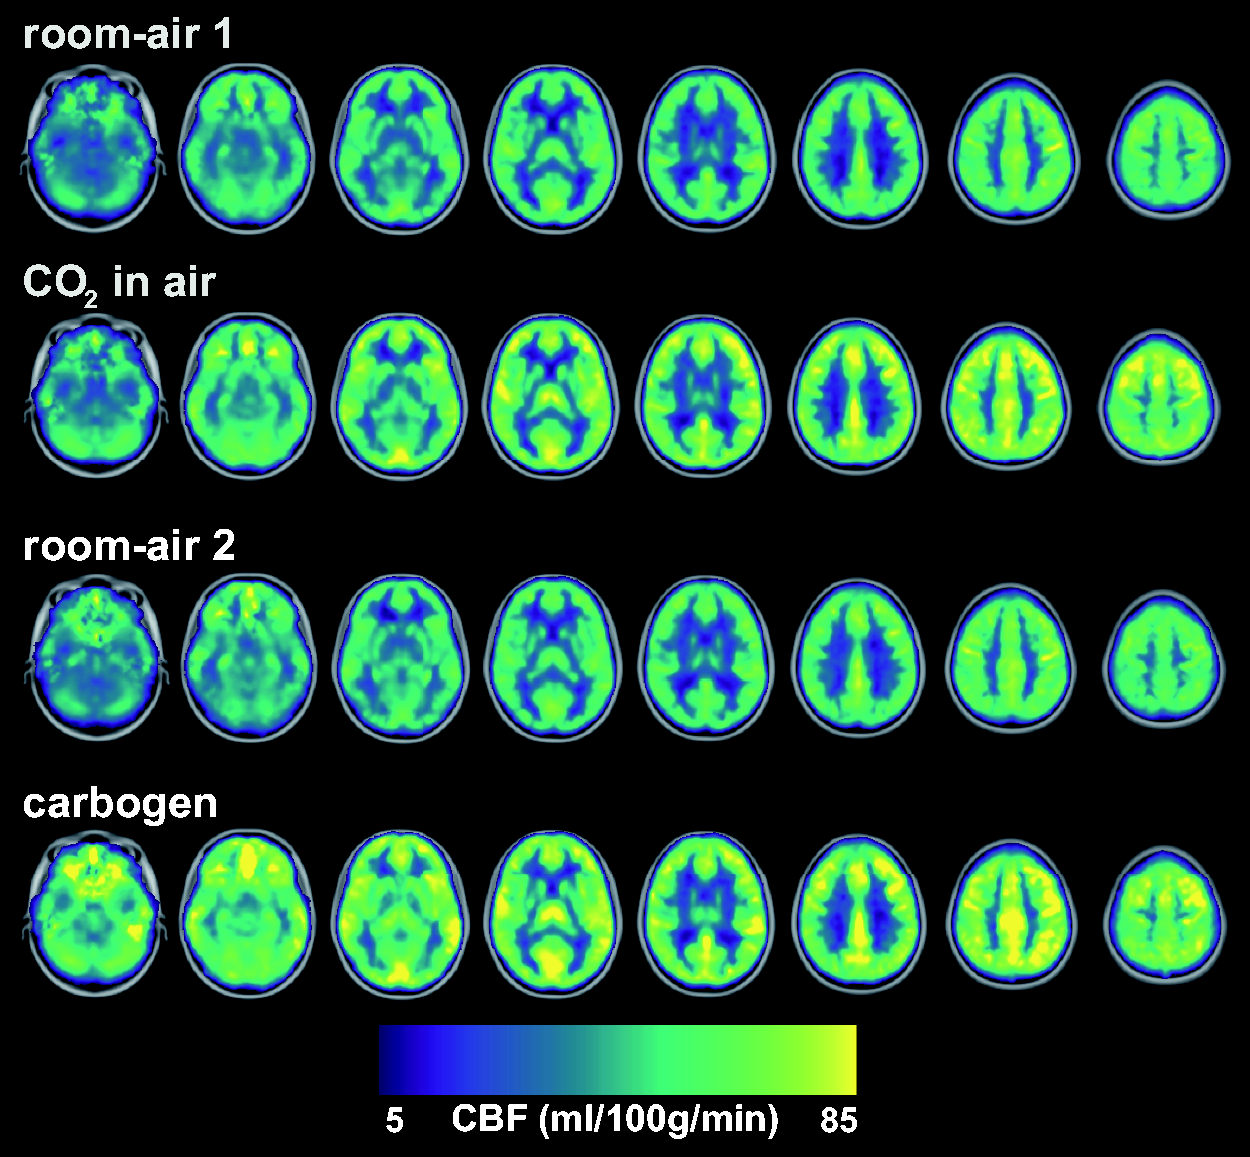
Group average CBF maps for the different conditions where a notable and similar increase in CBF is observed for ‘CO2 in air’ and carbogen (see also Table 1). The individual maps were registered to MNI space before averaging and are overlaid on the 2 mm MNI brain template.
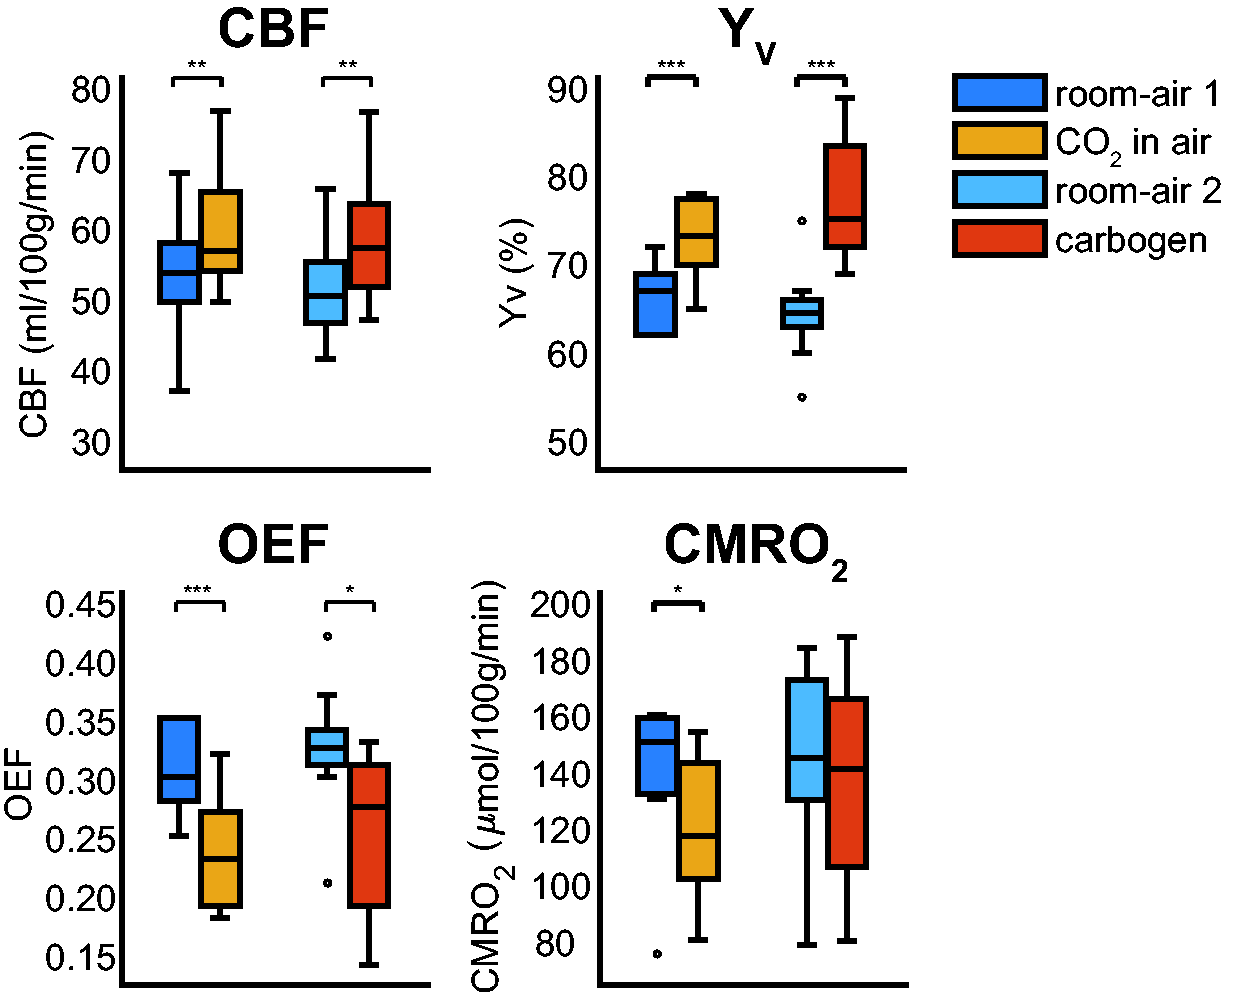
Boxplots showing the group average global CBF, venous oxygenation (Yv), computed oxygen extraction fraction (OEF), and cerebral metabolic rate of oxygen (CMRO2) for the different conditions. Notable increases in CBF and Yv are observed for both the ‘CO2 in air’ and carbogen conditions, with a more considerable Yv increase for the carbogen condition, as expected. A similar reduction in OEF is seen for both conditions. Only significant CMRO2 changes are observed for the ‘CO2 in air’ condition. The CBF increase for the ‘CO2 in air’ and carbogen conditions was not significantly different. *p-value <0.05 significant change found (Student’s T-test) with respect to the preceding room-air condition, **p-value <0.005, ***p-value <0.001. The boxplots show the minimum, maximum, median and interquartile range, open circles denote outliers.
Significant CMRO2 changes were only observed for the ‘CO2 in air’ condition, showing a decrease of 13.4 ± 13.0% (p < 0.01) (see Table 1). ΔCMRO2 did not significantly change for the carbogen condition, −2.0 ± 27.0%. Note, when using the commonly used Severinghaus O2 saturation curve instead of the model by Dash et al. 42 (see Figure 2(b)), we find a ΔCMRO2(%) of -10.4% and 0.3% for ‘CO2 in air’ and carbogen, respectively, also showing a similar change. When ignoring the venous plasma dissolved O2 in the CMRO2 computation, the estimated ΔCMRO2(%) were -12.7% and -1.3% for ‘CO2 in air’ and carbogen, respectively. When also ignoring the arterial plasma dissolved O2, ΔCMRO2(%) was -13.8% and -20.6% for ‘CO2 in air’ and carbogen, respectively. Values for all subjects are shown in Supplementary Tables 1 and 2. We performed a sensitivity analysis of variations in arterial blood water T1a on CBF and CMRO2 quantification caused by, for instance, hyperoxia and Hct variations. An increase in the hyperoxic T1,HO value of 5% from the reference T1,HO (=1.49 ms) leads to a decrease of CBF and CMRO2 of ∼4.0%, while a T1,HO decrease of 5% leads to an increase of CBF and CMRO2 of ∼4.7% (Supplementary Figure 2). We also investigated whether different T1a scenarios impacted the results using commonly used and recently reported T1,NO and T1,HO values. The absolute CBF and CMRO2 results change in value as expected, however, the ΔCBF and notably the ΔCMRO2 changes did not change significantly for the different T1 scenarios (Supplementary Figure 3).
Discussion
Main findings
Using a combination of quantitative CBF and Yv measurements along with physiological modeling based on measured arterial blood gas values, our results reinforce the notion that hypercapnia is not an iso-metabolic stimulus. Our main findings were threefold: 1) global CMRO2 reduces with normoxic-hypercapnia; 2) correction for changes in the oxygen saturation curve due to hypercapnia did not significantly affect the calculation of global CMRO2; 3) inhalation of carbogen gas appears to elicit a mixed effect where the reduction in CMRO2 seen during normoxic-hypercapnia is mitigated with the inclusion of a hyperoxic stimulus.
Our results showed that the inspiration of 5% CO2 in room-air led to an average decrease in global CMRO2 of approximately 13.4%. This falls directly in line with the 13.4% reduction reported by Xu et al. 12 Similar findings have been reported by Thesen et al., 18 who measured magnetoencephalogram responses while breathing air and a 5% CO2 mixture and showed clear decreases in event-related field potentials under hypercapnia. 18 Also, for non-human primates, a clear reduction of CMRO2 with hypercapnia has been reported.14,16
The notion that CMRO2 reductions follow a linear behavior for increasing levels of arterial CO2 forms the basis of the updated BOLD calibration model reported by Driver et al. 11 Several reports, including those by Jain et al. 54 and Chen et al., 55 showed no significant difference in CMRO2 under hypercapnia. Our measured OEF values (0.32 for room-air, 0.25 for ‘CO2 in air’, and 0.26 for carbogen) were in line with previous work reported in healthy subjects using ASL 56 and PET. 46 The decrease in OEF for the CO2 condition can be explained by the decrease in CMRO2 and increase in CBF, while the decrease in OEF for the carbogen condition may be (partly) attributed to the higher oxygen content in the arterial blood and the increase in CBF.
The changes in end-tidal CO2 we observed during ‘CO2 in air’ (∼4.2 mmHg) were lower than the 8-10mmHg changes typically observed in healthy subjects using a similar stimulus. Lower values may be attributed to potential gas leaking from the masks, leading to less efficient gas administration. The average baseline pEtCO2 value measured in our subjects during the room-air condition was 44.3 ± 3.5 mmHg. These values are higher than the ∼40mmHg typically quoted in physiology textbooks and higher than what was reported by Chen et al., 55 and Jain et al. 54 in healthy subjects. The elevated baseline CO2 in our experiments likely stems from the fact that we used a facemask and did not clamp end-tidal gas values. This may have effectively increased dead-space, leading to more rebreathing and increased pEtCO2 as has been shown recently for the use of surgical facemasks during MRI acquisition. 57 The facemask use and its effect on dead-space may also have contributed to higher room-air Yv values in our subjects. Our reported Yv during the two room-air conditions, 67.3 ± 3.6%, and 65.3 ± 5.1%, however, are in line with Jain et al. 54 but are higher than Chen et al. 55 It should be noted that both studies reported higher increases in CBF during hypercapnia, which may account for the differences in the estimated CMRO2 change. The elevated room-air pEtCO2 that we measured could have mitigated subsequent increases in pEtCO2 due to a reduced alveolar-arterial CO2 gradient during the CO2 stimulus. For pre-dilated baseline states (due to CO2 buildup in the mask), it is conceivable that further increases in arterial CO2 may push both absolute CBF58,59 and associated BOLD 25 signals when considering calibrated MRI beyond the known linear response regime. We measured an increase in CBF of approximately 1.7 ± 1.5 and 2.8 ± 3.2 ml/100g/min per mmHg change in pEtCO2 during the ‘CO2 in air’ and carbogen conditions, respectively. These increases are in line with results observed for both carbogen (5% O2 and 95% CO2) and (5%) CO2-enriched air inhalation in healthy volunteers. 60
When measuring changes in physiological parameters in response to external stimuli, the accuracy of the stimulus delivery as well as the measurement of CBF and Yv is an important concern. Particularly since the data interpretation relies on physiological modeling, our methods could have benefitted from tighter control and targeting of arterial blood gases via the use of a computer-controlled gas delivery system. This could provide more accurate measurements of end-tidal O2 for more accurate estimates of blood O2 content using physiological modeling by Dash et al. 42 Also, there is the notion of adequate sensitivity; the report by Xu et al. 12 showed that ΔCMRO2 is proportional to ΔpEtCO2, suggesting a dose-dependent effect of CO2 on CMRO2. 12 Therefore, a sufficiently high ΔpEtCO2 should be attained to allow significant observations of CMRO2 reductions during hypercapnia. In addition, the suggested dose-dependency of CO2 on ΔCMRO2 would mean that discrepant ΔpEtCO2 values will lead to discrepant ΔCMRO2 findings. In line with this, discrepant findings on ΔCMRO2 during hypercapnia can also be caused by differences in the duration of the hypercapnic stimulus even though similar ΔpEtCO2 was reached. Future work on modulation of the duration of hypercapnic stimulus would shed light on this.
Assuming iso-metabolic challenges when performing calibrated BOLD experiments may lead to a systemic bias, as shown by previous simulation and experimental studies.10,19,20 A CO2-dependent reduction in CMRO2 (as has been shown in this work) would lead to an overestimation of the M-value and a concordant overestimation of the maximum possible BOLD signal change, which translates into an up to 50% overestimation in basal OEF. 19 For activation-induced ΔCMRO2 estimates, one can expect a close to linear behavior between calibration bias and the overestimation of ΔCMRO2. This translates to a bias in the estimated OEF and CMRO2 changes (ΔCMRO2) during task-evoked calibrated BOLD studies. For example, Griffeth et al. 20 (see Figure 8A in their report) showed that the bias in estimated ΔCMRO2 during activation was in the range of 5%–10% percentage point for 10%-15% reduction CMRO2 during hypercapnic calibration.
Further work by Blockley et al. 10 and Merola et al. 19 provide a sense of how large potential errors might be due to violation of the iso-metabolic assumption.10,19 The effect of a non-isometabolic stimulus on CVR experiments will depend on the type of technique used. As BOLD is sensitive to changes in deoxyhemoglobin; a decrease in CMRO2 during hypercapnia could lead to an overestimation of the BOLD response and thus in an overestimation of the BOLD CVR amplitude. The size of this potential bias in BOLD-CVR needs to be investigated further to see how clinically relevant this bias is. An approach to mitigate potential metabolic contamination using a hypercapnic stimulus in BOLD-CVR could be to add a hypoxic component to the gas mixture, as suggested by Peng et al. 17 For ASL or 15O-H2O PET-based CVR studies, we do not expect a bias in CVR since these techniques are dominated by CBF changes and not sensitive to changes in deoxyhemoglobin.
The CMRO2 reported here under the room-air condition (144.5 ± 25.5 µmol/100 g/min) follows those previously reported based on TRUST-MRI, susceptibility-based Yv measurements as well as the PET gold-standard.46,54,61,62 When ignoring the venous plasma O2 for the calculation of ΔCMRO2, this results in a 0.7 percentage point increase for the difference in ΔCMRO2 between room-air and ‘CO2 in air’, the same increase was found for the difference between room-air and carbogen ΔCMRO2. Based on these calculations, venous plasma dissolved O2 played a negligible role in the arteriovenous oxygen difference, a key factor that determines CMRO2 under the conditions assessed herein. Specifically, for the carbogen condition, arterial plasma dissolved O2 was metabolized by the tissue (see Figure 3). Arterial plasma dissolved O2 plays a negligible role in the transportation of oxygen under physiological conditions. This is reflected by the small change in ΔCMRO2 when ignoring arterial and venous O2 for the ‘CO2 in air’ condition (−13.8% compared to −13.4% when including arterial and venous plasma dissolved O2). However, for carbogen, the estimated ΔCMRO2(%) drastically differed when ignoring the arterial and venous plasma dissolved O2 (−20.6% instead of −2.0%). Given the very high arterial plasma O2 values seen during carbogen, this difference was expected.
The setup we used for carbogen gas inhalation is a relatively simple way to evoke a vascular response and has seen use in numerous studies.63–65 Furthermore, carbogen has been reported to be more comfortable and possibly safer for patients and participants compared to a normoxic CO2 stimulus. 66 Aside from its vasodilatory action, carbogen leads to a significant increase in arterial plasma dissolved O2. Similar to the debate surrounding the effect of hypercapnia on CMRO2, the question of whether changes in arterial O2 content modulate CMRO2 has also provided mixed conclusions. Studies looking at the potential neuroprotective effect of hyperoxia for acute treatment of traumatic brain injury have reported limited changes in CMRO2 using normobaric hyperoxia. 67 This finding is supported by a physiological study measuring CMRO2 during prolonged apnea using trained free-divers performed by Ainslie et al. 68 Interestingly, a significant post-treatment increase in CMRO2 of 32% was observed in severe traumatic brain injury patients when applying hyperbaric hypercapnia. 69 In contrast, the work of Xu et al., 13 reported an ∼16.9% reduction in CMRO2 when breathing a normobaric fixed inspired O2 of 98%. 13 In that study, a hypoxic stimulus was reported to increase CMRO2 providing the notion that varying inspired O2 content affects CMRO2 in a dose-dependent manner. 13
In the context of our work, hyperoxia seems to affect the CMRO2. If hyperoxia had a neutral effect on CMRO2, the reduction in CMRO2 seen during the ‘CO2 in air’ condition would carry over to the carbogen condition, which was not observed. Similarly, a further decrease in CMRO2 would have exaggerated the negative effect of hypercapnia on CMRO2. Since neither of these responses was observed in our experiments, several hypotheses could explain our finding that CMRO2 did not significantly change during the carbogen condition. The addition of the hyperoxic component seems to mitigate the hypercapnia-induced reduction in CMRO2. Here, the addition of a hyperoxic component could have altered the brain arousal state and/or the neurophysiological reactions to the hypercapnic stimulus. The notion that an interplay between hypercapnic and hyperoxic states can modulate the brain’s response has been purported previously by Bain et al. 70 It is important to note that while ‘CO2 in air’ induces a physiological condition that can be achieved naturally (i.e. being out of breath after running up several stairs, or breath-holding after hyperventilation), the effect of carbogen inhalation on blood gas composition is impossible to reach under normal circumstances. It stands to reason that accurately predicting the effect of hypercapnic-hyperoxic stimuli on CMRO2 is complex in a dynamic biological system as the human body, which has multiple mechanisms in place to actively maintain homeostasis.
Considerations
Our observation of no significant differences in CBF between the ‘CO2 in air’ and carbogen conditions implies that the carbogen stimulus did not lead to significant O2-mediated vasoconstriction. This is in line with previously reported MRI findings and also supports results reported using PET.26,45,71 Hyperoxia is known to modulate arterial blood water T1a due to hyperoxia; to account for this, we incorporated a global T1,HO reduction in the CBF quantification as reported previously for the same carbogen stimulus, 34 and investigated different T1a scenarios (Supplementary Figure 3). It should be noted that intersubject variation will remain and will also depend on the subject's hematocrit. Any intersubject variation in CBF and arteriovenous O2 difference will translate directly to variation in CMRO2. From the sensitivity analysis on T1, we observed that increasing or decreasing the hyperoxic blood water T1 by 5%, CBF and CMRO2 increased by 4.1% or decreased by 4.7%, respectively (Supplementary Figure 2). Notably, the ΔCBF and ΔCMRO2 results did not significantly change for different T1a scenarios using commonly used and recently reported T1,NO and T1,HO values (Supplementary Figure 3). It is our view that for this study, inter-subject variations were likely were ‘averaged out’, reducing the probability of systematic bias. It is important to emphasize that our results were derived from healthy subjects, using two commonly used stimuli. Based on the presented data, it would not be accurate to extrapolate results using different CO2 with O2 gas mixture concentrations, nor can we predict responses in patients with circulatory, pulmonary, or cerebrovascular pathologies. More research is needed to investigate whether changes in CMRO2 vary with different combinations of CO2 and O2 concentrations when using carbogen-based designs. How the respective responses might change in pathological situations remains an open question.
With regards to the Yv measurement, the TRUST technique may exhibit a bias from hyperoxia-mediated changes in venous plasma T2. However, we observed that the venous plasma O2 content was negligible for all conditions (Figure 3), and thus could not influence the Yv measurement for the carbogen condition. Furthermore, the TRUST technique relies on a single measurement taken at the occipital part of the superior sagittal sinus. While the superior sagittal sinus drains most of the total cerebral blood, it also drains the periosteum, skull, meninges, and CSF. 44 Given that most of the blood flowing through the sinus is from the brain and that earlier reports on TRUST Yv measurements at different locations have shown no difference in Yv, 72 it is safe to presume the superior sagittal sinus as a representative location for a global Yv measurement. In addition, we were mainly interested in the relative change of Yv in the ΔCMRO2 comparison for the different conditions, for which the superior sagittal sinus is appropriate under the assumption that no redistribution of blood has occurred. There are other ways than pCASL to measure global CBF, such as phase-contrast MRI. These techniques have been previously compared and showed a close match.55,73
For diagnostics, treatment, or follow-up in patients, possible regional differences in CMRO2 might be of interest to clinicians. Our approach of measuring global Yv excludes the possibility to examine regional differences in CMRO2. Regional Yv measurements can be obtained using QSM-based techniques 74 or other T2- based MRI acquisitions, like T2-relaxation-under-phase-contrast MRI, 75 Velocity Selective Excitation and Arterial Nulling 76 or by using techniques based on the Asymmetric Spin Echo. 77 Such approaches could further benefit from subject-specific measures of Hct or the incorporation of local Hct measures. 78 We assumed Hct values (0.42 for males, and 0.40 for females) as both the T1 and T2 values of blood depend on Hct. However, in healthy subjects, the Hct generally only varies by around 10%; 51 it is unlikely that this would impact our Yv results significantly. This could be different in disease though. An earlier reported sensitivity analysis on T1 differences on TRUST Yv measurements demonstrated a negligible effect of slight differences in Hct on Yv. 61 For our study, the incorporation of subject-specific paCO2 and (assumed) Hct in the model by Dash et al. 42 did not impact the results dramatically (as shown in Figure 1(b)). Future (clinical) studies using such a physiological model will allow extraction of subject-specific blood oxygen content where information such as paCO2, Hct, pH, and temperature can in principle be incorporated, depending on the study design and disease of interest.
Conclusion
We found that a hypercapnic normoxic stimulus of 5% CO2 is not necessarily iso-metabolic to room-air but leads to a decrease in CMRO2 in healthy subjects. For a hypercapnic hyperoxic stimulus as carbogen, we demonstrate that it is more iso-metabolic to room-air. Although the oxygen saturation curve is dependent on paCO2 (Bohr effect), amongst other parameters, correction for differences in blood paCO2 did not significantly influence results. We believe these findings provide valuable insight into the global hemodynamic and metabolic effects of commonly used respiratory challenges. The reported findings can be useful for future experimental designs, BOLD signal modeling, and interpreting calibrated BOLD fMRI and CVR measurements using hypercapnic or hypercapnic-hyperoxic (carbogen) stimuli.
Supplemental Material
sj-pdf-1-jcb-10.1177_0271678X211064572 - Supplemental material for Hemodynamic and metabolic changes during hypercapnia with normoxia and hyperoxia using pCASL and TRUST MRI in healthy adults
Supplemental material, sj-pdf-1-jcb-10.1177_0271678X211064572 for Hemodynamic and metabolic changes during hypercapnia with normoxia and hyperoxia using pCASL and TRUST MRI in healthy adults by Pieter T Deckers, Alex A Bhogal, Mathijs BJ Dijsselhof, Carlos C Faraco, Peiying Liu, Hanzhang Lu, Manus J Donahue and Jeroen C.W Siero in Journal of Cerebral Blood Flow & Metabolism
Footnotes
Funding
The author(s) disclosed receipt of the following financial support for the research, authorship, and/or publication of this article: J.C.W.S. was supported by the National Institute of Mental Health of the National Institutes of Health under Award Number [R01MH111417]. P.T.D. was supported by the Brain Technology Institute [1519131] and the Friends of the UMC/WKZ foundation [1619144]. A.A.B was supported by a Dutch Research Council (NWO) funded VENI project ‘The Ischemic Fingerprint’ [VI.VENI.194.056]. M.B.J.D is supported by the Dutch Heart Foundation [2020T049].
Declaration of conflicting interests
The author(s) declared no potential conflicts of interest with respect to the research, authorship, and/or publication of this article.
Authors’ contributions
PTD: Writing - Original Draft; Visualization; Conceptualization; Methodology
AAB: Writing - Original Draft; Conceptualization; Methodology
MBJD: Formal analysis; Writing - Review & Editing
CCF: Writing - Review & Editing; Methodology; investigation
PL: Writing - Review & Editing; Methodology; resources
HL: Writing - Review & Editing; Methodology; resources
MJD: Resources; investigation; Methodology; Writing - Review & Editing
JCWS: Writing - Original Draft; Conceptualization; investigation; Visualization; Supervision; Formal analysis; Methodology; Project administration
Supplemental material
Supplemental material for this article is available online.
References
Supplementary Material
Please find the following supplemental material available below.
For Open Access articles published under a Creative Commons License, all supplemental material carries the same license as the article it is associated with.
For non-Open Access articles published, all supplemental material carries a non-exclusive license, and permission requests for re-use of supplemental material or any part of supplemental material shall be sent directly to the copyright owner as specified in the copyright notice associated with the article.