
Abstract
Characterizing the effect of oxygen (O2) modulation on the brain may provide a better understanding of several clinically relevant problems, including acute mountain sickness and hyperoxic therapy in patients with traumatic brain injury or ischemia. Quantifying the O2 effects on brain metabolism is also critical when using this physiologic maneuver to calibrate functional magnetic resonance imaging (fMRI) signals. Although intuitively crucial, the question of whether the brain's metabolic rate depends on the amount of O2 available has not been addressed in detail previously. This can be largely attributed to the scarcity and complexity of measurement techniques. Recently, we have developed
Introduction
A tight control of cerebral perfusion and oxygen (O2) supply is critical for brain function and health, especially because oxidative metabolism is the primary means of energy production in the brain (Magistretti and Pellerin, 1999). Characterization of the influence of O2 availability on the brain is therefore an essential step toward a better understanding of brain energy homeostasis and also has important clinical implications. For example, acclimatization to high altitudes is triggered by hypoxia and >80% of people experience a certain degree of discomfort, including headache and shortness of breath, with a fraction of them developing acute mountain sickness that includes nausea, vomiting, fatigue, dizziness, and difficulty sleeping (Imray et al, 2011). However, hyperoxia has been used as a therapeutic intervention in patients with traumatic brain injury and focal ischemia (Thom, 2009). Although increased blood O2 content is expected to enhance O2 delivery to tissues, clinical trials of O2 therapy have yielded mixed results, with some reporting excellent efficacy and others showing marginal benefit (Magnoni et al, 2003; Rockswold et al, 2010). One possible reason is that, while hyperoxia may benefit ischemic tissue, it may concomitantly cause oxidative stress with a potential to damage healthy brain regions. Additionally, under the assumption that changes in O2 content do not alter brain metabolism, a hyperoxia challenge has recently been used to calibrate the Blood-Oxygenation-Level-Dependent signal in functional magnetic resonance imaging (MRI) studies (Chiarelli et al, 2007). Therefore, there has been a growing interest in understanding the effect of O2 modulation on brain physiology.
It is well established that hyperoxia increases arterial blood O2 content, with hypoxia having the opposite effect. Some investigators have reported a cerebral blood flow (CBF) reduction during hyperoxia, but this trend is not always observed (Bulte et al, 2007; Nishimura et al, 2007; Sicard and Duong, 2005). Even more controversial is the question whether O2 gas modulation alters tissue metabolic rate. This uncertainty is largely due to the limited availability and sensitivity of suitable techniques to measure the cerebral metabolic rate of O2 (CMRO2)
In this study, we used the techniques described above to examine potential changes in CBF, arterial O2 content, venous O2 content, and CMRO2 due to O2 gas modulation. The convenience of the method allows us to investigate hypoxia (14% fraction of inspired O2, FiO2) and hyperoxia (administrated at two levels: 50% and 98% FiO2) in the same study, which is different from previous studies that have focused on one challenge only. Our data suggest that both vascular and metabolic parameters of the brain are strongly dependent on the O2 level in the inspired air.
Materials and methods
Theory for the Measurement of Global Cerebral Metabolic Rate of Oxygen
Similarly to many existing techniques, our approach to estimate CMRO2 was based on the Fick principle (Kety and Schmidt, 1948). The difference between the present technique and the previous studies is that our method can measure the relevant parameters in a noninvasive manner with short and simple procedures. Brain O2 metabolic rate can be written as:

where CMRO2 is in units of

and

where
Among the parameters needed to compute CMRO2, the most challenging task has been the measurement of
For the estimation of arterial O2 content (equation (2)),
Participants
The study was approved by the Institutional Review Board of the University of Texas Southwestern Medical Center. Sixteen subjects (26±4 years old, nine males and seven females) were recruited. The participants did not report pulmonary, respiratory, neurologic, or psychiatric disorders according to self-completed questionnaires. None of the participants were smokers or had asthma. The subjects gave informed written consent before participating in the study.
Oxygen Modulation
Modulation of O2 content in the inspired air was achieved using a custom-made breathing apparatus (Xu et al, 2011; Yezhuvath et al, 2009). Briefly, after lying on the magnet table, the subject was fitted with a nose clip and a mouthpiece so that s/he could breathe through the mouth only. The mouthpiece was connected to a three-way valve, which delivers either room air (21% FiO2) or a special gas mixture contained in a Douglas bag. Three Douglas bags containing different gas mixtures were prepared: (1) 14% O2 and 76% N2 (hypoxia); (2) 50% O2, 1% CO2, and 49% N2 (50% hyperoxia); and (3) 98% O2 and 2% CO2 (98% hyperoxia). These bags sequentially connected to the valve, thereby switching the inspired air. Note that a small amount of CO2 was intentionally added to the hyperoxia gas mixture because hyperoxia tends to cause the subject to hyperventilate, resulting in an unwanted physiologic change of reduced arterial CO2 level, which may have additional effects on CBF and CMRO2 (Cohen et al, 2002). We therefore added CO2 to partially offset this side effect. Similar strategies have been used in previous reports in the literature (see also Discussion) (Floyd et al, 2003).
The study paradigm consisted of a continuous, 50-minute session in which the subject breathed the above-mentioned gas mixtures in the following order: room air (21% FiO2) for 8 minutes, 14% FiO2 for 18 minutes, 50% FiO2 for 15 minutes, and 98% FiO2 for 12 minutes (see color coding in Figure 1). The duration of each breathing period was determined based on the time needed to reach a new steady state after switching the gas (calibrated from tests conducted outside the MRI). For example, it takes more time for the 14% FiO2 condition to reach a steady state, therefore the administration for this gas mixture was the longest.
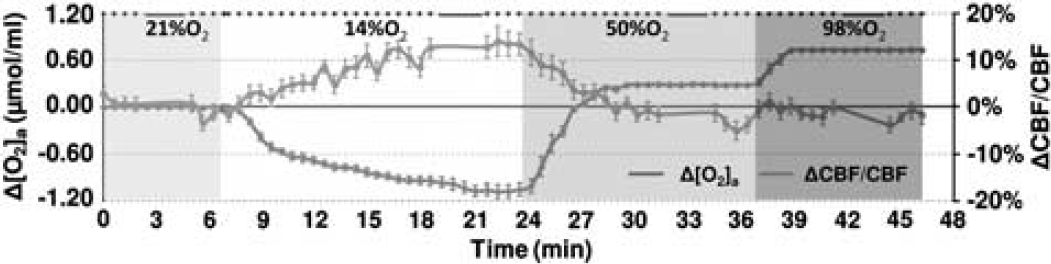
Illustration of experimental paradigm and time courses of arterial oxygen content, [O2]a, and cerebral blood flow (CBF). During the session, the subject breathed 21%, 14%, 50%, and 98% fraction of inspired O2 (FiO2) for 8, 18, 15, and 12 minutes, respectively, and these are denoted by different colors in the plot. The duration of each condition was preset based on the time needed to reach a new steady state that was determined from several testing experiments. Magnetic resonance imaging (MRI) data acquisitions were performed throughout the session and the type of pulse sequence performed is denoted as dots or bars at the top of the plot, where each dot indicates a 0.5-minute phase-contrast MRI and each bar indicates a 3.2-minute T2-Relaxation-Under-Spin-Tagging (TRUST) MRI. Due to the large number and high density of the phase-contrast scans, the data allowed the assessment of time course of CBF changes (blue curve) during the experiment (the gap in the curve is due to the TRUST scan). For comparison, [O2]a (accounting for both hemoglobin-bound and dissolved O2) time course is also display (red curve). The color reproduction of this figure is available at the
During the experiment, the participant was instructed to keep still and maintain a uniform breathing pattern. To prevent drowsiness, an individually selected movie was shown to the participant via a back-projection video system (typically used for functional MRI fMRI) throughout the session. The rationale for this intervention was to prevent potential effects of sleep and drowsiness on brain CBF and metabolism (Braun et al, 1997; Nofzinger et al, 2002). Continuous physiologic recordings were obtained for end-tidal (Et) CO2 (Capnograph; Novametrix Medical System, Wallingford, CT, USA), EtO2 (Analox Sensor Technology, Stokesley, North Yorkshire, UK),
Magnetic Resonance Imaging Experiments
The MRI scans were performed on a 3-Tesla system (Philips Medical Systems, Best, The Netherlands). Two sequences, TRUST MRI and PC MRI, were performed multiple times during the entire session and their timing is shown in Figure 1 (bars and dots, respectively, at the top of the figure). The TRUST MRI (duration 3.2 minutes) was performed four times during the steady states of the four O2 conditions. The PC MRI (duration 0.5 minutes) was performed during the rest of the time. In principle, only four PC scans, one for each O2 condition under steady state, were needed for the study. We, however, acquired PC MRI continuously throughout the session (except when TRUST is being acquired) because (1) the PC scan is very short in duration and a continuous acquisition would allow us to evaluate CBF changes in transitional states while FiO2 changes; (2) multiple PC scans acquired before and after the TRUST scan would allow us to interpolate the CBF values to better match the timing of
The TRUST technique uses the spin labeling principle to isolate pure venous blood signals and measures
Quantitative PC MRI measures blood flow using magnetic field gradients (Xu et al, 2009). The phase of the magnetization is associated with the velocity value. The sequence parameters of PC MRI were single slice at the same position as TRUST MRI, voxel size=0.45 × 0.45 × 5 mm3, field-of-view=230 × 230 × 5 mm3, maximum velocity=80 cm/s, number of averages=4, duration=30 seconds.
Data Processing
The data processing procedures for TRUST MRI and PC MRI were based on algorithms described previously (Lu and Ge, 2008; Xu et al, 2009; see Supplementary text). For each FiO2 condition,
Physiologic recordings of
Statistical Analysis
Statistical analyses were performed to examine whether each of the gas mixtures (i.e., FiO2=14%, 50%, and 98%, respectively) resulted in an alteration in brain metabolic and vascular parameters. Specifically, a one sample Student's
Because hyperoxia and hypoxia may also change CO2 content in the blood ([CO2]a) due to hyperventilation, the observed physiologic changes may be partially attributed to a CO2 effect. We therefore corrected for the CO2 effect and reanalyzed the data using the corrected values. The corrections were made by calculating:

and
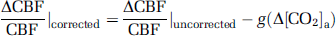
where Δ[CO2]a is the alteration in CO2 content during the O2 challenge, the functions

and

The coefficients in equations (6) and (7) were estimated by fitting of experimental data from an earlier report (Xu et al, 2011), in which [CO2]a was specifically maneuvered to examine its effect on CMRO2. Note that [CO2]a is not only dependent on EtCO2, but also on arterial O2 saturation level (
Using equations (6) and (7) and data in Xu et al (2011), the coefficients,
Because CMRO2 and CBF alterations during O2 modulation are most likely mediated by O2 content in the arterial blood and that different individuals may manifest different responses in arterial O2 even given identical FiO2, we conducted further analyses to directly examine the dependence of ΔCMRO2/CMRO2 and ΔCBF/CBF on Δ[O2]a. A mixed effect regression model (R software, Wirtschaftsuniversität Wien Vienna University, Austria) was used in which Δ[O2]a was the independent variable and had three observations for each subject, and the respective physiologic parameter was used as the dependent variable. Second-order polynomials, i.e.,
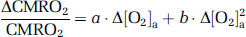
and
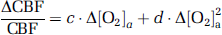
were used for the model as the data (see Results and Discussion) suggested that the second-order model provides a better fitting than the linear model, as determined by a hierarchical regression analysis. Error propagation from the CO2 coefficients to O2 coefficients was again assessed by Monte Carlo simulations (see Supplementary text).
Results
All subjects were able to complete the breathing tasks without discomfort. Table 1 summarizes the vital signs during each breathing condition. Compared with room air, hyperoxia increased EtO2,
Vital signs under various FiO2 conditions (
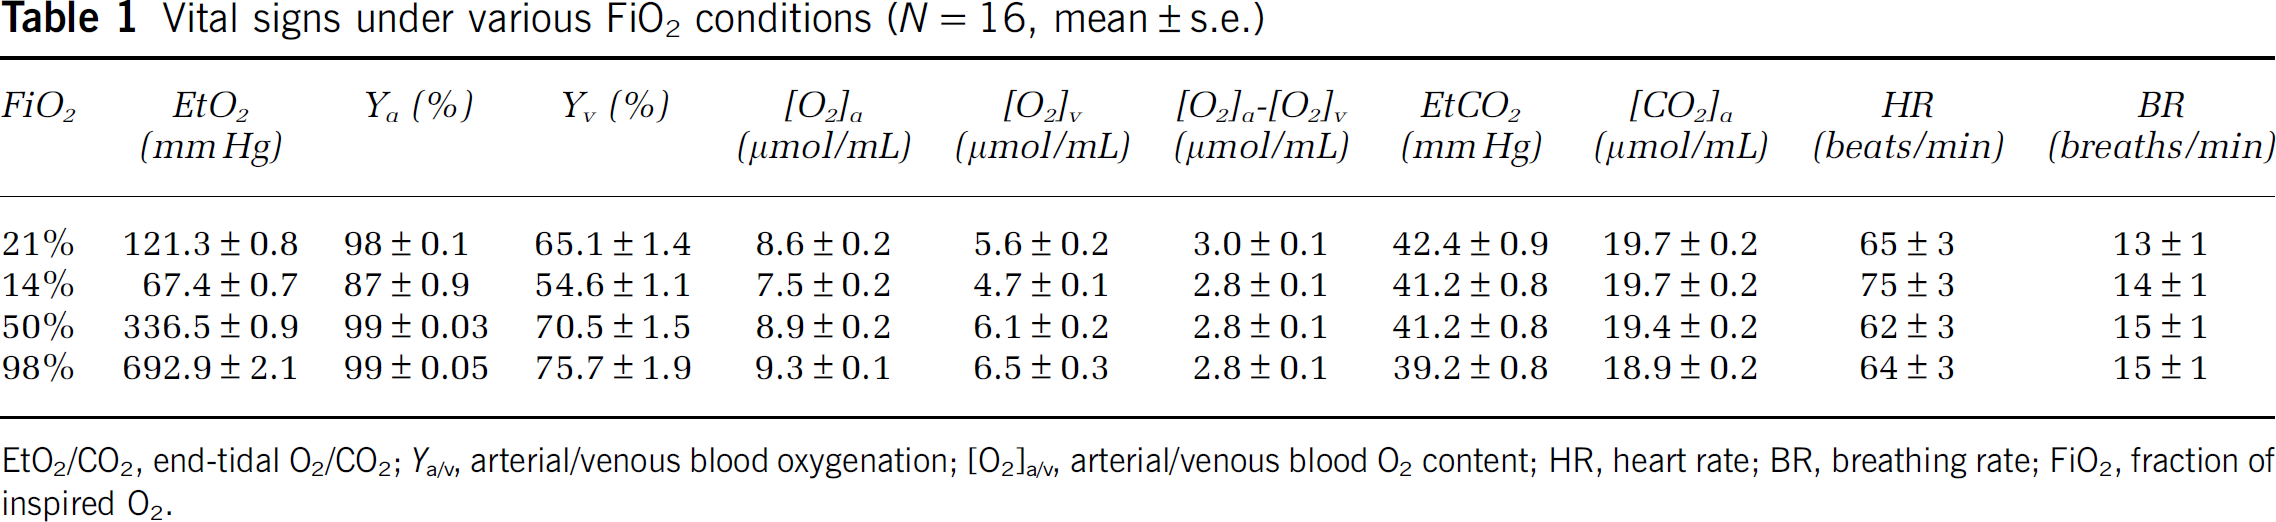
EtO2/CO2, end-tidal O2/CO2;
Figure 2 shows representative imaging data for the measurements of venous oxygenation (panels A to C) and CBF (panel D). Figure 2A illustrates control, tagged, and difference images from TRUST MRI. The difference signals were then fitted as a function of effective TE to obtain the decay time constant
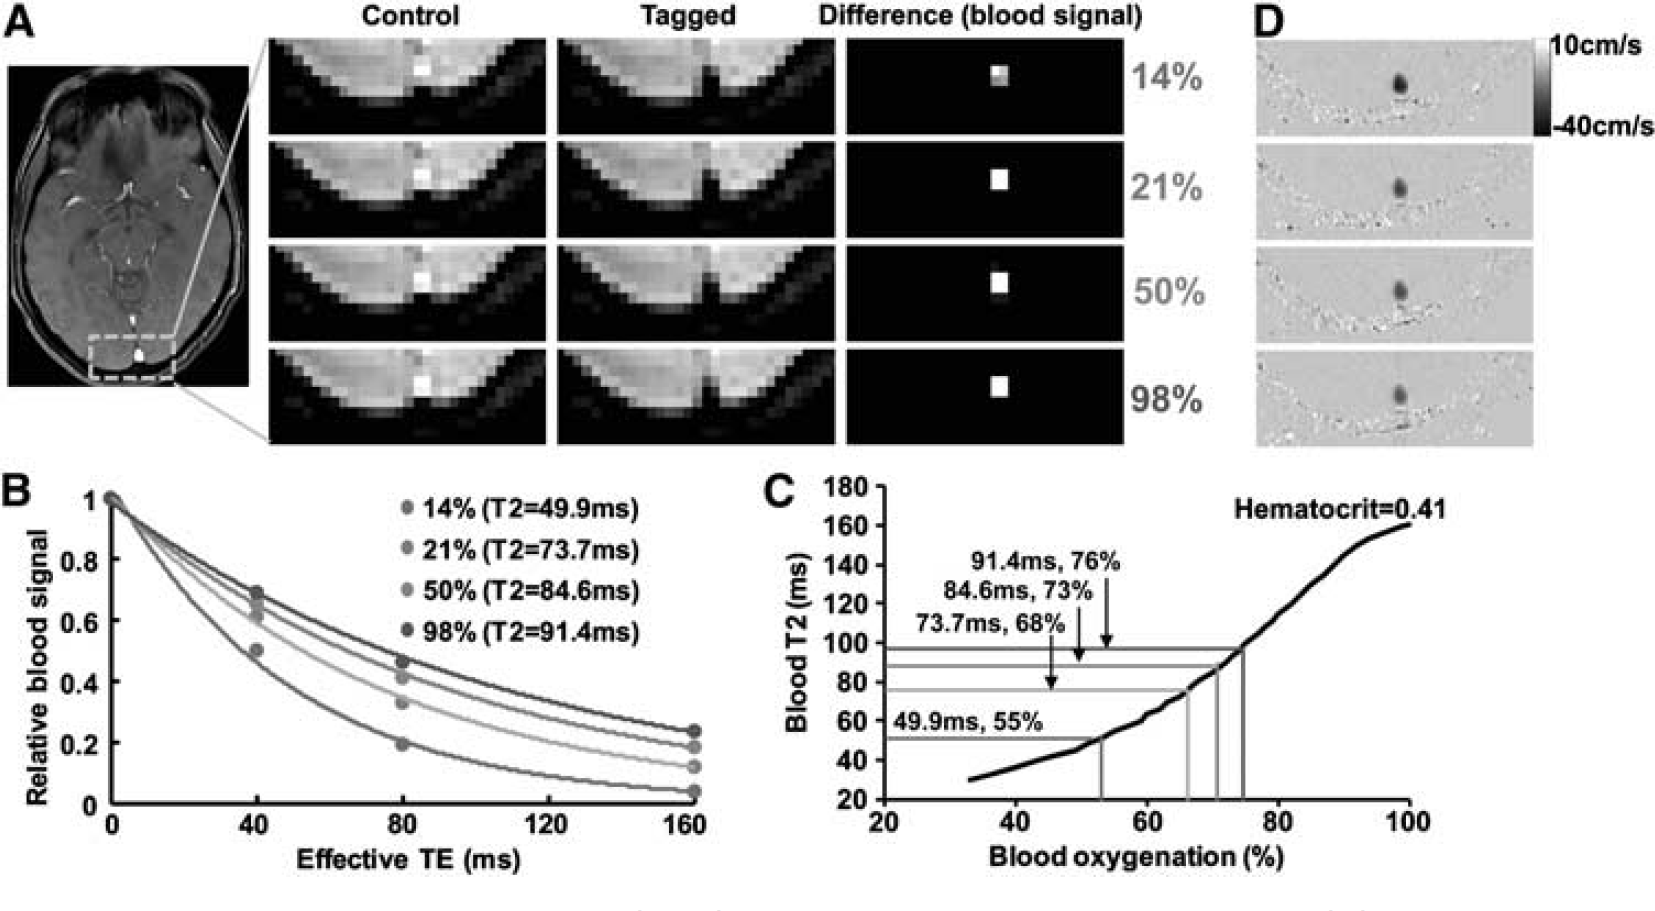
Representative magnetic resonance imaging (MRI) data obtained in the experiment. (
Table 2 summarizes the CMRO2 and CBF values under different O2 conditions before and after correction of CO2 effects. The raw data (i.e., before correcting for CO2 effects) revealed that inhalation of 14% O2 significantly increased CMRO2 (
CBF and CMRO2 values as a function of FiO2 before and after correction for CO2 effect
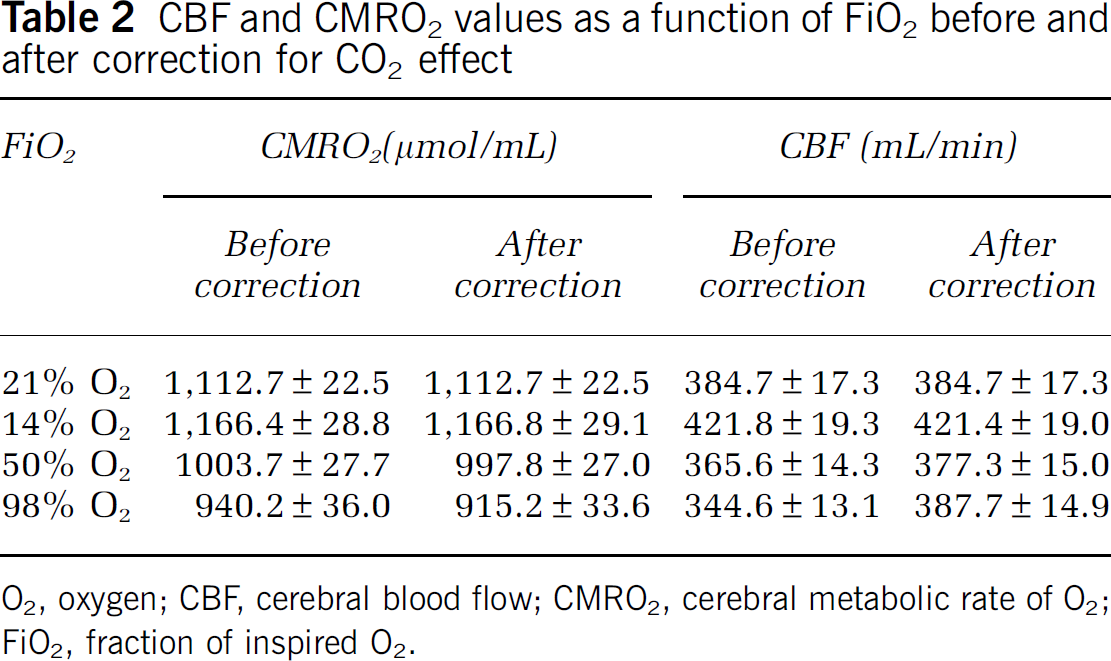
O2, oxygen; CBF, cerebral blood flow; CMRO2, cerebral metabolic rate of O2; FiO2, fraction of inspired O2.
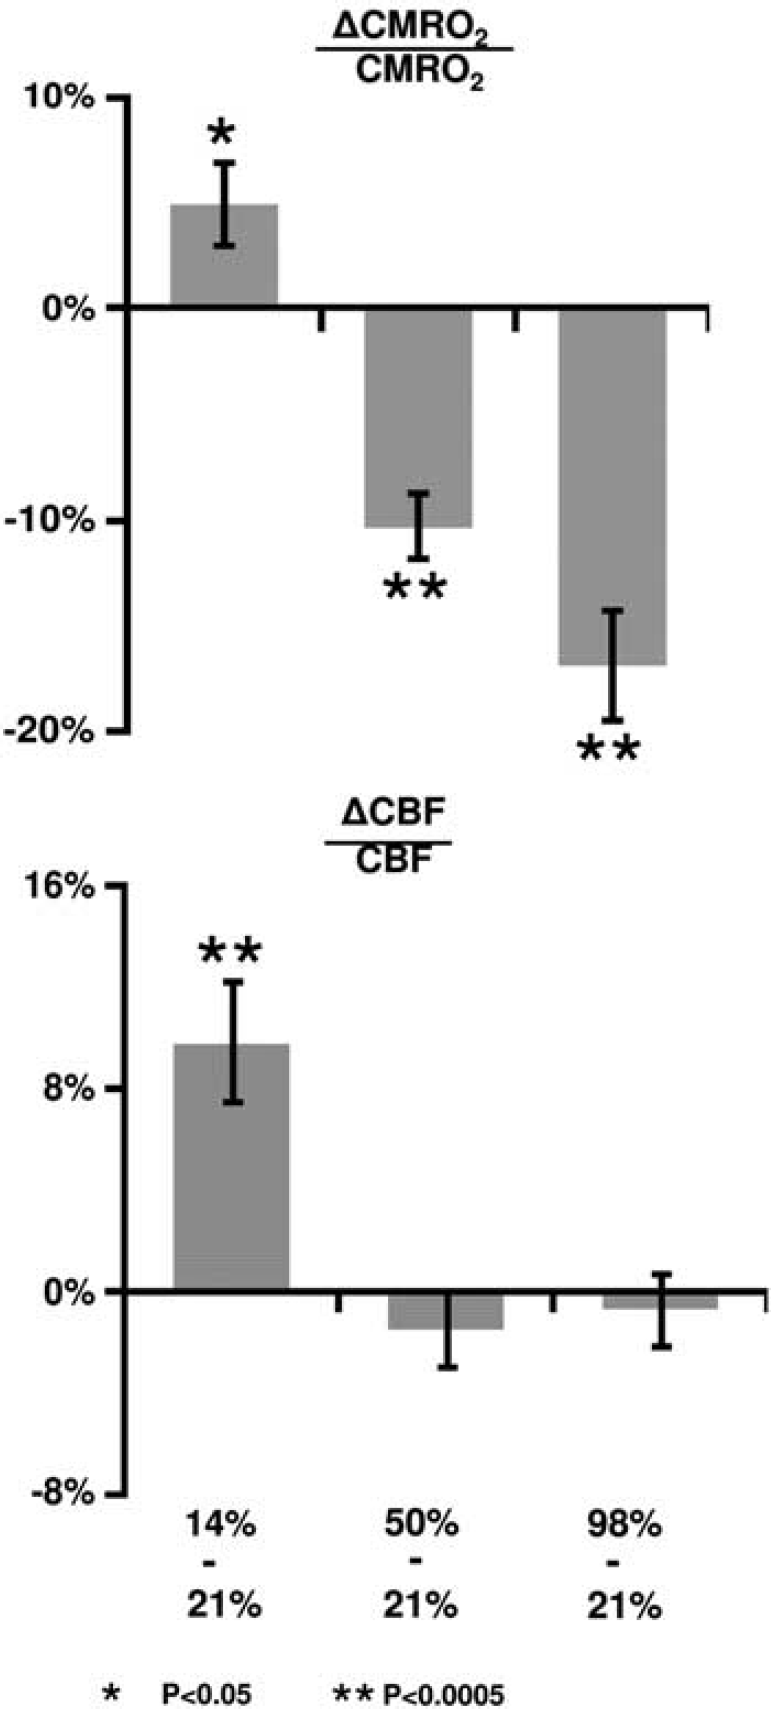
Percent changes in cerebral metabolic rate of oxygen (CMRO2) and cerebral blood flow (CBF) due to fraction of inspired O2 (FiO2) modulation. The changes were calculated based on comparisons between the special gas mixture and room air.
Dynamic acquisitions of CBF MRI allowed us to obtain a time course of this parameter and the group-averaged data (corrected for CO2 effect) are shown in Figure 1. Consistent with the quantitative results described above, the time course revealed a gradual CBF increase during the hypoxia period, but did not significantly change during hyperoxia.
A scatter plot of corrected ΔCMRO2/CMRO2 versus Δ[O2]a is shown in Figure 4A. Regression analyses revealed a significant inverse relationship between these parameters (
Coefficient values and their confidence intervals describing the dependence of CMRO2 and CBF on Δ[O2]a
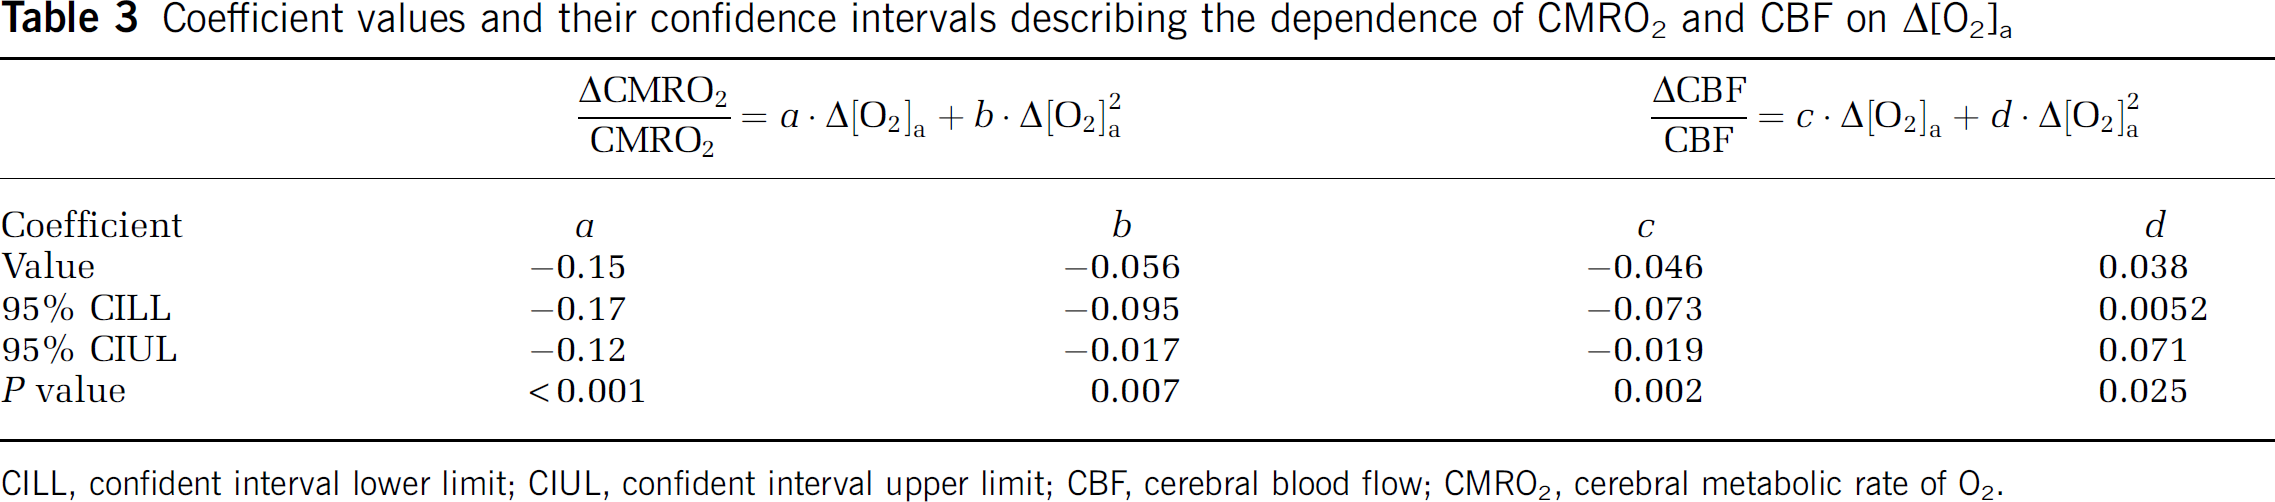
CILL, confident interval lower limit; CIUL, confident interval upper limit; CBF, cerebral blood flow; CMRO2, cerebral metabolic rate of O2.
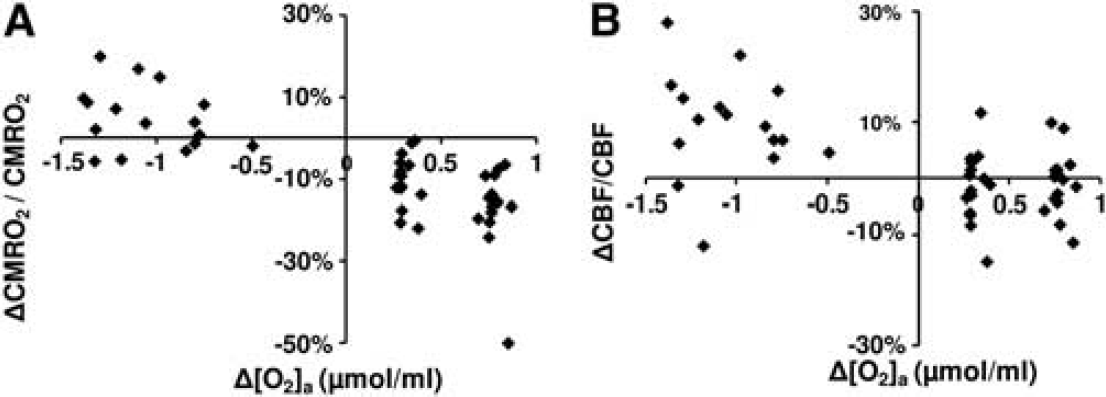
Scatter plots comparing (
Discussion
To the best of our knowledge, the present study is the first to concomitantly examine the influence of hypoxia and hyperoxia on brain O2 metabolism in conscious humans. Our data suggested that hypoxia by inhalation of 14% O2 increased CMRO2, while hyperoxia by inhalation of 50% O2 decreased CMRO2. Further reduction in CMRO2 was observed when increasing the FiO2 to 98%. The present study also revealed that CBF was augmented by hypoxia, but was unchanged during hyperoxia.
Physiological Considerations
The influence of FiO2 on brain metabolism has previously been investigated by a limited number of studies (the relatively small number is mainly due to technical complexity and availability of CMRO2 measurement). The results were heterogeneous. A few studies reported findings similar to ours. For example, Richards et al, (2007) measured O2 metabolism in beagles using a 13C NMR method and found that hyperoxia treatment after ischemia reduced O2 metabolism. Working with a rat model, Harik et al, (1995) measured glucose metabolism with a 2-deoxyglucose method and observed that hypoxia with 10% FiO2 increased glucose metabolism by 10% to 40%. A preliminary report by Smith et al, (2011) also noted an elevated CMRO2 during hypoxia in humans, using techniques similar to ours. A few other reports contradict our findings. Comparing high altitude (∼11% FiO2) to sea level, Moller et al, (2002) found no changes in CMRO2 or CBF using a 133Xe technique. Rockswold et al, (2010) studied O2 metabolism in brain injury patients using a nitrous oxide technique and found that hyperoxia increased CMRO2, but Diringer et al, (2007) found no CMRO2 changes. Several reasons may have contributed to these discrepancies, including different species, experimental conditions as well as pathological effects (Diringer et al, 2007; Maandag et al, 2007; Moller et al, 2002; Rockswold et al, 2010). Collectively, these factors make a direct comparison virtually impossible. The techniques used in the previous studies required the injection of an exogenous tracer as well as continuous sampling of arterial and venous blood, all of which may present physiologic stress and alteration to the brain (Moller et al, 2002; Rockswold et al, 2010). The present study capitalized on a recently developed global CMRO2 technique that was fast, reliable, and noninvasive (Xu et al, 2009). The relatively simple procedure afforded by this technique allowed us to apply both hypoxia and hyperoxia in the same session.
If our findings of CMRO2 alteration reflect a corresponding change in neural activity, what could the possible mechanisms be? Hyperoxia has been long known to increase the generation of reactive oxygen species (Jamieson et al, 1986), which could cause oxidative damage to lipids and proteins (Tatarkova et al, 2011). Reactive oxygen species may in turn decrease enzymatic activities in aerobic metabolism pathways via inhibition of pyruvate dehydrogenase (Bogaert et al, 1994), a critical enzyme in transforming pyruvate into acetyl-CoA for the citric acid cycle. A few reports have also suggested that hyperoxia may decrease gene expression associated with neurotransmitter transport and transmission (Chen et al, 2009). Finally, studies have shown that long-duration hyperoxia (>1 hour) may lead to apoptosis by modification of antiapoptotic proteins (Brutus et al, 2009; Mudduluru et al, 2010). This evidence suggests that hyperoxia may suppress neural activity and therefore CMRO2 via several O2 toxicity-related pathways. The effect of hypoxia on CMRO2 supposedly operates via mechanisms opposite to that of hyperoxia. Previous studies have suggested that hypoxia with 8% FiO2 can cause a 57% increase in the rate of glycolysis and a threefold increase in the activity of cytochrome oxidase, an enzyme in the mitochondrial electron transport chain (Hamberger and Hyden, 1963). Furthermore, these changes were primarily located in neurons but not in glial cells (Hamberger and Hyden, 1963), suggesting an enhancement in neuronal activity during hypoxia.
Compared with CMRO2, more literature is available on the effect of FiO2 on CBF. Our observation of an increased CBF during hypoxia is consistent with earlier reports (Noth et al, 2008). For a hyperoxia challenge, we observed a 11.7±1.3% CBF reduction in the presence of a 3.2±0.4 mm Hg EtCO2 decrease (for a 98% FiO2). Given the modulation effect of CO2 on CBF, it seems that the observed CBF change is predominantly attributed to a CO2 effect rather than to an O2 effect. Indeed, after correcting for the CO2 effect, no apparent effect of O2 was detected. Similar findings have been reported in the literature. For example, observed a 16% CBF reduction in the context of a 3 mm Hg EtCO2 decrease comparing 100% FiO2 with 21% FiO2. However, a few reports in the literature showed some discrepancy from our results. used Arterial-Spin-Labeling MRI to evaluate the effect of hyperoxia on CBF and noted a 28% reduction in hyperoxia. One possible explanation for this finding is that arterial
Technical Considerations
The CMRO2 method used in the present study was based on the Fick principle of arteriovenous differences in O2 contents, in which the contributing parameters were measured individually (Xu et al, 2009). This principle has been known for decades, but its implementation in humans has been challenging. The main technical obstacle was the difficulty of estimating venous oxygenation quantitatively and reliably. With a recent TRUST MRI technique that was developed by our laboratory, the quantification of global venous oxygenation becomes more feasible (Lu and Ge, 2008). The TRUST technique has been validated in humans against a gold-standard pulse oximetry method (Lu et al, 2012). Another parameter in the Fick principle, CBF, was determined with a PC MRI technique. Compared with other CBF quantification techniques such as Arterial-Spin-Labeling MRI, the PC technique is not affected by arterial transit time, blood and tissue
Since changes in alertness during the experiment may alter CMRO2 (in addition to any O2 effect) (Braun et al, 1997; Nofzinger et al, 2002), the subjects of this study were allowed to view a movie while in the scanner. The postMRI questionnaire confirmed that all subjects remained awake during the entire session. Another physiologic variable that was controlled was the end-tidal CO2 level. The subjects were instructed to maintain a uniform breathing pattern throughout the experiment. However, due to O2 effects on chemoreceptors in the brain (Dean et al, 2004), hyperventilation is known to occur during a hyperoxia challenge, which results in a reduced EtCO2 as documented by a number of studies in the literature (Baddeley et al, 2000; Dean et al, 2004; Guyton and Hall, 2005). To minimize CO2 changes during the hyperoxia challenge, we added a small amount of CO2 to the hyperoxic air (1% and 2% CO2 to FiO2 50% and 98%, respectively). This procedure was found to be partially effective, especially for the 50% FiO2 condition where the EtCO2 change is now only ∼1 mm Hg (Table 1). To further minimize the influence of CO2 change on our data interpretation, a correction was made based on the literature reports of CMRO2 and CBF dependence on [CO2]a, as described in the Materials and methods. Because the correction curve itself may contain experimental errors, we conducted an error propagation analysis using Monte Carlo simulations (see Supplementary text). We found that the coefficients associated with the CMRO2 and O2 relationship were only modestly affected by the correction curve. Within our simulations (1,000
In the estimation of venous O2 pressure (thereby the amount of dissolved O2), we did not account for the pH influence on the O2 dissociation curve (known as the Bohr Effect). Although changes in [CO2]a may alter pH, thereby shifting the curve, the impact of this effect on our CMRO2 estimation is expected to be minimal as the dissolved O2 in the venous blood is negligible compared with hemoglobin-bound O2.
Implications for Calibrated Functional Magnetic Resonance Imaging
It has recently been proposed that hyperoxia can be used as a physiologic challenge in calibrated fMRI (Chiarelli et al, 2007). The previous study has assumed that hyperoxia does not alter CMRO2. In the context of a CMRO2 reduction as suggested in the present study, the theoretical framework described in Chiarelli
One may also speculate the use of hypoxia for calibrated fMRI. However, since arterial blood also contains deoxyhemoglobin, the model becomes considerably more complicated due to the need to account for arterial oxygenation and arterial blood volume. More work is therefore needed to explore the feasibility of hypoxia for fMRI calibration.
Limitations of the Study
The findings from the present study should be interpreted in view of several limitations. One is that the technique used in the present study could only measure global CMRO2, but no regional values were obtained. Therefore, while the data suggested a clear effect of O2 on brain metabolism, it was not possible to evaluate potential regional heterogeneity of this effect or whether certain brain regions are more sensitive to O2 challenge. Another limitation is that the study has only included young, healthy control subjects, thus the results may not be applicable to elders or patients with traumatic brain injury or brain ischemia. Finally, despite our efforts to control and correct for CO2 effects, it would have been ideal to use a CO2 clamping method (Wise et al, 2007) in the experiments. The correction approach used in the present study is based on the literature results on the influence of CO2 on CMRO2 and CBF. It should be noted, however, that these literature data were measured under normoxia conditions. Under hyperoxia or hypoxia conditions, the relationship between CMRO2/CBF and CO2 may be different (i.e., there could be an interaction term between O2 and CO2 effects). There is some evidence suggesting that the interaction term is negligible for CBF (Floyd et al, 2003). However, future studies are needed to examine the interaction effect on CMRO2.
Conclusions
The present study suggests that, aside from the expected effect on blood O2 saturation, hypoxia enhanced brain metabolic rate while hyperoxia suppressed it. Additionally, CBF was increased in hypoxia but showed no apparent changes during hyperoxia.
Footnotes
Acknowledgements
The authors would like to express gratitude to Yamei Cheng for assistance with the experiments and to Dr A. Dean Sherry for helpful discussions. The authors are also grateful to Dr Janet Jerrow for scientific editing of the manuscript.
Disclosure/conflict of interest
The authors declare no conflict of interest.