
Abstract
Hypercapnia challenge (e.g. inhalation of CO2) has been used in calibrated fMRI as well as in the mapping of vascular reactivity in cerebrovascular diseases. An important assumption underlying these measurements is that CO2 is a pure vascular challenge but does not alter neural activity. However, recent reports have suggested that CO2 inhalation may suppress neural activity and brain metabolic rate. Therefore, the goal of this study is to propose and test a gas challenge that is truly “iso-metabolic,” by adding a hypoxic component to the hypercapnic challenge, since hypoxia has been shown to enhance cerebral metabolic rate of oxygen (CMRO2). Measurement of global CMRO2 under various gas challenge conditions revealed that, while hypercapnia (P = 0.002) and hypoxia (P = 0.002) individually altered CMRO2 (by −7.6 ± 1.7% and 16.7 ± 4.1%, respectively), inhalation of hypercapnic-hypoxia gas (5% CO2/13% O2) did not change brain metabolism (CMRO2 change: 1.5 ± 3.9%, P = 0.92). Moreover, cerebral blood flow response to the hypercapnic-hypoxia challenge (in terms of % change per mmHg CO2 change) was even greater than that to hypercapnia alone (P = 0.007). Findings in this study suggest that hypercapnic-hypoxia gas challenge may be a useful maneuver in physiological MRI as it preserves vasodilatory response yet does not alter brain metabolism.
Introduction
Gas-inhalation imaging studies such as hypercapnia (e.g. inhalation of CO2 gas mixture) MRI are useful means to investigate vascular responses to “stress-tests.”1–4 These imaging schemes have been used widely in calibrated fMRI5,6 and in the mapping of cerebrovascular reactivity (CVR)3,4 in vascular diseases. In calibrated fMRI, CO2 is used as a potent vasodilator to allow the estimation of maximum Blood-Oxygenation-Level-Dependent (BOLD) signal one can possibly obtain in a particular voxel, often referred to as the M factor, which then provides a calibration factor for the neural activity induced BOLD signal in the same voxel.5,6 In CVR mapping, perfusion alterations in response to CO2 inhalation are quantified in units of signal change per mmHg CO2 increase, which allow the assessment of vascular reserve in patients with cerebrovascular conditions such as arterial stenosis, 7 small vessel disease, 8 brain tumor, 9 and traumatic brain injury. 10
A lingering and sometimes debatable assumption underlying these measurements is that CO2 is a pure vascular challenge, that is, CO2 dilates blood vessels but does not alter neural activity or brain metabolism. While this notion has been supported by some studies,11,12 others have brought this assumption into question. Findings from laboratory animals showed that higher CO2 partial pressure has a significant effect on neural tissue, such as reducing pH level in the extracellular space, increasing adenosine concentration, and suppressing synaptic potentials.13–15 When conducting measurements in conscious human subjects, several studies also suggested that CO2 inhalation may suppress neural activity16,17 and brain metabolic rate.1,18 These potential effects of CO2 on neurometabolism may complicate the interpretation of calibrated fMRI and CVR signals. Therefore, the central goal of the present study is to test whether we can identify a gas challenge that is truly “iso-metabolic” while still producing a clear vascular response. The approach used in this report is to add a hypoxic component to the hypercapnic challenge, as hypoxia has previously been shown to enhance metabolic rate. 2 Thus, we empirically hypothesize that the combination of hypercapnia with hypoxia may alleviate the neural suppression effect of hypercapnia alone.
Since neural suppression in itself could decrease cerebral blood flow (CBF) via neurovascular coupling, the CBF response observed during hypercapnia-alone challenge may represent a combined effect of direct effect of CO2 on vasculature (which increases CBF) and indirect effect of neural suppression (which decreases CBF). Thus, a second hypothesis in this study is that CBF response to combined hypercapnia/hypoxia challenge should be greater (in terms of % change per mmHg CO2 change), since the neurometabolic effect is removed in the combined challenge.
In this study, we estimated global cerebral metabolic rate of oxygen (CMRO2), CBF, arterial oxygenation (Ya), and venous oxygenation (Yv), when subjects inhaled three different gas mixtures of 5% CO2/21% O2/74% N2 (hypercapnia alone), 13% O2/87% N2 (hypoxia alone), and 5% CO2/13% O2/82% N2 (hypercapnic-hypoxia), respectively. The results were compared with values measured under room air to examine the vascular and metabolic effects of these challenges on the brain.
Materials and methods
Participants
A total of 12 healthy subjects (age 29 ± 5 years, 7 males and 5 females) were studied. Each subject gave an informed written consent before participating in the study. The study protocol was approved by the Institutional Review Board of the University of Texas Southwestern Medical Center. The study was performed in accordance with the ethical guidelines of the University of Texas Southwestern Medical Center Institutional Review Board, which is based on the Belmont Report. The participants did not report pulmonary, respiratory, neurologic, or psychiatric disorders according to self-completed questionnaires. None of the participants were smokers or had asthma.
Study design
Each subject participated in MRI scans consisting of three different gas challenges. These three gas challenges were conducted in three separate sessions on the same day, with a short break in-between. The order of gas challenges was counterbalanced across subjects. The timing paradigm was similar across sessions. Taking the hypercapnic-hypoxia session, for example, the subjects first inhaled normal room air for 8 min and then the valve was switched to the hypercapnic-hypoxia gas for 6 min, followed by another 6 min of room air breathing. CMRO2 MRI scans (including CBF and venous oxygenation measurements) were performed continuously during the entire session, resulting in a time course for each physiological variable at a rate of 110 s per time point. The paradigm for the other two gas challenges was the same except that, for hypoxia-only challenge, the hypoxia gas period was 12 min. The duration of the gas challenges necessary to reach a steady state has been extensively piloted in a few extra subjects before we carried out the experiments described in this study. To determine that a new steady state has been reached, we continuously recorded arterial oxygenation (Ya) and end-tidal (Et) CO2 and, when their trace has plateaued, we consider it a steady state. In our experience, it takes longer for hypoxia to reach a steady state compared with the other two challenges. Physiological parameters during the transition periods are shown in Supplementary Fig. S1 to verify these points.
Modulation of gas content was achieved using a custom-made breathing apparatus.1,2,19 Briefly, after lying on the magnet table, the subject was fitted with a nose clip and a mouthpiece, so that the subject could breathe through the mouth only. The mouthpiece was connected to a three-way valve, which delivers either room air or a special gas mixture contained in a Douglas bag. Three Douglas bags containing different gas mixtures were used for the planned challenges: (a) 5% CO2, 21% O2, and balanced N2 (hypercapnia); (b) 0% CO2, 13% O2, and balanced N2 (hypoxia); and (c) 5% CO2, 13% O2, and balanced N2 (hypercapnic-hypoxia).
Previous studies have shown that there are potential effects of sleep and drowsiness on brain CBF and metabolism.20,21 Therefore, subjects were instructed to stay awake and maintain a uniform breathing pattern during the entire experiment. Continuous physiologic recordings were obtained for EtCO2 (Capnograph; Novametrix Medical System, Wallingford, CT, USA), EtO2 (BIOPAC Systems, Goleta, CA, USA), and Ya. In this study, Ya was measured on the fingertip of the participant using pulse oximetry device (Invivo, Gainesville, FL, USA). This strategy was used due to its relative convenience and non-invasive nature. Note that, although Ya in this study is measured in the periphery rather than centrally, the oxygen saturation fraction in peripheral arteries are expected to be the same as those in the brain, because they both came from the heart. Furthermore, a number of studies have performed directly comparison between pulse oximeter and arterial sampling, and found excellent agreement between them.22,23 After the MRI scans were completed, a blood sample was obtained from each subject's fingertip to determine Hct, which is needed to obtain an accurate estimation of blood oxygenation from the MRI measure of T2. 24
Theory for the measurement of global CMRO2
Our approach to estimate CMRO2 was based on the Fick principle.
12
The estimation of CMRO2 can be written as the following equation:

In our approach, global venous oxygenation, Yv, was measured by a T2-Relaxation-Under-Spin-Tagging (TRUST) MRI technique in the superior sagittal sinus (SSS).24,26 TRUST MRI is based on the principle that blood oxygenation has a known relationship with the blood T2.27,28 This technique uses the spin tagging method to generate pure venous blood signal with different T2 weightings. The venous blood signals were fitted to a monoexponential function to obtain T2, which was in turn converted to Yv through a calibration plot. 24 Global CBF was determined using phase contrast MRI. The arterial oxygenation, Ya, is measured with a pulse oximetry.
MRI experiments
The MRI scans were performed on a 3-Tesla system (Philips Healthcare, Best, The Netherlands). During the gas breathing session, two sequences, TRUST MRI and PC MRI, were performed in an interleaved fashion during the entire session, generating time courses for Yv, CBF, and CMRO2.
The TRUST imaging slice was planned to be parallel to anterior-commissure posterior-commissure (AC-PC) line with a distance of 20 mm from the sinus confluence where the SSS, straight sinus, and transverse sinus join. The imaging parameters for the TRUST MRI were TR = 3000 ms, TI = 1022 ms, voxel size = 3.44 × 3.44 × 5 mm3, four different T2-weightings with eTEs of 1, 40, 80, and 160 ms, with a τCPMG = 10 ms, scan duration = 1.2 min.
PC MRI was performed at a position identical to TRUST MRI, allowing measurement of blood flow in the SSS. The scan parameters of PC MRI were as following 29 : single slice, field of view (FOV) = 200 × 200 × 5 mm3, voxel size = 0.5 × 0.5 × 5 mm3, and VENC = 40 cm/s in the through-place direction. Note that a relatively low VENC was used to increase signal-to-noise (SNR) of voxels near the edge of the vessel, which have a slower flow velocity. Because low VENC causes phase wrapping in the voxels with flow velocity higher than VENC (usually at the center of SSS during gas challenge), velocity aliasing correction was performed in the analysis. 30
Data processing
The data processing procedures for TRUST MRI and PC MRI were based on algorithms described previously.29,31–33 For TRUST data, after pair-wise subtraction between control and labeled images was done, four voxels with the highest signals in the difference images in the region of interest (ROI) were chosen as the final mask for spatial averaging. The venous blood signals were then fitted to a monoexponential function to obtain T2. The T2 was in turn converted to Yv via a calibration plot obtained by in vitro blood experiments. 24
Data processing of PC MRI followed previously reported methods.29,31 The operator was instructed to manually draw an ROI on the magnitude image by tracing the boundary of the SSS based on the brightness of the voxels without including adjacent vessels. The final mask was applied to the phase image (velocity map) and then integration of the map (i.e. velocity × area) yielded CBF in the unit of mL/min. The rater-dependence of this processing procedure has been shown previously to be relatively small. 29
For statistical analysis, the physiological parameters (i.e. CMRO2, CBF, Ya, and Yv) measured under pre-challenge room air and gas challenge conditions were compared using paired t-test. For the gas challenge state, only the steady-state data, i.e. last time point during the gas challenge period, was used. CVR in the units of % change in CBF per mmHg change in end-tidal CO2 was computed and compared across different gas challenges. P < 0.05 was considered statistically significant.
Results
All subjects were able to complete the breathing tasks without significant discomfort, although some participants reported that they needed to breathe harder during the hypercapnic-hypoxia challenge. Figure 1(a) to (c) shows EtCO2, EtO2, and Ya time courses averaged over 12 subjects. The time interval between consecutive measurements is approximately 110 s, in accordance with the MRI measures. The shaded regions represent the gas challenge episodes. All parameters show stable baselines and well-defined changes during gas challenge episodes. When the gas challenges ceased, these parameters returned to baseline.
Time courses of the experimental measures: (a) EtCO2, (b) EtO2, (c)Ya, (d) Yv, (e) CBF, and (f) CMRO2. Each dot indicates one measurement. The error bar indicates the standard error, i.e. (standard deviation across subjects/sqrt (number of subjects)), representing how much error there is in the reported group average value. The shaded region represents the gas challenge period. Only steady-state time points are shown.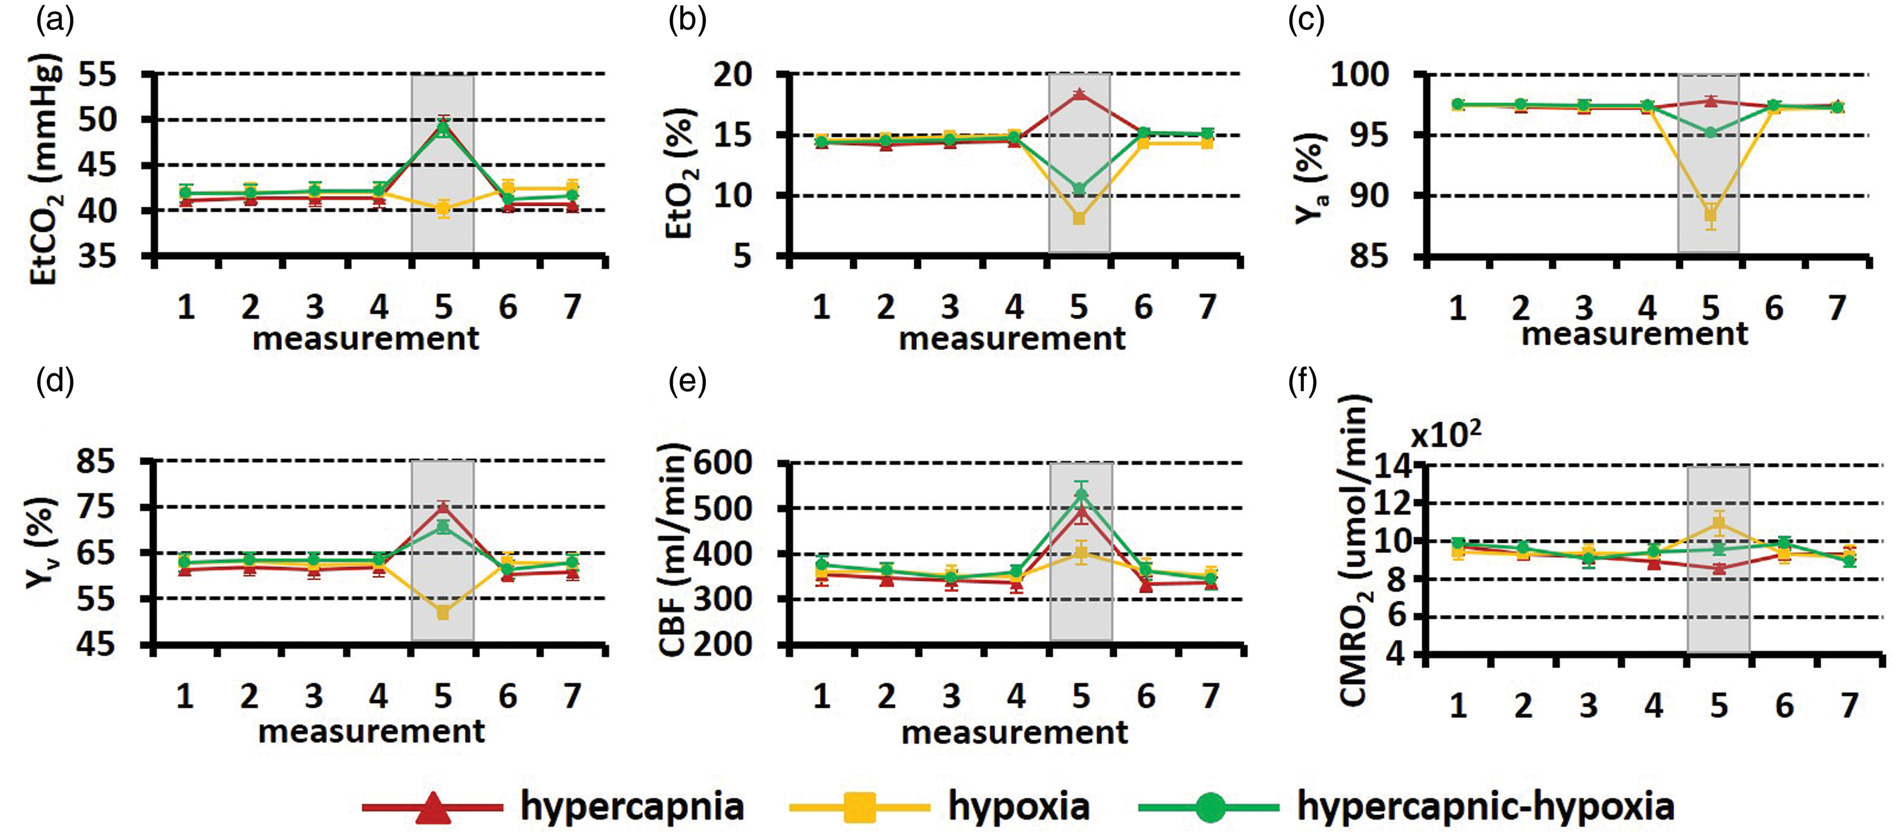
Figure 2 displays representative imaging data for the measurements of Yv (panels A to B) and CBF (panel C). Figure 2(a) illustrates control, labeled and difference images from TRUST MRI. The pure blood signals with different T2 weighting were then fitted to the monoexponential function to obtain decay time constant T2 and then convert to Yv (Figure 2(b)). The MR T2 signal decay is much slower during hypercapnia and hypercapnic-hypoxia, suggesting a longer venous blood T2. The longer blood T2 corresponds to the increased Yv during hypercapnia and hypercapnic-hypoxia. On the other hand, the MR T2 signal decayed rapidly during hypoxia, indicating the lower oxygenation in the venous blood. The representative CBF data acquired from PC-MRI is exhibited in Figure 2(c). Note that darker color indicates greater flow velocity. Time courses of Yv, CBF, and the corresponding CMRO2 are shown in Figure 1(d) to (f), respectively. Transition time points of Yv and CBF are shown in Supplementary Fig. S1. Note that CMRO2 during transition periods cannot be estimated, as the Fick principle requires a steady state.
Representative MR images for the CMRO2 measurement. (a) TRUST MRI for the measurement of global Yv. Red arrow indicates the SSS. The subtraction of control and labeled images yielded pure blood signal. (b) The fitting of the signal as a function of effective TE can generate an estimation of blood T2. Data from four different respiratory states are shown. (c) Phase contrast MRI for the measurement of CBF. Darker color indicates a greater flow velocity.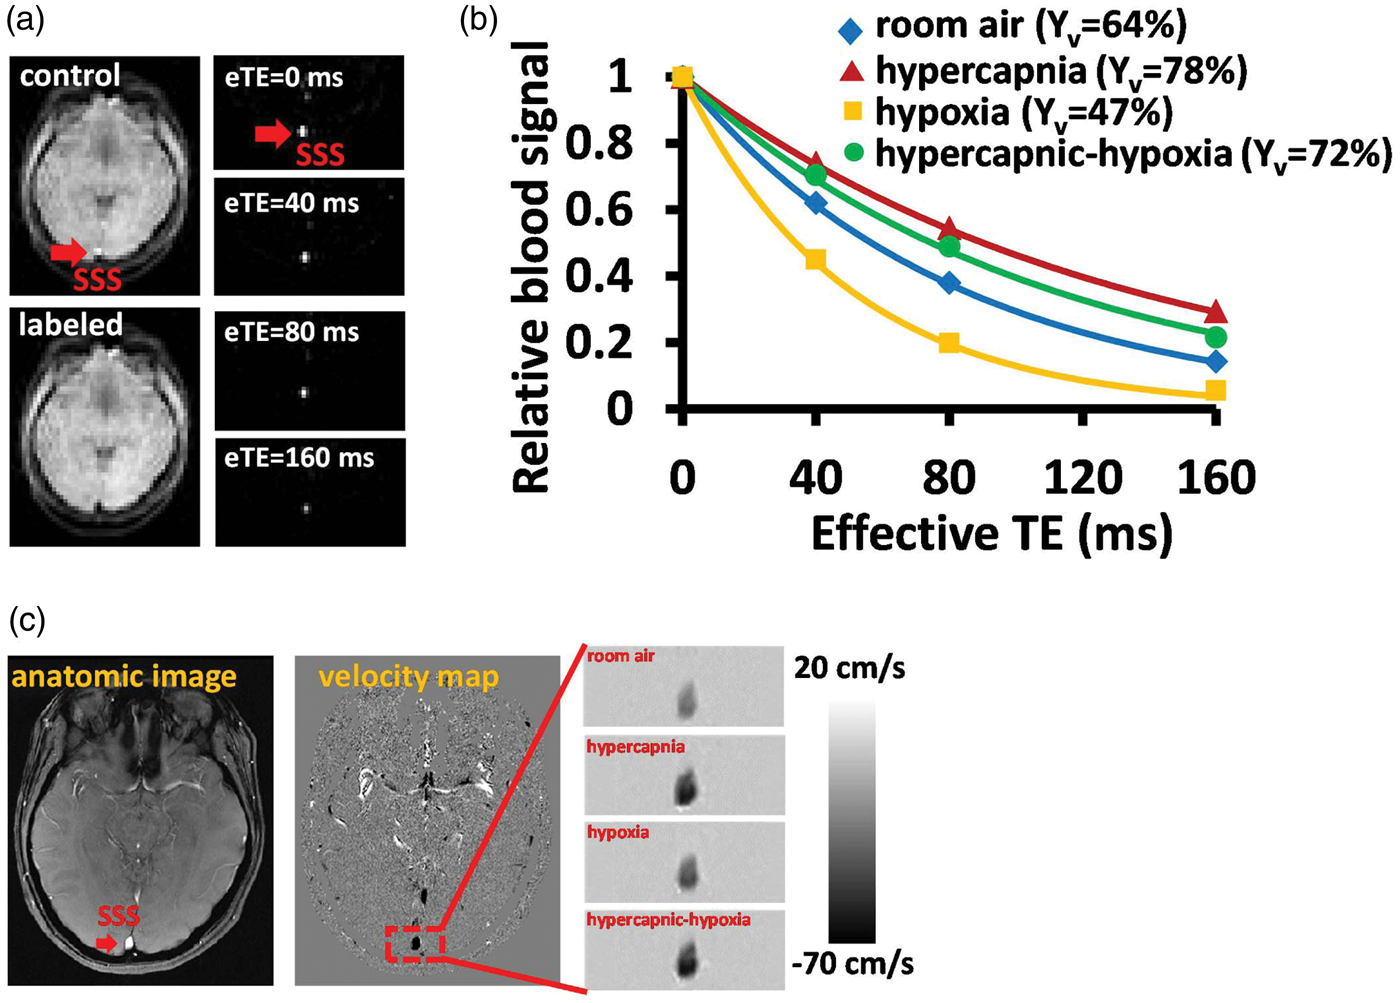
Figure 3 summarizes the physiological changes during the steady-state of each gas challenge. Arterial oxygenation (Ya) (Figure 3(a)) increases slightly with hypercapnic gas (P = 0.049), and is substantially reduced with hypoxic gas (P < 0.001). The extent of Ya reduction is attenuated in the hypercapnic-hypoxia case, presumably because hypercapnia-induced hyperventilation offsets some of the hypoxia effect. Venous oxygenation (Yv) was elevated by hypercapnia, but reduced by hypoxia. When both gas effects were combined (i.e. in hypercapnic-hypoxia), the CO2 effect seems to have prevailed, resulting in an Yv increase (P < 0.001) (Figure 3(b)). CBF (Figure 3(c)) was the only parameter that showed a change (P < 0.001) in the same direction for all three gas challenges. This is because both hypercapnia and hypoxia tend to increase CBF and their combination, of course, also increases CBF.
Summary of (a) Ya, (b) Yv, (c) CBF, and (d) CMRO2 under different respiratory states. *P < 0.05; **P < 0.01.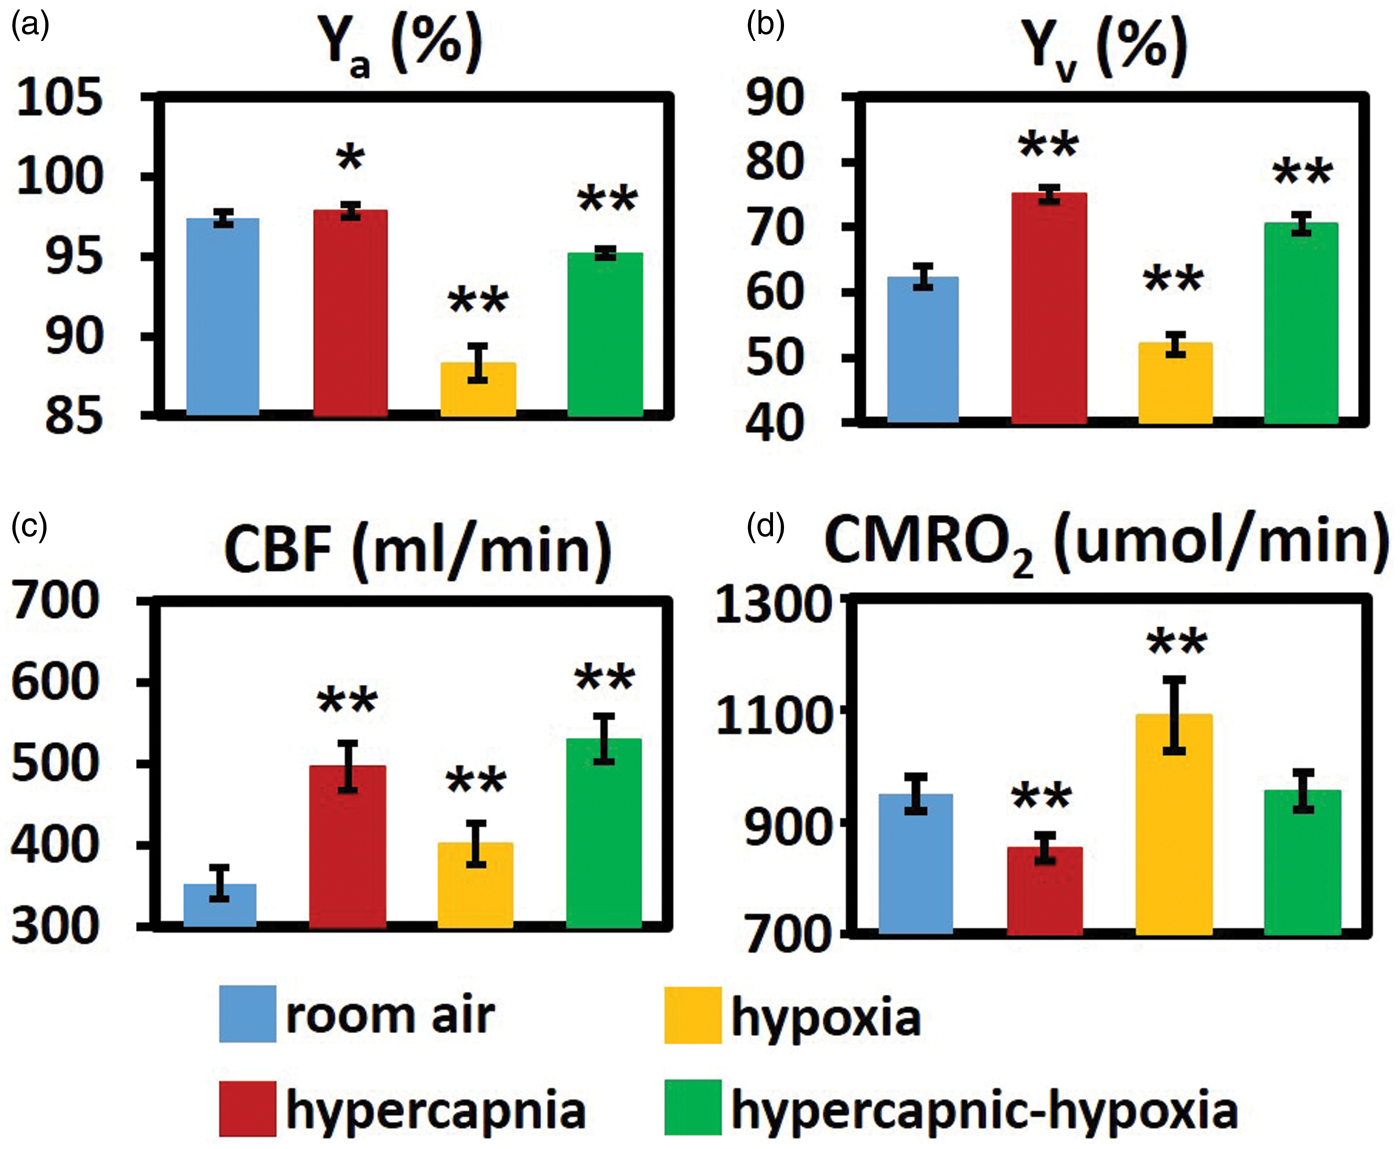
These three gas challenges had different effects on CMRO2 (Figure 3(d)). Hypercapnia resulted in a suppression of CMRO2 by −7.6 ± 1.7% (P = 0.002). In contrast, hypoxia increased CMRO2 by 16.7 ± 4.1 % (P = 0.002). Importantly, for hypercapnic-hypoxia, CMRO2 showed no change (1.5 ± 3.9%, P = 0.92), supporting our hypothesis that hypercapnic-hypoxia provides a truly “iso-metabolic” gas challenge.
We computed CVR separately using the hypercapnia data and the hypercapnic-hypoxia data. It was found that CVR calculated using hypercapnic-hypoxia data was significantly greater than that using the hypercapnia data (P = 0.007, Figure 4). This finding suggests that either the metabolic differences between the two challenges may have played a role in the measured CBF responses or hypercapnia and hypoxia have additive effect on CBF.
CVR measured with two different gas challenges, hypercapnia and hypercapnic-hypoxia. CVR is written in the unit of percent CBF change per mmHg change in CO2 concentration. **P < 0.01.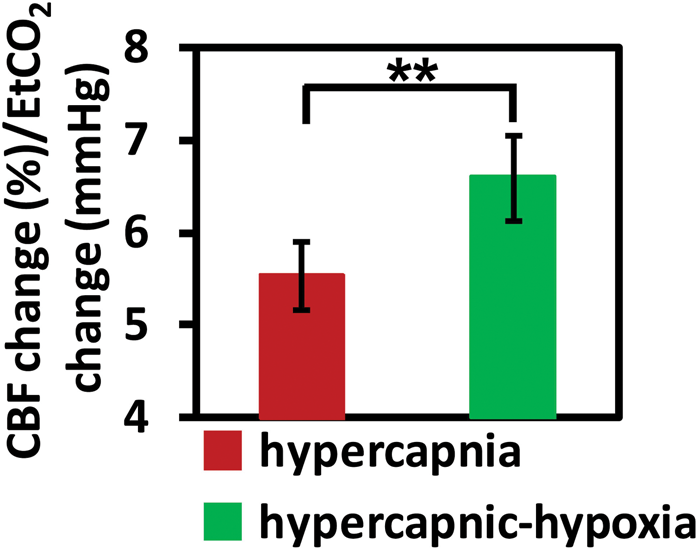
Discussion
In this study, we characterized brain vascular and metabolic responses to the combination of hypercapnia and hypoxia challenge. It has been suggested previously that hypercapnia reduced metabolic activity in the brain1,18 while hypoxia increased metabolic activity.2,34 When combining both challenges, the neural suppression effect of CO2 appears to be nullified by the metabolic enhancement effect of hypoxia, and results in an unchanged CMRO2.
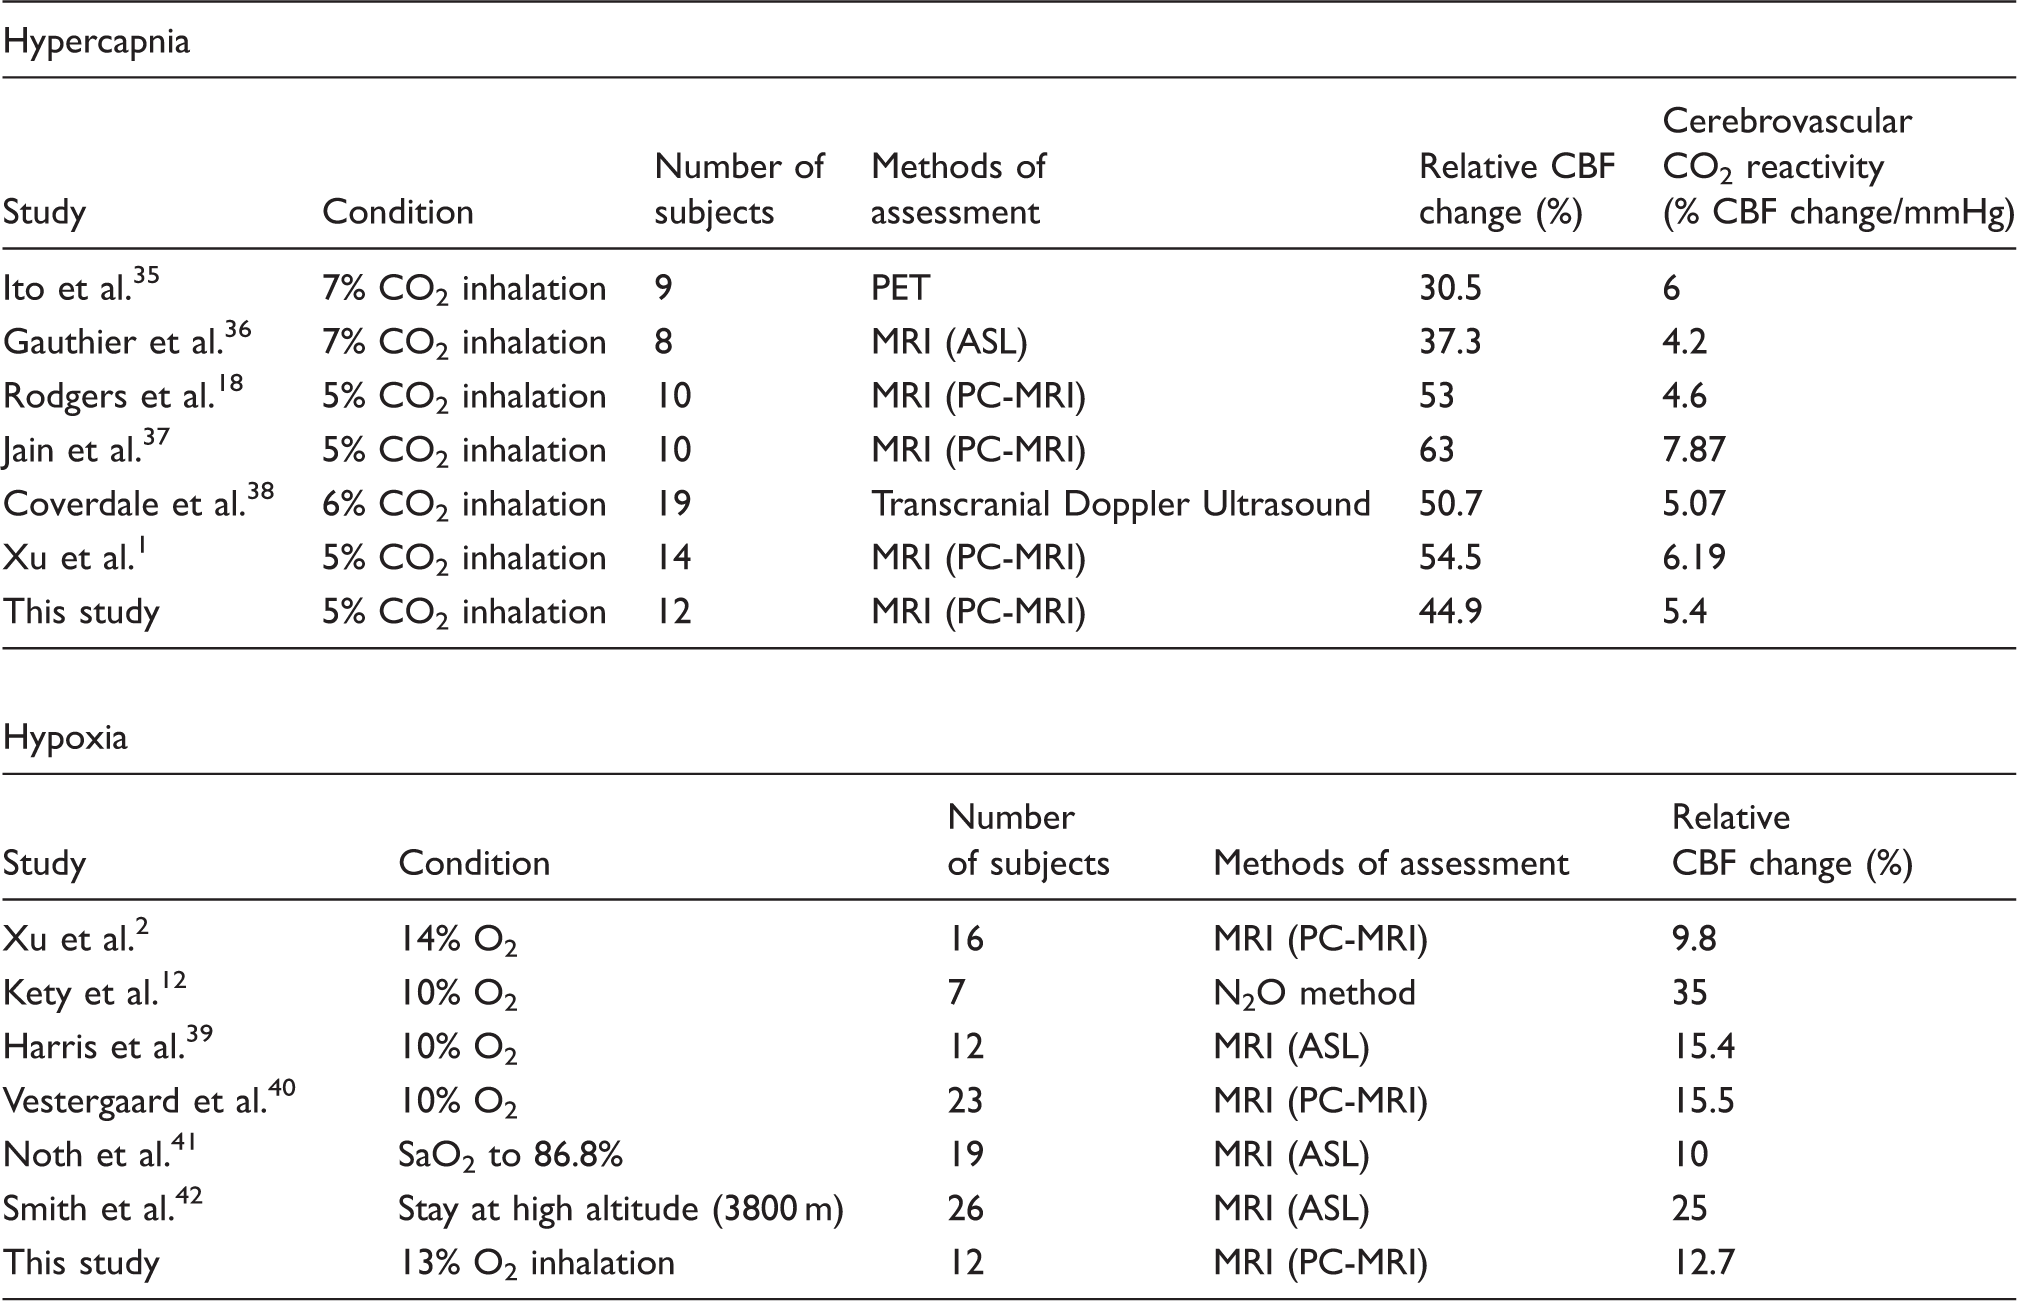
Summary of hypercapnia and hypoxia induced CBF changes in the literature.
Fewer studies have examined the O2 effects on neural and metabolic activity. Several recent MRI studies have all suggested a moderate increase of CMRO2 due to hypoxia.2,40,48 In this regard, the observation in the present study is in good agreement with these prior findings. It is still unclear what the physiological mechanism is that could explain the elevated brain oxygen metabolic rate during hypoxic state. Several reasons are possible. One is that elevated oxygen consumption does not necessarily result in an increase in ATP production (or neural activity), as biological processes in mitochondria may be disrupted in hypoxia. Solaini et al. suggested that, when exposed of hypoxia, mitochondrial membrane potential decreases to a level below its normoxic state. 49 It may therefore disrupt the efficiency of ATP production or even reverse the ATP synthase to hydrolyse. 50 This notion is supported by the observations that the rate of glycolysis 51 and the concentration of lactate40,52 are both elevated during hypoxia, suggesting that the brain may indeed be “starving” for ATP under this condition. Studies using diffusion MRI have also shown that tissue water diffusion coefficient is reduced during hypoxia, suggesting a diminished cerebral energy status.53,54 That is, the additional oxygen consumed may have not been used for supporting neural activity. Therefore, future studies are needed to directly examine neural activity changes during hypoxia. A second possible mechanism is that the CMRO2 response during hypoxia is driven by hypocapnia that occurs as a result of subject hyperventilation. 42 A decreased CO2 level is known to increase neuronal excitability via adenosine receptors, which could increase oxygen metabolism.
No reports, to our knowledge, have examined the metabolic response to a hypercapnic-hypoxia gas challenge, and our results suggest that a gas mixture of 5% CO2 and 13% O2 appears to be iso-metabolic. There are reports in the literature that investigated metabolic changes during breath-hold. Breath-hold causes a transient state of hypercapnic-hypoxia that lasts for 20–30 s. Rodgers et al. found that CMRO2 increased by 6% during breath-hold challenge. 55 This finding is not necessarily inconsistent with our results, because the CMRO2 change is expected to depend on the exact mix of CO2 and O2 in the gas. When the gas content in the lung is more dominated by the hypoxia effect of breath-hold, an increase in CMRO2 is expected.2,42,48 Another recent report showed that acetazolamide, a carbonic anhydrase inhibitor, abolished the CMRO2 effect by hypoxia. 56 Since carbonic anhydrase inhibitor has a similar effect as hypercapnia in terms of lowering blood pH, this finding appears to be consistent with the observations of the present study.
Although CMRO2 did not change during the hypercapnic-hypoxia challenge, it is unclear whether neural activity remains unaltered. Previous literature has suggested that hypercapnia suppresses neural activity as measured by EEG 1 and MEG, 16 in addition to a decrease in metabolism. If the hypoxia effect on the brain is such that neural activity is sustained but more oxygen is consumed (due to reduced efficiency in mitochondria), then it follows that hypercapnic-hypoxia may be associated with unchanged metabolic rate but suppressed neural activity. That is, the brain is less active despite consuming the same amount of oxygen. Another possible explanation is that the hypercapnic gas abolishes the hypocapnic effect of hypoxia, thereby also removing the CMRO2 effect of hypoxia. This mechanism, however, cannot explain our finding that hypercapnic-hypoxia and hypercapnia-only challenges have similar effects on end-tidal CO2 (Figure 1), yet they have different effects on CMRO2 (one decreasing, the other unchanged).
The knowledge of CMRO2 change during gas challenges has implications for calibrated fMRI, a useful method for obtaining a quantitative estimation of neural activity evoked by stimulation. Various calibration methods have been proposed, including mild hypercapnia,5,6 hyperoxia, 57 and a combination of hypercapnia and hyperoxia (carbogen). 58 An important assumption underlying these calibration methods is that these gas challenges are iso-metabolic, i.e. CMRO2 is not altered during the gas challenge. Should CMRO2 actually change during the gas challenge, the calibration factor M will be biased, and so will the CMRO2 change during stimulation. For example, if CMRO2 decreases by 7.6% during hypercapnia inhalation as measured by the present study, the M factor will be over-estimated by 22.2%. By further assuming that BOLD signal change is 2.64% during visual stimulation 59 and true M = 7.4%, 60 the CMRO2 change can be over-estimated by 10.3%. Similarly, if hyperoxia causes a CMRO2 decrease of 10.3%, 2 the M factor and CMRO2 change will be over-estimated by 41.4% and 21.4%, respectively. The identification of hypercapnic-hypoxia as an iso-metabolic gas challenge may open new avenues for fMRI calibration and better quantification of neural activity during rest and brain activation.
CVR is increasingly recognized as a useful vascular marker in patients with various neurological conditions such as intracranial stenosis,61,62 carotid artery stenosis, 7 small vessel diseases, 8 stroke, 63 traumatic brain injury, 10 brain tumor, 9 multiple sclerosis (MS) 3 and Alzheimer's disease. 4 CVR is usually measured with hypercapnia challenge. The findings in recent work as well as those in the present study suggest that CVR values measured with hypercapnia alone may contain contaminations by metabolic alterations, thereby may not be a vascular specific marker. Thus, hypercapnic-hypoxia can provide a more accurate assessment of dilatory capacity of blood vessels independent of tissue responses to CO2. In fact, our data suggest that CVR in units of CBF change per mmHg CO2 change was greater during the combined challenge than during hypercapnia alone. This could be explained by the notion that the CBF response to hypercapnia-alone challenge likely reflects a (destructive) summation of vascular effect of CO2 (which increases CBF) and a metabolic effect (which decrease CBF via neurovascular coupling). In contrast, the measured CBF response during hypercapnic-hypoxia may originate from a pure vascular effect as there are no metabolic alterations. Another possible contribution is that hypoxic gas itself (i.e. lower O2) may be vasodilative12,64 and it could have an additive effect on CBF on top of the hypercapnia effect. To test the significance of the metabolic effect in CBF change during hypercapnic-hypoxia, we conducted two calculations. In the first calculation, we assumed that the gas challenges do not alter oxygen metabolism, thus the CBF change is solely attributed to vascular effects of CO2 and O2. This resulted in an estimated CBF increase of 52.6% during hypercapnic-hypoxia, which is greater than the experimental results of 46%. In the second calculation, the metabolic changes measured in the present study were accounted for and the flow-metabolism coupling ratio, n, was assumed to be 3. We estimated a CBF increase of 46.6% during hypercapnic-hypoxia, which is in excellent agreement with the experimental findings.
It should be pointed out that our observation of an iso-metabolic effect of hypercapnic-hypoxia is based on the group-level results averaged across all subjects, not on individual subject. As can be seen in the Supplementary Fig. S2, individual CMRO2 changes due to hypercapnic-hypoxia vary from positive to negative values, and it is not possible to determine whether they are due to measurement noise or individual variation. For comparison, we also show in Supplementary Fig. S2 CMRO2 changes due to hypoxia-only and hypercapnia-only, illustrating a definitive change under those gas conditions.
In the above-described calculation of CMRO2, we only considered oxygen bound to hemoglobin but did not account for oxygen that is dissolved in the plasma. This assumption was based on the notion that the vast majority of the oxygen molecules carried by the blood is in the form of hemoglobin-bound oxygen and that no hyperoxic state was used in this study. Thus, the amount of dissolved oxygen is expected to be negligible. Nonetheless, we also performed additional analysis in which the dissolved oxygen was estimated using experimentally measured EtO2 values and assumptions on alveolar-arterial O2 pressure difference and an oxygen dissociation curve. We found that all of significant effects described above remained after this correction.
The findings from the present study need to be interpreted in the context of its limitations. First, the technique used in the present study could only provide information regarding global CMRO2 changes. We do not preclude the possibility of regional heterogeneity of CMRO2 change. Moreover, since TRUST and PC MRI were applied to the SSS only, our conclusions should be limited to cortical regions, but not deep brain or brainstem regions. Second, in this study, only young and healthy subjects were recruited. It has been shown that basal vascular tone could be different in stoke patients, 65 which may influence the brain's metabolic response to gas challenges. Finally, the potential effect of hypercapnic-hypoxia on blood pressure was not evaluated and this may contribute to CBF change and CVR measurement. Blood pressure is tightly linked to the perfusion pressure, which is the driving force for blood flow. Hypercapnia has been showed to elevate blood pressure and consequently increase blood flow. 66 The level of elevated blood pressure during hypercapnic-hypoxia challenge has not been fully examined.
In conclusion, hypercapnia suppressed brain metabolic rate while hypoxia enhanced it. When combining these challenges, hypercapnic-hypoxia gas inhalation appears to induce a truly “iso-metabolic” vascular response. Additionally, as the metabolic effect was removed, CVR assessed by hypercapnic-hypoxia was greater than that using hypercapnia alone. We therefore propose that hypercapnic-hypoxia may be a useful maneuver for calibrated fMRI and CVR studies.
Footnotes
Funding
The author(s) disclosed receipt of the following financial support for the research authorship and/or publication of this article: This work was partly supported by the following grants NIH R01 MH084021, NIH R01 NS067015, NIH R01 AG042753, NIH R01 AG047972, NIH R21 NS078656 NIH R21 NS085634.
Declaration of conflicting interests
The author(s) declared no potential conflicts of interest with respect to the research, authorship, and/or publication of this article.
Authors' contributions
H.L. conceptualized the study; S.L.P. H.L. designed the experiments prepared the manuscript; S.L.P. performed the experiments conducted data analysis; H.R. M.S. B.P.T. participated in the data collection.