
Abstract
Cerebrovascular diseases can impair blood circulation and oxygen extraction from the blood. The effective oxygen diffusivity (EOD) of the capillary bed is a potential biomarker of microvascular function that has gained increasing interest, both for clinical diagnosis and for elucidating oxygen transport mechanisms. Models of capillary oxygen transport link EOD to measurable oxygen extraction fraction (OEF) and cerebral blood flow (CBF). In this work, we confirm that two well established mathematical models of oxygen transport yield nearly equivalent EOD maps. Furthermore, we propose an easy-to-implement and clinically applicable multiparametric magnetic resonance imaging (MRI) protocol for quantitative EOD mapping. Our approach is based on imaging OEF and CBF with multiparametric quantitative blood oxygenation level dependent (mq-BOLD) MRI and pseudo-continuous arterial spin labeling (pCASL), respectively. We evaluated the imaging protocol by comparing MRI-EOD maps of 12 young healthy volunteers to PET data from a published study in different individuals. Our results show comparably good correlation between MRI- and PET-derived cortical EOD, OEF and CBF. Importantly, absolute values of MRI and PET showed high accordance for all three parameters. In conclusion, our data indicates feasibility of the proposed MRI protocol for EOD mapping, rendering the method promising for future clinical evaluation of patients with cerebrovascular diseases.
Keywords
Introduction
Well-adjusted coupling between cerebral perfusion and oxygen metabolism is crucial for healthy brain function. This requires adaptation of oxygen extraction from the inflowing blood across the capillary walls into the surrounding brain tissue to meet the tissue oxygen demand. In the human brain, oxidative metabolism critically depends on the delicate balance between supply and consumption of oxygen, since oxygen cannot be stored in a significant amount. 1 While some neuroimaging studies found that changes in cerebral blood flow (CBF) and cerebral metabolic rate of oxygen consumption (CMRO2) are not generally tightly coupled, 2 a meta-analysis of studies ranging from functional neuroactivation to graded anesthesia showed a much tighter coupling between CMRO2 and CBF. 3 This was later confirmed by a rodent study examining the coupling between CMRO2 and CBF. 4
These findings can be explained by a steady-state compartment model of oxygen transport in the microvasculature, which introduces a variable effective oxygen diffusivity (EOD) that influences the oxygen extraction fraction (OEF) in relation to CBF.3,5 Similar models that included additional physiological parameters were proposed, for example considering the blood hemoglobin concentration [Hb] and the half-saturation pressure of the blood oxygen binding curve P50.6–8 Although physiological mechanisms driving changes in EOD are not entirely clear yet, it has been proposed that they may reflect underlying changes at the capillary level, e.g., in microhematocrit, partial pressure of oxygen, capillary density, capillary blood volume or capillary transit time heterogeneity.3,8–11 In any case, EOD may serve as a valuable clinical biomarker that is sensitive to underlying capillary, pericyte or mitochondrial dysfunction, e.g., in patients with neurovascular and degenerative diseases ranging from carotid artery stenosis and stroke to Alzheimer’s disease.8,12 Importantly, recent studies in patients with, e.g., unilateral stenosis and occlusion 13 or multiple sclerosis 14 indicated that EOD could provide complementary information – regarding hemodynamic compromise and the association of such impairments with other variables such as age or white matter lesion volume – that is distinct from CBF, OEF or CMRO2.
Since the aforementioned models establish relationships between oxygen diffusivity, oxygenation and perfusion, parameter maps of EOD can be derived from OEF and CBF maps. First applications were reported using 15O-PET in patients with steno-occlusive disease.6,13 However, PET is severely limited by short-lived tracers, arterial blood sampling, restricted availability of PET scanners with onsite cyclotron, and the application of radioactive tracers in general. 15 In contrast, no radioactive tracers are needed in a recently proposed magnetic resonance imaging (MRI)-based framework, 8 allowing for more widespread clinical applications. However, in this approach, OEF-mapping is based on dual-calibrated functional MRI (fMRI), which is a modification of calibrated fMRI16–18 and measures CBF and blood oxygen level dependent (BOLD) signal responses to gas challenges with hypercapnia and hyperoxia. 8 Thus, the complexity of the setup, limited tolerability of hypercapnia in certain patient groups, 19 and long scan times might restrict its clinical applicability. To the contrary, an alternative MRI-based implementation relying on gas-free OEF and CBF imaging could be performed much easier.
A recent MRI method allowing for regional measurements of OEF in humans is the multiparametric quantitative BOLD (mq-BOLD) approach.20,21 Based on three separate measurements of spin and gradient echo relaxation times T2 and T2*, as well as relative cerebral blood volume (rCBV) as a proxy for venous CBV, maps of OEF can be calculated. This method has already been successfully applied to study vascular pathologies12,22–24 and brain tumors,25–28 since it is clinically applicable with standard MRI equipment. Furthermore, the quantification of OEF has recently been significantly improved by successfully addressing T2-related bias in mq-BOLD. 29
Pseudo-continuous arterial spin labeling (pCASL) allows non-invasive CBF quantification by magnetic labeling of blood water and has been successfully applied in neuroscientific and clinical research studies. 30 Moreover, its validity has been supported by several studies comparing pCASL to reference measurements by 15O-PET. 31 Currently applied pCASL implementations have been found to be most reliable in gray matter (GM). 30
We thus propose the combined acquisition of mq-BOLD and pCASL in a multiparametric MRI protocol, quantifying OEF and CBF, respectively, to finally allow modeling of EOD maps. This promising and easy-to-implement alternative to PET6 or dual-calibrated fMRI8 could pave the way for more widespread clinical applications of EOD mapping. However, a systematic evaluation of the validity of regional OEF, and consequently EOD, in humans obtained from mq-BOLD is still lacking. In particular, with regard to voxel-wise estimation of EOD, it is important to compare resulting maps to a reference standard using PET data.
An important question is also the consistency between different EOD models and, therefore, the impact of model selection on EOD parameter maps calculated from measured OEF, CBF and the arterial oxygen concentration (Ca) in humans. A theoretical comparison of three oxygen transport models was performed by Hayashi et al., 6 simulating effects of varying CBF, OEF, hemoglobin concentration in blood ([Hb]) as well as P50 on the predicted relationship with EOD. Discrepancies between different models were found, especially for input values closer to extreme physiologic parameter values. However, their significance with respect to realistic, measured OEF/CBF data and the original model from Hyder et al. 3 remains unclear.
In the present study, we propose a novel MRI-based approach to derive quantitative EOD maps from OEF and CBF measured by mq-BOLD and pCASL, respectively. We first investigated the agreement between EOD derived by two models, namely EODmodel A (Hyder et al.) 3 and EODmodel B (Hayashi et al.) 6 based on published PET reference data of healthy young subjects. 32 We then calculated EOD maps from multiparametric MRI data obtained from a similar young healthy subject cohort and compared regional EOD, OEF and CBF values to the PET reference data.
Materials and methods
We first outline two EOD models proposed by Hyder et al. 3 and Hayashi et al., 6 which we refer to as models A and B in the following. Second, we describe the comparison of these two models using PET-based CBF and CMRO2 maps from healthy young volunteers. 32 Thereafter, the MRI protocol and imaging data analysis with regard to the PET versus MRI comparison of OEF, CBF and EOD are described.
EOD models
Briefly, oxygen extraction at steady state is modelled for a single capillary, which is assumed to be an ideal cylinder of length L. Within the capillary, oxygen is either dissolved in plasma or bound to hemoglobin, and both oxygen pools are assumed to be in equilibrium.3,6 The capillary is surrounded by a cylindrical shell of tissue, where it is assumed that the tissue cylinder surface at some fixed distance from the capillary surface constitutes the end of the diffusion path, i.e., the mitochondria. 8 Oxygen is assumed to diffuse radially into the tissue compartment with a first-order rate constant for oxygen permeability k, while the blood travels down the vascular compartment.3,6,8 In the following, we outline the derivation of the two EOD models.
The temporal change in the total concentration of oxygen in the blood compartment C depends on the difference between the concentration of oxygen in blood plasma Cp and the concentration of oxygen at the end of the diffusion path (i.e., the mitochondria) Cm6,33

Assuming negligible oxygen concentration at the end of the diffusion path, i.e.,
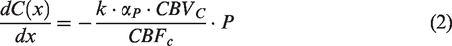
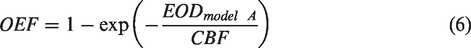
According to model A (Hyder et al.),3,4 the relation between OEF, CBF and EOD is then derived by assuming that in equation (2) the partial pressure of oxygen in plasma is

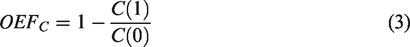
Generalization to an ensemble of identically perfused capillaries with unidirectional red blood cell flow finally yields
Note, that model A does not explicitly depend on Ca as C(0) = Ca and Ca in the C(1) term cancels out in equation (3).
Thus, the effective oxygen diffusivity can be obtained from measurements of CBF and OEF via

Model B (Hayashi et al.),
6
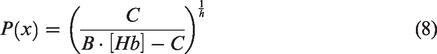
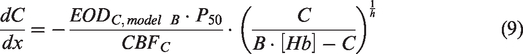
in contrast, uses the Hill equation and thus assumes that the partial pressure of oxygen in plasma P is related to the concentration of oxygen in blood C through

A comparison of equations (5) and (10) reveals that oxygen diffusivity in model A considers the first-order rate constant for oxygen permeability to be dependent on spatially changing pO2 gradients and intracapillary red blood cell density (e.g., through capillary stalling), which is usually reflected in terms of microhematocrit. In contrast, oxygen diffusivity in model B considers the red blood cells’ oxygen offloading rate constant more as a macroscopic lumped parameter that has to be derived numerically (see paragraph below). Note, that therefore EODmodel A and EODmodel B have different units of mL/100g/min and mL/100 g/mmHg/min, respectively.
Using equation (3) for introducing OEF, equation (9) can be solved numerically for C(1) for a given combination of CBF, EODmodel B, [Hb] and P50, where generalization to macroscopic quantities is achieved by assuming identically perfused capillaries. In order to obtain EODmodel B for a given set of all other parameters, we used the 4D look-up table and MATLAB (The MathWorks, Natick, MA, USA) code provided as supplementary material to a publication from Germuska et al. 8 (v1.0.1, http://doi.org/10.5281/zenodo.1461090, retrieved March 23, 2020). This look-up table was created by numerically solving equation (9) for different combinations of CBF, OEF, P50 and [Hb] as previously described. 8 Next, a 2D high-resolution table was created through resampling of the original 4D table, 8 assuming a constant value of P50 = 26 mmHg according to literature.6,10 EODmodel B was obtained from the 2D table as the value that fits best with the measured CBF and OEF.
Comparison of oxygen diffusivity models
To compare both models with measured data, maps of EODmodel A and EODmodel B were calculated using CBF and OEF maps, as well as individually measured Ca from young healthy participants of a previously published PET study.
32
OEF maps were calculated from CMRO2 and CBF maps according to Fick’s principle
Because the logarithmic term in EOD model A is undefined for OEF ≥ 1, we capped OEF at 0.99 before calculating EODmodel A and excluded those voxels from the statistical analysis. Additionally, voxels with CBF > 100 mL/100 g/min or CMRO2 > 15 mL/100 g/min were considered to be caused by artifacts and excluded from further analyses.
Parameter values obtained by both EOD models were compared regionally across 41 volumes of interest (VOIs) in the cerebral cortex using an atlas of Brodmann areas (BA, see Supplemental Table 2 for a description of these regions) in Montreal Neurological Institute (MNI) space (MRIcron, Chris Rorden, University of South Carolina, USA), which was masked for GM (probability threshold > 0.7) and cerebrospinal fluid (CSF, probability threshold < 0.05). Mean parameter values were calculated within each BA and for each PET-subject separately. In order to assess the relationship between both models, we fitted a linear mixed-effects model with EODmodel B as the dependent variable, EODmodel A as a fixed effect, and random slopes and intercepts grouped by subject and brain region, considering the clustering of datapoints. In addition, correlation across regions was calculated for each subject individually and for an average of all subjects (between region correlation). Similarly, correlation across subjects was obtained for all BAs separately and for an average of all regions (between subject correlation). We also obtained correlation between measured Ca and global mean EOD values in GM for both models to investigate the dependence of each model on individual blood oxygen content. Statistical significance was assumed for p-values <0.05. Normal distribution of EODmodel A and EODmodel B data was checked with the Kolmogorov-Smirnov test using OriginPro 2021 (Origin Lab Corporation, Northampton, MA, USA).
MRI study: Participants
The MRI study comprised 16 healthy young volunteers (9 males, age 29.5 ± 5.7 years) who were recruited by word-of-mouth advertisement and was approved by the medical ethical board of the Klinikum Rechts der Isar, in line with Human Research Committee guidelines of the Technical University of Munich (TUM). All participants provided written informed consent in accordance with the standard protocol approvals prior to scanning. Four subjects were excluded due to different sequence settings with incomplete brain coverage. MRI in 12 volunteers was compared with PET using existing CBF and CMRO2 data 32 from 15O-H2O- and 15O-O2-PET of 13 young male volunteers (age 26.1 ± 3.8 years) that were also employed for the model comparison described above.
Data acquisition
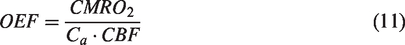
The subjects underwent MRI on a clinical 3 T Ingenia Elition MR scanner (Philips Healthcare, Best, The Netherlands) using a 32-channel head-receive-coil. The MRI-protocol is summarized in Figure 1 and comprised structural imaging (MPRAGE), pCASL to quantify CBF, as well as T2*- and T2-mapping, which, together with DSC-MRI for relative CBV (rCBV) mapping, allowed calculation of OEF according to the mq-BOLD approach.20,21,35 Details of the scanning parameters were as follows:
MRI protocol and derived parameters. MPRAGE was used for gray matter (GM) and white matter (WM) segmentation. Dynamic susceptibility contrast (DSC) imaging yielded relative cerebral blood volume (rCBV). R2′ was calculated from quantitative T2 and T2*, which – together with rCBV – was used to calculate the oxygen extraction fraction (MRI-based OEF) according to the multi-parametric quantitative BOLD (mq-BOLD) approach. Cerebral blood flow (CBF) was obtained from pseudo-continuous arterial spin labeling (pCASL). Effective oxygen diffusivity (EOD) was calculated from CBF and OEF using model A (Hyder et al.). 3
MPRAGE: TI/TR/TE/α = 1000 ms/9 ms/4 ms/8°; 170 slices covering the whole head; FOV 240 × 252 × 170 mm3; voxel size 1.0 × 1.0 × 1.0 mm3, acquisition time 2:05 min.
The pCASL implementation followed the ISMRM perfusion study group recommendations 30 as previously described12,24 with PLD 1800 ms, label duration 1800 ms, 4 background suppression pulses, 2D EPI readout, TE = 11 ms, TR = 4500 ms, α = 90°, 20 slices, EPI factor 29, acquisition voxel size 3.28 × 3.5 × 6.0 mm3, gap 0.6 mm, 39 dynamics including a proton density weighted (PDw) M0 scan, and an acquisition time of 6:00 min.
T2 and T2* imaging was performed as previously described.20,29 T2*-mapping by multi-echo gradient echo (GRE) with 12 echoes, TE1 = ΔTE = 5 ms, TR = 2229 ms, α = 30°, voxel size 2 × 2 × 3 mm3, gap 0.3 mm, 35 slices using correction of magnetic background gradients with a standard sinc-Gauss excitation pulse36,37 and additional acquisition of half and quarter resolution data to facilitate motion correction. 38 Total acquisition time: 6:08 min. T2-mapping by 3D multi-echo gradient-spin-echo (GraSE) 29 using 8 echoes, TE1 = ΔTE = 16 ms, TR = 251 ms, voxel size 2.0 × 2.0 × 3.3 mm3, 35 slices. Total acquisition time 2:28 min.
DSC MRI data were obtained during injection of a half-dose Gd-DOTA bolus (concentration: 0.5 mmoL/mL, 8 mL per subject, flow rate: 4 mL/s, injection after 5th dynamic scan) using single-shot GRE-EPI, EPI factor 49, TR = 2.0 s, TE = 30 ms, α = 60°, 80 dynamic scans, FOV 224 × 224 × 134 mm3, gap 0.35 mm, voxel size 2 × 2 × 3.5 mm3, gap 0.35 mm, 35 slices, acquisition time 2:49 min.
Image preprocessing and calculation of parameter maps
Data processing was performed with custom programs in MATLAB and SPM12 (Wellcome Trust Centre for Neuroimaging, UCL, London, UK). 39
CBF maps were calculated from pCASL data by averaging the pairwise differences of motion corrected label and control images. Quantitative values were subsequently obtained according to the ISMRM perfusion study group recommendations including normalization with a PDw-image. 30 To facilitate spatial normalization to MNI space, CBF maps were coregistered to the T1-weighted structural MPRAGE, where the transformation parameters were determined from mean time series images calculated after motion correction.
For OEF mapping, multi-echo GraSE and GRE imaging data was evaluated for T2 and T2*, respectively, as described previously.20,29 Quantitative maps of the reversible susceptibility-related relaxation rate R2′ were calculated according to
Before calculating EODmodel A based on MRI data, we spatially normalized CBF and OEF parameter maps to MNI standard space. Voxels with OEF > 0.99 were capped at 0.99 and excluded from further statistical analyses as described above. Values of R2′ ≥ 15 s−1 were deemed to be caused by susceptibility artifacts and affected voxels were therefore also excluded from analysis. 29 Furthermore, voxels with CBF > 100 mL/100g/min were likewise considered to be affected by artifacts and excluded from further evaluations. We also calculated CMRO2 from CBF and OEF according to equation (10). 12
In addition, we calculated mean parameter maps of CBF, OEF and EODmodel A through voxel-wise averaging across all respective subjects.
Statistical analysis
VOI average parameter values were compared regionally across 41 BAs as described above in the model comparison. The analysis was restricted to GM (p > 0.7) in order to minimize partial volume effects and known biases of MRI-based quantification of both CBF and OEF in white matter (WM) using ASL and mq-BOLD, respectively.30,44 Also, voxels with CSF (p ≥ 0.05) were excluded.
For a comparison of PET and MRI parameter values, we investigated the regional agreement between PET and MRI for CBF, OEF and EODmodel A across BAs. All parameters were averaged across all respective subjects and voxels within each BA. The Pearson correlation and mean difference of regional values were calculated for each parameter using the Bland-Altman and Correlation Plot toolbox v1.1 by Ran Klein (MATLAB Central File Exchange, https://www.mathworks.com/matlabcentral/mlc-downloads/downloads/submissions/45049/versions/2/download/zip, retrieved November 9, 2015). Furthermore, we calculated mean global parameter values of CBF, OEF, CMRO2, EODmodel A and EODmodel B in cortical GM and WM for PET and MRI (EODmodel B only for PET data) by averaging them over all subjects. Two-sample t-tests were applied to compare the mean parameter values between methods. Throughout all statistical analyses, p-values < 0.05 were considered statistically significant. Normal distribution of PET and MRI datasets was interrogated with the Kolmogorov-Smirnov test using OriginPro 2021.
Results
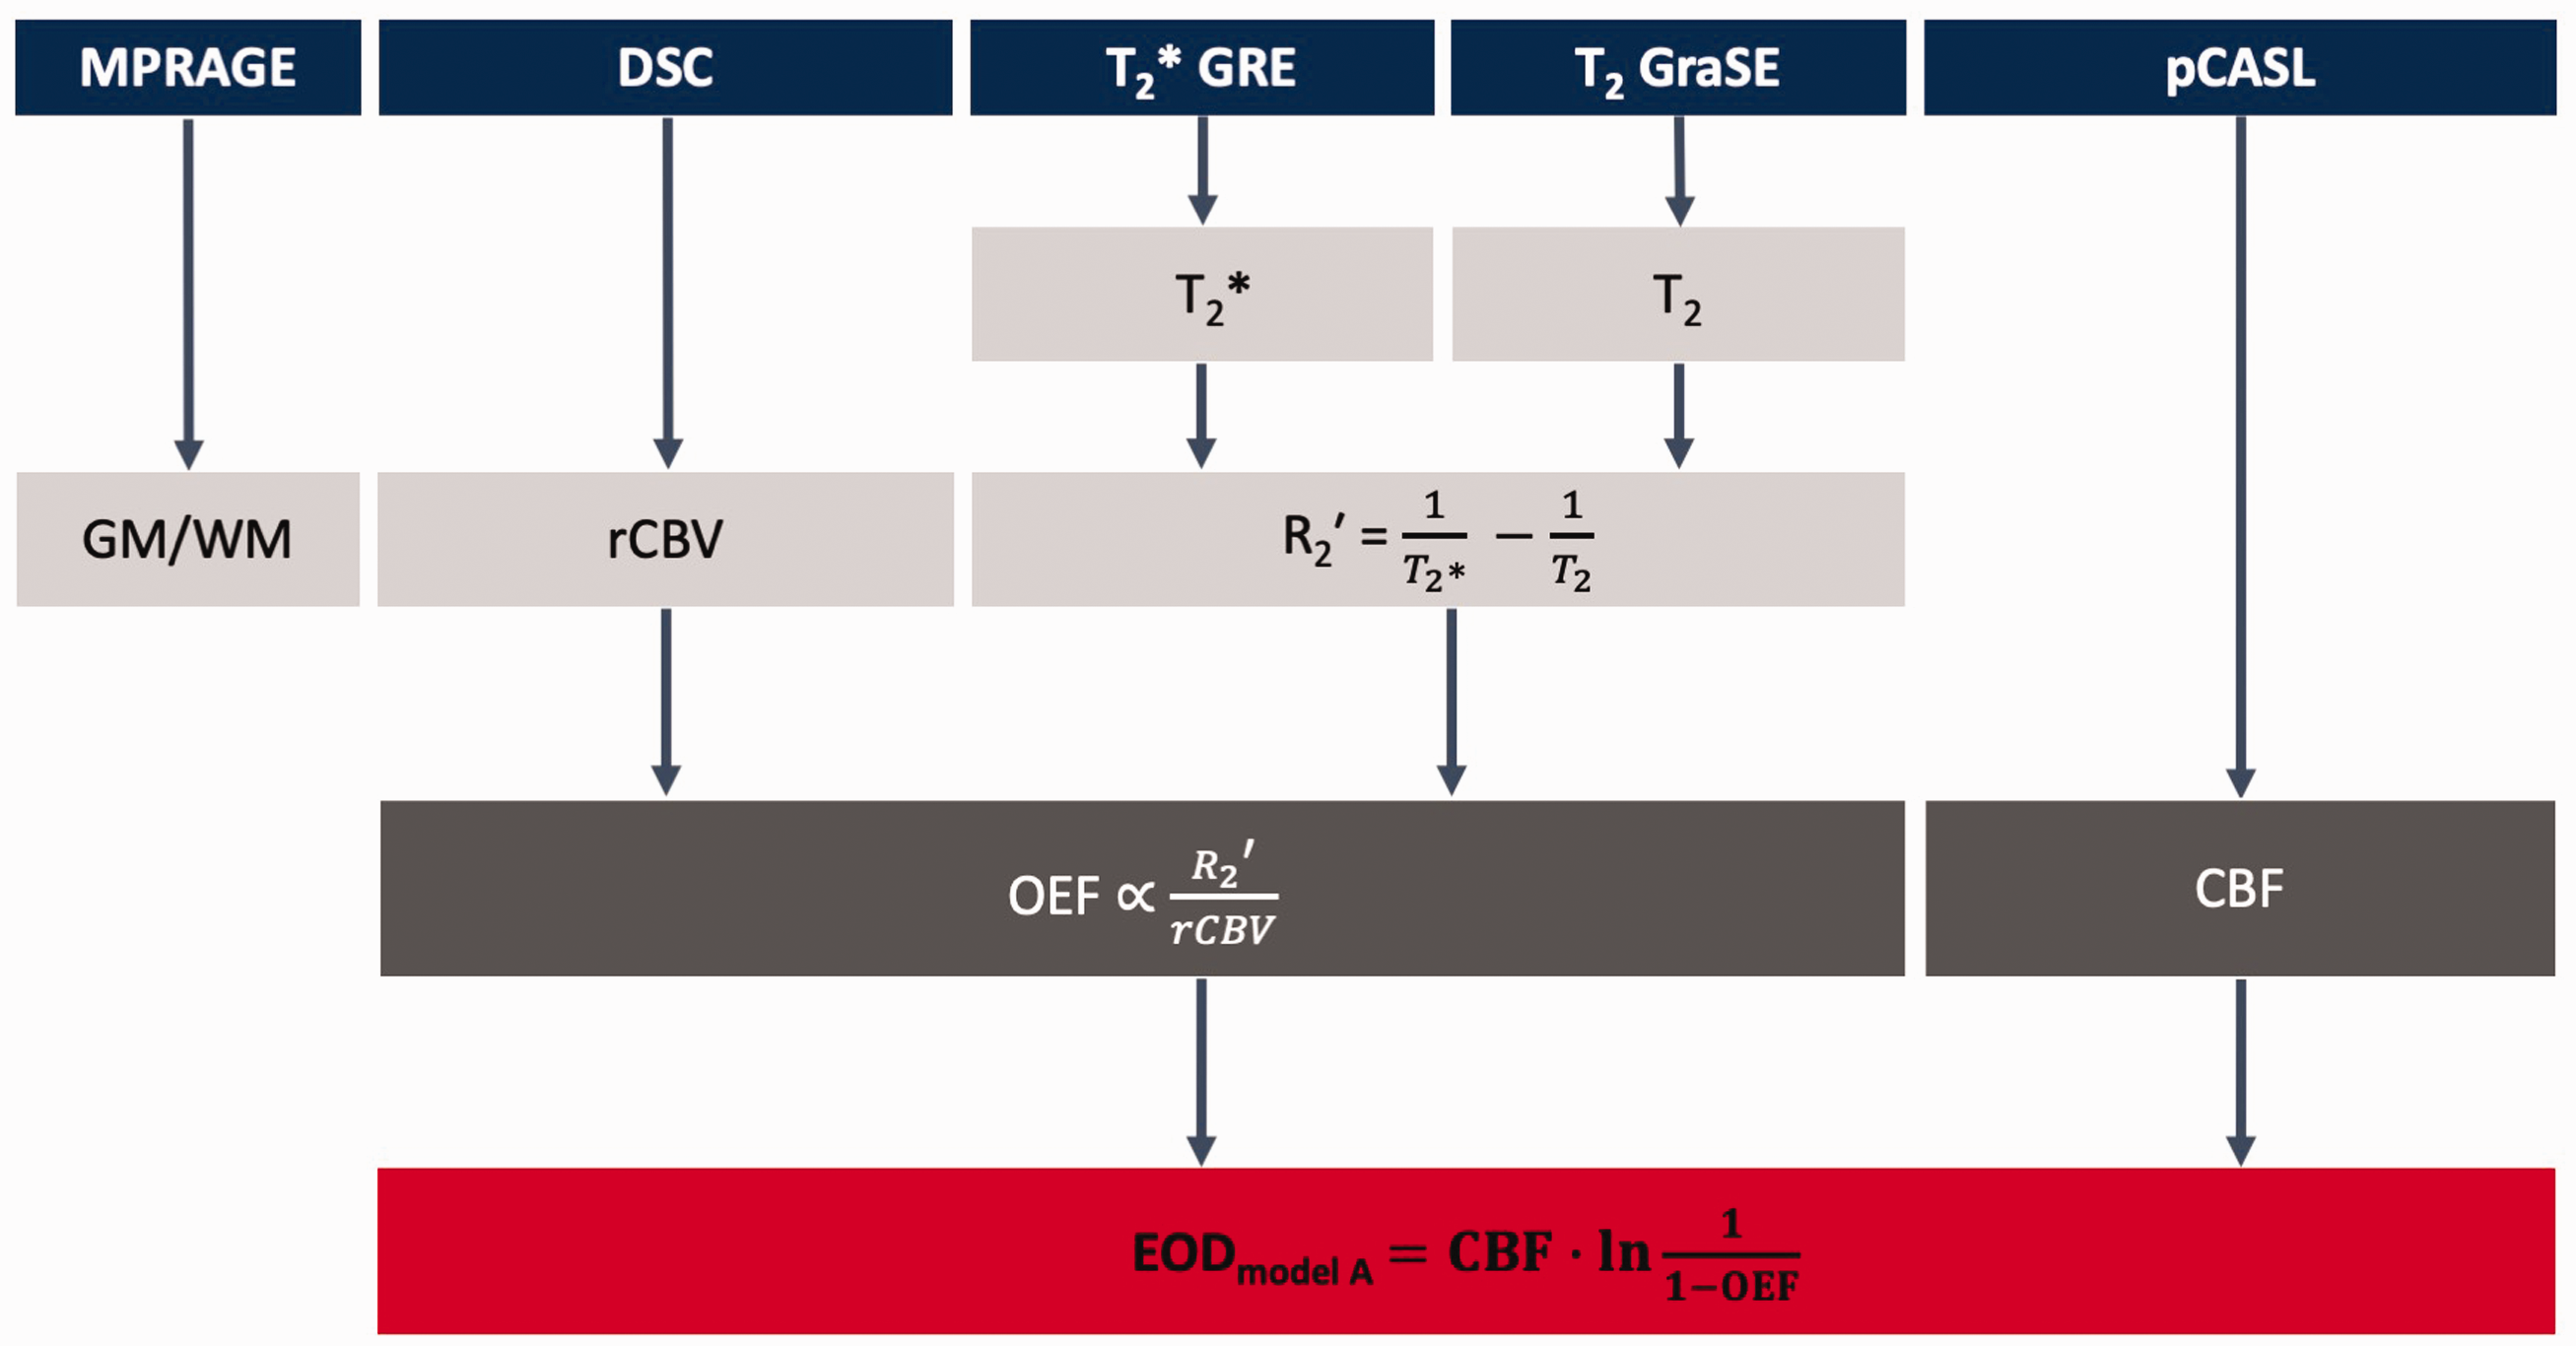
A comparison between both EOD models based on previously published PET data in healthy subjects 32 revealed excellent overall agreement across subjects and brain regions (Figure 2) with R2 = 0.9986 for the linear mixed-effects model and a statistically significant effect for EODmodel A (estimate: 0.0040, p < 0.001, Figure 2(a)). Correlation across brain areas in individual subjects and overall between-regions correlation also showed very good agreement in all instances with R2>0.98 (p < 0.001, Figure 2(b)). Similarly, agreement was very high across subjects in all 41 brain regions with R2 ranging from 0.89 to 0.97 (Figure 2(c), p < 0.001) and overall between-subject correlation of R2 = 0.91 (p < 0.001). This indicated minor regional variation in the relationship between both models. Given the high linear correlation between both models, parameter maps generated using either of the two appear virtually identical (see Supplemental Figure 1), although EOD is defined slightly differently with units of mL/100g/min and mL/100g/mmHg/min for models A and B, respectively. In addition, we found that Ca and global mean EODmodel A, as well as global mean EODmodel B in GM were not statistically significantly correlated (Figure 3, R2 = 0.128 and 0.005 with p = 0.23 and 0.81, respectively). This high accordance between both models led us to use the more easily applicable EOD model A for the following analyses of MRI-based EOD.
Comparison of EOD models. EODmodel A (Hyder et al.) 3 and EODmodel B (Hayashi et al.) 6 were compared using existing PET data from 13 subjects across 41 GM brain regions each. (a) Red crosses represent mean values of EOD in Brodmann areas of individual subjects, and the black line indicates the result of a linear mixed-effects model fit with a random slope and intercept for subject and Brodmann area, respectively. (b, c) Bar plots show R2 for Pearson correlation across brain areas in each subject (blue bars, b) and for an average of all 13 subjects (red bar, b), as well as for correlation across subjects in each brain area (blue bars, c) and for an average of all 41 brain regions (red bar, c).
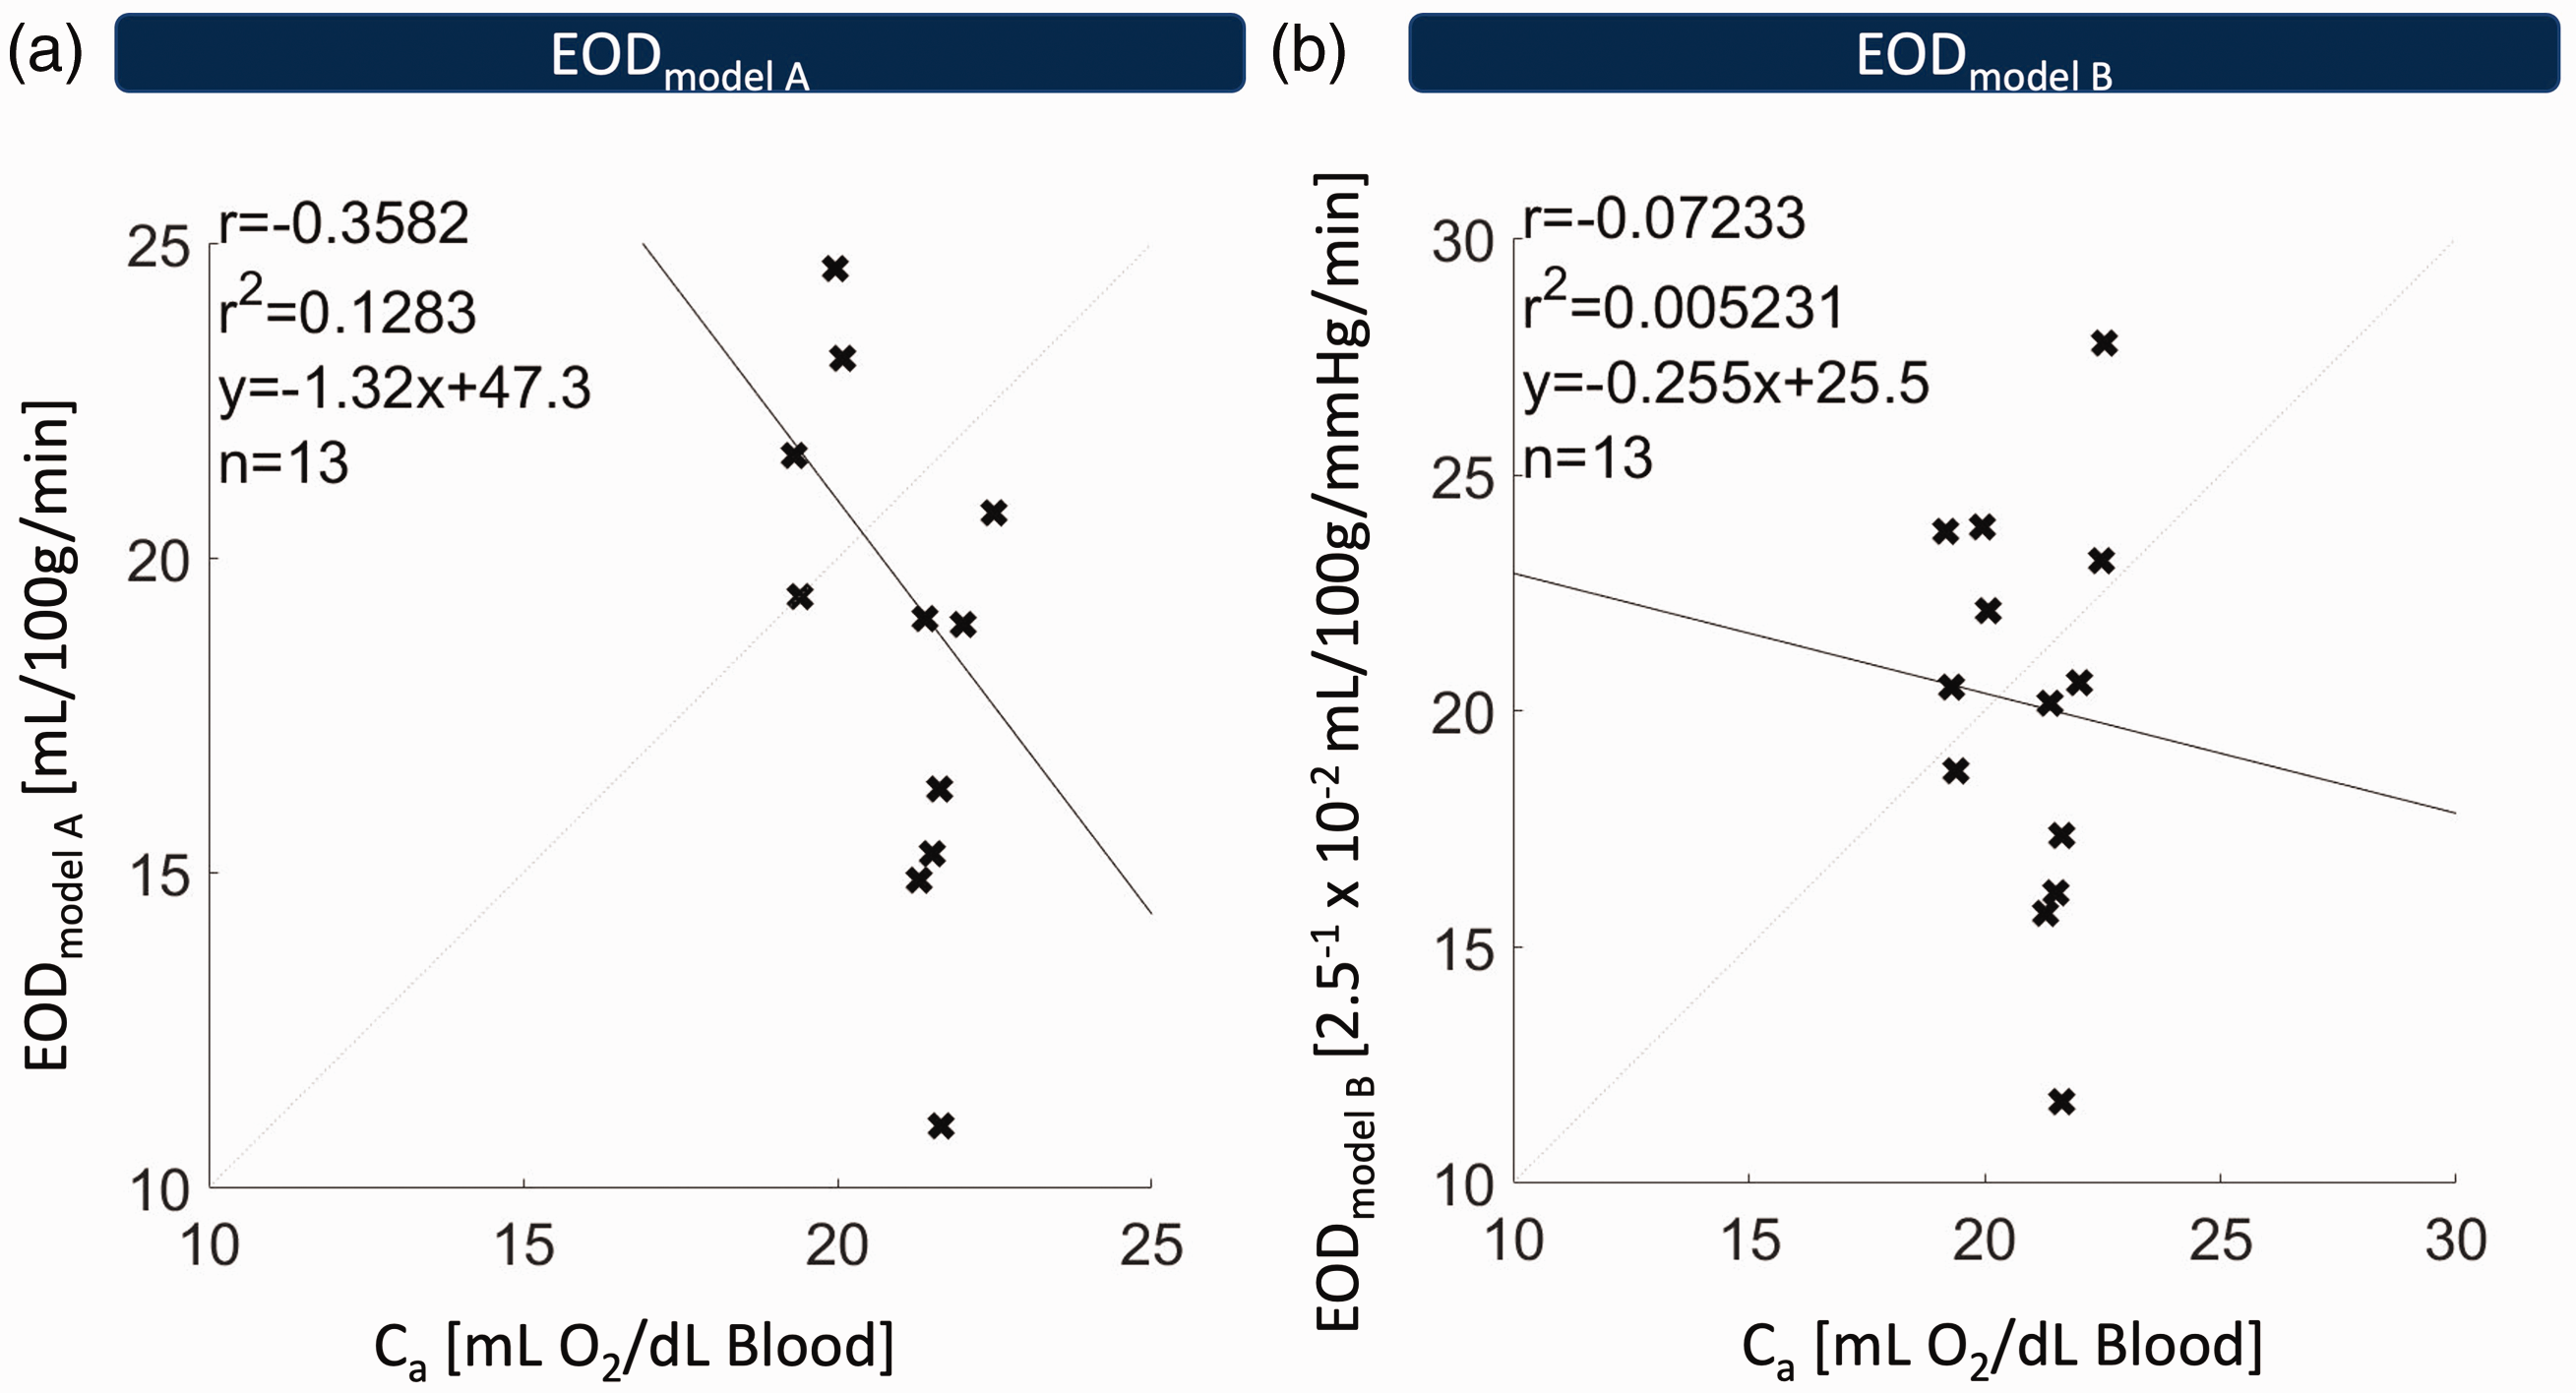
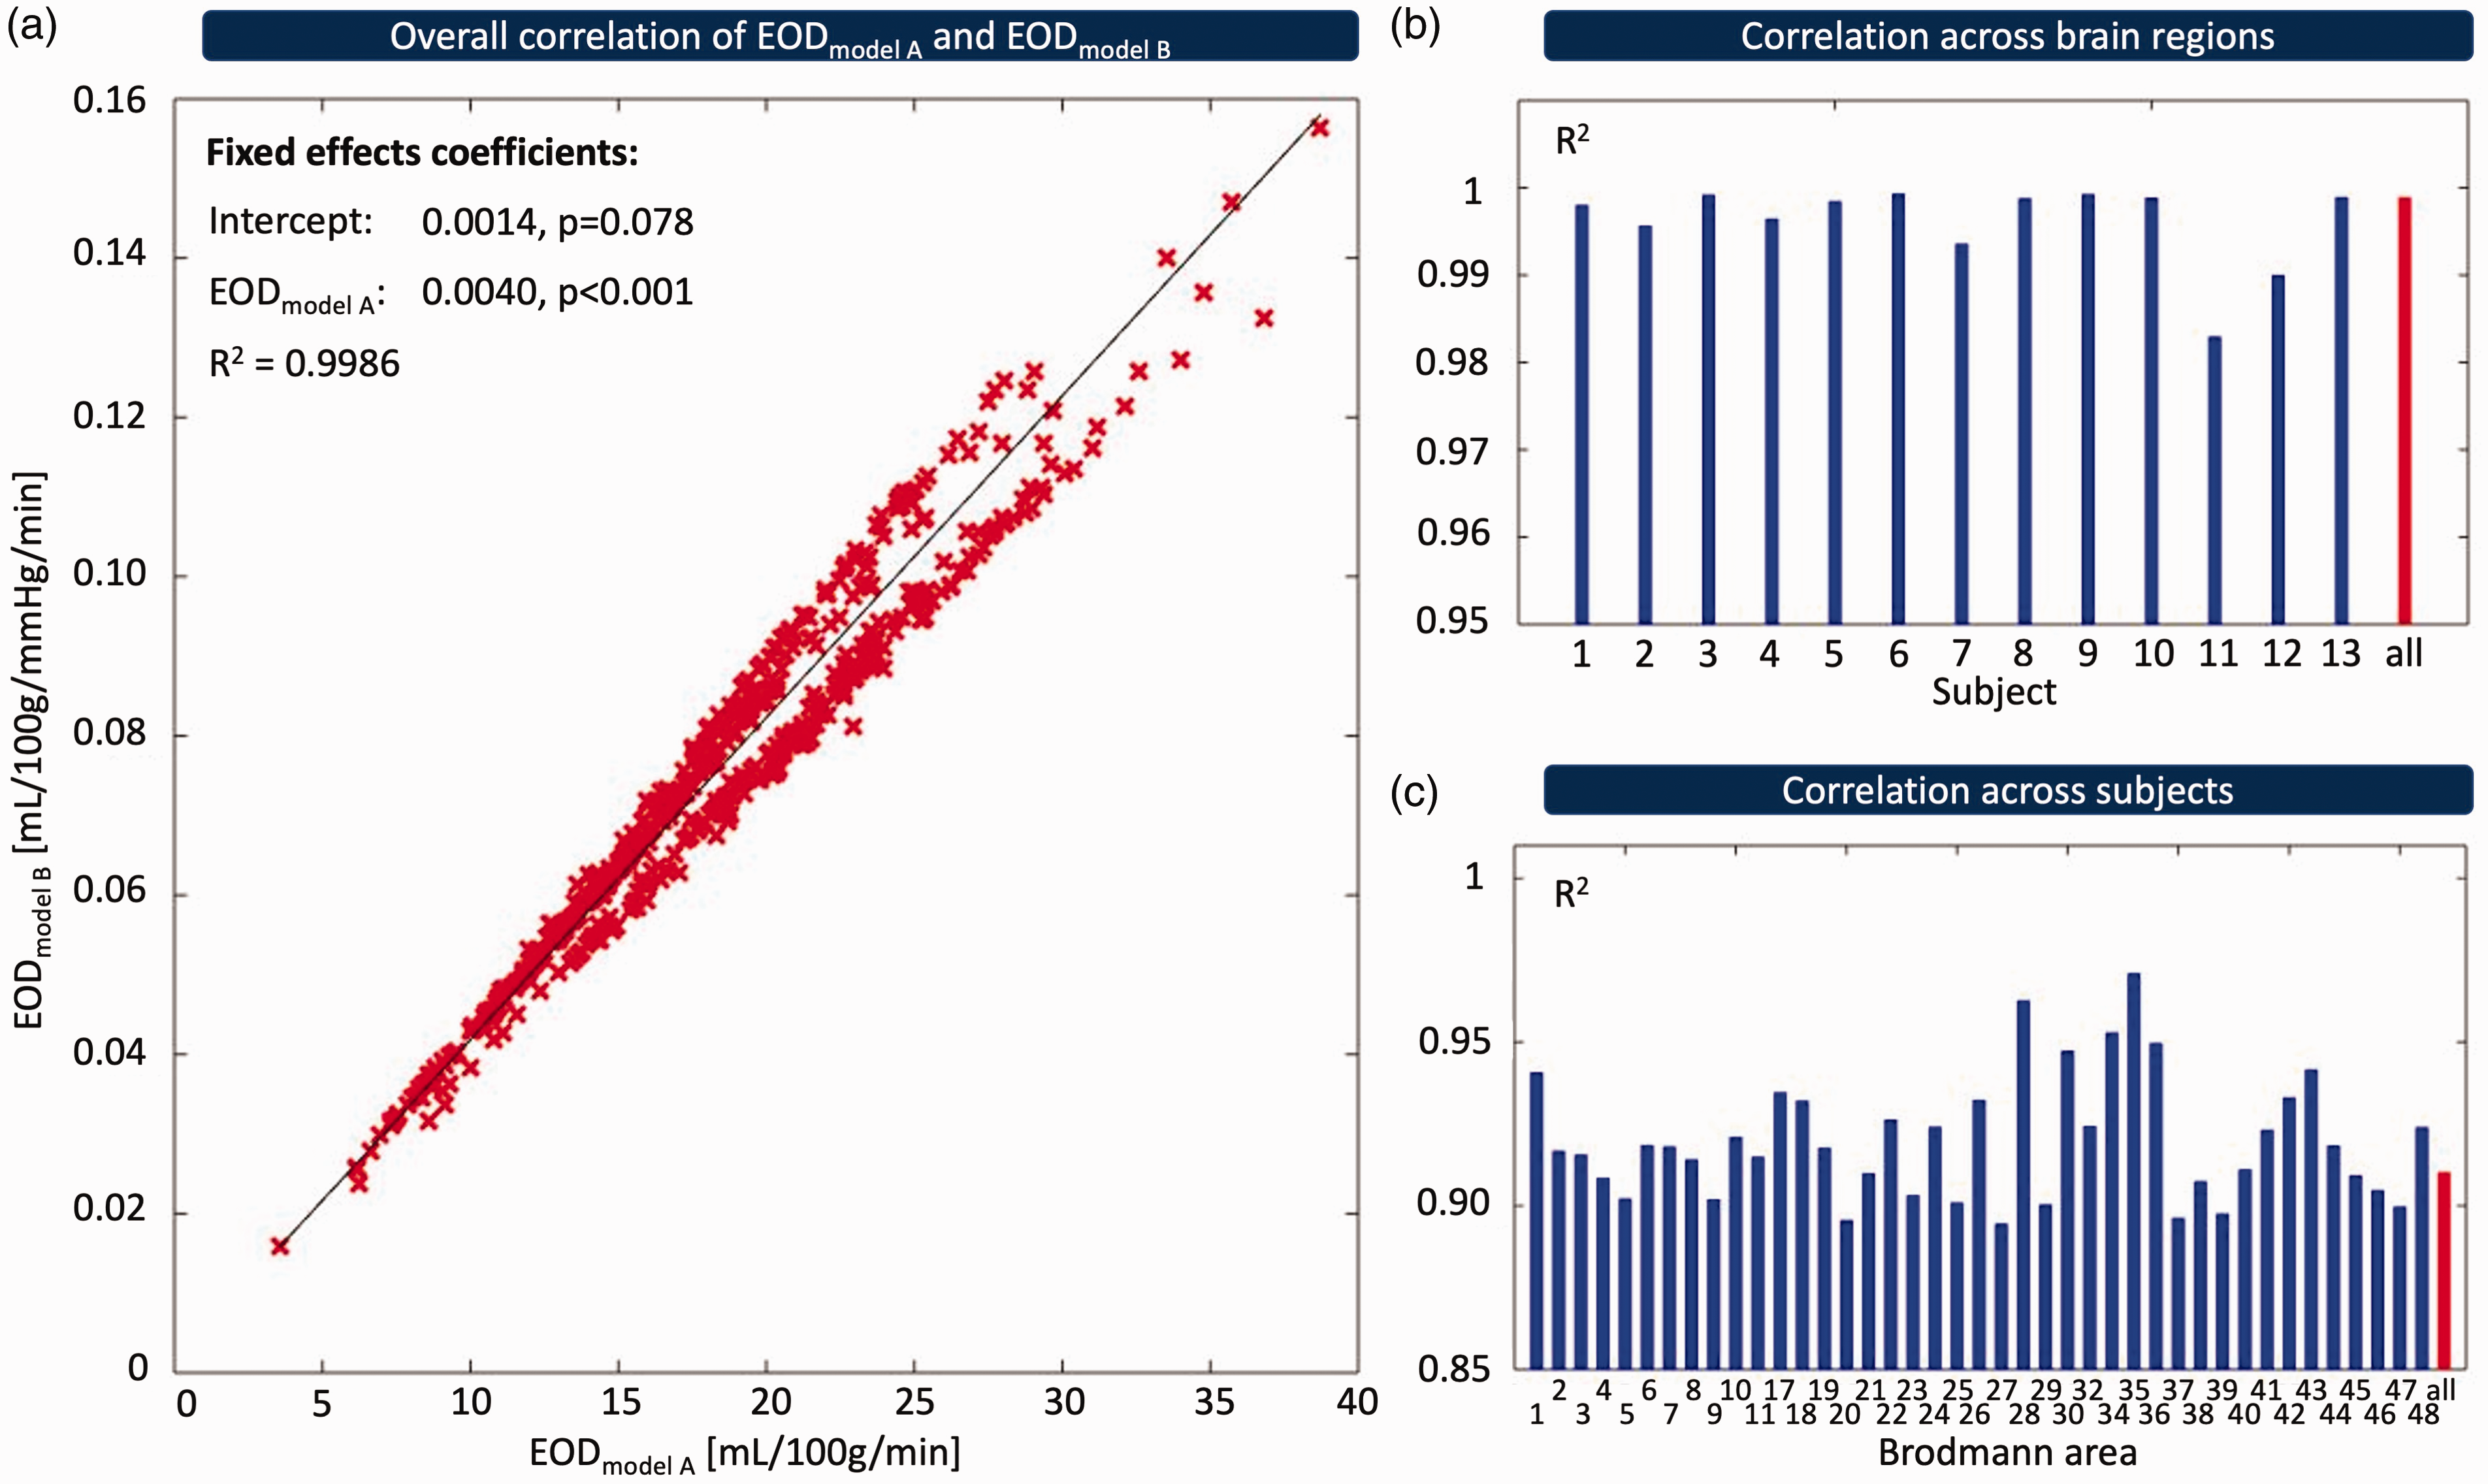
Correlation of Ca and globally averaged EODmodel A (a), as well as EODmodel B (b) across 13 subjects. Each cross corresponds to the global gray matter mean of EOD in one subject. No statistically significant correlation was found between arterial oxygen concentration (Ca) and either EODmodel A (R2 = 0.128, p = 0.23) or EODmodel B (R2 = 0.005, p = 0.81), indicating that EOD does not significantly depend on Ca in either model.
Exemplary CBF, OEF, EODmodel A parameter maps of a representative subject from the MRI group (acquired in this study) and the PET group (previously acquired) 32 , are shown in Figure 4. A visual comparison between both modalities demonstrates reasonable similarity between MRI- and PET-based CBF maps, although CBF values by MRI are somewhat lower in WM (Figure 4(a) and (d)). Likewise, gray matter OEF (Figure 4(b) and (e)) and EOD (Figure 4(c) and (f)) values and their spatial patterns are overall comparable between MRI and PET. Note higher WM values in MRI-based OEF and EOD maps in comparison to the PET-based parameter maps. The mean parameter maps across subjects for CBF, OEF and EODmodel A measured with MRI and PET, respectively, are also reasonably similar when comparing both modalities visually (Figure 5). Mean MRI-CBF values were slightly lower but overall comparable to PET-CBF with generally higher perfusion in GM than WM (Figure 5(a) and (d)). Notably, MRI underestimated CBF in the occipital cortex. Group-averaged MRI-OEF in GM was reasonably homogenous and quantitatively similar to PET-OEF (Figure 5(b) and (e) and Table 1).
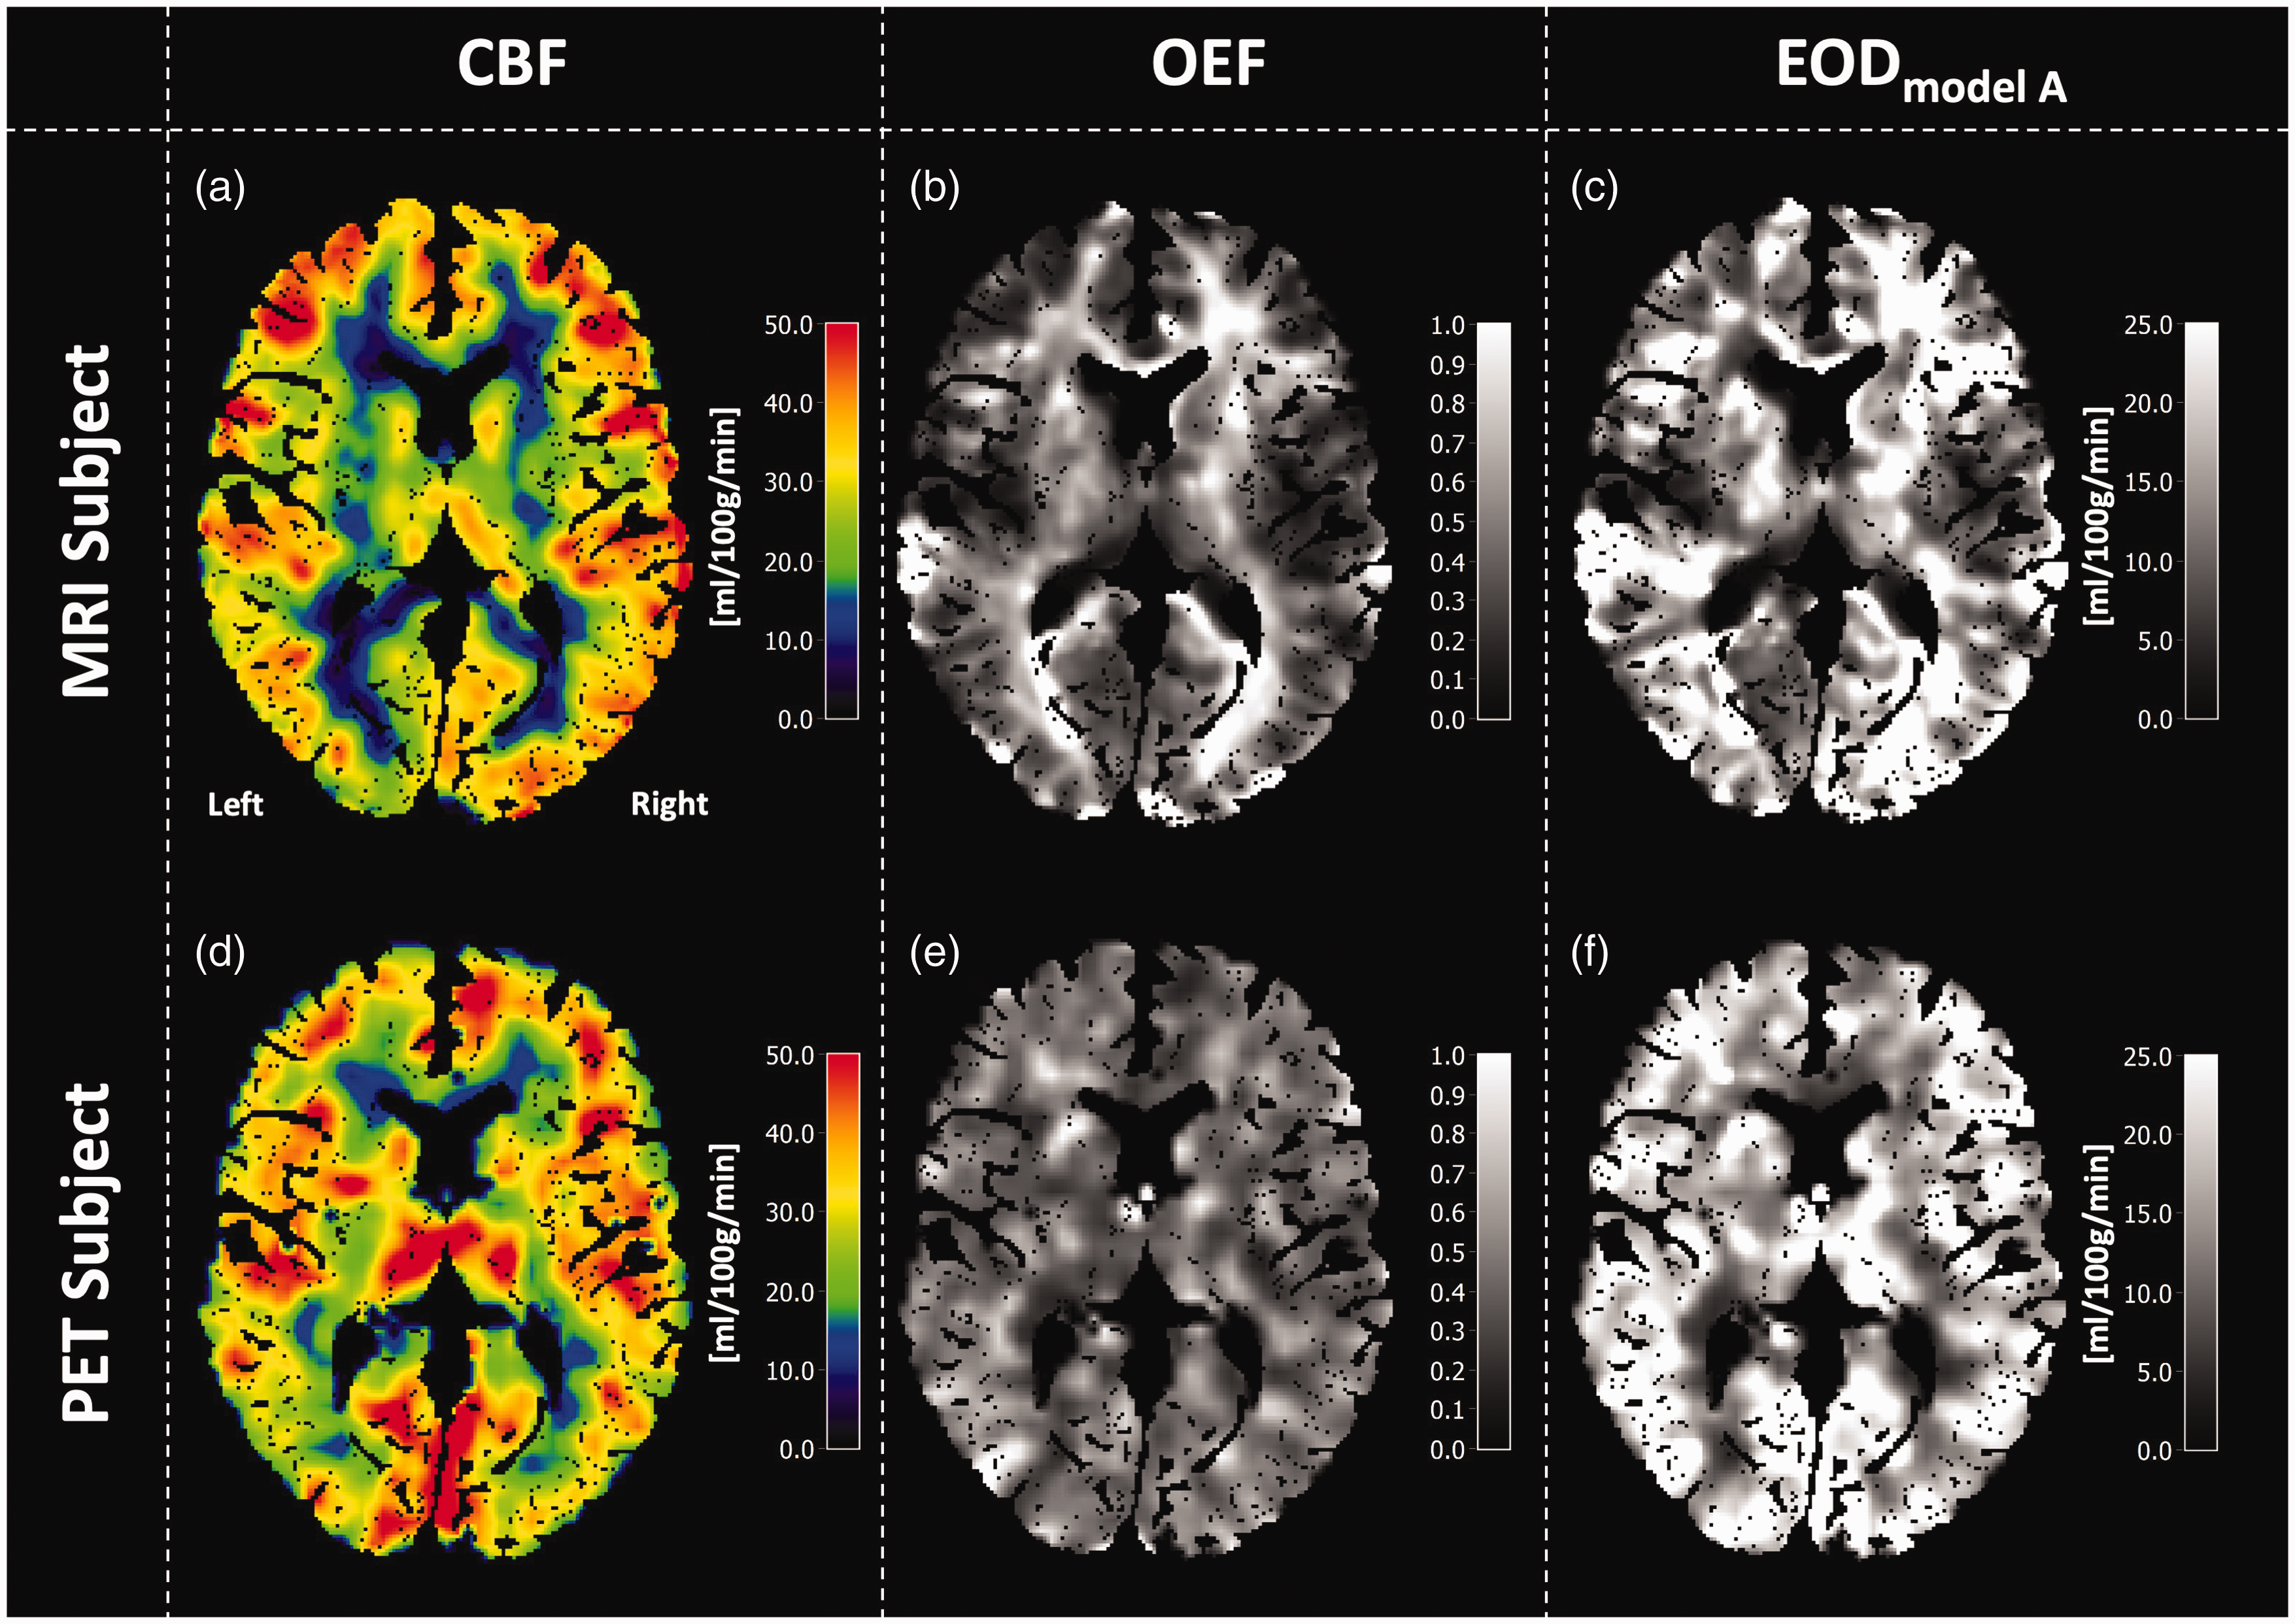
Exemplary data of a single MRI-subject (top row) and a single PET-subject (bottom row). Note that two different subjects are compared. CBF is shown in the left column and looks quite similar in both modalities, although MRI-CBF is somewhat lower in WM and the occipital cortex (a, d). Comparisons of OEF in the central column reveal higher MRI-OEF in WM compared with GM (b), while PET-OEF appears more homogeneous across the brain (e). EOD is shown in the right column and looks reasonably similar for PET and MRI data (c, f).
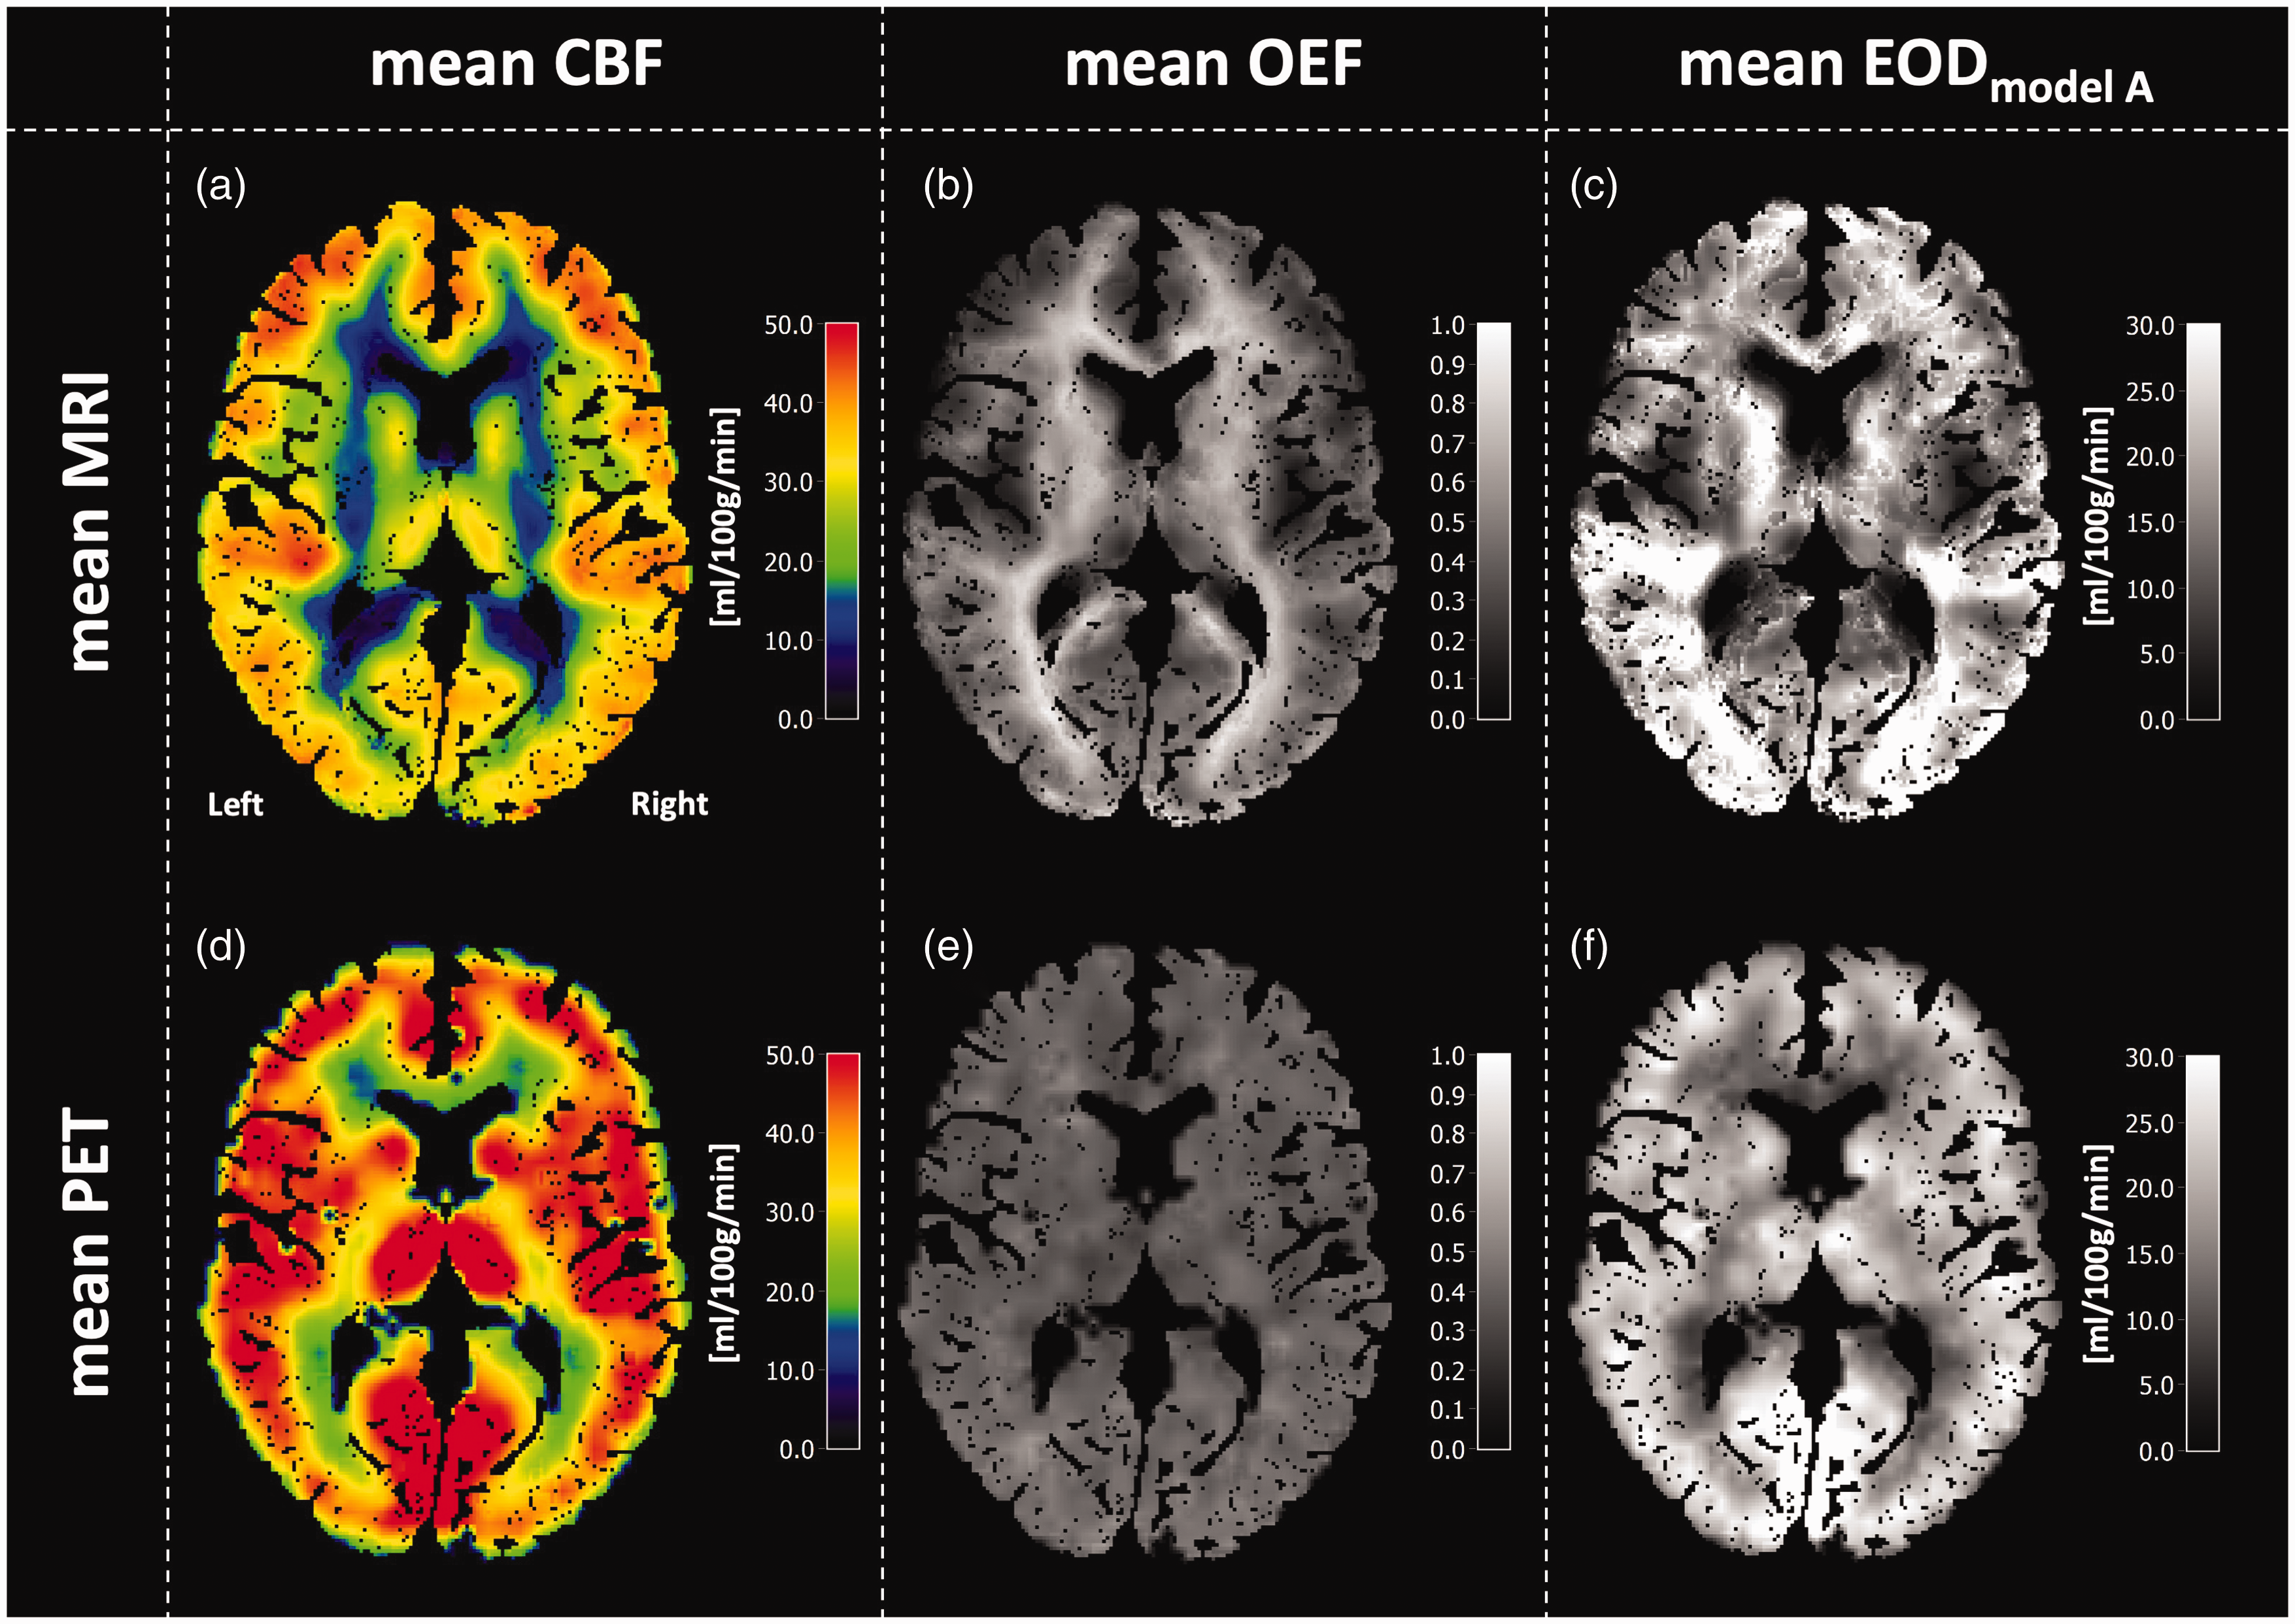
Mean parameter maps of CBF, OEF and EODmodel A averaged across MRI (top row) and PET subjects (bottom row). Spatial patterns in CBF maps look very similar, with higher perfusion in gray matter compared to white matter, as physiologically expected (a, d). However, MRI-CBF values were overall slightly lower than PET-CBF values. MRI-OEF exhibits higher values in white matter (b), while PET-OEF is rather homogenous across the brain (e). Mean EODmodel A maps look reasonably similar between MRI and PET in gray matter (c, f).
Ca and mean parameter values of CBF, OEF, EODmodel A, EODmodel B and CMRO2 in gray and white matter.
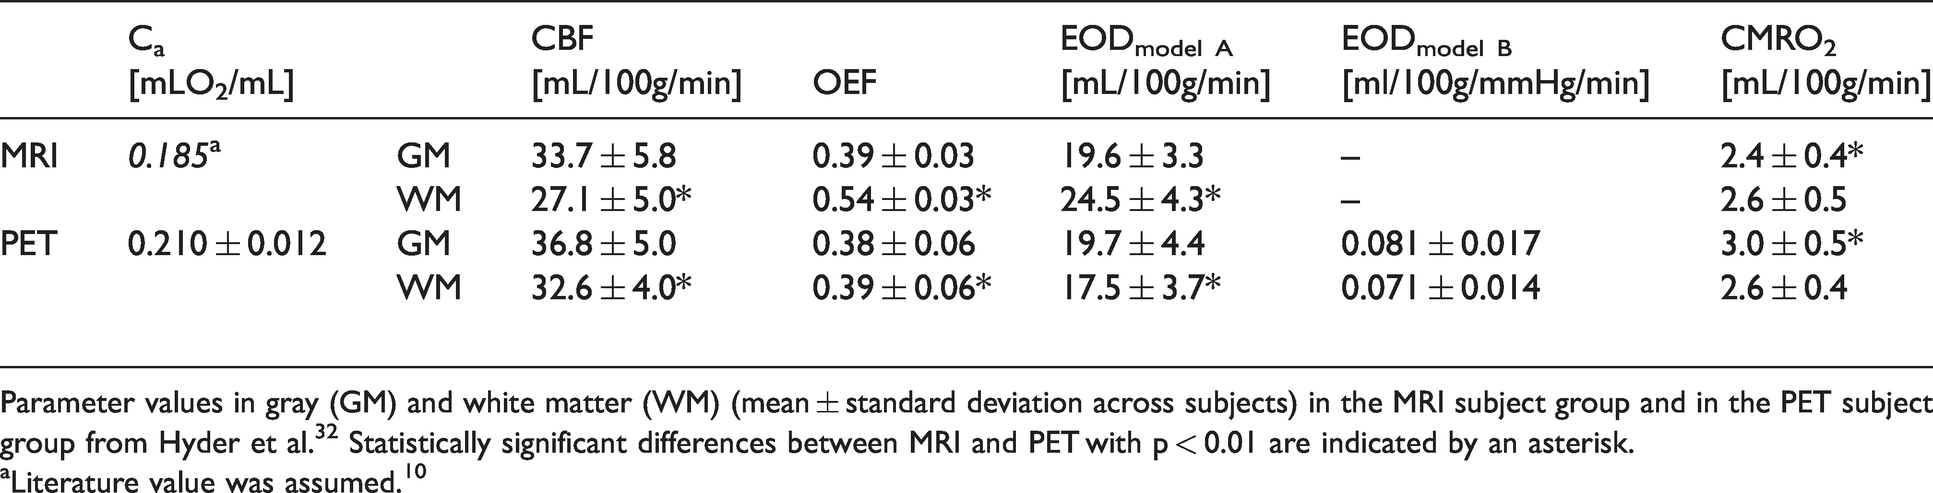
Parameter values in gray (GM) and white matter (WM) (mean ± standard deviation across subjects) in the MRI subject group and in the PET subject group from Hyder et al. 32 Statistically significant differences between MRI and PET with p < 0.01 are indicated by an asterisk.
aLiterature value was assumed. 10
Regarding oxygen diffusivity, MRI-based EODmodel A values were quantitatively comparable to PET-based EODmodel A in GM (Figure 5(c) and (f) and Table 1). EODmodel A overestimation in WM was largely overlapping with artificially high values in OEF maps. These visual trends were reflected quantitatively in global average values of EOD, OEF and CBF in GM as well as WM (Table 1). In GM, no statistically significant difference between MRI and PET was found for either of the parameters (p > 0.05). In contrast, MRI-CBF was lower and MRI-OEF and -EOD higher than the respective PET averages in WM (p < 0.01, Table 1). PET-CMRO2 was higher than MRI-CMRO2 in GM (p < 0.01) but not in WM (p = 0.76, Table 1).
Regional correlation of group-average estimates of CBF and OEF in GM from PET and MRI was R2 = 0.14 for CBF and R2 = 0.23 for OEF, respectively. The correlation between PET- and MRI-based EODmodel A was higher with R2 = 0.29 (Figure 6). The correlations of all parameters between PET and MRI were statistically significant for CBF (p < 0.05, Figure 6(a)), OEF (p < 0.01, Figure 6(b)) and EOD (p < 0.001, Figure 6(c)). In absolute values, the highest agreement between MRI and PET was found for MRI-OEF and MRI-EODmodel A with zero mean differences (Figure 6(f), p = 0.18 and p = 0.59, respectively). Also, a small mean difference for CBF of 2.3 mL/100g/min (p < 0.05), indicated good accordance.
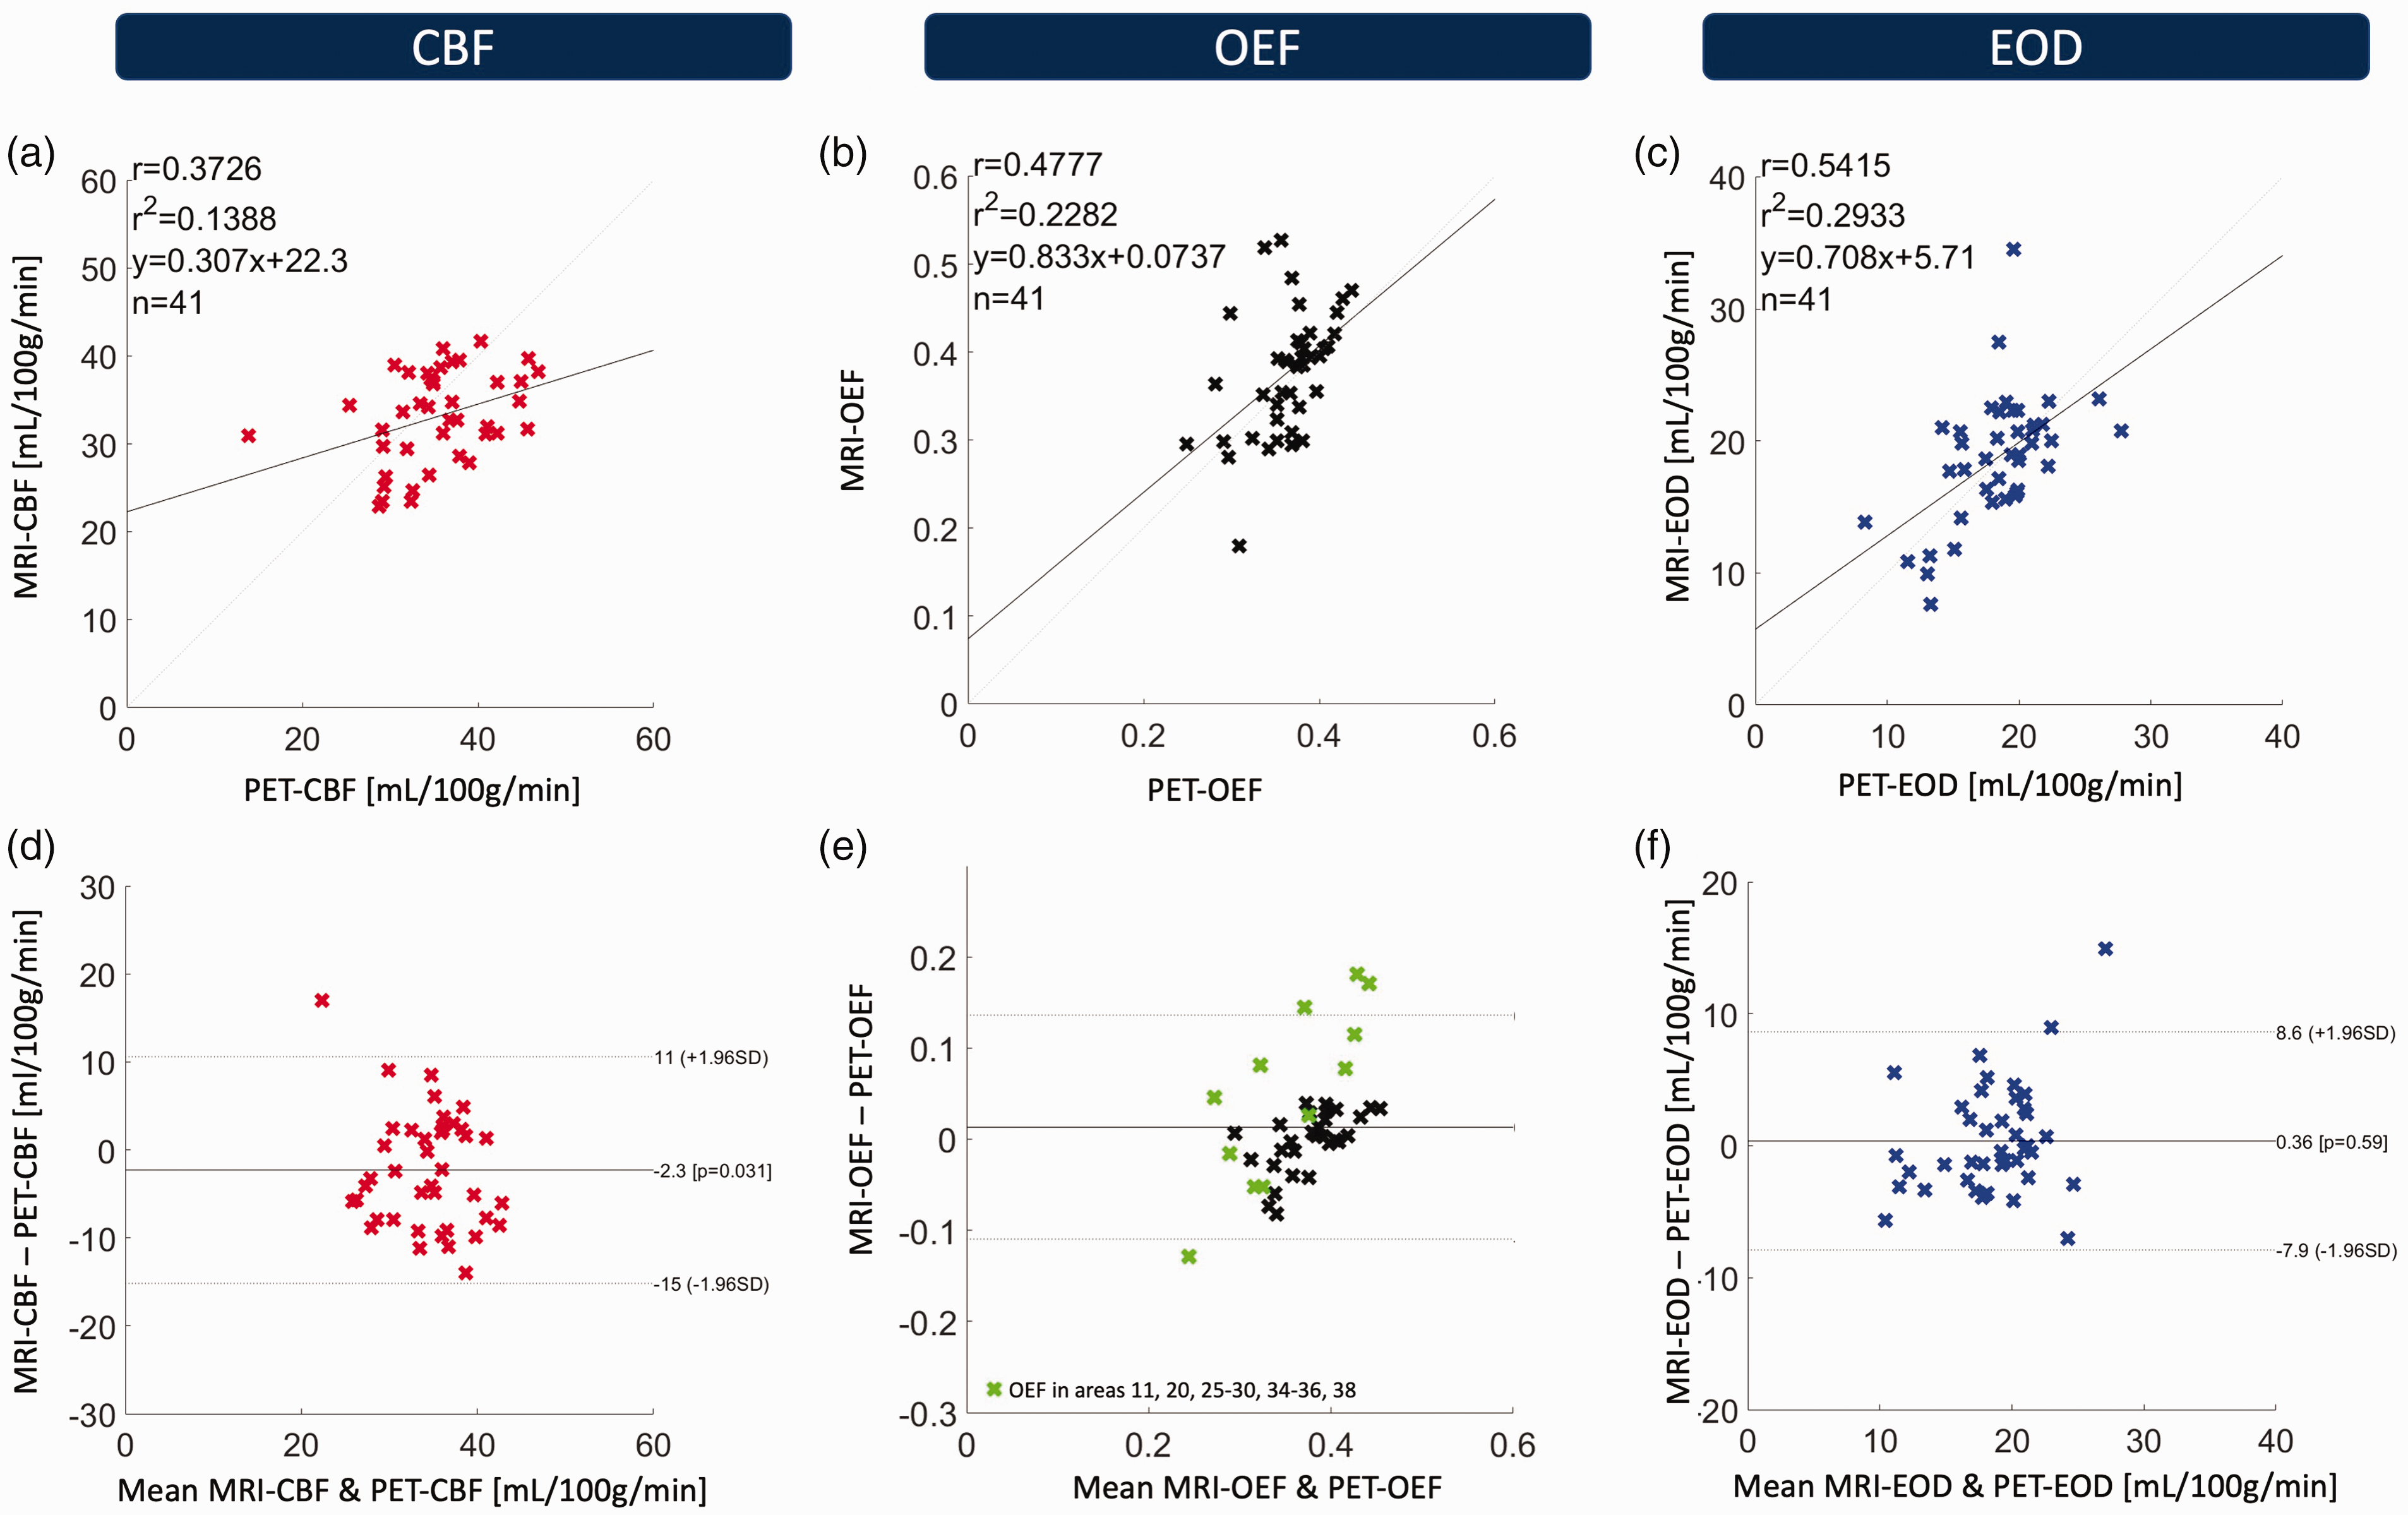
Correlation and Bland-Altman plots of regional group-average MRI- and PET values of CBF (a, d), OEF (b, e) and EOD (c, f) across 41 Brodmann areas (BA). Top row: Regional correlation of MRI and PET parameter values. Crosses represent mean values in particular BAs. Comparably good correlation for all three parameters was found with R2 = 0.14 (p < 0.05) for CBF, R2 = 0.23 (p < 0.01) for OEF and R2 = 0.29 (p < 0.001) for EODmodel A. Bottom row: Bland-Altman plots of MRI and PET. MRI-CBF was slightly lower than the respective PET value (p < 0.05). OEF and EOD by MRI and PET were not significantly different (p = 0.18 and p = 0.59, respectively). Datapoints from brain regions prone to susceptibility artifacts in mq-BOLD are marked in green in the Bland-Altman plot for MRI-OEF (e).
Discussion
We demonstrated the feasibility of EOD assessment by an easy-to-implement MRI protocol using mq-BOLD and pCASL. MRI-based parameter values of EOD, OEF and CBF were compared to data from a published PET study in a similar cohort. 32 Regional averages of GM parameter values were compared across the brain in Brodmann areas to investigate the correlation between MRI and PET. Correlation analysis between our MRI-based measures and PET values for all three physiological parameters indicated good agreement.
Selection of an EOD model for MRI-based EOD estimates
To select an appropriate model for MRI-based EOD assessments, we first compared EOD parameter maps obtained from two different oxygen transport models3,6,8 using existing PET data. 32 The main finding of this comparison between the theories proposed by Hyder et al. 3 and Hayashi et al. 6 was that the calculated EOD parameter maps were very similar for both oxygen transport models. We observed excellent agreement between the two models (Figure 2(a)) over the range of CBF, OEF and Ca input values occurring across brain regions despite regional and inter-subject variabilities in cerebral hemodynamics (Figure 2(b) and (c)). Only minor regional variation was revealed by detailed analysis of correlations between the two EOD models in individual Brodmann areas across PET subjects (Figure 2(c)). The lowest, but nevertheless highly significant correlation found in a single BA was R2 = 0.89, which confirms the high similarity of the two EOD models in the investigated subject group. Assuming that Ca does not vary spatially across the brain, any such observed regional variation in the agreement between both EOD models would reflect effects of the spatial variation of CBF and/or OEF. Furthermore, while EODmodel A is calculated from two input parameters, CBF and OEF, the more complex EODmodel B requires additional measurements of P50 and blood hemoglobin concentration [Hb] to infer Ca. Hayashi et al. 6 theoretically predicted non-linear effects from Ca variations (across or within subjects) regarding the approximation of EODmodel B by two other models. While Ca is not explicitly considered in EOD model A here,3 the intracapillary oxygen gradient in model A, by definition, considers an arteriovenous difference. At that, we did not find non-linear effects that might arise from the variation in Ca and could substantially affect the agreement of the two models compared here over our range of Ca. In addition, between-subject correlation was high (R2 = 0.91, Figure 2(c)), corresponding to only small systematic contributions from inter-subject variation of Ca. Furthermore, global EOD from either of the two models was not correlated with Ca (Figure 3). This is in line with a study in elderly patients with steno-occlusive disease 13 that did not find significant correlation between EOD and Ca. Furthermore, negligible variations of P50 were previously found in a young healthy population based on end-tidal CO2 measurements, 8 suggesting that the assumed constant P50 of 26 mmHg6,10 is justified in our young healthy subject cohort. This indicates minimal influence of Ca and P50 on EOD and suggests that the more straightforward EODmodel A, can be used without additional measurements or assumption of specific literature values for Ca and P50. In summary, we conclude that the choice of the oxygen transport model does not have a strong effect on EOD mapping and therefore only employed EODmodel A for MRI-EOD. Furthermore, model A has also been validated in previous animal in vivo studies. 4
Validity of MRI-EOD confirmed by good agreement with PET reference
We obtained EOD of the capillary bed from MRI-based OEF and CBF maps. By analyzing the correlation between MRI-EODmodel A and PET-EODmodel A across different GM regions, we demonstrated a good correlation with R2 = 0.29 (p < 0.001, Figure 6(c)). While MRI- and PET-based EOD were not previously compared, the correlation of MRI- and PET-EOD falls within the range of typical values found for CBF, particularly when considering that MRI and PET were acquired in different cohorts (see limitations section). Bland-Altmann plots for EOD revealed good agreement of absolute values between MRI-EODmodel A and PET-EODmodel A (p = 0.59, Figure 6(f)). Beside potential subject-specific variability and known differences between H215O-PET and ASL-based CBF measurements, the difference also depends on the accuracy of the MRI-based OEF measurement. Results in GM were in high agreement with PET-OEF, particularly because we used a 3D multi-echo GraSE sequence for T2 mapping, minimizing T2-related bias in measured MRI-OEF. 29 Some difference between PET- and MRI-EOD may be due to remaining susceptibility related effects, which in particular might explain the two outlier regions (BAs 11 and 26) in Figure 6(f). In this work, we carefully excluded areas affected by unphysiological MRI-OEF elevations. Successful elimination of related effects on EOD is demonstrated in Figure 6(f), which shows that any remaining regional differences between MRI- and PET-EOD are distributed evenly. Crucially, MRI-EOD was shown to be in good agreement with the PET reference data. Thus, we conclude that MRI-based acquisition of EOD parameter maps could be suitable for clinical applications, e.g., in the assessment of neurovascular diseases such as carotid artery stenosis, where it could help to understand physiological mechanisms behind regional flow-metabolism uncoupling. 12
Good agreement of CBF by ASL versus PET
We found reasonably good correlation between ASL- and PET-based CBF measurements (R2 = 0.14, p < 0.05), which agrees very well with reported literature values (Figure 6(a)).45,46 Importantly, we showed that agreement of both modalities does not depend on absolute perfusion values in any specific brain region (Figure 6(d)). There was only a small mean regional difference between ASL- and PET-based CBF of 2.3 mL/100g/min (p < 0.05), and global GM averages of CBF did not significantly differ between both modalities (Table 1). This agrees with several studies that have been conducted to compare 15O water PET and ASL31,45,46 with the aim to establish the validity of ASL for CBF quantification. While R2 was previously found to range from 0.6 to 0.8 for simultaneous PET and ASL scans, comparisons of the same subjects scanned at different days gave a Pearson correlation of R2 ≅ 0.1 to 0.2. 45 Thus, our result of R2 = 0.14 for scanning two different cohorts seems reasonable. Furthermore, the specific ASL implementation may be another influencing factor. 45
Gray matter OEF quantification by mq-BOLD
We also presented a systematic regional comparison of mq-BOLD- and PET-based OEF in human subjects of similar age, which yielded a reasonably strong Pearson correlation in GM (R2 = 0.23, p < 0.01; Figure 6(b)). To our knowledge, this is the first comparison of mq-BOLD to PET-OEF reference scans and thus supplements previous findings of good agreement comparing the mq-BOLD approach to sagittal sinus oxygenation data obtained in rats. 35 The Bland-Altman plot demonstrates that MRI-OEF in GM did not globally differ from PET (p = 0.18, Figure 6(e)). Our results thus support that previously known OEF overestimations by mq-BOLD20,44 were successfully addressed by using a 3D-GraSE T2 mapping sequence. 29 In addition, the Bland-Altman plot demonstrates that OEF overestimation depended on the mean of MRI- and PET-OEF values, such that parameter value overestimations were specifically pronounced in areas with a higher mean OEF (Figure 6(e)). This effect is likely driven by residual artifacts of iron deposition and macroscopic magnetic background fields 47 affecting the MRI-OEF estimations (see also Supplemental Figure 2). Likely, this is true especially for the outlier brain regions with mean differences between PET and MRI greater ± 1.96 SD in Figure 6(e) (BAs 25, 26, 28 and 29), which are all located close to the skull base.
Limitations
Although our study found strong agreement between the two different EOD models, it is not completely clear yet whether this consistency is preserved in certain patient groups or under special circumstances, e.g., hypercapnia. Under these conditions, unphysiological P50, Ca, CBF and/or OEF might affect the validity of either model, and it might even be beneficial to consider EOD from both models at once. Specifically, in young healthy subjects the independence of EOD and Ca in model B might be driven by a physiological, negative correlation of Ca with both CBF and OEF.
13
However, if constant P50 is assumed despite any underlying, unknown variation in P50, only the
Furthermore, we compared parameter maps obtained by MRI and PET from very similar but distinct subject groups. We rationalized that, by averaging over data from 12 (MRI) and 13 (PET) young healthy subjects, any underlying group differences in true regional parameter averages of EOD, OEF and CBF would be significantly lower than the regional variation of these parameters across the brain, allowing for a spatial comparison of both modalities. Indeed, we found statistically significant correlation between MRI and PET ranging from R2 = 0.14 (CBF) to R2 = 0.29 (EOD). Nevertheless, since inter-subject variability of OEF and CBF is known,15,48 our results can be expected to reflect, in part, remaining physiological differences between the two distinct subject groups. Our results compare favorably with a recent study in healthy participants, in which PET- and MRI-based CBF data of the same subjects was acquired some weeks apart, yielding a correlation of R2 = 0.12. 46 This underlines the considerable influence of variation in brain physiology on comparative studies, which can be expected to play a significant role also when comparing separate MRI and PET acquisitions of OEF 49 or EOD both non-simultaneously in the same subjects and in two distinct groups, as was the case here. Interestingly, we found MRI-EOD and -OEF to correlate somewhat better with PET compared to CBF. First, this might be related to a gender bias, since gender differences have previously been found for CBF, 50 but not for OEF15,51 and the MRI subject group comprised males and females alike, whereas the PET subject group was all-male. Second, we speculate that inter-subject differences in end-tidal, i.e., arterial CO2 concentration might have had a lesser impact on EOD than CBF or OEF alone. Positive and negative correlation of end-tidal CO2 with CBF 52 and OEF, 15 respectively, is known to contribute substantially to their inter-subject variability. 15 These effects might have partially compensated in the calculation of EOD and thus decreased their unfavorable impact on the comparison of PET- and MRI-EOD. In any case, future simultaneous PET/MRI studies could help to resolve remaining uncertainties.45,49
In general, the accuracy of EOD calculated from mq-BOLD and pCASL input data fed into an oxygen transport model ultimately depends on the combined accuracy of the measured parameters. Indeed, sufficient accuracy is supported by the good agreement between MRI-EOD and the independent PET reference data. While this indicated that systematic errors in any of the underlying measurements did not add up in an unfavorable way, this is not generally true for statistical errors. In order to estimate their effect on modeled EOD, we performed linear error propagation (see Supplemental Figure 3).
Moreover, mq-BOLD and consequently MRI-EOD is most reliable within cortical GM, since anisotropy effects may affect WM values. 44 Furthermore, iron deposition yielded unphysiologically high MRI-OEF in deep GM owing to R2' elevations.20,25 We therefore focused on cortical GM in this study. In addition, areas with strong susceptibility related magnetic field inhomogeneities (datapoints marked in green in Figure 6(e)) often yielded elevated R2' as well, since the method for magnetic background field correction we employed only works up to about 220 μT/m.36,37 With respect to the specific method implementation, different TR and TE ranges for T2 GraSE and T2* GRE sequences could potentially affect the accuracy of R2‘ values. However, a recent publication demonstrated that R2‘ obtained with these sequence parameters was physiologically plausible and reproducible. 29 A known systematic bias in mq-BOLD-derived OEF is the approximation of venous CBV by rCBV, which comprises arterial, capillary and venous blood volume,20,29 which is a departure from the original quantitative BOLD model by Yablonskiy and Haacke. 53 Furthermore, quantification of rCBV requires injection of a contrast agent, which is a limitation, although DSC-MRI is still widely used in clinical settings. Other limitations, arising from the derivation of mq-BOLD for the static dephasing regime only, or the neglection of intravascular contributions to the signal were discussed in a previous publication. 20 Finally, we assumed a constant small vessel hematocrit of 0.35, 20 which did not seem to affect quantitative accuracy of OEF on group level substantially in this study. Nevertheless, we would recommend obtaining individual measurements of Hct for mq-BOLD in future applications. Other MRI-based techniques for the quantification of OEF, including streamlined-qBOLD, 54 quantitative susceptibility mapping (QSM), 55 a recent combination of qBOLD and QSM dubbed QSM + qBOLD 56 or T2-Relaxation-Under-Spin-Tagging (TRUST), 57 are currently under development. While they could help overcome some of the limitations of mq-BOLD, noninvasive measurement of OEF remains challenging.
Despite promising results from earlier investigations of EOD changes in cerebrovascular disease in PET studies,6,13 more work is clearly needed to investigate the interplay between OEF and CBF for EOD in pathophysiologic states and pave the way for clinical interpretation of EOD maps.
Conclusion
In summary, our findings demonstrate the successful implementation of a clinically applicable MRI protocol for the quantification of EOD – based on CBF and OEF measurements. The validity of our approach is supported by good regional correlations of all three MRI-based parameters with existing PET reference data. Importantly, obtained EOD values in our young healthy subject group did not depend on the oxygen transport model selected (aside from different units). Thus, future applications of EOD in cerebrovascular pathologies are highly promising, especially in combination with evaluations of additional microvascular parameters, which might increase sensitivity compared to CBF, OEF and CMRO2 alone.
Supplemental Material
sj-jpg-1-jcb-10.1177_0271678X211048412 - Supplemental material for Imaging effective oxygen diffusivity in the human brain with multiparametric magnetic resonance imaging
Supplemental material, sj-jpg-1-jcb-10.1177_0271678X211048412 for Imaging effective oxygen diffusivity in the human brain with multiparametric magnetic resonance imaging by Jan Kufer, Christine Preibisch, Samira Epp, Jens Göttler, Lena Schmitzer, Claus Zimmer, Fahmeed Hyder and Stephan Kaczmarz in Journal of Cerebral Blood Flow & Metabolism
Supplemental Material
sj-jpg-2-jcb-10.1177_0271678X211048412 - Supplemental material for Imaging effective oxygen diffusivity in the human brain with multiparametric magnetic resonance imaging
Supplemental material, sj-jpg-2-jcb-10.1177_0271678X211048412 for Imaging effective oxygen diffusivity in the human brain with multiparametric magnetic resonance imaging by Jan Kufer, Christine Preibisch, Samira Epp, Jens Göttler, Lena Schmitzer, Claus Zimmer, Fahmeed Hyder and Stephan Kaczmarz in Journal of Cerebral Blood Flow & Metabolism
Supplemental Material
sj-jpg-3-jcb-10.1177_0271678X211048412 - Supplemental material for Imaging effective oxygen diffusivity in the human brain with multiparametric magnetic resonance imaging
Supplemental material, sj-jpg-3-jcb-10.1177_0271678X211048412 for Imaging effective oxygen diffusivity in the human brain with multiparametric magnetic resonance imaging by Jan Kufer, Christine Preibisch, Samira Epp, Jens Göttler, Lena Schmitzer, Claus Zimmer, Fahmeed Hyder and Stephan Kaczmarz in Journal of Cerebral Blood Flow & Metabolism
Supplemental Material
sj-jpg-4-jcb-10.1177_0271678X211048412 - Supplemental material for Imaging effective oxygen diffusivity in the human brain with multiparametric magnetic resonance imaging
Supplemental material, sj-jpg-4-jcb-10.1177_0271678X211048412 for Imaging effective oxygen diffusivity in the human brain with multiparametric magnetic resonance imaging by Jan Kufer, Christine Preibisch, Samira Epp, Jens Göttler, Lena Schmitzer, Claus Zimmer, Fahmeed Hyder and Stephan Kaczmarz in Journal of Cerebral Blood Flow & Metabolism
Supplemental Material
sj-jpg-5-jcb-10.1177_0271678X211048412 - Supplemental material for Imaging effective oxygen diffusivity in the human brain with multiparametric magnetic resonance imaging
Supplemental material, sj-jpg-5-jcb-10.1177_0271678X211048412 for Imaging effective oxygen diffusivity in the human brain with multiparametric magnetic resonance imaging by Jan Kufer, Christine Preibisch, Samira Epp, Jens Göttler, Lena Schmitzer, Claus Zimmer, Fahmeed Hyder and Stephan Kaczmarz in Journal of Cerebral Blood Flow & Metabolism
Footnotes
Funding
The author(s) disclosed receipt of the following financial support for the research, authorship, and/or publication of this article: JK was supported by the Translational Medicine program of the Technical University of Munich (TUM) and the Else-Kröner-Fresenius-Stiftung (grant 2014_Promotionskolleg.20). This work was further supported by the Friedrich-Ebert-Stiftung (grant to SK), Dr.-Ing. Leonhard Lorenz-Stiftung (grant to SK: 979/20, 971/19 and JG: 915/15), and the German Research Foundation (DFG) – Project number PR 1039/6-1 (grant to CP). FH was supported by NIH grants (R01 MH-067528, R01 NS-100106, R01 EB-023366, R21 MH-110862). The position of SE and acquisition of MRI data were funded by the European Research Council (ERC) under the European Union's Horizon 2020 research and innovation program (grant agreement ID: 759659 to PI Valentin Riedl).
Acknowledgements
We thank Valentin Riedl (TUM) for his supervision of MR data acquisition. We also highly appreciate Kim van de Ven (Philips Healthcare, Best, Netherlands), Kilian Weiss (Philips Healthcare, Hamburg, Germany) and Andreas Hock (Philips Healthcare, Horgen, Switzerland) for their support with the ASL imaging.
Declaration of conflicting interests
The author(s) declared the following potential conflicts of interest with respect to the research, authorship, and/or publication of this article: Stephan Kaczmarz is an employee of Philips, Hamburg, Germany. The other author(s) declared no potential conflicts of interest with respect to the research, authorship, and/or publication of this article.
Authors’ contributions
JK: data analysis, interpretation of the results, article writing. CP: study supervision, interpretation of the results, article writing. SE: data acquisition, interpretation of the results, article editing. JG: interpretation of the results, article editing. LS: interpretation of the results, article editing. CZ: interpretation of the results, article editing. FH: study design, interpretation of the results, article writing. SK: study design, study supervision, data analysis, interpretation of the results, article writing.
Data availability statement
For reasons of ethics and privacy issues of the acquired data, the data is only available via a request to the authors. Institutional privacy restrictions then require a formal data sharing agreement.
Supplemental material
Supplemental material for this article is available online.
References
Supplementary Material
Please find the following supplemental material available below.
For Open Access articles published under a Creative Commons License, all supplemental material carries the same license as the article it is associated with.
For non-Open Access articles published, all supplemental material carries a non-exclusive license, and permission requests for re-use of supplemental material or any part of supplemental material shall be sent directly to the copyright owner as specified in the copyright notice associated with the article.