
Abstract
Macro-vascular artifacts are a common arterial spin labeling (ASL) finding in populations with prolonged arterial transit time (ATT) and result in vascular regions with spuriously increased cerebral blood flow (CBF) and tissue regions with spuriously decreased CBF. This study investigates whether there is an association between the spatial signal distribution of a single post-label delay ASL CBF image and ATT. In 186 elderly with hypertension (46% male, 77.4 ± 2.5 years), we evaluated associations between the spatial coefficient of variation (CoV) of a CBF image and ATT. The spatial CoV and ATT metrics were subsequently evaluated with respect to their associations with age and sex – two demographics known to influence perfusion. Bland–Altman plots showed that spatial CoV predicted ATT with a maximum relative error of 7.6%. Spatial CoV was associated with age (β = 0.163, p = 0.028) and sex (β = −0.204, p = 0.004). The spatial distribution of the ASL signal on a standard CBF image can be used to infer between-participant ATT differences. In the absence of ATT mapping, the spatial CoV may be useful for the clinical interpretation of ASL in patients with cerebrovascular pathology that leads to prolonged transit of the ASL signal to tissue.
Introduction
Arterial spin labeling (ASL) is a non-invasive perfusion technique for probing the brain in vivo with potential applications in the study of normal aging, neurodegenerative, and cerebrovascular pathology.1,2 ASL is conventionally used to produce a single quantitative image of cerebral blood flow (CBF), for which one major criterion is that the ASL post-label delay (PLD) is optimized to ensure that the labeled protons have reached the tissue at the time of imaging. 3 However, the time it takes the ASL tracer to travel from the labeling plane to an imaged voxel – the arterial transit time (ATT)4–9 – differs between participants and regions in the brain.9–11 Although there are guidelines in place for single-PLD ASL, 3 many studies show ASL image heterogeneity between participants that is attributed to ATT. Whereas this heterogeneity is conventionally considered as a nuisance – as prolonged ATT degrades the accuracy of regional CBF quantification for single-PLD ASL 10 – the current study investigates the possibility to extract meaningful information from this heterogeneity.
ATT is increasingly recognized as a hemodynamic parameter that provides additional diagnostic information that cannot be obtained from CBF images alone.5,8 In patients with cerebrovascular pathology, ATT provides important information on the cerebral hemodynamic status.4,6,7,12 Furthermore, ATT changes have been implicated in aging9,13 and in a wide range of diseases including Parkinson's disease, 14 multiple sclerosis, 15 and Alzheimer's Disease. 16 Several ASL acquisitions are available to estimate ATT11,17,18; however, most require extra scanning time or come at the expense of a lower signal-to-noise ratio (SNR) of the CBF measurement. Although sequences are being developed that can simultaneously estimate ATT and CBF virtually without an SNR penalty, 19 large clinical neuroimaging studies typically adopt a single PLD ASL approach for scanning efficiency. 3 By definition, at least to date, single PLD ASL acquisitions are not capable of extracting ATT information.
We propose to use the spatial distribution of ASL tracer signal across a single-PLD ASL image as a proxy of ATT. Empirically, it is well established that macro-vascular artifacts are evident on CBF images when ATT is longer than the PLD. This phenomenon is characterized by relatively high intravascular ASL signal in vascular regions in combination with relatively low ASL signaling tissue regions. In other words, if all the ASL tracer has already arrived in the tissue then the CBF signal intensity will be spatially homogeneous, but if the ASL tracer has not arrived in the tissue yet, then the CBF signal intensity difference between vascular and tissue regions is high. The current study attempts to exploit this spatial distribution of the ASL signal across the single-PLD CBF image.
We hypothesize that the spatial coefficient of variation (CoV) from a non-crushed CBF image will correlate with ATT. Additionally, we explore the reliability of this parameter by comparing associations with known demographic perfusion correlates age and sex between spatial CoV, ATT, and CBF without (CBFnon-crushed) and with (CBFcrushed) crushing. As a first proof of concept, we investigated the spatial CoV calculated within a total GM region-of-interest (ROI) in this study. Then we repeated part of our analyses for a whole brain ROI – which would be easier to implement clinically – and for individual vascular territories, to explore whether the performance of this parameter can differ between ROIs.
Materials and methods
The data for this study were drawn from the Prevention of Dementia by Intensive VAscular care (PreDIVA) study. 20 Detailed methods are disclosed previously. 9 A brief summary of the methods is provided below.
Participants
From the MRI substudy (n = 195) of pre-DIVA – a randomized controlled trial investigating the effect of intensive vascular care on dementia onset 20 – nine participants were excluded because of poor 3D T1 or ASL image quality due to severe motion or labeling artifacts, resulting in 186 community-dwelling older adults with hypertension (46% male, aged 77.4 ± 2.5 years). All patients provided written informed consent and the study was approved by the institutional review board of the Academic Medical Center, Amsterdam and federal authorities according to the Declaration of Helsinki ‘Ethical Principles for Medical Research Involving Human Subjects’ and in accordance with the guidelines for Good Clinical Practice (CPMP/ICH/135/95).
Acquisition
Imaging was performed on a 3T MRI system (Intera, Philips, Best, The Netherlands) equipped with an eight-channel head coil. A slightly adapted version of the original flow encoding arterial spin tagging (FEAST) ASL acquisition was used, enabling the simultaneous acquisition and quantification of ATT, CBFnon-crushed and CBFcrushed. 21 Two consecutive background-suppressed gradient-echo EPI pseudo-continuous ASL (PCASL) sequences were performed without and with flow-crushing gradients in three directions (velocity cutoff 50 mm/s). The inferior–superior PLD range for both sequences was 1525–2080 ms and the labeling duration was 1650 ms.
Post-processing
ASL post-processing was performed with the "ExploreASL" toolbox, an in-house developed toolbox based on SPM (Statistical Parametric Mapping, Wellcome Trust Centre for Neuroimaging, London, UK). 22 Post-processing included 3D motion correction, rigid-body registration of CBFcrushed to CBFnon-crushed, and CBFnon-crushed to a gray matter probability map segmented from a 3D T1 and spatial normalization into common space using Diffeomorphic Anatomical Registration analysis using Exponentiated Lie algebra (DARTEL). 23 ATT images were calculated using the FEAST equation, with the ratio between CBFcrushed and CBFnon-crushed as input, whereas CBFnon-crushed and CBFcrushed were quantified using a single compartment model.3,21 An identical quantification was used for both CBFnon-crushed and CBFcrushed.
Spatial CoV
The spatial CoV was defined as the standard deviation of CBF divided by the mean CBF, within an ROI

The spatial CoV was obtained from the non-crushed ASL scans, which represent the current recommended ASL sequence without direct ATT information. 3 Unless specifically stated otherwise, the spatial CoV measured within the total GM ROI is reported.
Leave-one-out cross-validation
A leave-one-out cross-validation was used to investigate the ability of spatial CoV to predict ATT – as measured using FEAST – in which the data of each participant were considered as one subsample. Dependence of ATT on CoV was obtained from 185 subsamples using linear regression. The results were used to predict ATT from spatial CoV in the remaining subsample and the difference between the measured and predicted ATT was calculated. This cross-validation process was repeated 186 times, with each of the 186 individual subsamples used once. This cross-validation was performed separately for the total GM ROI, the whole brain ROI, and the vascular territories of the anterior (ACA), middle (MCA), and posterior carotid artery (PCA). 24
Associations with age and sex
To investigate and compare associations between the various perfusion parameters and age and sex, separate linear regressions were performed for each of the predictors (age or sex) and for each of the dependent variables spatial CoV, ATT, CBFnon-crushed, and CBFcrushed within the total GM ROI. As the spatial CoV and ATT were not normally distributed, linear regressions were performed with their log-transformed values. Both head motion and partial volume effects were considered as covariates to assess their influence on the associations between the perfusion parameters and age and sex. Head motion was defined as the mean difference of the net frame-wise displacement vector. 25 For all linear regressions, a t-stat null distribution was created by permuting the dependent values 1,000,000-fold to acquire single-step maxT adjusted p-values.
Simulation of partial volume effects
The effects of partial volume error on the perfusion parameters were simulated by the creation of high resolution pseudo-CBF images (1.5 × 1.5 × 1.5 mm) from the GM and white matter (WM) probability maps from the 3D T1 segmentations. These images were multiplied by 45 and 15 mL/100 g/min for GM and WM, respectively, 9 assuming that CBF is homogeneously distributed across these tissue types. These images were then smoothed to the same point-spread function as the ASL acquisition resolution (Gaussian kernel 3 × 3 × 7 mm full-width-half-maximum). The mean CBF and the spatial CoV were then extracted from these pseudo-CBF images within the GM in the identical manner as for the actual CBF images. These simulated mean CBF and spatial CoV estimates were then used as covariates.
Results
Visual appearance
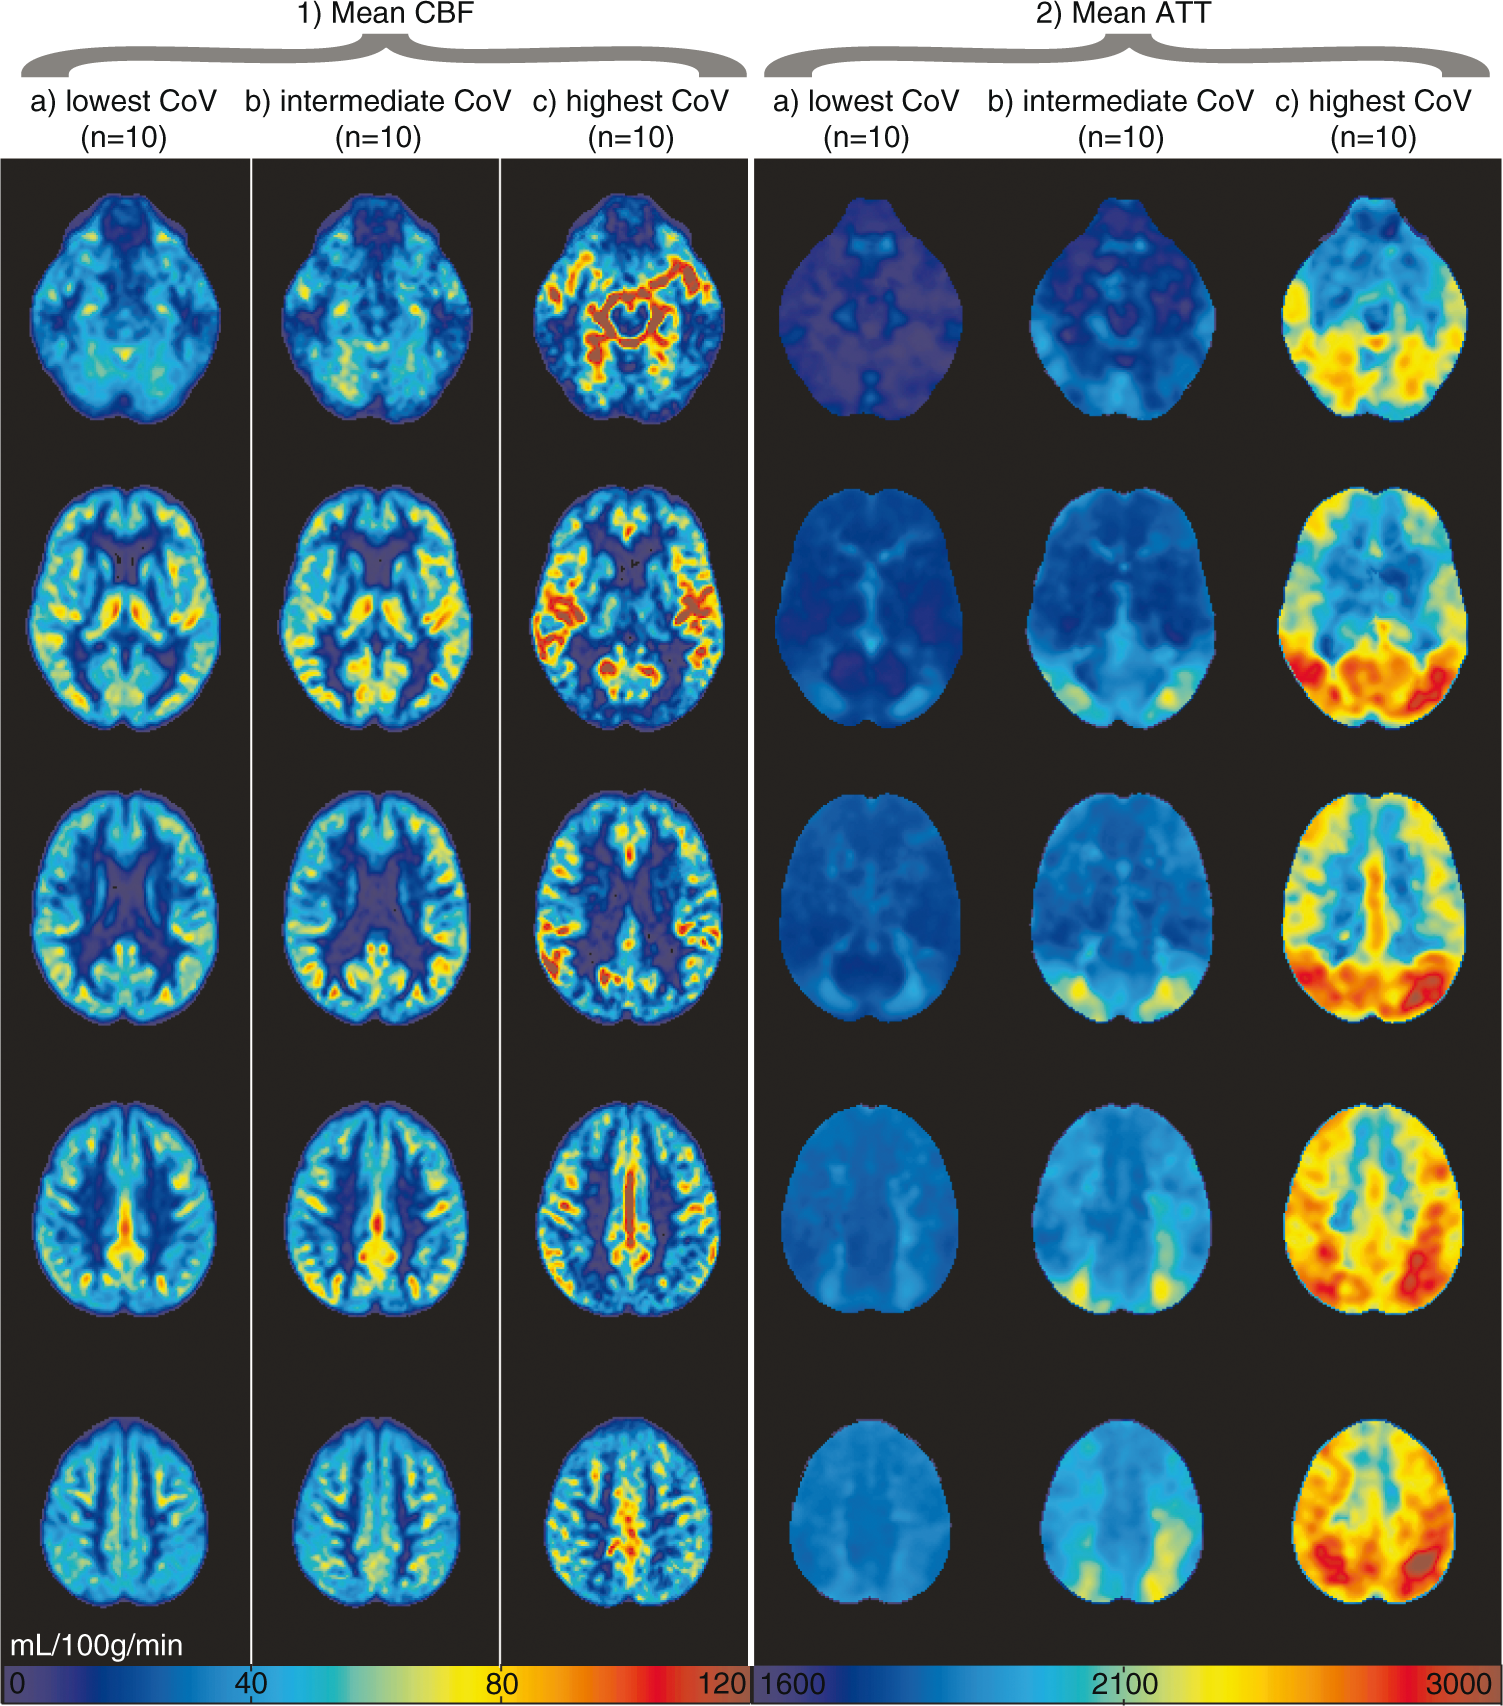
Figures 1 and 2 show the mean CBF and ATT images for 1 or 10 participants, respectively, with the lowest, intermediate, and highest spatial CoV. Figure 1 illustrates the large distribution difference between participants with the lowest and highest spatial CoV, which translates visually in a typical macro-vascular artifact image (Figure 1(a) on the right). The mean CBF images were relatively homogeneous for the 10 participants with the lowest spatial CoV, whereas the mean CBF images appeared more heterogeneous across the GM for the 10 participants with the highest spatial CoV. On the latter images, vascular signal is visible in the circle of Willis and in the anterior and middle cerebral arteries. The overall mean GM spatial CoV was 56.9 ± 13.2% (range 39.3%–113.6%).
Non-crushed cerebral blood flow (CBF) images (a) and histograms (b) are shown for single participants with the lowest (39.3%), intermediate (54.0%), and highest (113.6%) spatial coefficient of variation (CoV). Mean non-crushed cerebral blood flow (CBF) (1) and arterial transit time (ATT) (2) images are shown for the 10 participants with lowest (a, 39.3%–41.6%), intermediate (b, 52.8%–54.8%) and highest (c, 83.4%–113.6%) spatial coefficient of variance (CoV), respectively. CBF was rescaled per participant to a mean gray matter CBF of 50 mL/100 g/min for this figure.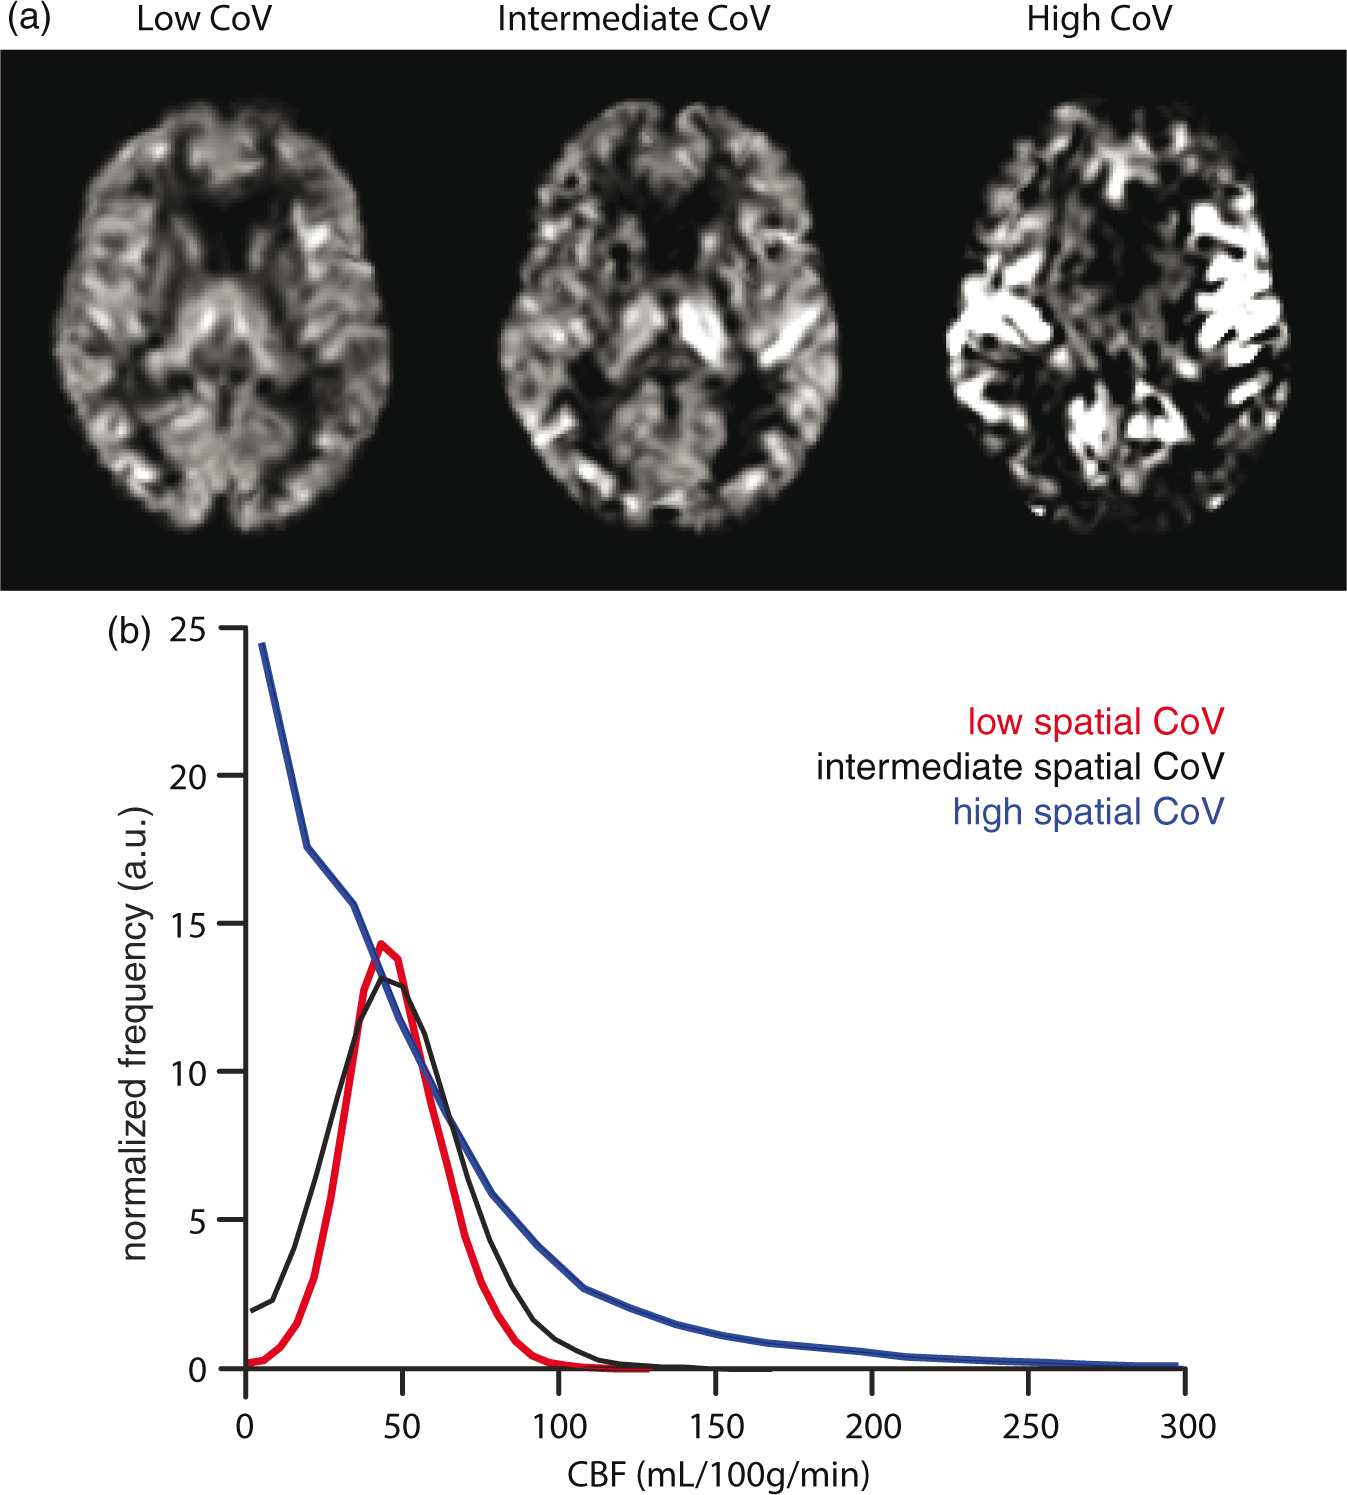
Reliability estimation
The leave-one-out cross-validation results are shown as a Bland–Altman plot in Figure 3, for the total GM on the left and for the whole brain on the right. The limits of agreement indicate that 95% of the predictions had a maximum error of 149.4 ms, which is 7.6% with respect to a mean GM ATT of 1977.0 ms in our population for the total GM (Figure 3(a)). Likewise, the maximum error of the whole brain ROI was 148.4 ms, which is 7.5% with respect to the mean whole brain ATT of 1988.3 ms (Figure 3(b)). For the ACA, MCA, and PCA vascular territories, respectively, the maximum errors were 162.1 ms, 165.9 ms, and 280.4 ms, which are 8.0%, 8.4%, and 13.8% with respect to the mean vascular ROI ATT of 2022.9 ms, 1986.8 ms, and 2039.0 ms, respectively.
Bland–Altman plots of the difference between ATT measured by flow encoding arterial spin tagging (FEAST) and ATT predicted from the spatial coefficient of variance (CoV) by the leave-one-out cross-validation, plotted against the mean of both ATTs for the total gray matter region-of-interest (ROI) (a) and the whole brain ROI (b). ATT: arterial transit time; FEAST: flow encoded arterial spin tagging. Continuous and broken lines indicate mean difference and limits of agreement (mean difference ± 1.96 standard deviation of the paired difference), respectively.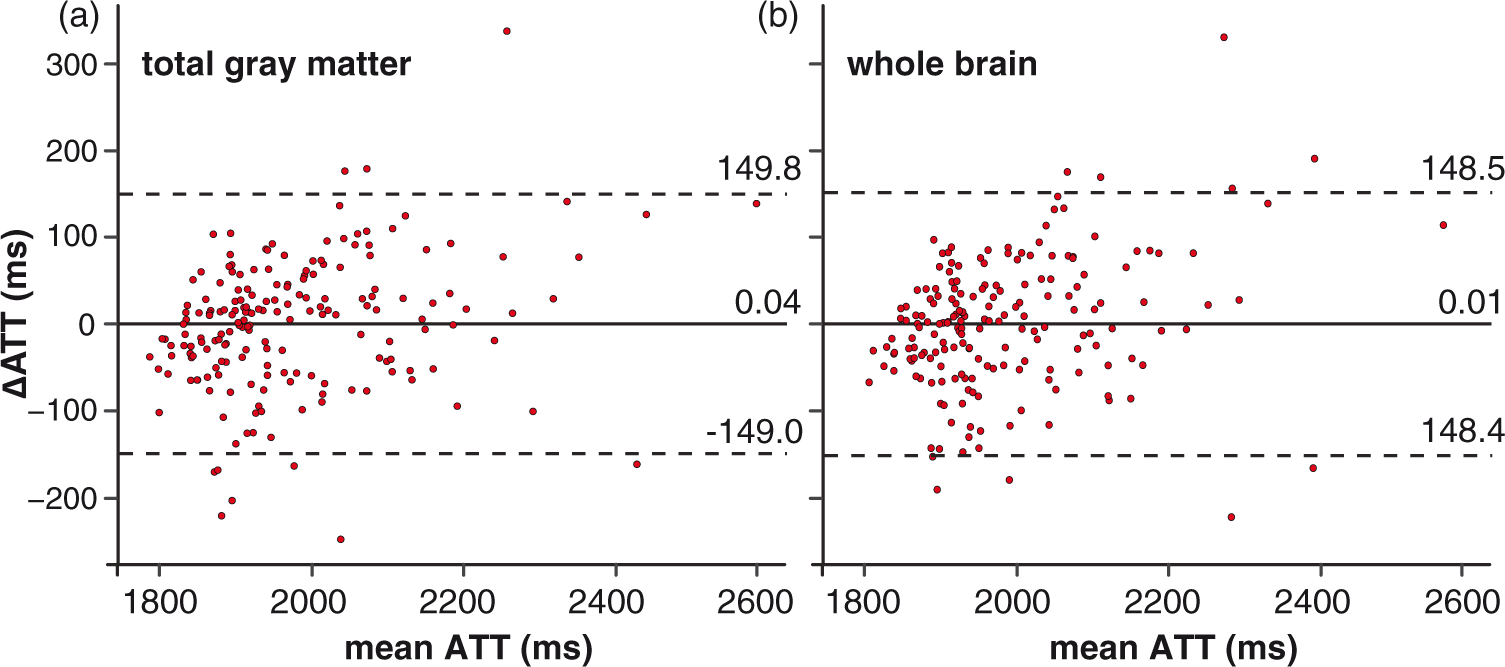
Associations with age and sex
Figure 4 displays histograms, scatter plots, and correlation coefficient values between the different GM ASL-based perfusion parameters and age and sex. The histogram shapes of GM spatial CoV and GM ATT had a similar appearance. The GM spatial CoV was strongly associated with GM ATT (r = 0.85, p = 1 × 10−56, bivariate Pearson correlation coefficients). Similar associations were found between the spatial CoV and ATT when computed for the whole brain (r = 0.85, p = 1 × 10−52), and only slightly weaker associations for the anterior (r = 0.78, p = 1 × 10−39), middle (r = 0.83, p = 1 × 10−48) and posterior (r = 0.79, p = 1 × 10−41) vascular territories. The GM spatial CoV showed a stronger association with GM CBFcrushed (r = −0.83, p = 1 × 10−46) than with GM CBFnon-crushed (r = −0.70, p = 1 × 10⁻²⁶). Table 1 shows linear regression estimates between GM perfusion parameters and age and sex, without (model 1) and with adjustment for head motion and partial volume effects (model 2). In the unadjusted models, ATT and CBFcrushed were moderately associated with age (β = 0.158; p = 0.031 and β = −0.186; p = 0.011, respectively) and strongly associated with sex (β = −0.273; p < 0.001 and β = 0.231; p = 0.002). CBFnon-crushed was moderately associated with age (β = −0.164; p = 0.026) but not with sex (β = 0.108; p = 0.142). On the other hand, spatial CoV was strongly associated with both age (β = 0.207; p = 0.004) and sex (β = −0.245; p = 0.001).
Table containing bivariate Pearson associations for spatial coefficient of variation (CoV), arterial transit time (ATT), non-crushed and crushed cerebral blood flow (CBF). The diagonal shows histograms in turquoise. Bivariate scatter plots (black) and linear regression lines (red) are shown in the table elements below the diagonal, whereas Pearson coefficients are shown above the diagonal. Histograms are shown without data transformation, whereas the associations with spatial CoV or ATT were performed with their log-transformed values. Regression coefficients for age and sex (n = 186). Note: Estimated standardized coefficients (β) and permutation-adjusted p-values are shown for separate linear regressions between demographic parameters age and sex (predictors) and perfusion parameters (dependent variables). Models 1 and 2 are unadjusted and adjusted for head motion and partial volume effects, respectively. M > F stands for higher mL/100 g/min in male compared to female. *p < 0.05, †p < 0.01. ATT: arterial transit time; CBF: cerebral blood flow; CoV: coefficient of variance.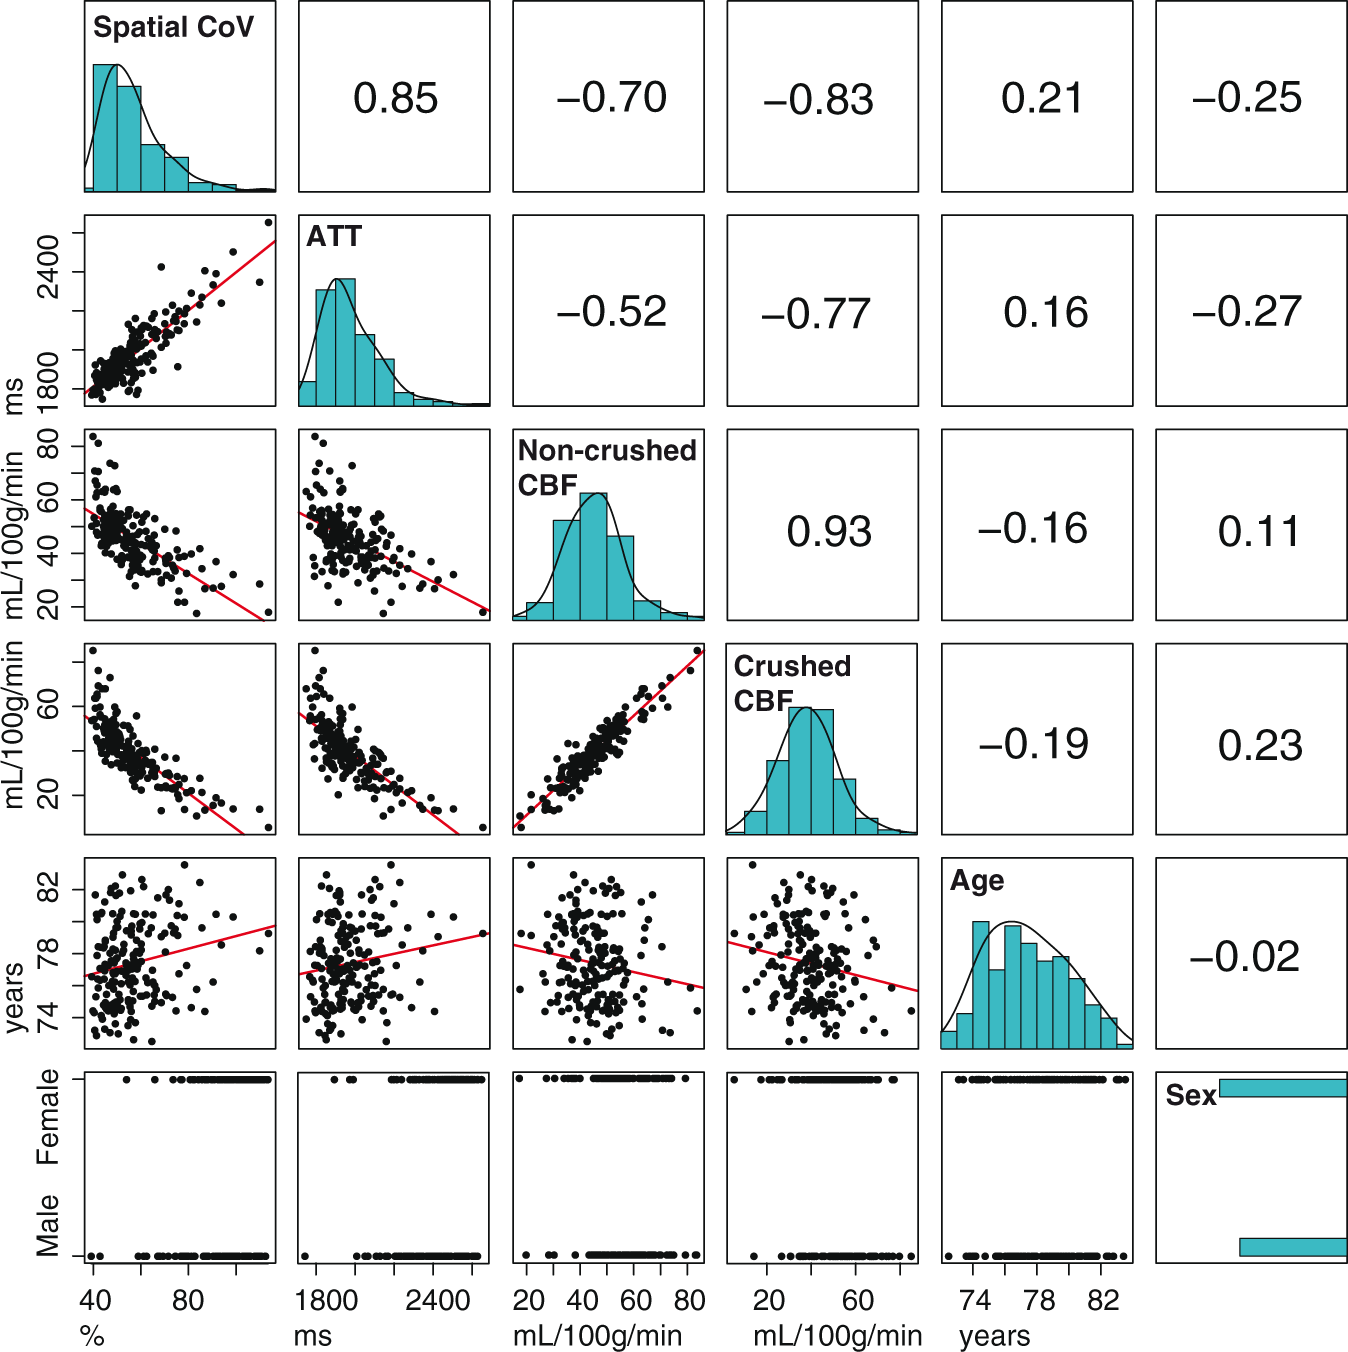
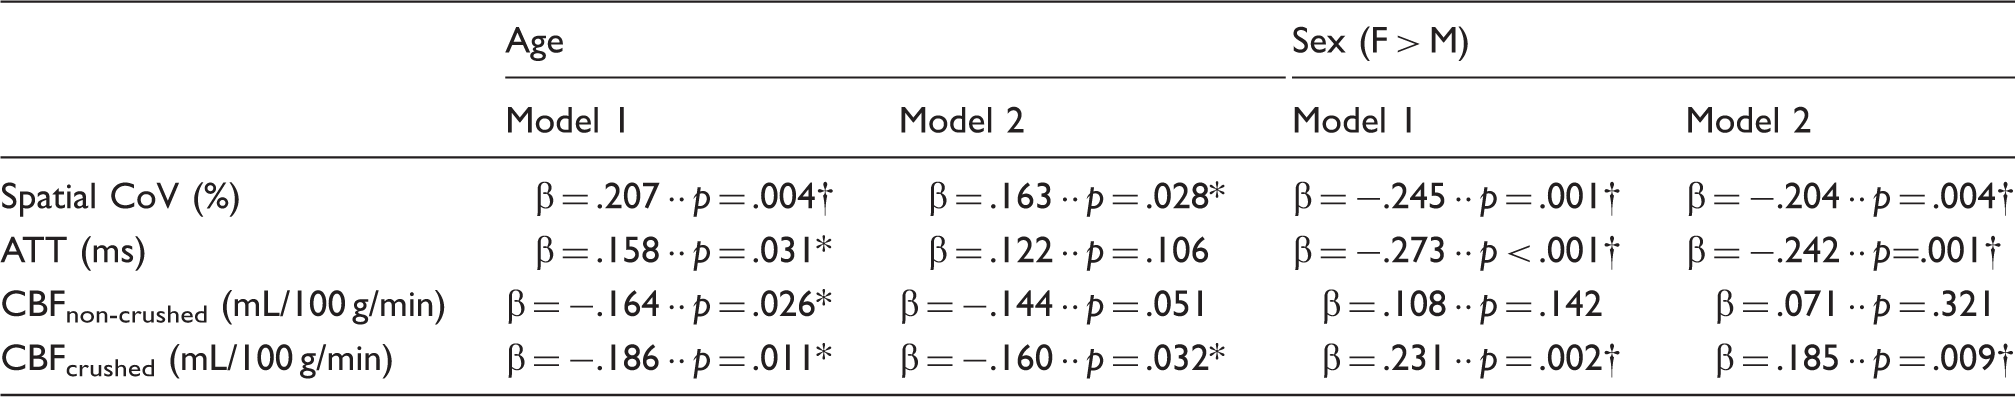
Adjustment for motion and partial volume effects attenuated all associations. Associations with age became non-significant for ATT (β = 0.122; p = 0.106) and CBFnon-crushed (β = −0.144; p = 0.051) but remained significant for CBFcrushed (β = −0.160; p = 0.032) and spatial CoV (β = 0.163; p = 0.028). After adjustment, the associations with sex became non-significant for CBFnon-crushed (β = 0.071; p = 0.321) but remained significant for CBFcrushed (β = 0.185; p = 0.009), ATT (β = −0.242; p = 0.001) and spatial CoV (β = −0.204; p = 0.004).
Discussion
In the present study, we evaluated the spatial CoV from non-crushed CBF images – representing the currently recommended ASL sequence without direct ATT information. 3 Specifically, we compared the spatial CoV with ATT acquired by FEAST, and with crushed and non-crushed CBF. The results of this study were two-fold. First, the spatial CoV predicted ATT with relatively high precision on a single-participant level. Second, the spatial CoV provided the most robust hemodynamic measure in terms of its association with age and sex, even after adjusting for head motion and partial volume effects. These findings may have wide implications for current clinical single PLD ASL studies, which do not inherently provide ATT information.
The finding that the spatial CoV provided the strongest associations with age and sex out of all perfusion parameters suggests that the spatial signal distribution of a non-crushed single-PLD ASL scan contains relevant perfusion information. Furthermore, the spatial CoV associated more strongly with ATT and CBFcrushed than with CBFnon-crushed, and its population distribution had a shape similar to the distribution of ATT. These findings suggest that the spatial CoV of a non-crushed CBF scan contains information that could have otherwise only been obtained if crushing was applied, or if an additional ATT acquisition was performed. Additional ATT scans are not usually performed in clinical practice because of scanning time limitations. Furthermore, including vascular crushing in the ASL sequence parameters is not the current convention, as articulated in the recent ASL consensus paper, because vascular crushing reduces SNR for the CBF image. 3 Therefore, the use of the spatial CoV as a proxy ATT parameter may have value in clinical ASL studies.
One additional explanation for the demonstrated utility of spatial CoV could be that spatial CoV has a higher reliability and power than the CBF measurements in a population of elderly with hypertension. Whereas CBF measurements with single-PLD ASL require that the label has arrived in the tissue compartment, the spatial CoV only requires that the label has arrived in the imaging voxel, i.e. irrespective of the vascular or tissue compartment. The latter condition is easier to satisfy, especially in patients with compromised cerebrovasculature.9,26 In other words, whereas the reliability of ASL to measure CBF is limited in the presence of macro-vascular artifacts, this is not the case for spatial CoV. Furthermore, because the spatial CoV is a ratio – i.e. it is normalized for mean CBF – it may be less sensitive to physiological perfusion fluctuation or to whole brain differences in quantification parameters between participants. 27 Therefore, it can be envisioned that the spatial CoV had higher statistical power than CBF in our population of elderly with hypertension. As a single patient clinical implementation, the spatial CoV may outperform other ATT acquisition techniques such as FEAST or multi-PLD PASL or PCASL, which require high tissue SNR and are sensitive to motion. 11
The fact that the reliability of spatial CoV to predict ATT was similar for the total GM and whole brain ROIs is interesting, considering the poor SNR of ASL in the WM. 28 A potential explanation is that both the WM spatial CoV and the WM FEAST-ATT measurements contain mainly noise and the GM spatial CoV and GM FEAST-ATT will dominate the whole brain metrics. Fortunately, this removes the need for brain segmentation into GM and WM regions, enabling fast computation of the spatial CoV which facilitates implementation on clinical workstations.
A limitation of this study is that we compared the spatial CoV with a method that does not directly measure ATT. Compared with multi-PLD methods, FEAST has several advantages, including higher SNR, whole brain coverage, and the more continuous range of ATTs that it can cover, i.e. a higher ATT resolution. 26 A main drawback of FEAST, however, is that it provides relative ATT values, which are limited by pre-defined velocity cutoff values and PLD acquisition parameters.9,21 Therefore, the values provided in this study reflect relative rather than absolute ATT. Nevertheless, a recent study has shown that our ATT distribution across the brain as measured by FEAST is comparable with the ATT distribution as measured by multi-PLD PCASL.9,10 Another potential limitation is that other factors exist that could account for an inhomogeneous distribution of ASL signal than ATT alone, such as labeling efficiency asymmetry. This could explain why we found a lower reliability for the spatial CoV to predict ATT in the PCA territory, since the vertebral vessels are more tortuous and known to be prone to a lower mean labeling efficiency and larger labeling efficiency variance.26,29 Other reasons for the poorer reliability in the PCA ROI could be the fact that this ROI has relatively long macro-vascular ATT and the label may not have reached the all PCA voxels, which decreases the reliability of FEAST. Finally, this ROI is smaller than the ACA and MCA territories.
The statistical power of the spatial CoV relative to the CBF estimate can be expected to depend on the ASL labeling timing parameters, with shorter labeling duration and PLD benefiting the spatial CoV estimate and longer labeling duration and PLD benefiting the CBF estimate. 30 The current study was designed and conducted before the conception of the ASL consensus review. 3 Our labeling duration (1650 ms) and average PLD (1800 ms) were slightly shorter than the values recommended in the consensus review (1800 ms and 2000 ms, respectively) for a cohort of elderly participants. If this study would have been repeated with the recommended timing parameters, the statistical power of the CBF estimate is expected to slightly increase relative to the spatial CoV estimate, because the labeled spins would have had slightly more time to reach the cerebral tissue.
Conclusion
We show the feasibility and potential added value of the spatial CoV as an ATT proxy parameter, that can be extracted from a single-PLD ASL scan without the need for additional scans or post-processing techniques. This parameter has the potential to provide hemodynamic information that is additional to, and could in some cases be even more robust than CBF, especially in patients with compromised cerebrovasculature. These findings may have implications for clinical ASL studies without direct ATT measurements.
Footnotes
Funding
The authors disclosed receipt of the following financial support for the research, authorship, and/or publication of this article: This study was carried out within the context of the preDIVA study (ISRCTN29711771), which was supported by the Dutch Ministry of Health, Welfare and Sports (grant 50-50110-98-020), the Dutch Innovation fund of collaborative health insurances (grant 05-234) and the Netherlands Organization for Health Research and Development (grant 62000015). The MRI substudy was supported by the ‘Internationale Stichting Alzheimer Onderzoek’ (ISAO, grant 10507) and the MRI data analyses by the Canadian Partnership for Stroke Recovery, NutsOhra, Sunnybrook Foundation, and the Weston Brain Institute.
Acknowledgments
The authors are grateful to I Stijnman and C Miedema for logistics and planning and to AM van den Berg, RD Snoeks for data acquisition.
Declaration of conflicting interests
HM, JP, LV, JD, AR, MC, MM, AN, ER and BM have no conflicts of interest related to the current work.
Authors’ contributions
HM designed the study, performed MRI post-processing, analyzed the data (including statistical analysis), interpreted the results, drafted the manuscript, approved the final version. JP designed the study, performed MRI post-processing, analyzed the data (including statistical analysis), interpreted the results, revised the manuscript, approved the final version. LV recruited patients and controls, coordinated study visits, supervised MRI scanning, revised the manuscript, approved the final version. JD recruited patients and controls, coordinated study visits, supervised MRI scanning, revised the manuscript, approved the final version. AR interpreted the results, revised the manuscript, approved the final version. MC interpreted the results, revised the manuscript, approved the final version. MM supervised the study, interpreted the results, revised the manuscript, approved the final version. AN conceptualized the imaging protocol, supervised MRI scanning, revised the manuscript, approved the final version. ER designed the study, coordinated study visits, revised the manuscript, approved the final version. BM designed the study, analyzed the data (including statistical analysis), interpreted the results, drafted the manuscript, approved the final version.