
Abstract
Parkinson's disease (PD) is associated with elevated expression of a specific disease-related spatial covariance pattern (PDRP) in radiotracer scans of cerebral blood flow and metabolism. In this study, we scanned nine early-stage patients with PD and nine healthy controls using continuous arterial spin labeling (CASL) perfusion magnetic resonance imaging (pMRI). Parkinson's disease-related metabolic pattern expression in CASL pMRI scans was compared with the corresponding 18F-fluorodeoxyglucose positron emission tomography values. The PDRP expression was abnormally elevated (
Keywords
Introduction
Spatial covariance analysis of 18F-fluorodeoxyglucose (FDG) positron emission tomography (PET) images has been used extensively in the study of Parkinson's disease (PD) and related disorders (Post-on and Eidelberg, 2009). Idiopathic PD is associated with the expression of a specific disease-related covariance pattern (PDRP) characterized by pallidothalamic and pontine hypermetabolism, along with hypometabolism in the premotor cortex, supplementary motor area, and parietal association regions (Ma et al, 2007). PDRP scores increase linearly with disease progression (Huang et al, 2007) and are modulated by effective treatment of motor symptoms (Asanuma et al, 2006; Feigin et al, 2007). As cerebral blood flow (CBF) and glucose metabolism are tightly coupled in PD patients scanned off medication, PDRP expression can also be quantified in resting CBF scans acquired using H215O PET or 99mTc-ECD (ethyl cysteinate dimer) SPECT (single photon emission computed tomography) imaging (Eckert et al, 2007; Ma et al, 2007).
Arterial spin labeling (ASL) perfusion-weighted magnetic resonance imaging (pMRI) is another possible method for the quantification of disease-related spatial patterns, because it uses magnetically labeled arterial blood water as an endogenous tracer and can be repeated multiple times within session to improve signal-to-noise ratio. In this regard, continuous ASL (CASL) is particularly useful because of its superior image quality in multislice acquisition (Floyd et al, 2003). Cerebral blood flow measurements with CASL pMRI are stable over intervals ranging from minutes to weeks (Parkes et al, 2004) and are used in functional studies of healthy aging. Recently, CASL pMRI has been used with spatial covariance analysis to identify and validate a significant regional pattern associated with Alzheimer's disease (Asllani et al, 2008). In this pilot study, we examined the feasibility of CASL pMRI for quantifying PDRP expression in patients and healthy control subjects. The resulting PDRP scores were compared with those obtained using FDG PET in the same subjects.
Materials and methods
Subjects
A total of 9 patients (6 men and 3 women; age 64.7 ± 9.2 years (mean ± s.d.)) with early stage PD (Hoehn and Yahr Stages 1 to 2; off-state UPDRS (Unified Parkinson's Disease Rating Scale) motor ratings 22.8 ± 8.8) underwent CASL pMRI. All patients exhibited a clear-cut response to levodopa and/or dopamine agonist medications ( > 20% change in motor UPDRS ratings). Overall, 9 healthy volunteers (5 men and 4 women; age 54.1 ± 5.4 years) served as controls. Patients with PD and 7 of the controls also underwent FDG PET imaging. Ethical permission for this study was obtained from the Institutional Review Board of the North Shore University Hospital. Written consent was obtained from each subject after a detailed explanation of the procedures.
Imaging Protocol
Anti-parkinsonian medications were withheld for at least 12 h before MRI/PET imaging. Perfusion MRI was performed using a GE Signa 3-T MRI scanner (General Electric, Waukesha, WI, USA) using the product head coil. The scanner had a max gradient strength of 40 mT/m and a max gradient slew rate of 150 T/m per sec. Subjects were instructed to lie still in the scanner; their ears were plugged. A reference proton-density-weighted anatomic image with the same slice placement and thickness was acquired immediately after ASL acquisition. A high-resolution T1-weighted anatomic image was also acquired using a spoiled gradient recalled sequence (repetition time/echo time = 30/8 msecs, flip angle = 45°, field of view = 24 cm, 150 contiguous coronal slices, thickness = 1.5mm, matrix = 256 × 256, in-plane resolution = 0.94 × 0.94 mm2).
Continuous ASL pMRI was performed at the cervicomedullary junction using velocity-driven adiabatic inversion with an amplitude-modulated control labeling pulse (Wang et al, 2005). This procedure permits volumetric imaging of the whole brain in the same session by reproducing the frequency-dependent off-resonance effects of the labeling pulse. The effects of CASL pMRI were measured using single-shot, gradient echo and echo-planar images (EPIs) with a field of view of 24 cm along the frequency-encoding direction and 18 cm along the phase direction. Image acquisition was performed continuously across 48 slices (matrix size = 64 × 48, in-plane resolution = 3.75 × 3.75 mm2, slice thickness = 3.75 mm). Raw echo amplitudes from EPIs were saved on a workstation (Sun Microsystems, Mountainview, CA, USA) for reconstruction and processing using software written in Interactive Data Language (IDL) (Research Systems, Boulder, CO, USA). After correcting for noise and motion artifacts, quantitative CBF images were calculated as described previously (Alsop and Detre, 1998), and smoothed in-plane by using a Gaussian kernel with a FWHM (full-width at half-maximum) of 1.88 mm.
18F-fluorodeoxyglucose PET imaging was performed in three-dimensional mode using a GE Advance tomograph (General Electric) within 8 weeks of MRI. The FDG PET scans were conducted under conditions similar to those described above for ASL pMRI. A 10-min static frame was acquired in a quiet and dimly lit room starting 35 mins after radiotracer injection. Details of this procedure are described elsewhere (Ma et al, 2007). The PET images were reconstructed with a three-dimensional image resolution of 8-mm FWHM with a 6-mm Hanning filter (matrix = 128 × 128 × 35; voxel size = 2.43 × 2.43 × 4.25 mm3) after correcting for photon attenuation, scatter, randoms, and dead-time effects.
Data Processing
Continuous ASL pMRI and FDG PET images were processed separately using SPM software (Institute of Neurology, London, UK) running on Matlab 6.5 (Mathworks, Natick, MA, USA). The CASL pMRI scans were spatially normalized to a Talairach space by coregistration with in-plane proton-density images and high-resolution spoiled gradient recalled sequence scans. The normalized scans were smoothed using a Gaussian kernel at FWHM = 12 mm. The FDG PET scans were spatially normalized to a Talairach-based PET brain template and then smoothed using a Gaussian kernel at FWHM = 10 mm.
Parkinson's Disease-Related Metabolic Pattern Quantification
We computed PDRP scores for the individual CASL pMRI and FDG PET scans on a prospective single case basis using an automated blinded algorithm (Ma et al, 2007; Spetsieris et al, 2009) (software available in the Scaled Subprofile Model/Principal Component Analysis (SSM/PCA) toolbox; http://www.fil.ion.ucl.ac.uk/spm/ext/). These computations were performed blind to subject class (PD, controls) and imaging modality (CASL, PET) using a PDRP topography (Figure 1A), which was previously identified and validated with FDG PET (Ma et al, 2007). Raw PDRP scores were z-transformed on the basis of mean and s.d. of the whole sample. The resulting values for each imaging modality were offset so that the control mean was equal to zero.
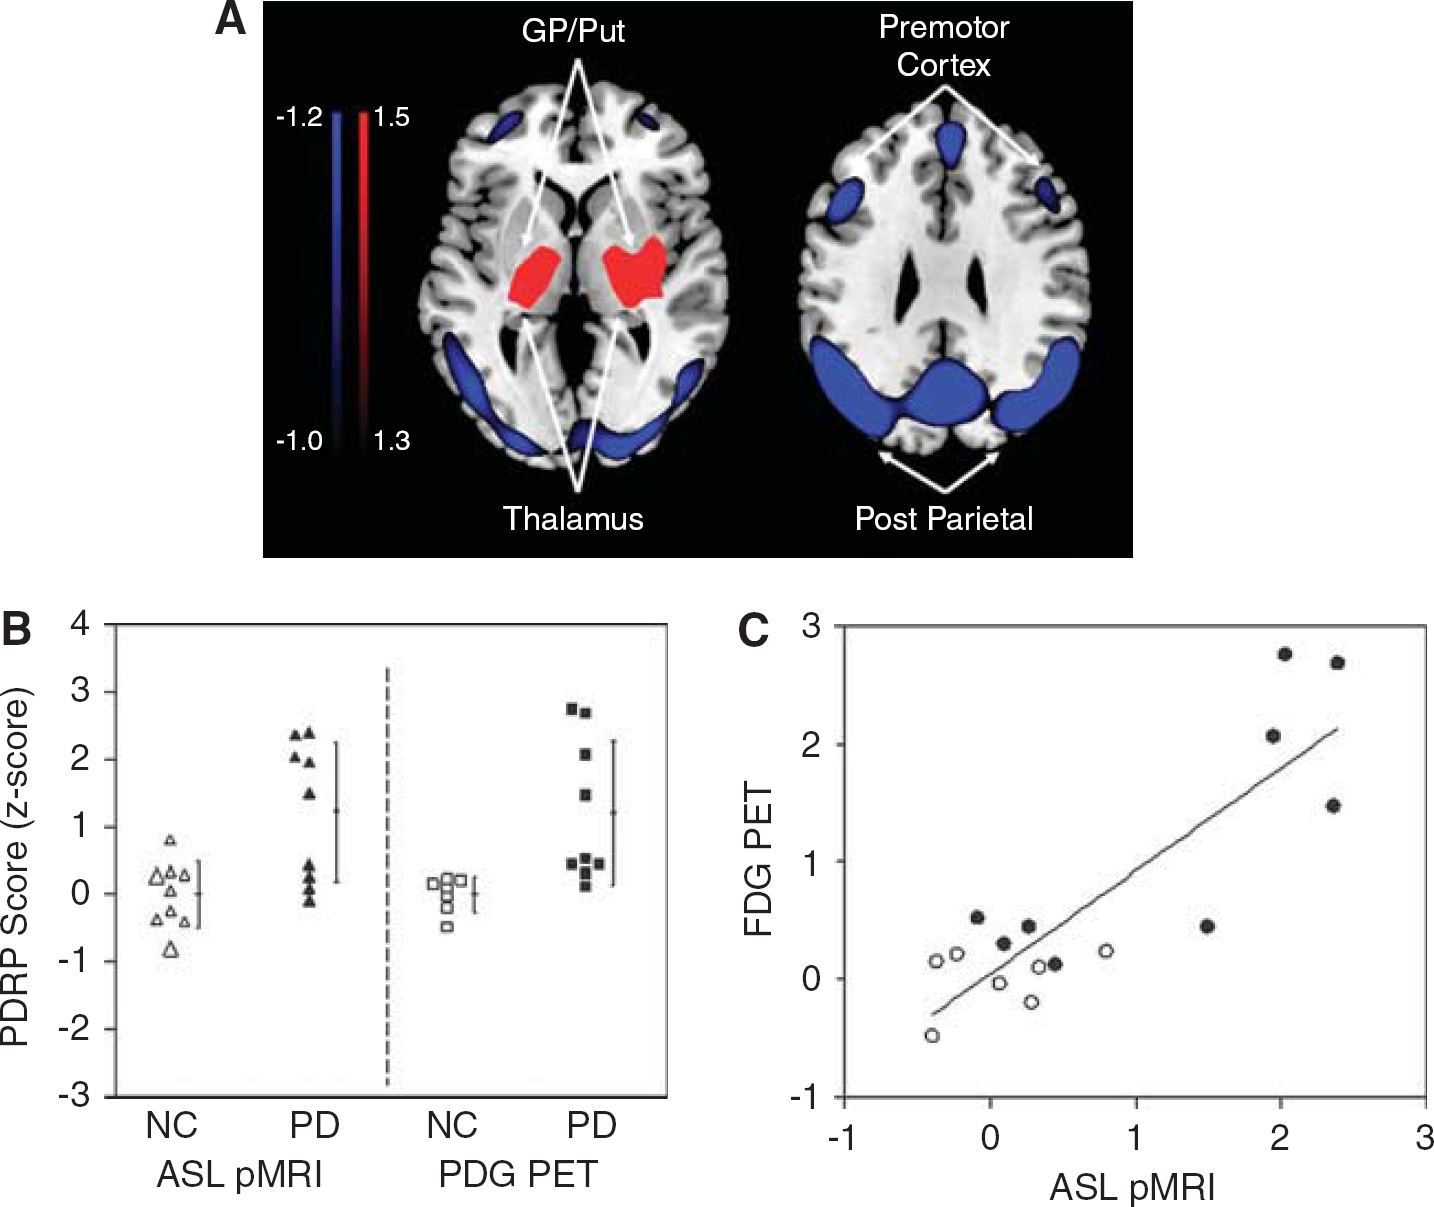
(A) Parkinson's disease (PD)-related metabolic pattern (PDRP) obtained by spatial covariance analysis of FDG PET scans from a combined sample of 33 PD patients and 33 age-matched controls, unrelated to the participants in the current study cohort (Ma et al, 2007). This abnormal regional covariance pattern was characterized by pallidal, thalamic, pontine, and cerebellar hypermetabolism associated with metabolic decrements in the lateral premotor and posterior parietal areas. (Voxel weights of the pattern overlaid on a standard MRI brain template. The displayed voxels were shown to contribute significantly to the pattern (
Statistical Analysis
Differences in PDRP scores between groups (PD versus controls) were compared separately for the two imaging measures using two-sample Student's
Owing to the significant age difference between the patient and control groups (
Results
PDRP scores obtained from the PD and control groups are presented in Table 1 (top). PDRP expression in the PD group was abnormally elevated (
PDRP scores measured with ASL pMRI and FDG PET
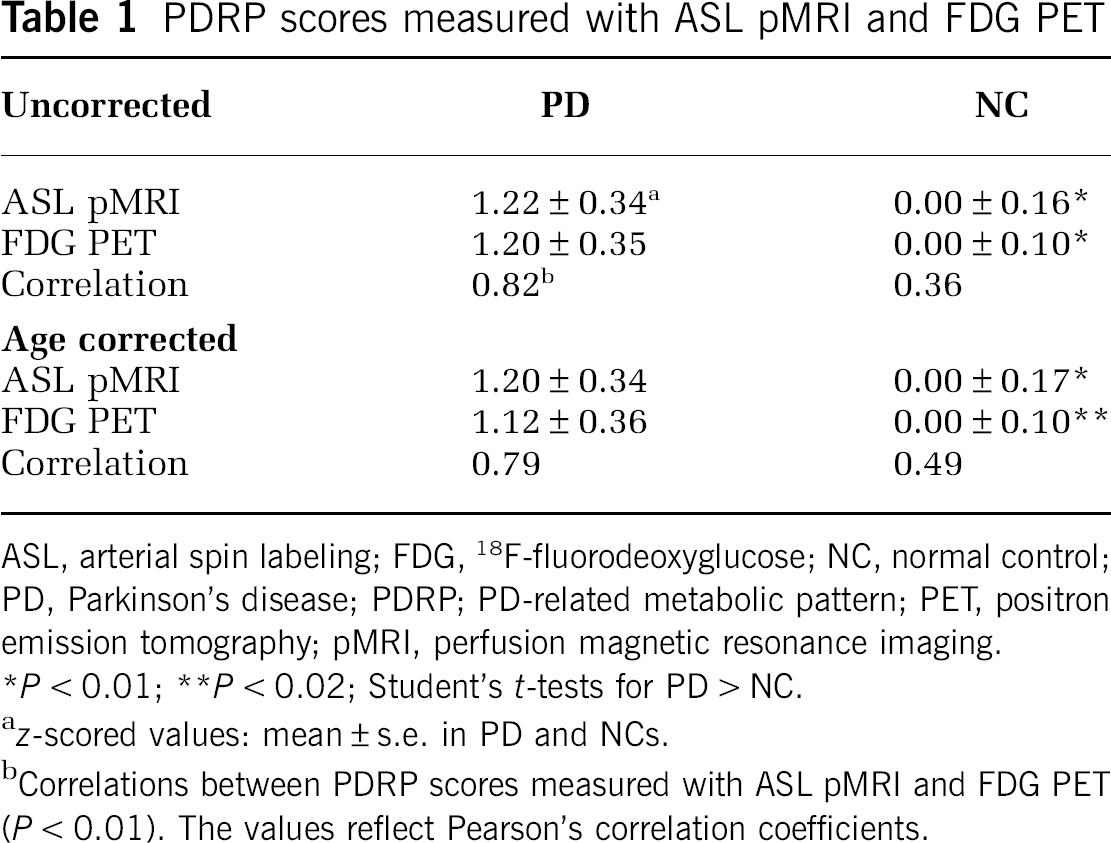
ASL, arterial spin labeling; FDG, 18F-fluorodeoxyglucose; NC, normal control; PD, Parkinson's disease; PDRP; PD-related metabolic pattern; PET, positron emission tomography; pMRI, perfusion magnetic resonance imaging.
z-scored values: mean ± s.e. in PD and NCs.
Correlations between PDRP scores measured with ASL pMRI and FDG PET (
Discussion
Spatial covariance analysis has been used in conjunction with radionuclide imaging of cerebral glucose metabolism and blood flow to identify and measure the expression of disease-related regional patterns in PD and other neurodegenerative disorders (Habeck et al, 2008; Poston and Eidelberg, 2009). In this study, we found that PDRP expression measured with CASL pMRI were comparable with values quantified by FDG PET in the same subjects. Indeed, PDRP scores obtained using CASL pMRI differentiated PD from controls with accuracy similar to that of FDG PET. This accords with previous PDRP findings in resting CBF scans acquired with H215O PET (Ma et al, 2007) and 99mTc-ECD SPECT imaging (Eckert et al, 2007).
We found a significant correlation between PDRP scores computed using CASL pMRI and FDG PET methods. The magnitude of this correlation (
We have previously observed that PDRP scores computed in the FDG PET scans of normal subjects exhibit a modest (
This study underscores the use of PDRP quantification with CASL pMRI as a potential screening tool and perhaps also for differential diagnosis of Parkinsonism (Spetsieris et al, 2009). Although relatively new, ASL pMRI can be easily implemented on conventional 1.5-T MRI platforms without additional hardware. The current method is based on gradient echo EPI, which generally has higher signal-to-noise than spin echo EPI, but is more susceptible to spatial artifacts from large vessels. In this regard, spin echo EPI may prove to be a better choice at 3 T. It is also important to note that dopaminergic therapy can lead to a significant dissociation of regional CBF and metabolism at critical PDRP nodes in PD. This results in a treatment-mediated increase in PDRP expression measured in CBF images, as opposed to the reduction observed with FDG PET (Hirano et al, 2008). Hence, caution may be appropriate in the interpretation of ASL-based pattern scores in medicated patients. Additional studies in a larger sample will be required to characterize and validate specific ASL-based PDRP topographies for prospective use with this imaging technique. Moreover, further refinement of CASL pMRI methodology may serve to reduce between-subject variability, thereby improving the accuracy of group separation with this approach.
Footnotes
Acknowledgements
We thank Drs Chengke Tang and Shichun Peng for their assistance with statistical methodology and image analysis, as well as Ms Toni Fitzpatrick for editorial assistance.
The authors declare no conflict of interest.