
Abstract
Physiological effects of spreading depolarizations (SD) are only well studied in the first hours after experimental stroke. In patients with malignant hemispheric stroke (MHS), monitoring of SDs is restricted to the postoperative ICU stay, typically day 2-7 post-ictus. Therefore, we investigated the role of physiological variables (temperature, intracranial pressure, mean arterial pressure and cerebral perfusion pressure) in relationship to SD during the late phase after MHS in humans. Additionally, an experimental stroke model was used to investigate hemodynamic consequences of SD during this time window. In 60 patients with MHS, the occurrence of 1692 SDs was preceded by a decrease in mean arterial pressure (−1.04 mmHg; p = .02) and cerebral perfusion pressure (−1.04 mmHg; p = .03). Twenty-four hours after middle cerebral artery occlusion in 50 C57Bl6/J mice, hypothermia led to prolonged SD-induced hyperperfusion (+2.8 min; p < .05) whereas hypertension mitigated initial hypoperfusion (−1.4 min and +18.5%Δ rCBF; p < .01). MRI revealed that SDs elicited 24 hours after experimental stroke were associated with lesion progression (15.9 vs. 14.8 mm³; p < .01). These findings of small but significant effects of physiological variables on SDs in the late phase after ischemia support the hypothesis that the impact of SDs may be modified by adjusting physiological variables.
Introduction
Spreading Depolarization (SD) is characterized by the most pronounced disruption of the ion gradients in the living brain’s gray matter.1,2 SD is observed as a propagating negative change of the extracellular slow potential and causes silencing of the brain’s electrical activity (spreading depression),3,4 unless spontaneous brain activity has already ceased before the start of the SD.5,6 Terminal SD emerges in the ischemic core with a delay of 1–5 minutes after the onset of severe ischemia.5–7 In addition, SDs occur spontaneously with high frequency in the penumbra 8 of animals subjected to experimental ischemia 9 and also in patients with malignant hemispheric stroke (MHS).10,11 The phenomenon of SD represents a massive metabolic burden as it not only includes the near-complete ion gradient breakdown1,2 with cytotoxic edema and intracellular sodium and calcium surge, 12 but also lactate acidosis, 13 tissue hypoxia 14 and pronounced decreases in tissue glucose and ATP. 15 This requires a substantial amount of energy to restore homeostasis, as approximately 90% of the Gibbs free energy normally contained within the transmembrane ion gradients is released during SD. 16 As a result, recovery of neurons from SD is dependent on tissue perfusion and energy supply and the duration of the SD negative potential shift serves as a local measure for both the metabolic burden and the degree of neuronal injury.6,17
Intact neurovascular coupling is a key mechanism to meet the increased energy demand and to prevent cellular damage during SD. 6 Thus, the predominant neurovascular response to SD in the normal brain is a spreading hyperaemia through vasodilatation, which leads to increased supply of substrates and clearance of metabolites.18,19 However, in tissue with critically reduced perfusion or in the presence of molecular factors disturbing neurovascular coupling, the hemodynamic response to SD can be inverse.20–23 This implies severe SD-induced vasoconstriction and spreading ischemia during the time period of cytotoxic edema, which could represent an important mechanism for secondary lesion progression.24,25 In experimental stroke models, most of the secondary lesion progression occurs within the first 24 hours after induction of ischemic stroke and this process may be enhanced by the occurrence of SDs.8,22,26–30 Nevertheless, there is evidence that significant changes in lesion volume may also occur beyond 24 hours. 31 However, the association between infarct maturation and SD occurrence in the late phase of ischemic stroke in humans has not yet been determined, 11 but such correlation has been suggested for early and delayed cerebral ischemia after aneurysmal subarachnoid hemorrhage (aSAH),25,29,32,33 traumatic brain injury (TBI)34,35 and intracerebral hemorrhage (ICH). 36 Moreover, an association between physiological variables and SD was previously reported in patients with TBI 37 but not in patients with ICH, 36 which underlines that the effect of physiological variables in the context of SD remains unclear. In patients with severe ischemic stroke, a better understanding of this association seems highly relevant, because physiological variables such as body temperature, mean arterial pressure (MAP), cerebral perfusion pressure (CPP) and intracranial pressure (ICP) remain a primary neurointensive therapeutic target, but the appropriate adjustment of these variables remains a matter of debate. 38
Therefore, in the present study we investigated the effects of body temperature, MAP, CPP and ICP on the incidence and features of SD in the postoperative monitoring period following decompressive hemicraniectomy in patients suffering MHS. To characterize the observed effects associated with SD in the late phase of ischemic stroke in more detail, hemodynamic responses to SDs under the influence of temperature and MAP were further characterized using a mouse model of distal middle cerebral artery occlusion (dMCAo) with delayed SD and cerebral perfusion monitoring.
Methods
Clinical study
Between August 2008 and March 2017, patient data was prospectively collected for the Co-Operative Study on Brain Injury Depolarization (COSBID) at two participating centers, Charité Campus Virchow Klinikum (Berlin, Germany) and Charité Campus Benjamin Franklin (Berlin, Germany). The study was approved by the ethics committee of the Charité-Universitätsmedizin Berlin (EA4/118/13) and performed according to the declaration of Helsinki. Informed consent or surrogate informed consent was obtained for all patients. Inclusion criteria were patients suffering MHS requiring decompressive hemicraniectomy that were at least 18 years of age. Exclusion criteria were an unfavorable prognosis due to bilaterally dilated and fixed pupils, impaired hemostasis (thrombocytes < 60/nl, Quick value < 60%, aPTT > 45 s), or pregnancy. Sixty-five patients were consecutively enrolled, of which five patients had to be excluded because of insufficient quality of the electrocorticographic (ECoG) recordings.
Clinical monitoring of SD and physiological variables
ECoG-monitoring as well as data processing and analysis were performed according to the recommendations of the COSBID research group. 39 During hemicraniectomy, a linear subdural electrode strip (6 platinum/iridium contacts spaced at 10 mm, 4.2 mm2 exposed surface, Wyler, 5 mm diameter, Ad-Tech, Racine, WI, USA) was placed on cerebral cortex over the penumbral zone. 40 Indocyanine green fluorescence imaging or laser speckle contrast imaging (LSI) were used to detect the ischemic core by intraoperative visualization of rCBF. 41 Patients were ECoG-monitored for 2–9 days, depending on the length of stay on the intensive care unit. The electrode strip was removed at bedside without incidences of bleeding or infection. The near direct current (DC)/alternate current (AC)-ECoG (bandpass: 0.01–45 Hz) was recorded in five bipolar channels at a sampling rate of 200 Hz with a GT205 amplifier and acquired with a Powerlab 16/SP (both ADInstruments, New Zealand). A subdermal platinum/iridium needle electrode was inserted into the scalp as a reference for additional monopolar recordings. Physiological variables were retrieved from the patient data management system (PDMS) used at both study sites (COPRA, COPRA System GmbH, Berlin, Germany). Data was monitored and stored continuously and median values for every 0.5 hours were calculated as a sampling period for further analysis. Core temperature was measured in the bladder using a urinary catheter and arterial blood pressure was measured in the radial artery. ICP was recorded with an intraparenchymal probe (Neurovent-P, Raumedic AG, Germany). CPP was calculated as the difference between MAP and ICP.
Clinical data analysis and statistics
For every patient, SDs were defined as consecutive negative slow potential changes in neighboring channels in the near-DC-ECoG. SDs in electrically active tissue received the epithet ‘spreading depression’ whereas SDs measured in a zone of electrically inactive tissue were denoted with the adjective ‘isoelectric’.
39
In case of spreading depressions, the duration of the depression was assessed from the AC-ECoG (bandpass: 0.5-45 Hz) as the time from the initial loss of power until the beginning of recovery. The depression duration was calculated for all channels and the longest duration was assigned to the SD. For better comparability of the data between different patients, all SD-related variables assessed from a certain time of valid recordings within one day were normalized to a recording day of 24 hours (Figure 1). For example, if 5 SDs occurred within 18 hours of recording on one day, the corrected number for a recording day would be 6.67 (
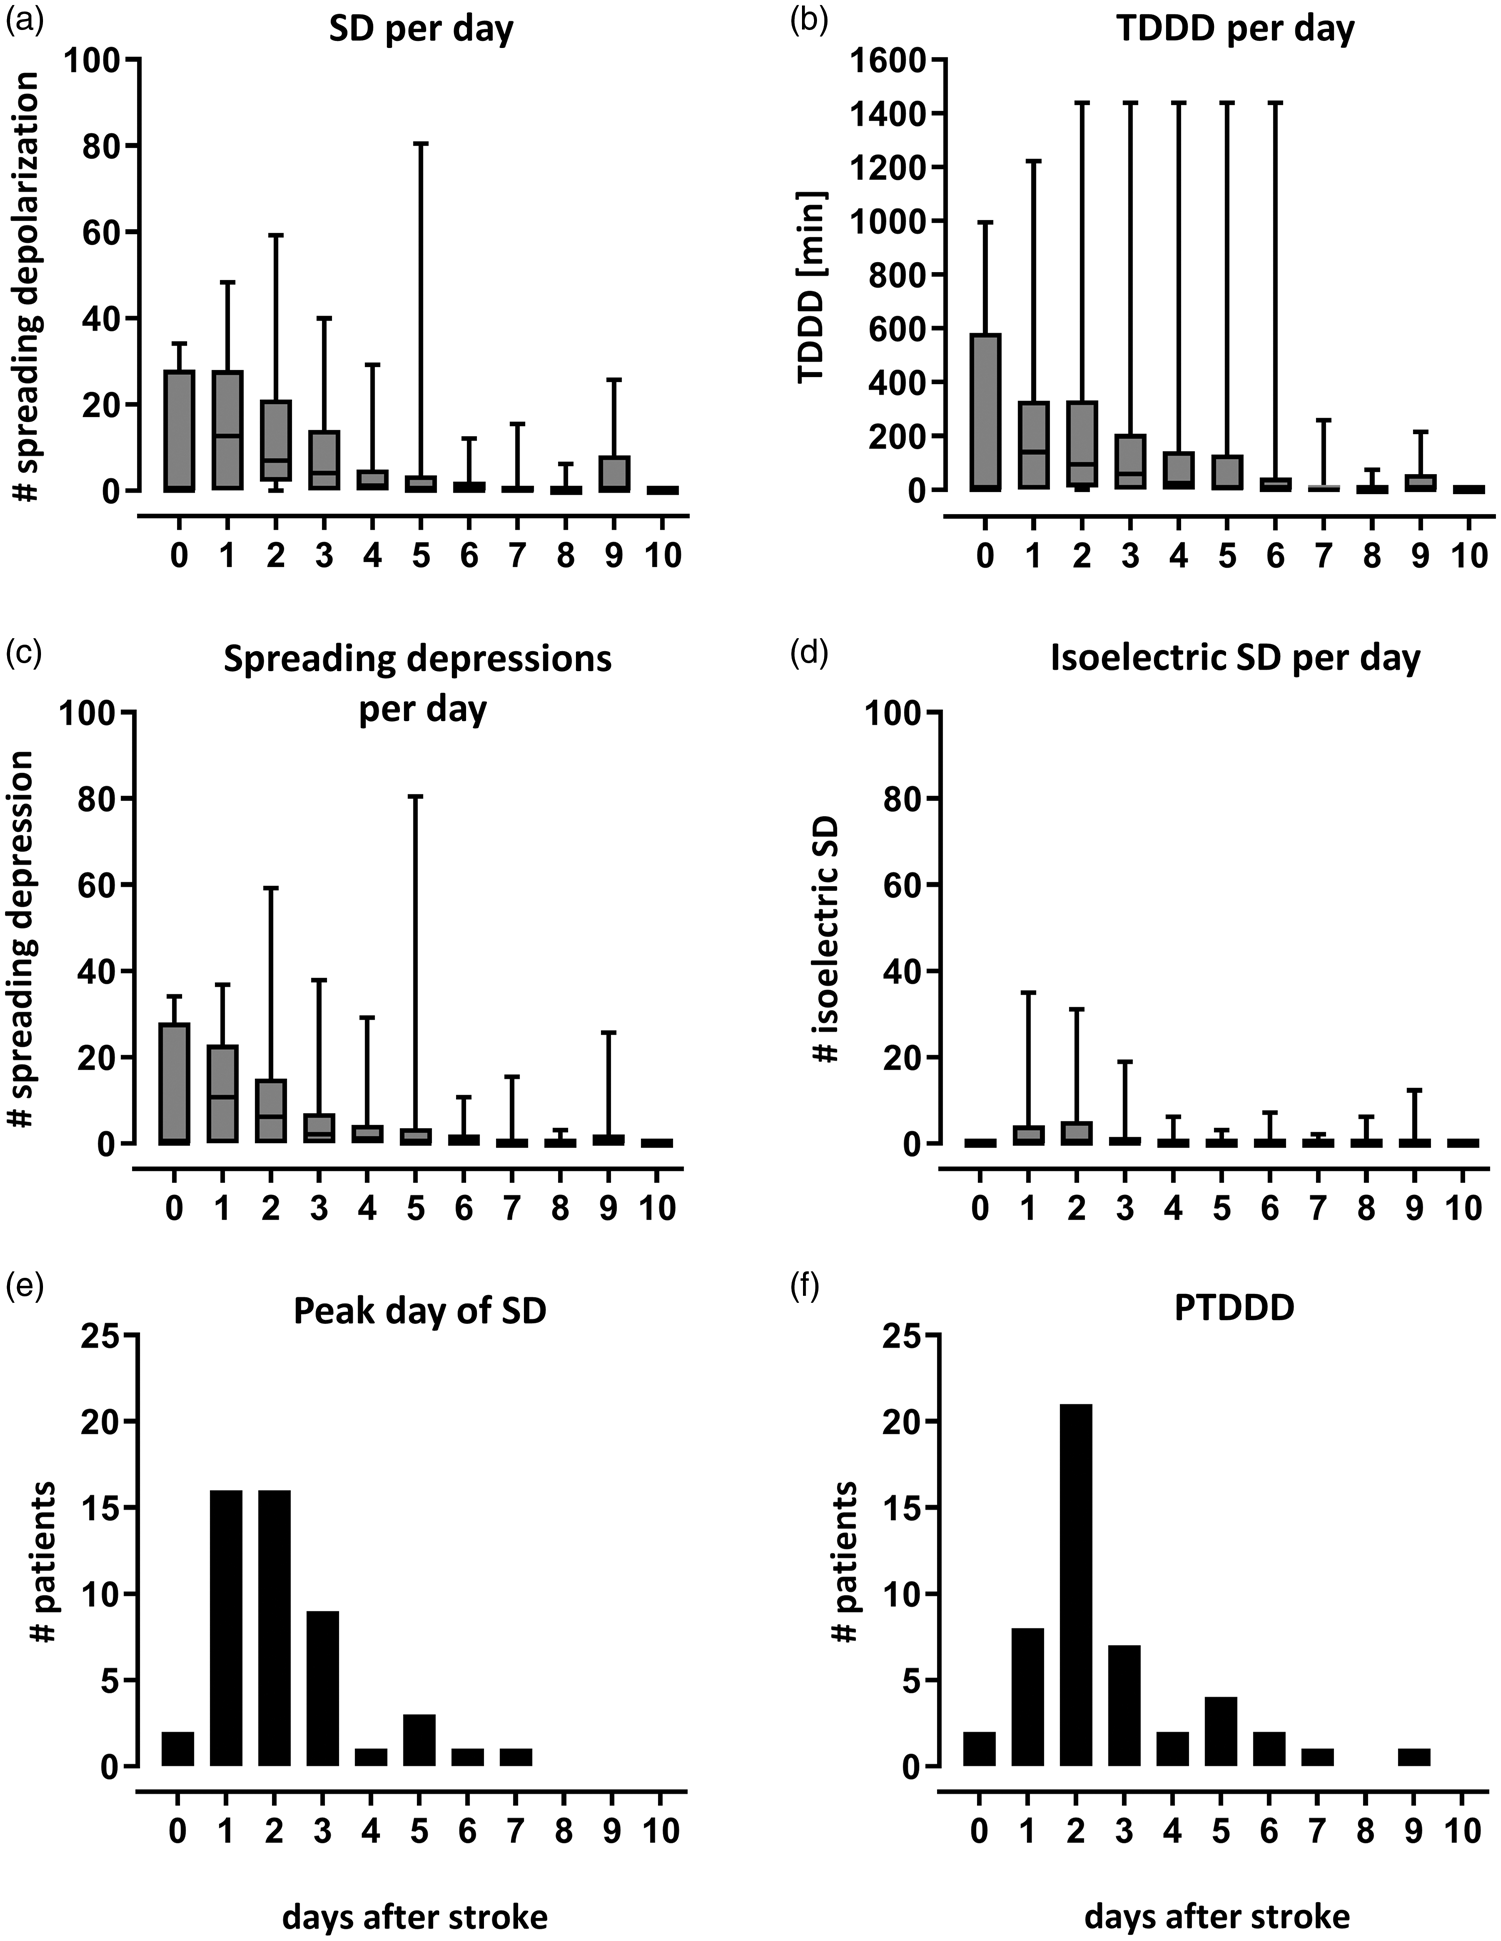
Time course of SD-related variables after stroke. Graphs show median and IQR of all patients with ECoG-recording. All data was corrected for the total recording time of a patient on that day, to make the median values of the patients comparable, hence all variables reported refer to a recording day. (a) Total number of SD per patient. (b) The total depression duration of each day (TDDD) represents the sum of all longest SD-induced depressions calculated from the channel with the longest depression duration for every spreading depression. The median TDDD correlated with the median number of SD (Spearman‘s ρ = 0.93; p < .0001). (c) Total number of spreading depression per patient which represent a fraction of the total number of SD. (d) Total number of isoelectric SD per patient which represent a fraction of the total number of SD. (e) The day with the highest number of SD (day of peak number of SD) was determined for each patient with SDs (n = 50). This was most frequently the first (24 to 48 h) or second (48 to 72 h) day after stroke. (f) Similarly, the peak day of TDDD (PTDDD) was determined for each patient with SD (n = 50) as the day with the longest TDDD. The day of peak number of SD correlated with the PTDDD (Spearman‘s ρ = −0.73; p < .0001).
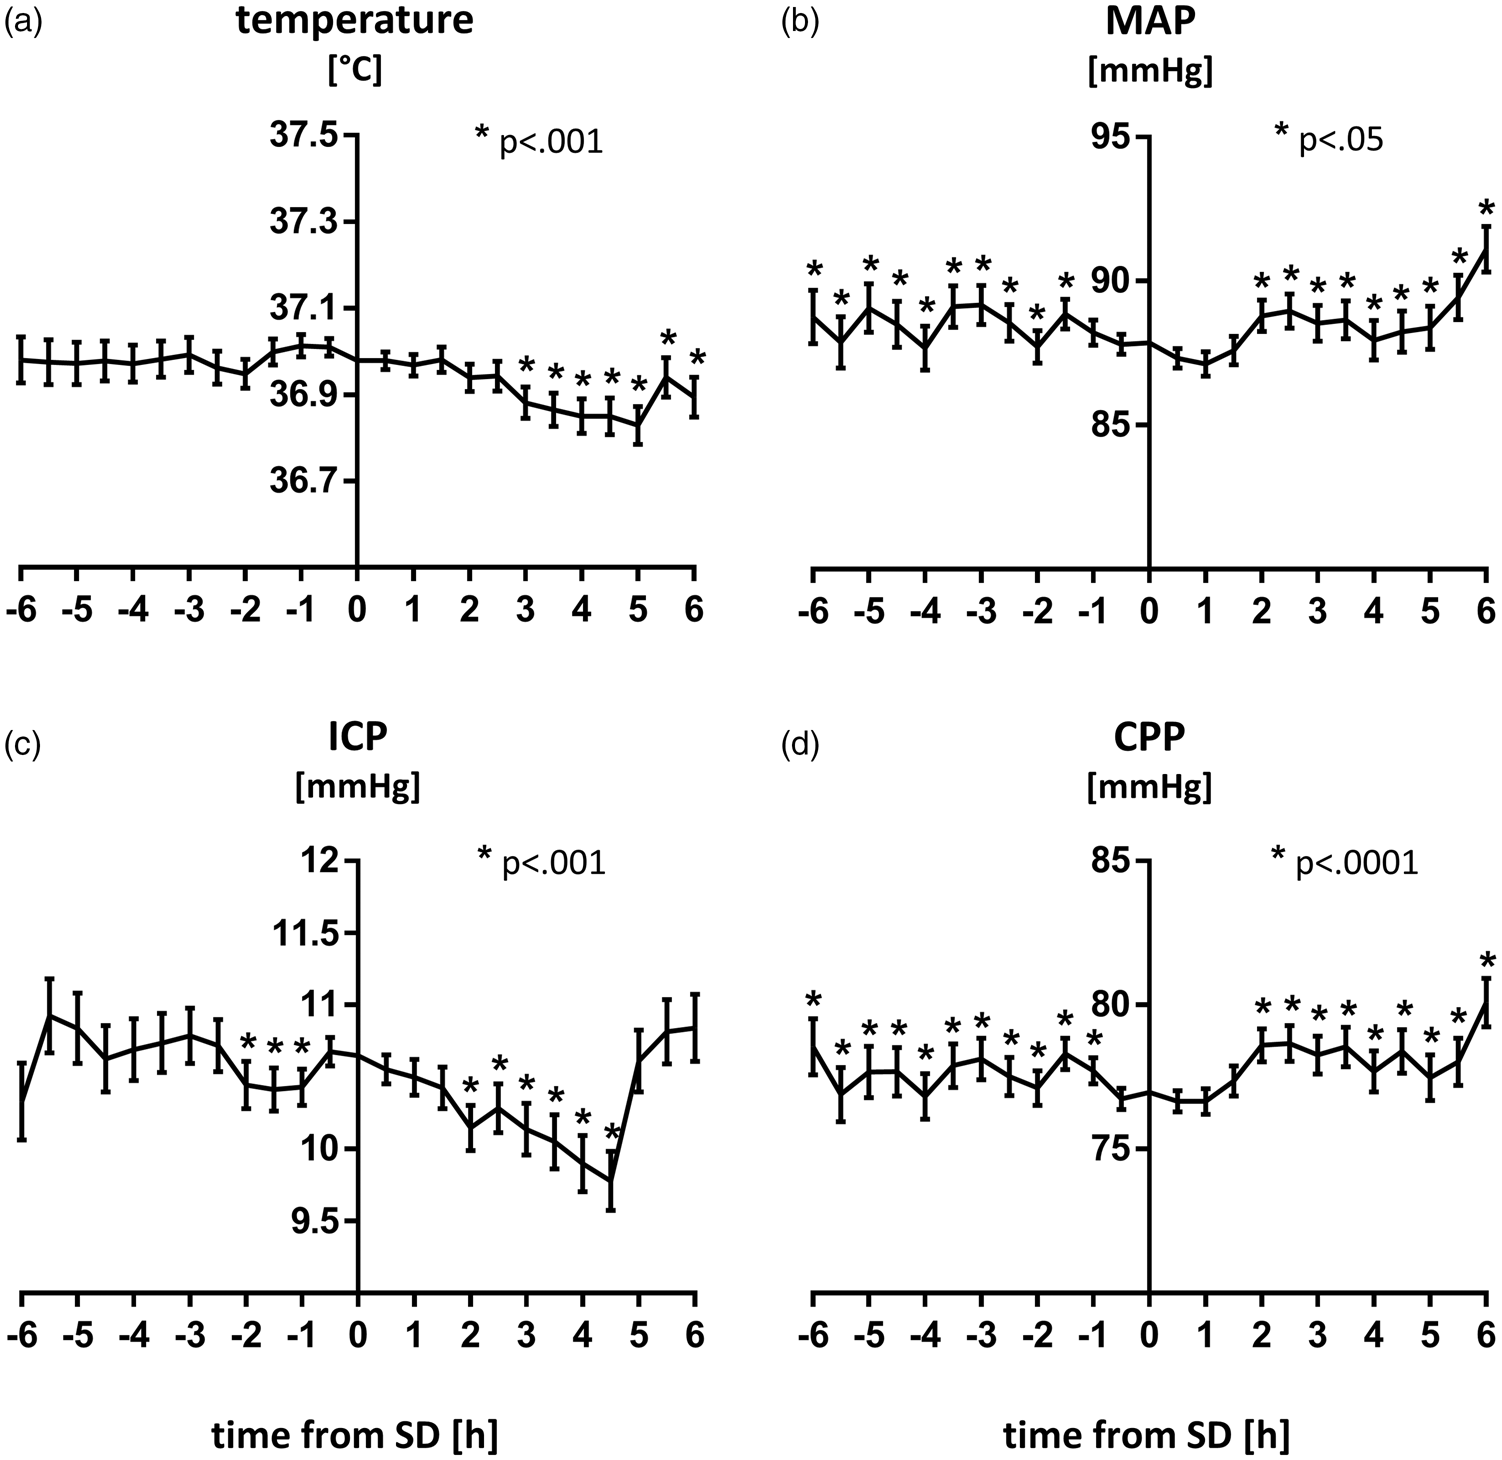
Time course of physiologic variables around the event of SD. Levels of temperature, MAP, ICP and CPP are plotted as mean ± SEM for a time frame of 6 h before and after all 1692 SDs. Linear mixed models with random intercepts were calculated. Time points were defined as fixed effect while patients and SD were considered random effects. (a) Temperature levels did not show any clear pattern before SD but were lower 3 to 6 h after (p<.001). (b) MAP was significantly higher before and after SD dropping 1.5 h before the event of SD [(−1.043 (−0.181, −1.905) mmHg; p=.02]. (c) ICP values started rising one hour before SD [+0.535 (+0.788, +0.282) mmHg; p<.0001] and fell again thereafter. (d) CPP levels were significantly higher before and after SD dropping one hour before SD [−1.040 (−0.109, −1.972) mmHg; p=.03].
Animal experiments
Animal experiments were approved by the Committee of Health and Sciences of Berlin (Landesamt für Gesundheit und Soziales (LAGeSo), Berlin, G0156/15) and performed according to the National Animal Welfare Act (Tierschutzgesetz der Bundesrepublik Deutschland) and the Charité Animal Welfare Guidelines. All mice were kept and treated according to the Guide for the Care and Use of Animals (National Research Council) 42 and the EU Directive 2010/63/EU ‘on the protection of animals used for scientific purposes’. The reporting of animal experiments complies with the Animal Research: Reporting of In Vivo Experiments (ARRIVE) Guidelines. 43
Experimental subjects and study design
Male C57BL6/J mice (n = 50, Charles River Laboratories) with an age of 12–15 weeks and a weight of 28–33 g were used. Mice were kept in an enriched environment and had free access to food and water. In all animals, the experimental procedure (Supplementary Figure 1) started with induction of an ischemic stroke by complete and permanent electrocoagulation of the left distal MCA via a cranial window in the parietal bone (see Supplementary material for technical details of dMCAo). After 24 h, the ischemic lesion was visualized in the MRI (see Supplementary material for technical details), followed by a 3-hour-recording of SD and rCBF. The experimental protocol was conducted in six different study groups, to which the animals were randomly assigned. In group 1, spontaneous occurrence of cortical SD after dMCAo was observed during the electrophysiological recordings (n = 10). In group 2, SDs were additionally triggered by repetitive cortical application of KCl (1 M) (n = 10). In two further groups, SDs were triggered in the same way as in group 2, while animals were kept under either systemic hyperthermia (group 3, target core temperature: 39.5 °C, n = 10) or hypothermia (group 4, target core temperature: 34.0 °C, n = 10). In the last two groups, SDs were triggered by KCl under either systemic hypertension (group 5, target MAP: 120 mmHg, n = 5) or hypotension (group 6, target MAP: 60 mmHg, n = 5). Core temperature was measured and strictly maintained at the desired target level for all groups. Blood pressure was measured and recorded in animals of group 1 for baseline reference and in both blood pressure treatment groups. In groups 1–4, a second MRI was performed 48 h after stroke induction to evaluate lesion progression under the influence of SD. Housing of the animals, order and specifics of the procedures and the person conducting the procedures were the same for all animals to avoid confounders. During the experiment, mice were monitored and their well-being assessed several times a day and humane endpoints were defined according to the Bederson score.
Experimental SD and perfusion monitoring
Twenty-four hours after stroke onset, animals were anesthetized with inhalational isoflurane (2–3% induction dose, <1% maintenance dose), breathing spontaneously throughout the experiment. The skull was exposed from Bregma to Lambda and 2 mm burr holes were drilled at two sites above the left hemisphere with a microdrill under saline cooling leaving the dura intact. The first burr hole was drilled 2 mm lateral and anterior of the Bregma and used for application of KCl during the recordings. The second burr hole was used for ECoG recording and drilled above the left parietal cortex and the ischemic penumbra, as determined by LSI. In animals that received blood pressure recording and/or vasopressor application/phlebotomy, a flushable catheter (MLT0699 Disposable BP Transducer, ADinstruments, New Zealand) was placed into the right femoral artery. Animals were then positioned in a stereotactic frame. Temperature was measured rectally and maintained with a feedback-controlled heating mat. Anesthesia was adjusted according to the respiratory rate measured by a pressure sensor (ADinstruments, New Zealand) on the animal’s chest. For the recording of the DC/AC-ECoG, an Ag/AgCl glass microelectrode with a tip diameter of 3 µm diameter was inserted into the parietal cortex at a depth of 200 µm. An Ag/AgCl reference electrode was inserted under the nuchal skin. The signal was amplified (FE 231 Bridge Amplifier) and digitized at 100 Hz (16/35 PowerLab). Data was sampled continuously at 5 Hz (LabChart Version 8) (all ADinstruments, New Zealand). To monitor cortical hemodynamics during SD, changes in rCBF were visualized and recorded with LSI.44,45 The device (Full-Field Laser Perfusion Imager (FLPI), moor instruments, UK) was positioned above the animal to monitor rCBF in both hemispheres. Settings for data acquisition were adjusted for high temporal and low spatial resolution (25 Hz sampling rate). Regions of Interest (ROIs) of 0.36 mm2 were positioned above the ischemic core, the penumbral zone adjacent to the insertion of the microelectrode and above the contralateral hemisphere under avoidance of large surface vessels.
Experimental protocols
Animals from group 1 were recorded for three hours under normothermic and normotensive conditions without further intervention (Supplementary Figure 1). In groups 2-6, SDs were induced after 15 minutes baseline recording by application of a cotton ball (1×1 mm) soaked with 1 M KCl to the frontal burr hole. The cotton ball was removed after five minutes and the procedure was repeated every 15–20 minutes, ten times in total for each animal. Depending on the investigated parameter, core temperature was increased (group 3) or reduced (group 4) directly before the beginning of the measurement by adjusting the target value of the heating mat. Systemic hypertension (group 5) was induced by continuous, intraarterial application of phenylepinephrin (2 mg/ml, 0.5–2 ml/h) during the measurement. Systemic hypotension (group 6) was induced by phlebotomy of 0.4 to 0.6 ml blood before the measurement. After three hours of recordings, wounds were sutured and the animals (group 1–4) were allowed to wake up under close observation. Animals of group 1–4 were submitted to a second MRI 48 h after stroke induction. At the end of the experiments, animals were killed by decapitation after anesthesia with intraperitoneal injection of ketamine (80 mg kg−1) and xylazine (16 mg kg−1).
Experimental data analysis and statistics
ECoG-recordings were analyzed manually with LabChart (v8, ADInstruments, New Zealand). Duration (in minutes) and amplitude (in mV) of SD were calculated from the DC shifts. The depression time was assessed using the AC-ECoG (bandpass: 0.5-45 Hz) following the COSBID guidelines. 39 To characterize the hemodynamic responses, changes of rCBF in response to SD in the penumbral zone were analyzed. rCBF levels were assessed at baseline before SD, at the lowest level of hypoperfusion and at the peak of hyperperfusion. The durations of hypo- and hyperaemic phases were defined as the time with any flux levels continuously below or above baseline, respectively. To assess stroke progression based on MR imaging, T2-weighted lesion volumes were measured and edema-corrected according to a standardized protocol to account for ischemic swelling. 46 Data analysis was done in a blinded fashion. No exclusions of animals or data were made during the analysis. Before statistical analysis, all data was tested for normal distribution using the Shapiro-Wilk test. The level of significance was set at p < 0.05 (two-sided). Statistical analysis and plotting were done with Prism (v6, GraphPad software, San Diego, CA, USA).
Data availability
The data that support the findings of this study are available from the corresponding author upon reasonable request.
Results
SD occurrence in malignant hemispheric stroke
In the prospective observational study, we focused on the relationship between physiological variables and SDs in patients suffering severe ischemic stroke. SDs were detected in 50 out of 60 patients, corresponding to a total number of 1692 SDs. The incidence of SD was clearly time dependent with a peak median number of SDs on the first day (12.6 SDs/patient/recording day) and a decreasing number of SDs thereafter (Spearman’s ρ = −0.90; p < .0001). Accordingly, the total depression time per day (TDDD) was longest on day 1 post-ictus (140 min/patient/recording day) and correlated with the number of SDs per day (Spearman’s ρ = 0.93; p < .0001) (Figure 1). Baseline characteristics of the study population and further descriptive neuromonitoring statistics are listed in Table 1.
Summary of study population.
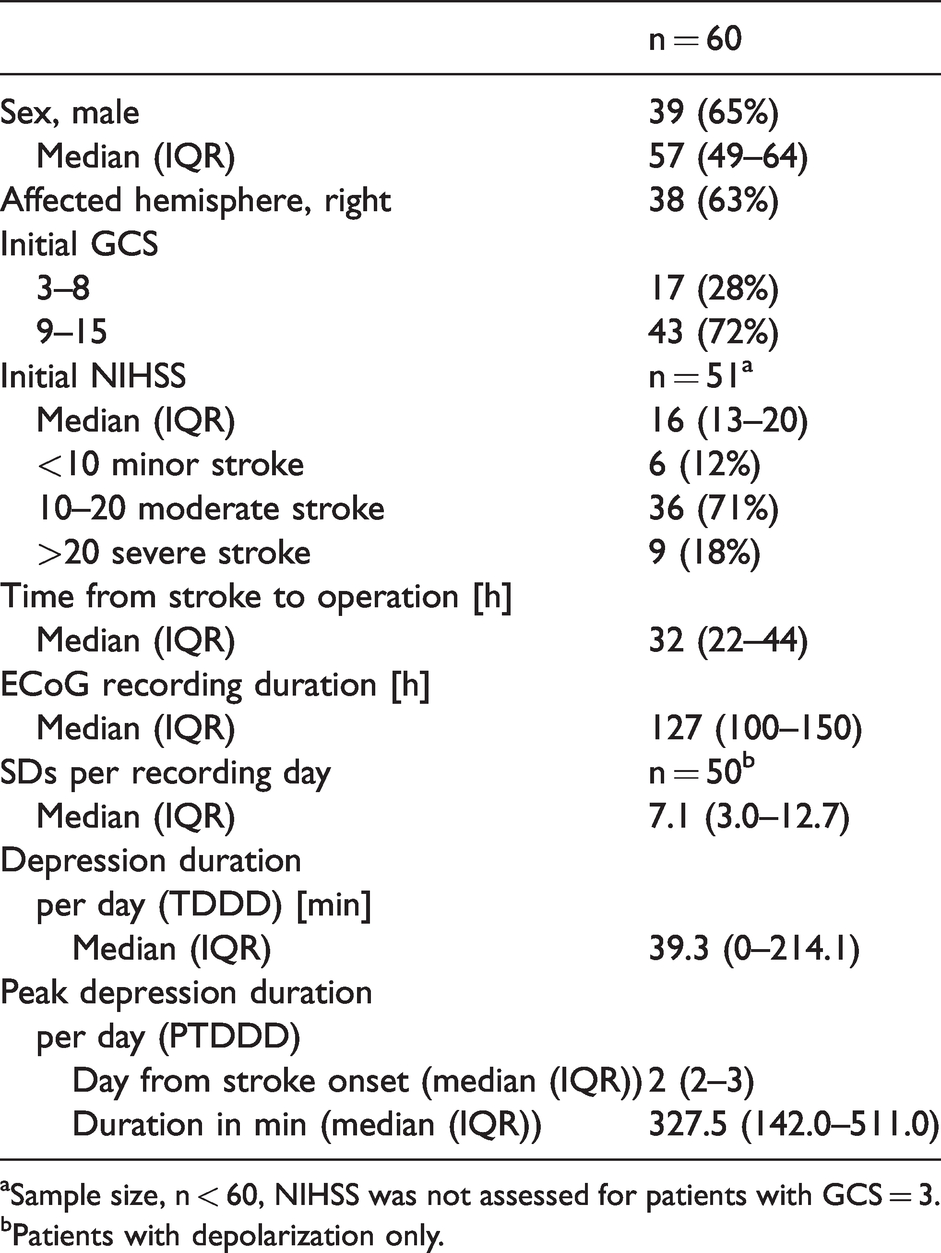
aSample size, n < 60, NIHSS was not assessed for patients with GCS = 3.
bPatients with depolarization only.
Physiological variables and SD
To detect whether physiological variables had an influence on the occurrence of SD, we compared median values of temperature, MAP, ICP and CPP in time periods with and without SD in all patients with SDs (n = 50). MAP and CPP were both significantly lower during SD than during the remainder of the recording period (MAP: −1.357 (−4.441, 1.724) mmHg; p < .05; paired t-test) (CPP: (−1.871 (−4.807, 0.5274) mmHg; p < .01; Wilcoxon signed rank test). No differences were noted for ICP and temperature. To also examine the effect of physiological variables on the likelihood of SD occurrence, a descriptive analysis was performed for the 4 physiological parameters: SDs were pooled within all patients to characterize the effect of more extreme shifts of physiological values (Supplementary Table 1). Accordingly, the number of SDs at low, moderate and high levels of the individual variables temperature, MAP, ICP and CPP throughout all patients (n = 1692 SDs) was divided by the total number of 0.5-hour values recorded within the respective range. Importantly, the likelihood of an SD occurrence did not relevantly differ between different levels of physiological variables. For a more distinctive analysis of this complex data set, we calculated hierarchical linear mixed models (level one SD, level two patients) with random intercept (see Supplementary material for statistical details). We determined whether there is a consistent trend in any physiological variable before and after the occurrence of SD and found significant but small effects for each variable (level of significance of the main effects: p < .01 for temperature, MAP and CPP; p < .0001 for ICP) (Figure 2). For MAP and CPP we found symmetry in the time course around SD with observed patterns being similar before and after SD. The time course of temperature and ICP did not show a symmetric pattern. Levels of temperature before an SD did not follow any clear pattern, while temperature fell to significantly lower levels 3 to 6 h after SD (median difference to the level during SD: −0.093 (95% CI: −0.145, −0.041) °C; p < .001). ICP started rising one hour before SD and remained elevated up until 2 h after the event. ICP levels before and after SD were significantly lower (−0.535 (−0.788, −0.282) mmHg; p < .0001). An inverse course was observed for the MAP that started dropping one hour before SD and only recovered two hours thereafter, being significantly higher before (+1.043 (+0.181, +1.905) mmHg; p = .02) and after SD (+1.016 (+0.198, +1.833) mmHg; p = .02). CPP showed symmetric patterns similar to MAP with a lowest point around SD and CPP levels higher both before (+1.040 (+0.109, +1.972) mmHg; p = .03) and after SD (+1.634 (+0.751, +2.517) mmHg; p < .001). There was no association between the depression duration and the four parameters of interest [temperature: 0.033 (0.022); MAP −0.002 (0.022); ICP 0.043 (0.021); CPP −0.031 (0.023)] [regression coefficients (SE)].
SD occurrence and perfusion pattern in the late phase of experimental stroke
Twenty-four hours after dMCAo, we observed spontaneous SDs in 4 of 10 animals of group 1 (37.0 ± 0.5 °C; 81.1 ± 1.1 mmHg) at a rate of 0.5 ± 0.4 SD/h. Stimulation of SDs with KCl was then used in the other groups to reduce the total number of animals required for the experiments. In all groups, stimulation with KCl effectively increased the number of SDs (p < .0001; ANOVA). Features of SD were neither modified by hyperthermia (group 3: 39.5 ± 0.5 °C) nor hypothermia (group 4: 34.0 ± 0.5 °C) and the amplitude was not modified by changes in blood pressure, either. Yet, SDs in hypotensive animals (group 6: 37.0 ± 0.5 °C; 62.1 ± 10.2 mmHg) were significantly prolonged compared to SDs in hypertensive animals (group 5: 37.0 ± 0.5 °C; 131.5 ± 10.1 mmHg) (Figure 3).
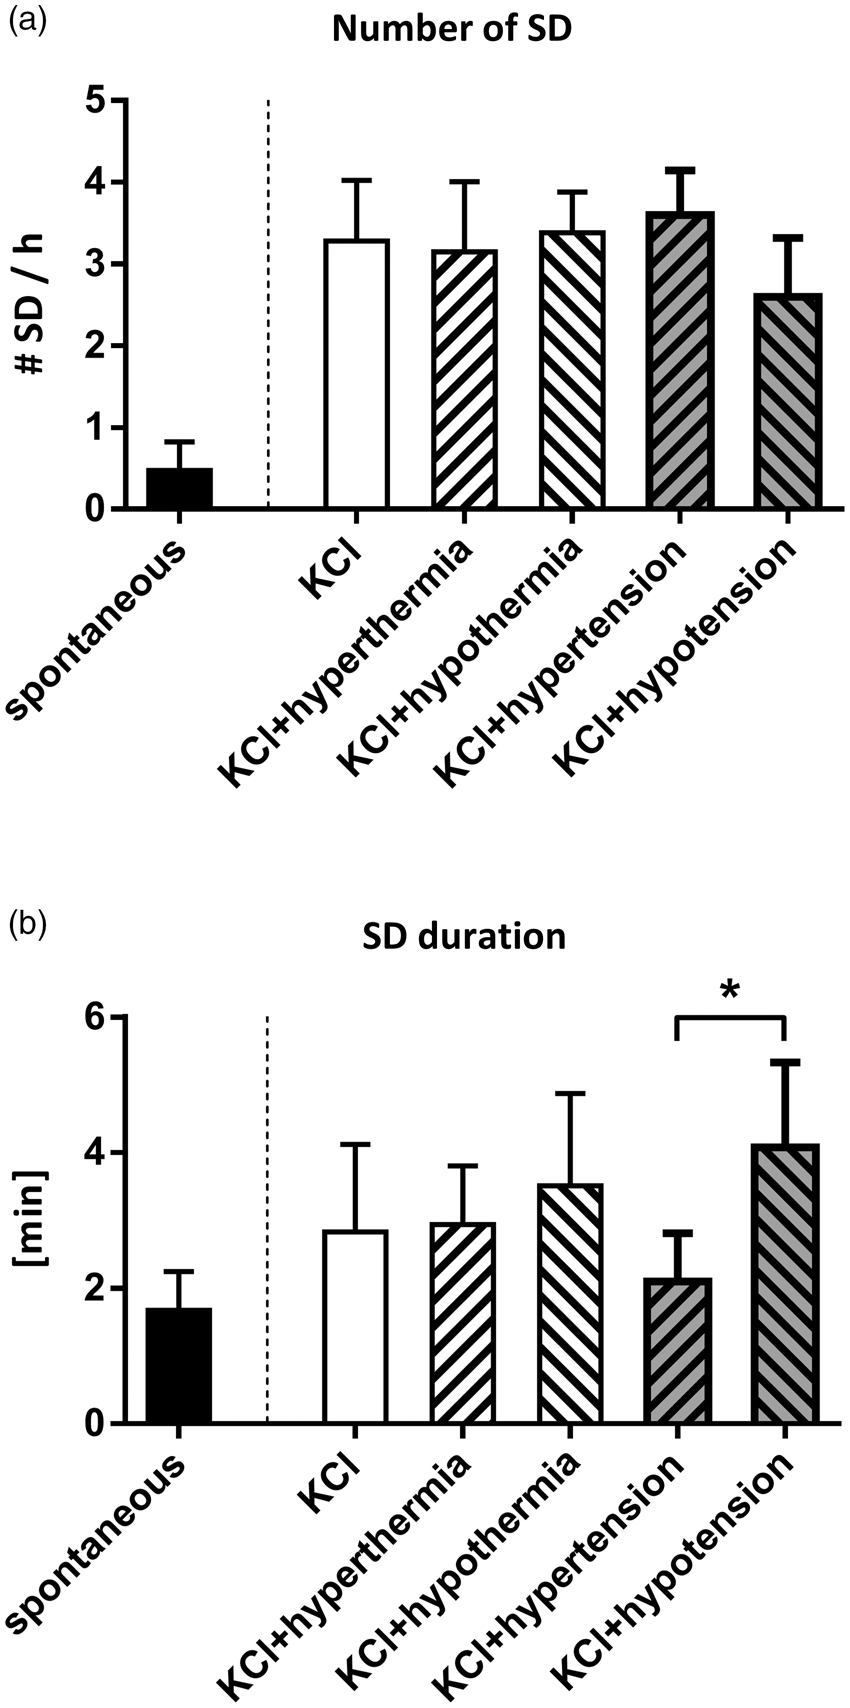
Number (a) and duration (b) of spontaneous and elicited SD under different temperature and blood pressure conditions. (a) We observed spontaneous SD in the late phase after stroke at a rate of 0.5 ± 0.4 SD/h. The number was significantly increased by application of KCl on the brain surface (3.3 ± 0.7 SD/h). Neither core temperature nor blood pressure further influenced this rate. (b) SD duration was not significantly different between spontaneous and elicited SD, but it was prolonged under hypotension compared to hypertension (mean difference +2.0 min; ANOVA; p<.05).
To determine if core temperature and blood pressure influence the hemodynamic responses to SD, 3 types of hemodynamic responses to SD were defined in a first descriptive approach, depending on whether rCBF decreased, increased or showed a biphasic course and the total number of hypoaemic, hyperaemic and biphasic responses were counted in all animals for each group. Overall, the majority of hemodynamic responses were biphasic, but the proportion of hypo- and hyperaemic responses differed between the groups (Figure 4(b)): Accordingly, elevated temperature was associated with a higher rate of hypoaemic responses, while cooling led to a higher rate of hyperaemic responses. Further, hypotension was related to a higher fraction of hypoaemic responses and hypertension was more often associated with hyperaemic responses. In a next step, we analyzed the course of rCBF during SD in more detail (Figure 5(b)) and found that the SD-induced hyperperfusion was brief [3.2 (1.9, 4.4) min] and with low amplitude [13.8 (11.4, 18.9) %Δ rCBF] when SDs occurred under hyperthermia, while cooling led to a significantly longer hyperperfusion [6.0 (4.1; 8.3) min; p < .05; Kruskal-Wallis] (Figure 5(c)). Also, stimulation of SDs under hypertension was associated with a significantly shorter and less pronounced initial hypoperfusion [0.6 (0.3, 0.9) min; −7.5 (−17.6, −4.4) %Δ rCBF; p < .01; ANOVA] (Figure 5(d)).
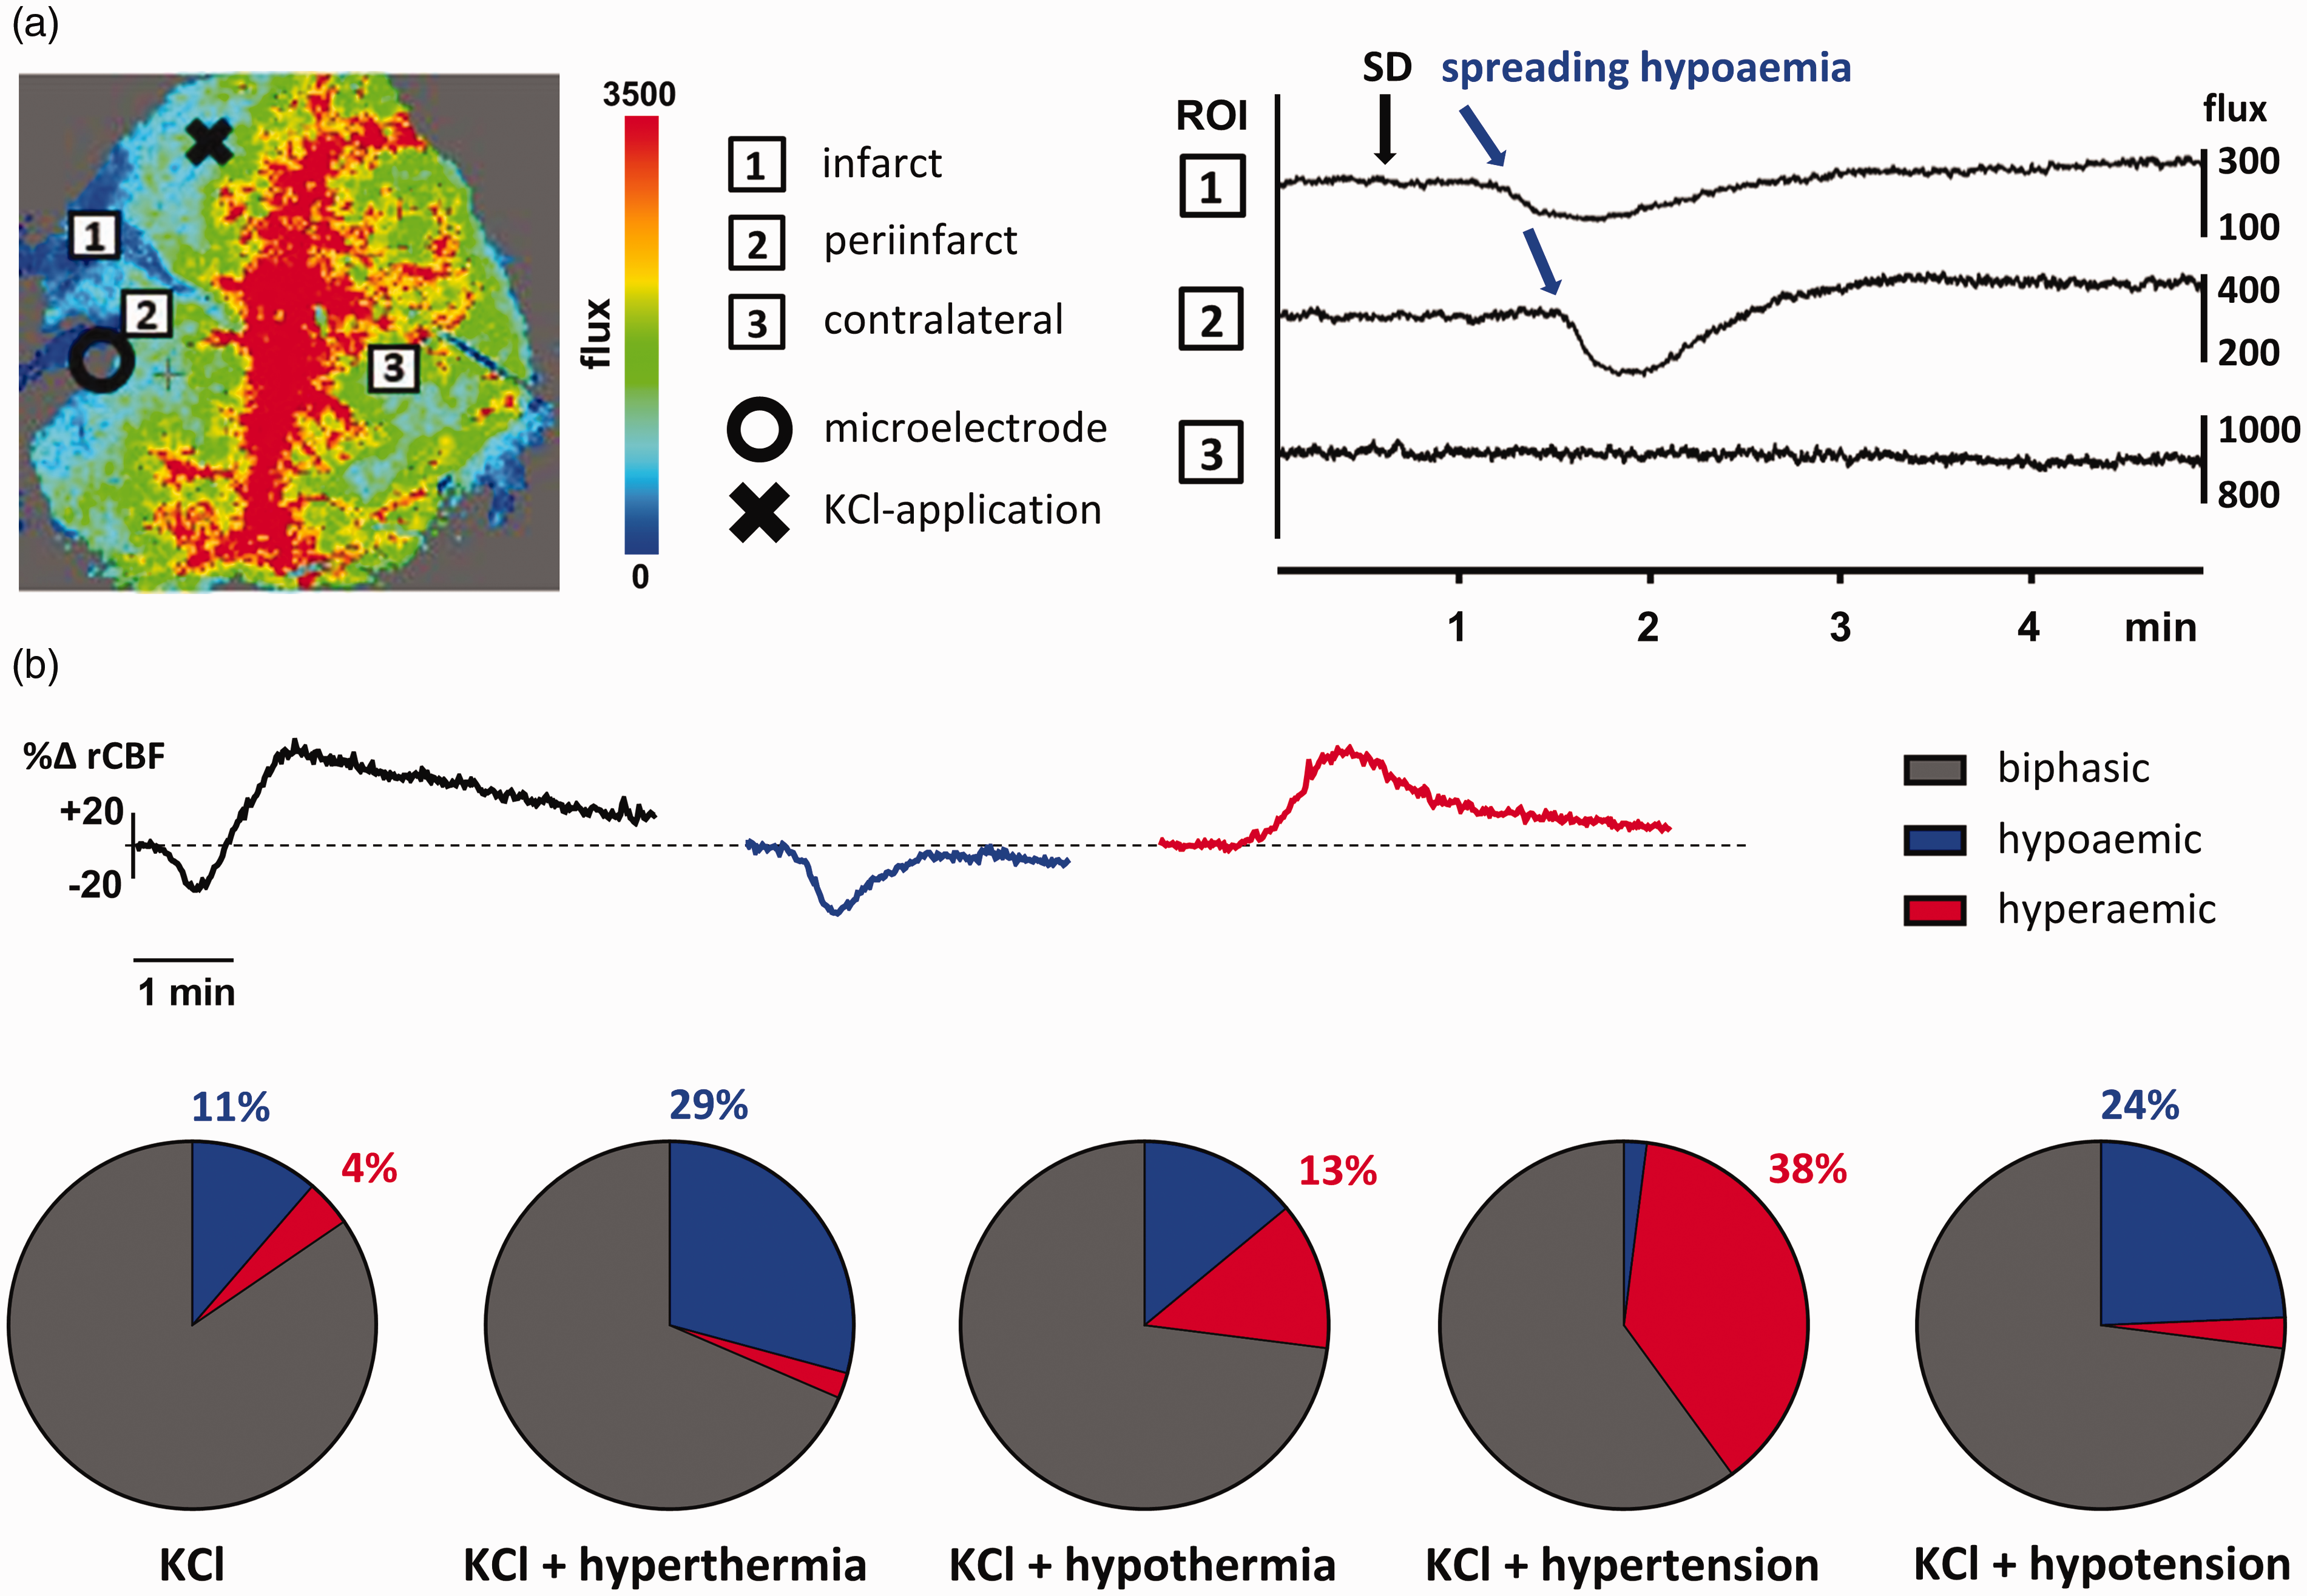
Hemodynamic responses to stimulated SD. (a) rCBF is measured through the intact skull and displayed as relative flux with LSI technique. Infarct core shows zero to reduced flux (ROI 1), surrounded by the penumbra (ROI 2) with reduced flux. The contralateral hemisphere (ROI 3) served as a reference. The rCBF was recorded continuously over time. Typical neurovascular responses to SD can be observed as a spreading hypoaemia that begins close to the infarct core as a slight decrease in rCBF with concentric spread through the penumbra and limited to the ipsilateral hemisphere. (b) Changes of rCBF during elicited SD were analyzed in the penumbra (ROI 2). Hemodynamic responses to SD were categorized as biphasic, hypoaemic or hyperaemic. Each circle displays the total number of SDs of all mice in the respective group (control: 97, hyperthermia: 89, hypothermia: 100, hypertension: 50, hypotension: 37) with subdivision into the respective types of response. Animals under hyperthermia had more events of hypoaemic response to KCl-stimulated SD (29%) than normothermic control animals, while hypothermia was related to more hyperaemic responses (13%). Changes in blood pressure resulted in more hyperaemic responses when increased (38%) and more hypoaemic responses when reduced (24%).
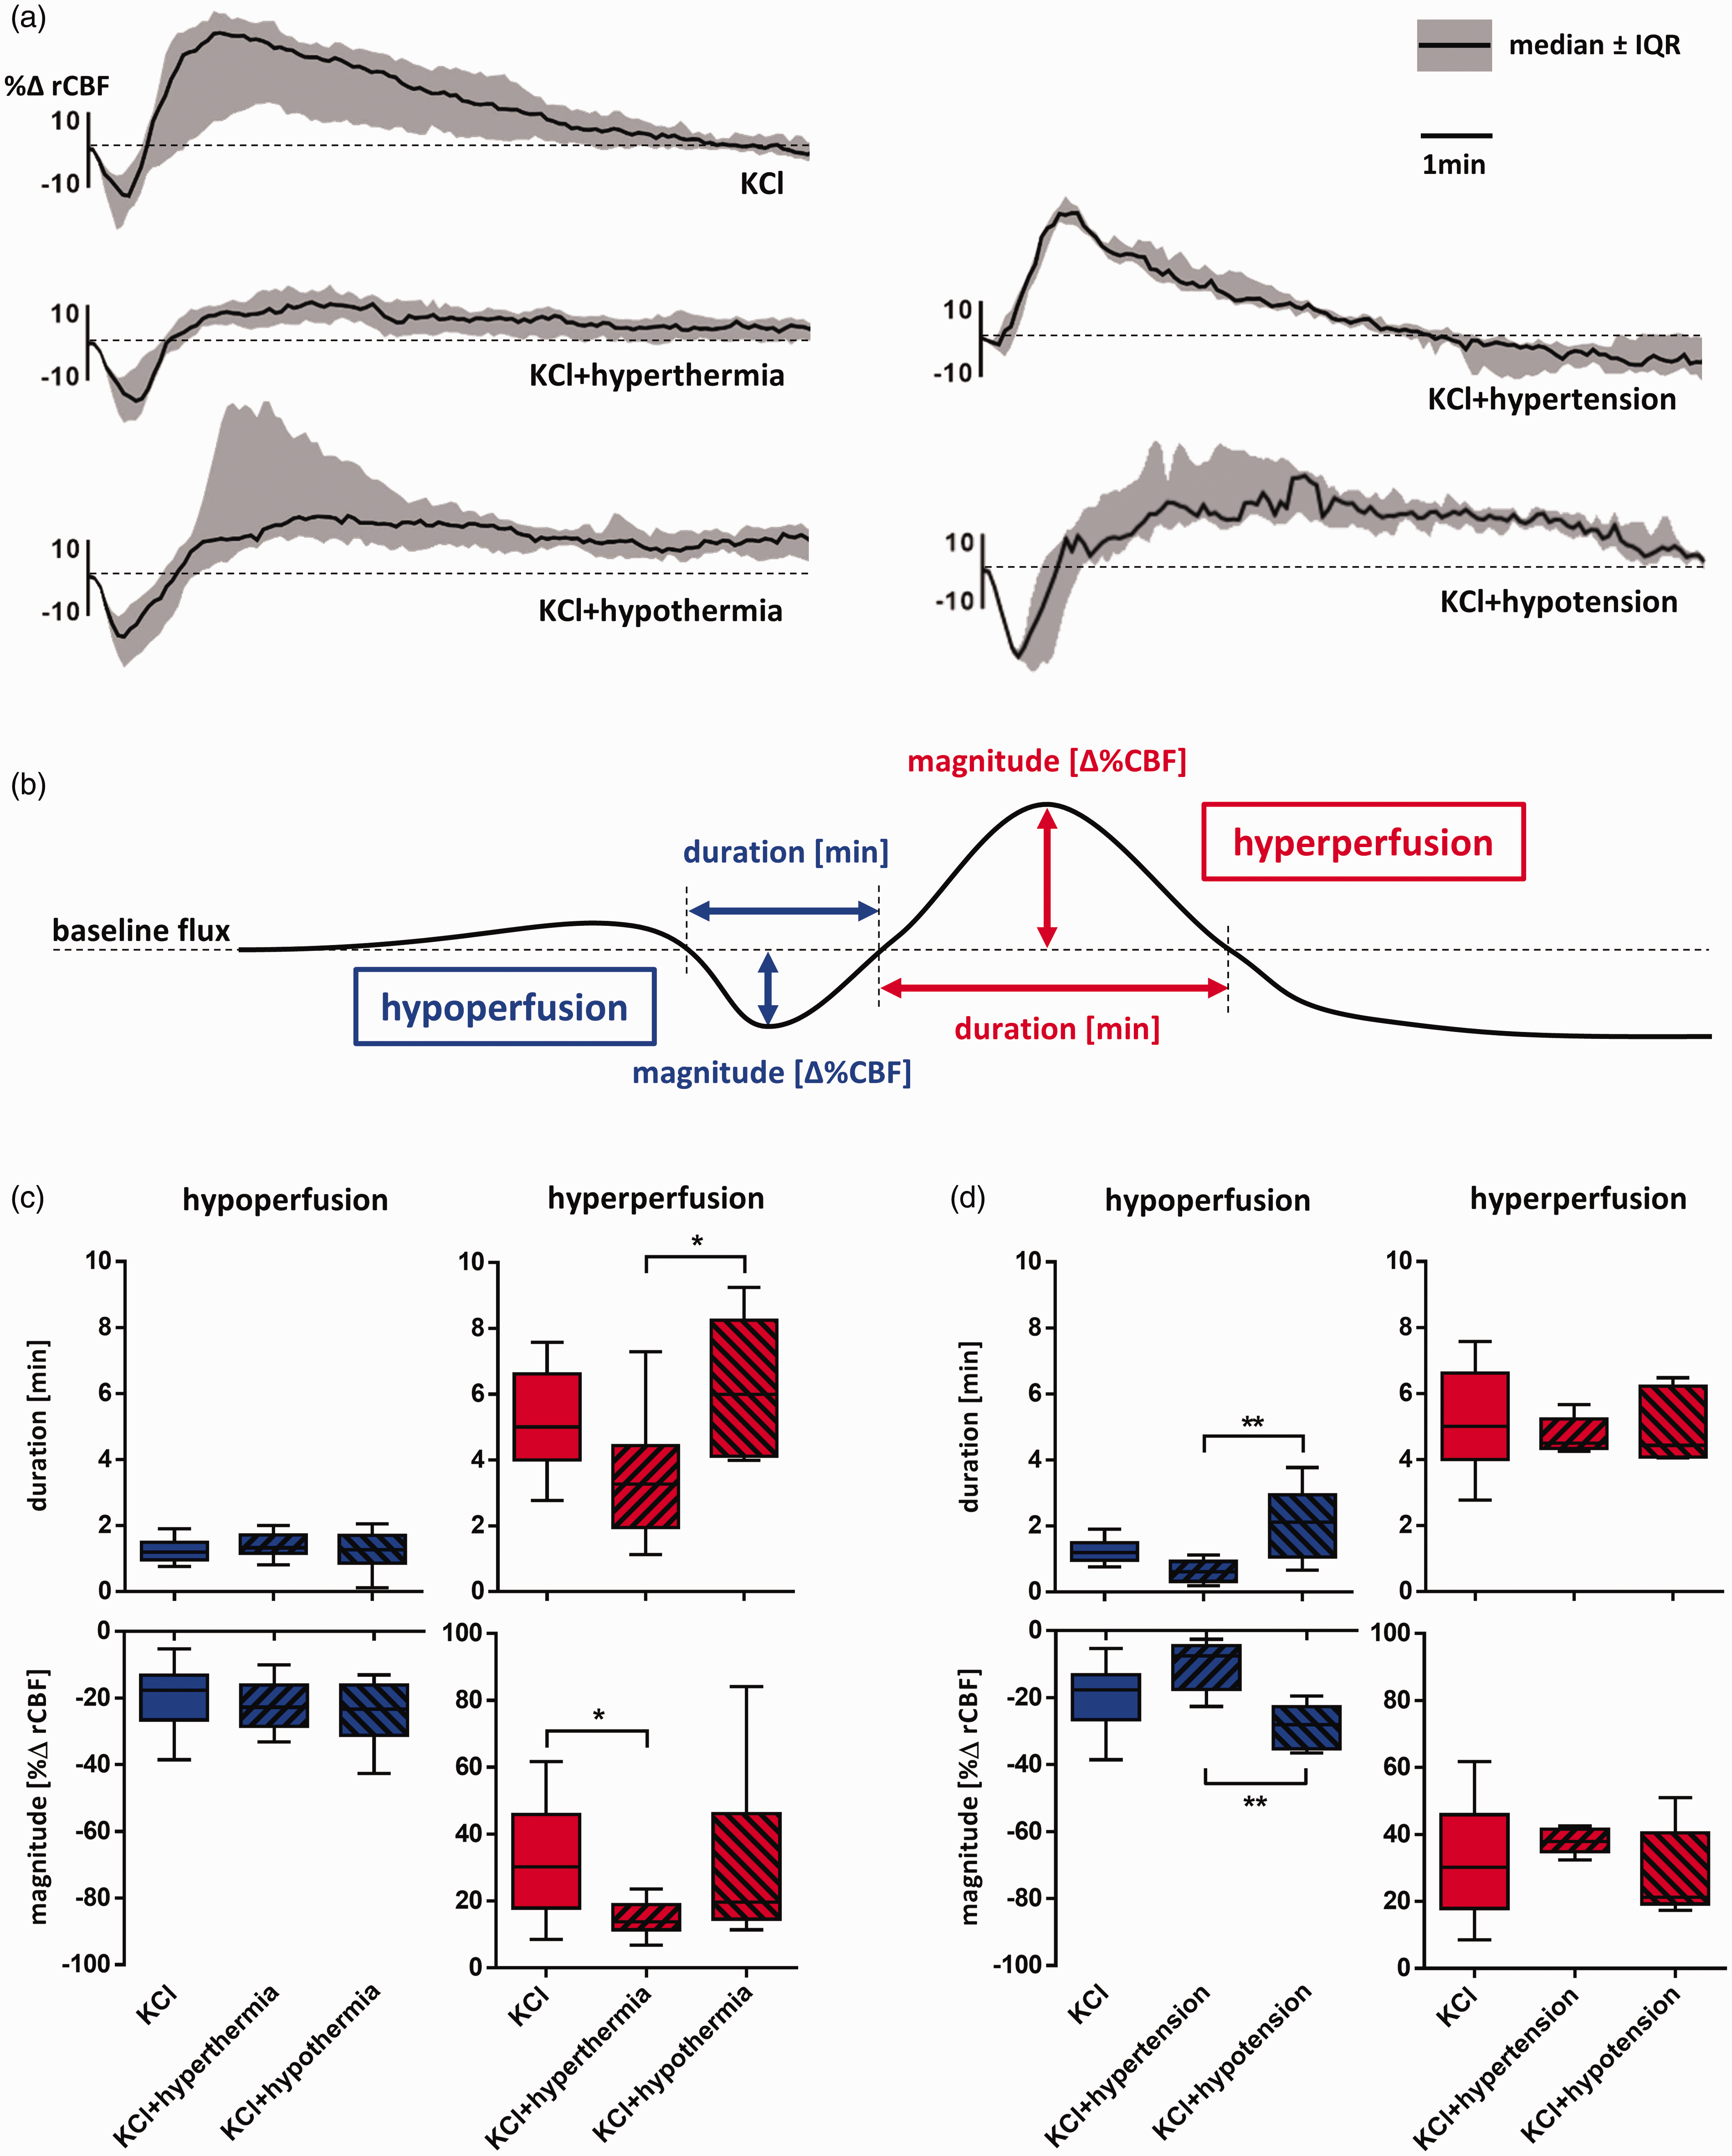
Changes of rCBF during stimulated SD under the influence of core temperature and blood pressure. (a) Relative changes in rCBF after every SD are displayed as median and IQR of all events per treatment group over a time period of ten minutes. (b) Levels of rCBF during hemodynamic responses to stimulated SD were assessed at the trough of hypoperfusion and the peak of hyperperfusion and displayed (c + d) as percent difference to baseline flux [%Δ rCBF]. The durations [min] of hypo- and hyperperfusion were defined as the time with any rCBF levels continuously below or above baseline respectively. (c) Differences in core temperature mainly influenced the hyperperfusion phase (red boxplots) while the initial hypoperfusion (blue boxplots) was overall short and mild. The hyperperfusion was shortest [3.2 (1.9, 4.4) min] and lowest [13.8 (11.4, 18.9) %Δ rCBF] under hyperthermia. Cooled animals had significantly longer hyperperfusion phases [6.0 (4.1; 8.3) min; p<.05; Kruskal-Wallis]. (d) Differences in blood pressure mainly affected the hypoperfusion phase, which was shortened [0.6 (0.3, 0.9) min] and attenuated [-7.5 (-17.6, -4.4) %Δ rCBF] under hypertension (p<.01; ANOVA).
To evaluate the influence of SDs on infarct progression in the late phase of ischemic stroke, edema-corrected lesion volumes at 24 h and 48 h after dMCAo were obtained from T2 MRI and compared within groups 1 − 4 (Figure 6). Forty-eight hours after stroke onset, lesion volumes were comparable to those at 24 h when only spontaneous SDs occurred (group 1: 9.9 vs 9.8 mm³; two-way ANOVA with Fisher’s LSD). In contrast, lesion volumes at 48 h were significantly larger when SDs were induced by KCl application 24 h after stroke onset (group 2: 15.9 vs 14.8 mm³; p < .01). In cases where SDs were induced under hypothermia, however, lesion volumes at 48 h were significantly smaller than at 24 h (group 4: 7.6 vs 8.5 mm³; p>.05) (Figure 6(b)). Interestingly, lesion evolution remained unaffected by SD induction under hyperthermia.
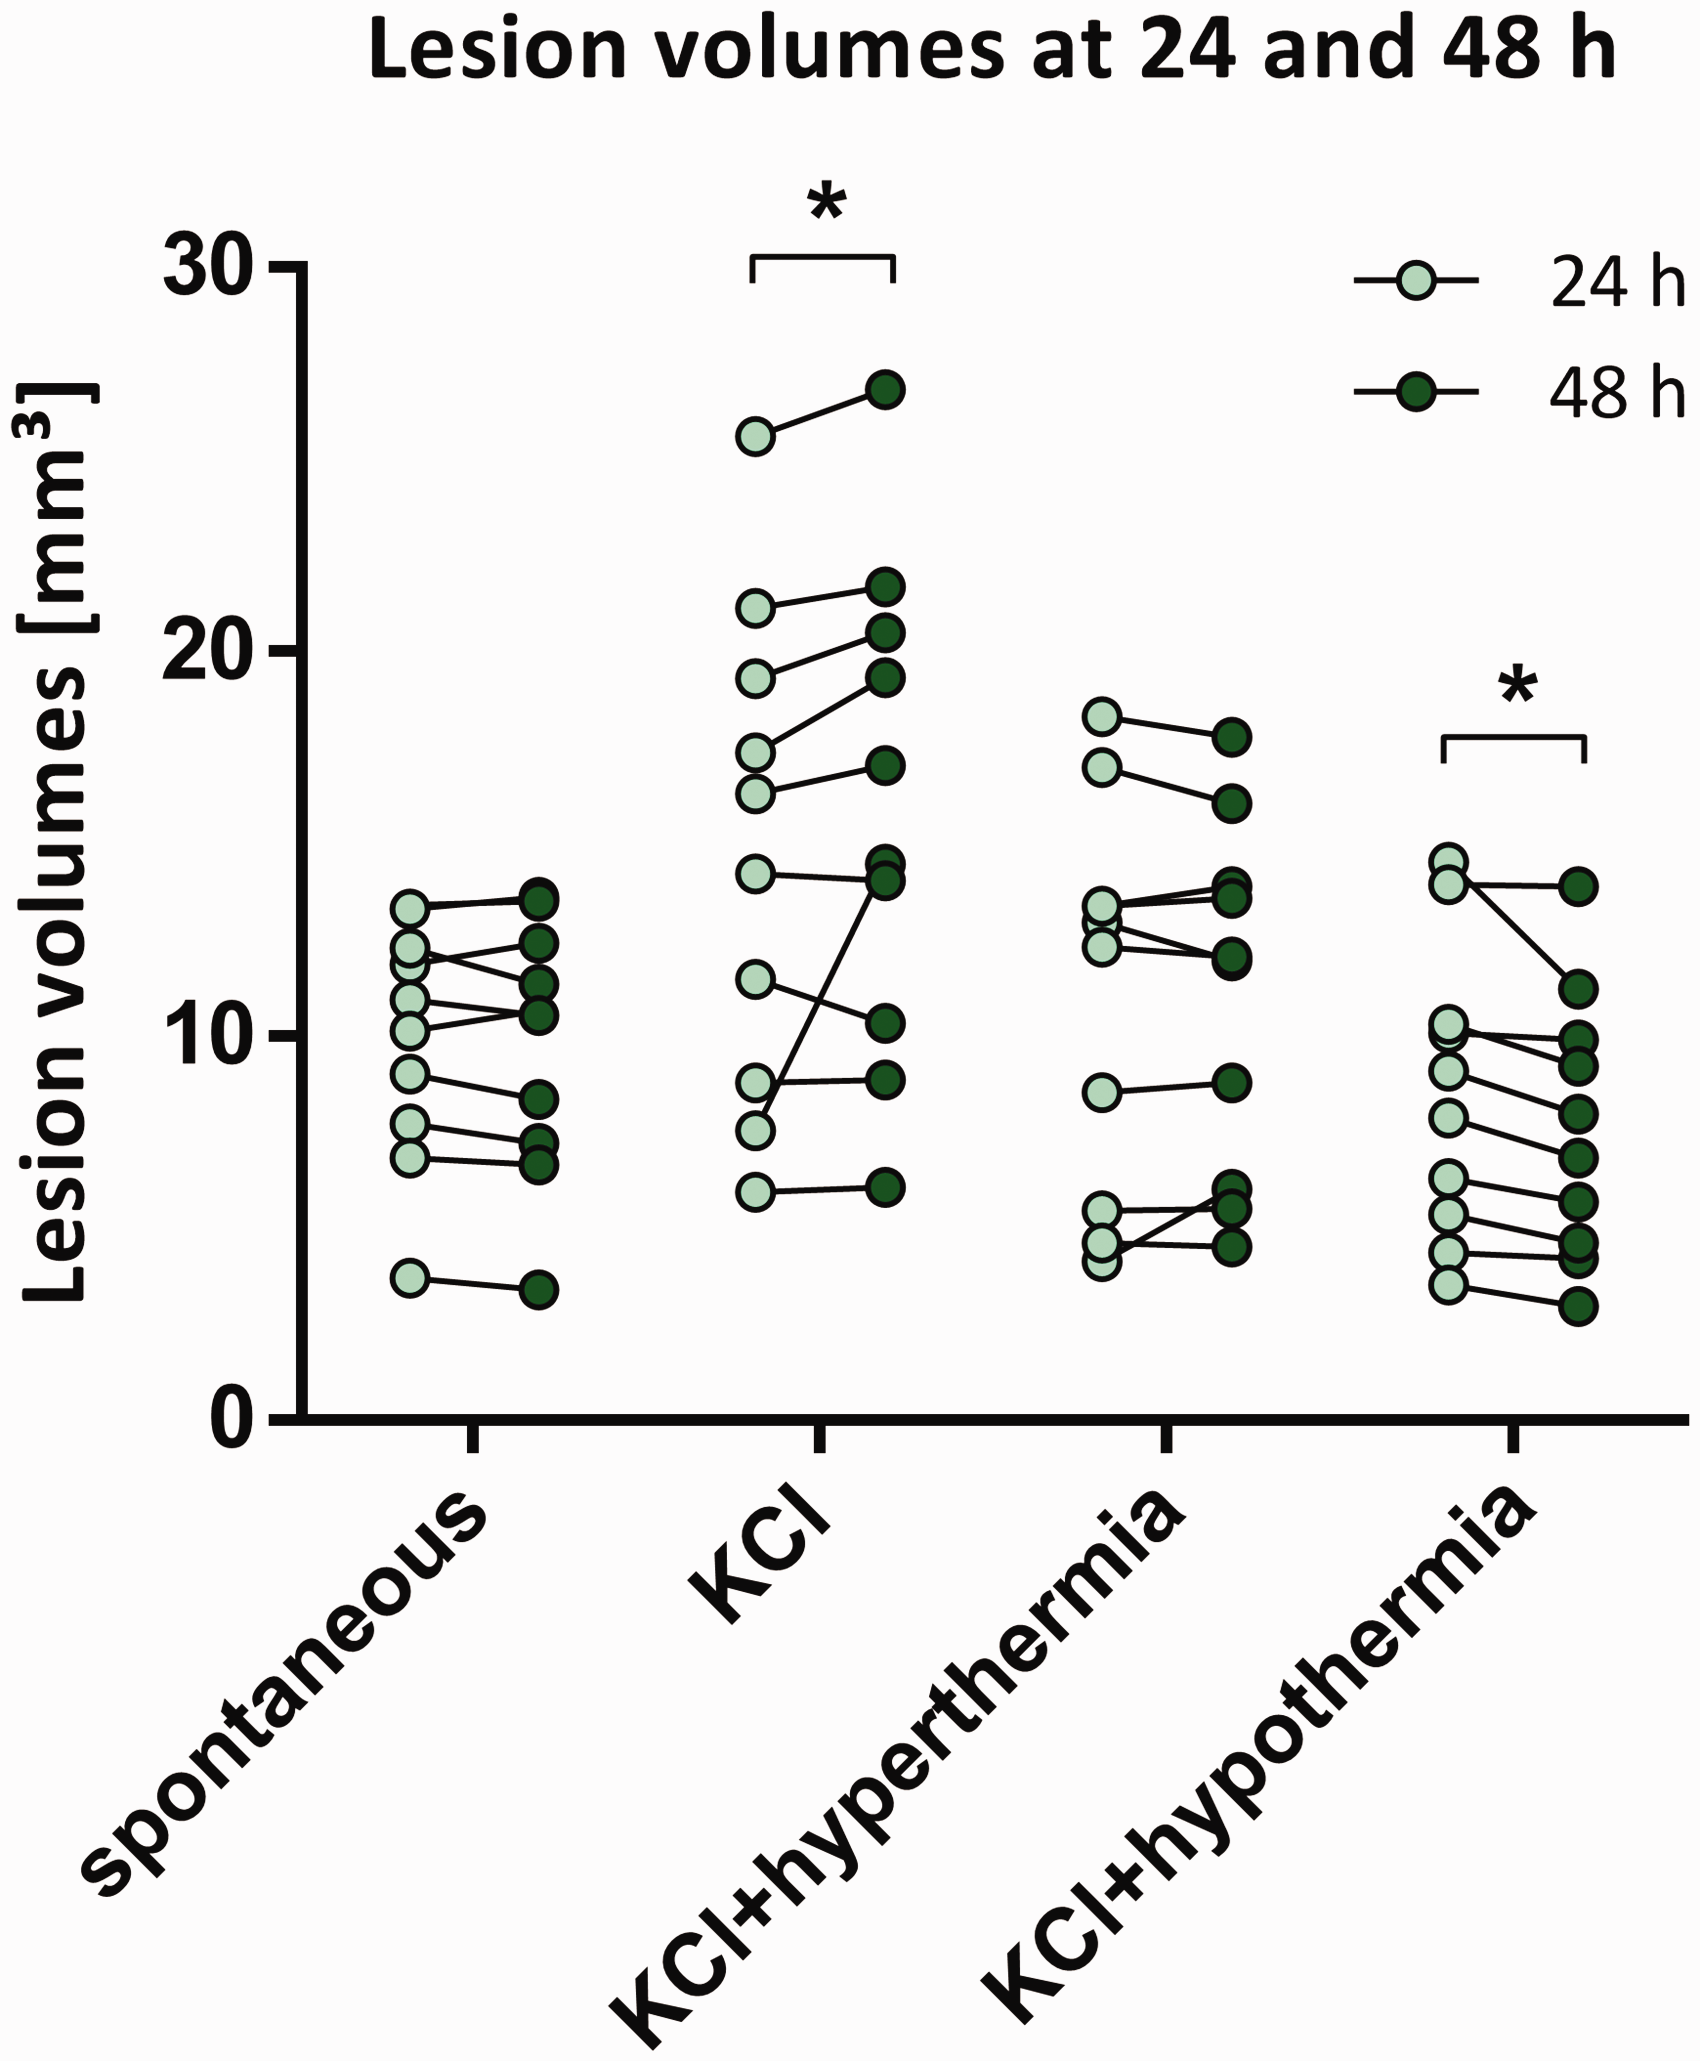
Volume changes in T2-MRI lesions after SD in the late phase of ischemic stroke. Edema-corrected lesion volumes at 24 and 48 h after stroke onset are shown for each animal of the 4 treatment groups. Lesion volumes increased significantly when SDs were induced by KCl (group 2: 15.9 vs 14.8 mm³; p<.01; Fisher’s LSD) and decreased when SD-induction was performed under hypothermia (group 4: 7.6 vs 8.5 mm³; p>.05; Fisher’s LSD).
Discussion
In this study, we found that SDs occur in 83% of MHS patients with a peak incidence in the first two days. Their incidence was similar to that observed in animals 24 h after ischemic stroke. Occurrence of SDs in humans was associated with a decrease in MAP and CPP and increase in ICP. Additionally, experimental data revealed that hypotension is related to inverse hemodynamic responses with pronounced hypoperfusion after elicited SD and therefore longer SD duration. While induction of SD was associated with lesion progression even in the late phase of ischemic stroke, hypothermia was able to reduce lesion volumes through hyperaemic blood flow responses to elicited SDs.
Physiological variables and SD in patients with severe ischemic stroke
In this study, we investigated the role of physiological variables in the context of SD in the late phase after ischemic stroke. In 60 MHS patients, occurrence of SD was evaluated in regard to temperature, MAP, ICP and CPP during the post-operative ICU stay. Overall, SDs were detected in 50 out of 60 MHS patients (83%) and this rate is similar to that previously reported by Dohmen and colleagues 10 (87.5%). In contrast to TBI- 37 and SAH-patients, 33 the incidence of SD in ischemic stroke patients decreased continuously beginning at day 2 and without another peak in the later phase. The major clinical finding of our study reflects the significant relationship between physiological variables and SDs in ischemic stroke patients. As this was the first exploratory analysis on this topic, our results represent a clinical proof-of-principle based on previous experimental studies with meaningful implications for further translational stroke research. 47 Levels of physiological variables followed a significant pattern around the event of SD. Specifically, SD occurrence was preceded by a decrease in MAP and CPP as well as increase in ICP and followed by a temperature drop. When looking at the pooled data there was no obvious effect of extreme shifts in physiological variables on the probability of SD occurrence. Moreover, the higher SD rate at low intracranial pressure levels was likely confounded by the unequal distribution of different ICP levels, since only 6.5% of all recorded ICP values were >20 mmHg and a disproportionate 62.2% were <12 mmHg. Also, most SDs occured shortly after surgery when critical increases of intracranial pressure are rare. Importantly, when comparing physiological variables during SD with all other values throughout the recording with consideration of individual patients (paired t-test or Wilcoxon signed rank test), SDs did not occur randomly and instead levels of MAP and CPP were significantly lower at time series with SDs. Overall, the absolute differences of physiological values during and before/after SD were small, considering the total possible range of the physiological parameters that we included in our analysis. Compared to a previous study in TBI-patients 37 that found similar correlations but with greater effect, our cohort of MHS patients was most likely in better clinical condition with physiological variables closer to the desired target area (Supplementary Figure 2). Additionally, blood pressure in our patients was continuously monitored and strictly maintained within the physiological range and therefore, our data does not allow conclusions on the effect of extreme shifts in physiological variables on SDs in patients with ischemic stroke. Importantly, however, the fact that the effects of systemic physiological variables were small in absolute terms does not only represent the good clinical status of our patients but indirectly underlines the great relevance of local factors in the patient's brain in the context of SD occurrence and its effect after ischemic stroke.8,48 An important local factor showing a strong influence both on the occurrence and the impact of SD is rCBF. In principle, hemodynamic responses to SDs can also be monitored in patients11,20,29 but unfortunately, such data was not available in our present cohort. To further characterize the pathophysiologic interactions between physiologic variables and SD in more detail, we therefore investigated hemodynamic responses to SDs in the context of physiological variables 24 h after dMCAo in mice.
Physiological variables and experimental SD
To further determine, whether the hemodynamic consequences of SD during the late phase of ischemic stroke are affected by alterations of physiological variables, hemodynamic responses to SD under the influence of temperature and blood pressure were additionally characterized in an experimental stroke model of delayed lesion maturation. In the late phase after experimental stroke, spontaneous SDs still occurred and interestingly, their rate of 0.5 ± 0.4 SD/h was comparable to that in MHS patients (0.7 ± 0.6/h 24 h after insult). The characteristics of SDs were consistent with other studies that investigated SDs after focal cerebral ischemia during earlier time windows26,27 and these characteristics did not relevantly change when SDs were stimulated by KCl. Core temperature was strictly maintained at physiological levels (37.0 ± 0.5 °C) in all normothermic groups and overall, MAP was highly stable throughout the recording and when not manipulated also similar to the MAP from the anaesthetized mouse that served as baseline reference for the hypertensive and hypotensive groups.
The main proportion of infarct maturation occurs within 24 h of experimental stroke and as expected, no lesion changes were observed in the late phase of ischemic stroke under spontaneous SD occurrence. 30 Interestingly, however, we were able to observe significant lesion growth in the late phase of dMCAo following repetitive SD stimulation with KCl, which falls in line with findings by Hartings et al., who showed that spontaneous SDs may occur up to 24 h after induction of focal cerebral ischemia in rats and that this can be associated with ongoing infarct maturation. 28 Importantly, our findings underline and suggest that infarct volume evolution can occur up to several days after ischemic stroke 31 and that this process can be modulated by KCl-induced SD.
Temperature and experimental SD
In contrast to previous experimental studies, 49 temperature changes were not associated with differences in the electrophysiological features of SDs. Number, duration and amplitude of elicited SDs were similar in normothermic, hyperthermic and hypothermic animals. In the analysis of rCBF in relation to core temperature, the hemodynamic responses to SD mainly followed the typical biphasic course observed in the mildly ischemic penumbra of the mouse species in all groups. 50 However, when SDs were elicited under hypothermia, they were significantly more often coupled to a hyperaemic blood flow response. Furthermore, the hyperaemic phase during SD was longer when core temperature was low. Interestingly, it has been shown that a pronounced hyperaemia following SD reduces tissue acidosis in the penumbra, thereby leading to more physiological pH-values. 51 Normalization of tissue pH in the penumbra could have a beneficial effect on lesion progression. 6 In the present study, we observed no T2-lesion growth in animals where SDs were triggered under hypothermia. This finding is in agreement with a previous experimental study on a beneficial effect of hypothermia on SDs after ischemic stroke 52 but in that study, the beneficial effect was attributed to the reduced number of spontaneous SDs with lower core temperature. In the present study, SDs were triggered by KCl, which led to significant stroke progression in group 2, and hypothermia was still able to prevent lesion progression after KCl-induced SD even 24 hours after ischemic stroke. Ultimately, it cannot be ruled out that reduction of vasogenic edema by hypothermia might at least be partially responsible for the lesion volume decrease but the risk of miscalculating T2 lesion volume was limited by performing calculations with edema-correction. 46 Despite this limitation, we believe that a pronounced hyperaemia in response to SD and its antagonistic effect on tissue acidosis could serve as a neuroprotective component of hypothermia in this context. Most importantly, our experimental finding that temperature affects the hemodynamic response to SD and delayed lesion evolution parallels our clinical findings of a significant association between temperature and the occurrence of SD, which suggests that temperature could play a more important role in the context of clinical SD than might be expected from the observation of small absolute temperature changes.
Blood pressure and experimental SD
Regarding blood pressure, changes in MAP had a significant influence on the duration of experimental SD. When elicited under hypotension, SDs lasted longer than under hypertension. This might be the result of the different hemodynamic responses to SD between hypo- and hypertensive animals. First, hypotension correlated with a higher number of hypoaemic responses to SD compared to normo- and hypertension. Second, the hypoperfusion phases in hypotensive animals were significantly longer and with greater amplitude than under hypertension. Such inverse hemodynamic responses under hypotension have already been reported from SD elicited in otherwise healthy rats. In other words, low MAP alone was sufficient to convert the physiological hyperaemic into hypoaemic blood flow responses to SD. 53 In the ischemic penumbra where local perfusion is already reduced and closely related to the systemic blood pressure because autoregulation is disturbed, 8 this results in an additionally reduced energy supply and slower restoration of the metabolic homeostasis, thus leading to a delayed electrical recovery of neurons, longer-lasting SDs and increased risk of injury.6,22,54 In contrast, when blood pressure was high, the hemodynamic responses were more often characterized by pronounced hyperaemia with the initial hypoperfusion phase being short and shallow. Under such conditions, the increased energy demand due to SD 19 is met by an adequate blood flow response and SDs become shorter-lasting. Therefore, the positive correlation between hemodynamic and electrophysiological responses is in agreement with the idea that rCBF is responsible for the restoration of equilibrium after SD and the survival of neuronal tissue.50,55
Taken together, our experimental findings complement our clinical observations by suggesting that low MAP and thus CPP are not only associated with the occurrence of SD but also aggravate their impact on peri-infarct tissue by inverse hemodynamic coupling. This supports the hypothesis that high CPP may reduce the number of spontaneous SDs and additionally prevent long-lasting SDs through the normalization of hemodynamic responses to SD. 56
The present study has several limitations. A general limitation to the experimental study is the repetitive KCl-stimulation of SD, which was done to reduce the number of required animals because spontaneous SD only rarely occurred 24 h after stroke. Additionally, the effect of physiologic variables on the occurrence of spontaneous SD cannot be evaluated as the number of SD was predetermined. Another limitation concerns the evaluation of lesion changes. Even though every dMCAo procedure was performed by the same person in a blinded fashion and animals were randomly assigned to the different study groups, the initial lesions at 24 hours were larger in group 2 than in the other groups. Also, our findings in the lissencephalic brain of mice cannot be directly translated to the gyrenecephalic brain of humans 57 and therefore, our experimental data should be regarded as an indicator to the mechanisms that might play a role in humans but still require further research in order to confirm these findings.
Conclusion
Our findings support the hypothesis that physiological variables influence SDs after ischemic stroke, which offers a possibility for neurointensivists to modulate SDs by adjusting physiological variables. Although absolute differences in physiological variables around the event of SDs in patients with MHS were small, their significant impact on hemodynamic responses to SDs during the late phase of experimental ischemic stroke cautions against underestimating their influence on clinical outcome. Recordings of rCBF and DC-signals in patients with MHS but also in other types of acute cerebral injury should help to clarify the role of the physiological variables in the clinical context of hemodynamic responses and SD duration in the future11,51 and most importantly, further insight into SDs, their hemodynamic responses and the contributing factors will help to better understand their roles in cellular death as well as tissue recovery and to identify the most promising targets for prevention of secondary lesion progression in acute cerebral injury.
Supplemental Material
sj-pdf-1-jcb-10.1177_0271678X211039628 - Supplemental material for Physiological variables in association with spreading depolarizations in the late phase of ischemic stroke
Supplemental material, sj-pdf-1-jcb-10.1177_0271678X211039628 for Physiological variables in association with spreading depolarizations in the late phase of ischemic stroke by Leonie Schumm, Coline L Lemale, Sebastian Major, Nils Hecht, Melina Nieminen-Kelhä, Anna Zdunczyk, Christina M Kowoll, Peter Martus, Christiane M Thiel, Jens P Dreier and Johannes Woitzik in Journal of Cerebral Blood Flow & Metabolism
Footnotes
Funding
The author(s) disclosed receipt of the following financial support for the research, authorship, and/or publication of this article: This work was supported by the Deutsche Forschungsgemeinschaft (DFG) grant no. DFG WO 1704/1-2, DFG DR 323/5-1, DFG DR 323/10-1 and ERA-NET NEURON (EBio2), with funds from BMBF (0101EW2004). Furthermore, Nils Hecht is Berlin Institute of Health (BIH) Clinical Fellow, funded by Stiftung Charité.
Acknowledgements
The authors would like to acknowledge all members of the COSBID study group who were involved in the implementation of the trial.
Declaration of conflicting interests
The author(s) declared no potential conflicts of interest with respect to the research, authorship, and/or publication of this article.
Authors’ contributions
Supplemental material
Supplemental material for this article is available online.
References
Supplementary Material
Please find the following supplemental material available below.
For Open Access articles published under a Creative Commons License, all supplemental material carries the same license as the article it is associated with.
For non-Open Access articles published, all supplemental material carries a non-exclusive license, and permission requests for re-use of supplemental material or any part of supplemental material shall be sent directly to the copyright owner as specified in the copyright notice associated with the article.