
Abstract
Spreading depolarizations (SD) are waves of abrupt, near-complete breakdown of neuronal transmembrane ion gradients, are the largest possible pathophysiologic disruption of viable cerebral gray matter, and are a crucial mechanism of lesion development. Spreading depolarizations are increasingly recorded during multimodal neuromonitoring in neurocritical care as a causal biomarker providing a diagnostic summary measure of metabolic failure and excitotoxic injury. Focal ischemia causes spreading depolarization within minutes. Further spreading depolarizations arise for hours to days due to energy supply-demand mismatch in viable tissue. Spreading depolarizations exacerbate neuronal injury through prolonged ionic breakdown and spreading depolarization-related hypoperfusion (spreading ischemia). Local duration of the depolarization indicates local tissue energy status and risk of injury. Regional electrocorticographic monitoring affords even remote detection of injury because spreading depolarizations propagate widely from ischemic or metabolically stressed zones; characteristic patterns, including temporal clusters of spreading depolarizations and persistent depression of spontaneous cortical activity, can be recognized and quantified. Here, we describe the experimental basis for interpreting these patterns and illustrate their translation to human disease. We further provide consensus recommendations for electrocorticographic methods to record, classify, and score spreading depolarizations and associated spreading depressions. These methods offer distinct advantages over other neuromonitoring modalities and allow for future refinement through less invasive and more automated approaches.
Keywords
Introduction
Spreading depolarization (SD) is the generic term for pathologic waves of abrupt, sustained mass depolarization that propagate at velocities of 1.7–9.2 mm/min in gray matter of the brain.1–4 It originates in neurons5,6 and is characterized by active propagation of an abrupt, near-complete breakdown of the neuronal transmembrane ion gradients, in contrast to the slow breakdown that can be observed in any cell of the body before death when there is severe energy deprivation.7–11 The concentration gradient of practically every investigated small molecule changes between cytoplasm and interstitial space during SD. These characteristic concentration changes are the largest observed in live tissue. 2 In addition, cell organelles such as mitochondria undergo marked alterations during SD.12,13
The other important pathological network event in the brain is the ictal epileptiform event (IEE). IEE is the pathophysiological correlate of convulsive and nonconvulsive epileptic seizures. As a rule of thumb, changes during SD are at least five times greater than those observed during IEE.14,15 Because the changes of SD are so large and diverse, numerous options exist to measure SD in the experimental setting. For example, SD can be detected via the abrupt extracellular concentration changes of glutamate, potassium, or sodium using microelectrodes in vivo or in brain slices,7,8,10,16–19 the large increase in intracellular calcium as measured with calcium imaging,20,21 the cellular swelling and dendritic beading as observed with two-photon microscopy,22–25 which is associated with shrinkage of the extracellular space,10,26–28 the local decrease in intracellular water mobility as imaged by diffusion-weighted magnetic resonance imaging (MRI)12,15,29–32 or the release of free energy from the tissue that is converted to heat (“free energy starving”).33,34 Moreover, SD involves astrocytes,5,6,35–37 provokes marked microvascular/hemodynamic responses,38–41 activates microglial cells and inflammasome formation and induces cytokine gene expression.42–44 Thereby, SD creates an interface of reciprocal interaction between the three super systems—nervous, vascular, and immune—whenever the brain is locally injured. 2 This interface reaches far beyond the actual zones of injury because of the spreading nature of SD. The wide array of immense changes involved in SD suggests that this phenomenon is among the most fundamental processes of brain pathology.
SD is the mechanism of both pannecrotic and selective neuronal lesion development in gray matter depleted or deprived of energy, as shown in diverse disease models and species. 45 In adequately supplied tissue, SD could be slightly injurious, 46 innocuous, 47 or even protective.48–53 This selectively harmful character and the notorious pharmacoresistance of SD in energy-depleted tissue complicate direct therapeutic targeting. However, SD monitoring in neurocritical care offers unprecedented opportunities for disease characterization and treatment stratification to tailor targeted treatments, following the concept of Precision (“individualized”) Medicine. 54 Particular advantages include that SD monitoring can be performed at the bedside, continuously, and in real time. 55 Therefore, it should allow for targeted treatment to begin earlier than with diagnosis based on any imaging modality or laboratory test because there are no delays associated with detection of pathology, laboratory analyses, or patient transport.
The first part of this consensus article is devoted to multimodal monitoring in neurocritical care of traumatic brain injury (TBI) and stroke patients. 56 The second part addresses basic properties of SD with a focus on their clinical relevance. The third part discusses how newly developing ischemic zones may be detected in real-time even when the recording device is located remotely from the ischemic zone. In the fourth part, we recommend practical guidelines for the routine monitoring of SD within the framework of the Co-Operative Studies on Brain Injury Depolarizations (COSBID) and multimodal neuromonitoring that enable its use as a diagnostic summary measure for disturbances in brain energy metabolism, 55 brain lesion development, 45 prognostication,57,58 and tailored therapy in neurocritical care.
Part 1: Relevance of multimodal monitoring in neurocritical care
A diagnostic summary measure for disturbances in brain energy metabolism
Personalized medicine proposes the customization of healthcare by tailoring medical decisions, practices, and/or products to the individual patient. In this model, treatment-responsive modifiable biomarkers of injury serve as diagnostic summary measures to enable iterative tailored therapy.
Powerful diagnostic summary measures exist for practically every organ. The brain, however, poses particular challenges because time from onset of an insult to damage is shorter than in other tissues, and brain structure and physiology are exceedingly complex. The brain is also less accessible to point-of-care diagnostic procedures and interventions since it lies beneath the skull and is normally isolated from peripheral circulation.
An important biomarker would measure disturbances of energy supply and metabolism in pathologic conditions of the brain such as global ischemia, hypoglycemia, TBI, and stroke, the leading cause of major disability and third leading cause of death in the world.59–61 Acute disturbances of brain energy metabolism in a fully conscious patient can often be detected via history and neurological exam by the treating physician; 15 however, in patients with reduced consciousness from injuries or sedatives, neurologic assessments often fail to detect secondary injury. Thus, diagnosis of secondary injury is often delayed in the intensive care setting, and treatment is not provided at the appropriate time despite the availability of suitable interventions. 62
Diagnostic summary measures are useful precisely for these situations. The ideal measure of disturbed brain energy metabolism should: (a) be available at the bedside in real-time to allow for intervention before tissue damage occurs; (b) have high sensitivity and specificity with minimal interference from other signals; (c) be non- or minimally invasive to reduce the risk of side-effects; (d) be procedurally simple to implement and durable, with minimal possibility of failure from patient movements or manipulations; (e) include automated analysis to minimize human workload and allow pre-specified diagnostic criteria to trigger an alarm; and (f) respond rapidly to treatment and reflect treatment efficacy in real-time. While candidate summary measures should strive to achieve these ideal requirements within realistic limits, their development takes time and necessitates progressive incremental advances. Monitoring of the brain should thus be regarded as a modular or building-block construct in which individual parts/concepts are continually added and refined, while failed or obsolete ones are removed.
Multimodal monitoring of the brain
Multimodal continuous bed-side monitoring has already long been applied routinely in neurocritical care. The modalities most widely used at present are intracranial pressure (ICP), cerebral perfusion pressure (CPP), oxygen availability (local tissue partial pressure of oxygen [ptiO2]), and scalp electroencephalography (EEG). 63 Only recently have electrographic approaches been extended to include intracranial electrocorticography (ECoG) as a method to monitor SD. The focus of the present article is therefore on SD, but it is emphasized that SD is only one promising element in concert with others to build and improve effective diagnostics through multimodal neuromonitoring. Given that the different modalities are not mutually exclusive but may actually be complementary, 64 here we describe the state-of-the-art recording and analysis of SDs within the framework of multimodal monitoring in neurocritical care.
Neurocritical care as a systems process
It is beyond the scope of the present article to discuss the other measures of multimodal monitoring in detail. Instead, the reader is referred to the following reviews.63,65–68 Nonetheless, it may be mentioned that each of those modalities faces several fundamental challenges for advancing application: (a) What exactly are they measuring: cause or effect? (b) How, where, and when should they be recorded to extract the most clinically relevant information? (c) What are the most relevant thresholds or derived summary measures for treatment and prognosis? (d) What are the appropriate interventions to restore physiology? and (e) Does monitoring or associated intervention impact outcome? 63
In general, the philosophy behind patient monitoring in critical care is that clinical outcome should be improved through an iterative, bidirectional modulation to restore diagnostic summary measures to a physiological range, unless there are good reasons to allow a set point adjustment. But this approach is intrinsically difficult because the clinician seeking better outcomes has to choose among many individual interventions, each modifying several monitored variables. Furthermore, many complex interactions make it hard to distinguish unequivocally if the changes observed in multimodal monitoring are a consequence of feedback mechanisms (both physiological and pathological), or the clinical interventions themselves. In this context, simple causal reasoning becomes difficult because diagnosis influences therapy and therapy influences diagnosis, leading to circular arguments.
Thus, the compound value of the current concept of neurocritical care and emergency medicine may be revealed in a historical perspective from decade to decade, but the search for single diagnostic or therapeutic measures responsible for improvement is at best exceedingly difficult, and at worst may be misguided. For example, the general value of neurocritical care and emergency medicine is supported by a weighted linear regression analysis that revealed a decline in case-fatality rate of aneurysmal subarachnoid hemorrhage (aSAH) by 8% per decade between 1960 and 1992. There was also an increase in the proportion of patients who recovered independent function. 69 Mortality of TBI declined in a similar fashion at a rate of 9% per decade from 1970 to 1990. 70 However, the controversies begin when single modalities of modern management are considered, such as ICP control in TBI and aSAH. On one hand, the only randomized controlled trial on ICP monitoring in patients with severe TBI failed. 71 Yet, Gerber et al. 72 observed that adherence to the Brain Trauma Foundation guidelines in New York State between 2001 and 2009 was associated with further decline in the 2-week case-fatality rate from 22% to 13%. The authors mainly attributed this improvement to vigorous ICP control, consistent with the general view in the field that ICP control cannot be dispensed with.63,65,66,73
Increased ICP can cause tissue damage by brain herniation and severe reduction in regional cerebral blood flow (rCBF). Hence, common sense alone dictates that ICP should remain below a certain threshold. However, the threshold is likely a graded one, may vary for individual patients, and may be a function of time in addition to absolute level. 74 Further questions are how best to maintain the physiologic range and whether the benefits outweigh the costs. In the clinic, the pillar of ICP control is effective sedation, but sedation often necessitates intubation and ventilation. Each day of mechanical ventilation increases the risk of pneumonia, 75 which is in turn associated with worse outcome in TBI and stroke including aSAH.76–79 Unfortunately, neither modulation of the yet largely enigmatic mechanisms of the central nervous system (CNS)-injury induced immunodepression syndrome (CIDS) nor preventive antibiotic treatment seem to be viable options for the prevention of pneumonia. CIDS predisposes stroke and TBI patients to pneumonia,80–83 but may protect the brain through inhibition of autoaggression; administration of preventive antibiotics failed to improve functional outcome in patients with stroke.80,84–87 This illustrates how diagnostic measures can result in therapeutic decisions that solve one problem but may create others. The net gain or loss on the intervention is accordingly complex and often difficult to interpret. This example involving ICP control is particularly interesting because the original problem is intracranial whereas the new one, that is, pneumonia, is extracranial, and the whole process involves not only one but several disciplines, including neurointensivists, neurosurgeons, anesthetists, infectious disease specialists, immunologists, hospital hygienists, and nurses.
These brief sketches introduce another more general problem that arises from the ever-increasing complexity of monitoring, interventions, and complications: the intensity of labor and resource utilization and associated risk of human error in neurocritical care. The list of potential complications alone is impressive. For example, aSAH was found to be associated with around 20 relevant intracranial and more than 30 relevant extracranial complications.76,77 On top of this, there are numerous side effects of a wide range of medications. In order to maintain overview and to allow comparative studies, it is therefore mandatory to employ simple, logical, and practically useful standards and recommendations that are updated periodically at the level of professional societies and local institutions. The second goal of this article is therefore to establish current standards and recommendations for monitoring of SDs in neurocritical care.
Such standards of monitoring brain pathology may complement alternate representations of complex data sets 88 with the ultimate ambitious goal of a whole-system approach to neurocritical care. Such an approach removes some obstacles by replacing a “black box” that only shows outputs devoid of context, with information about the evolution of disease process, the homeostatic responses, and therapeutic interventions, along with means to tease apart the effects of these interactions. Ideally, this information would be quantitative. Then, monitoring would imply constructing a dynamical model of the patient-pathology-intervention triad, which carries three consequences. First, finding such a model would benefit from available formal methods to describe, analyze, predict, and ultimately control the system under study. Second, model-based observation is in itself a natural platform for discovery (hypothesis generation and testing). And third, a unified model of patient, disease process, and selective interventions is the very realization of personalized medicine. In a practical sense, this process of model building makes data analysis a continuous and parallel activity to acquiring the data. “Monitoring” would not just mean “data acquisition” anymore, it would become synonymous with selecting a subset of well-understood quantities to guide clinical decision making, case-by-case.
Part 2: Basic properties of SD in the clinic
Spectrum of diseases
There is unequivocal electrophysiological evidence that SDs occur abundantly in the human brain in numerous diseases such as TBI,57,89–92 spontaneous intracerebral hematoma (ICH),90,93,94 aSAH, 55 delayed cerebral ischemia (DCI) after aSAH55,58,95,96 and malignant hemispheric ischemic stroke (MHS).4,97 Further, imaging studies of changes in rCBF or its surrogates and magnetoencephalography strongly suggested that SD is the pathophysiological correlate of the migraine aura.40,98–101 In migraineurs, it may trigger migraine headache.15,102–104
Signatures of SD in the human brain
SD propagates in gray matter of the human brain at a rate between 1.7 and 9.2 mm/min as assessed by laser speckle imaging of rCBF and imaging of the intrinsic optical signal (IOS) in the operating room.
4
In neurocritical care, long-term monitoring of SD can be achieved with direct current ECoG (DC-ECoG), the same technique commonly used in preclinical studies. The designation of DC-ECoG is equivalent to full-band, indicating that the recording amplifier does not filter any low frequency components of the voltage signal and is therefore compatible with measuring to a theoretical limit of 0 Hz, known as the DC offset. Practically, DC shifts or potentials are synonymous with slow potentials and refer to low frequency signals <0.05 Hz. In DC-ECoG then, SD is observed as a large negative slow potential, or DC shift, in the frequency range of <0.05 Hz, that occurs with sequential onset at adjacent recording sites (Figures 1 and 2).91,95,105 This negative DC shift emanates from differences in depolarization between soma and dendrites.
106
The full-band ECoG signal contains information on both the negative DC shift that identifies SD and the SD-induced depression of activity. In subdural ECoG recordings using a DC amplifier, SD is observed as a characteristic, abruptly developing negative shift of the slow potential. Note that negative is up for ECoG recordings shown in all figures. The negative DC shift is necessary and sufficient for identification of SD, and the duration of the negativity is a measure of the metabolic and excitotoxic burden imposed on tissue by SD (steps A and B). In recordings with an AC amplifier with lower frequency limit of 0.01 Hz, the negative DC shift is distorted but is observed in the near-DC frequency band between 0.01 and 0.05 Hz as a multi-phasic slow potential change that serves to identify SD (step C). The depressive effect of SD on spontaneous activity is assessed in the higher frequency band between 0.5 and 45 Hz (step D). ECoG frequencies are given on a logarithmic scale in the left panel. Note that the upper frequency limit of the full-band signal depends on the sampling rate, fs, and the bandwidth merely ranges from 0 to the Nyquist frequency, 0.5 × fs. Spreading depolarization causes spreading depression in electrically active (a) but not in electrically inactive (b) tissue (=isoelectric SD). Recordings of a 53-year-old female with a World Federation of Neurosurgical Societies (WFNS) grade 5, Fisher grade 3 aSAH due to rupture of a middle cerebral artery (MCA) aneurysm. (a) SD is observed as an abrupt, large negative DC shift in raw ECoG recordings (band-pass: 0–45 Hz, traces 3–6). The DC shift shows a sequential onset in adjacent electrodes because it spreads in the tissue at a rate between 1.7 and 9.2 mm/min (oblique arrows).
4
To illustrate the principle of a band-pass filter a circuit diagram of an analog filter is shown between traces 6 and 7 (C = capacity, L = inductance, R = ohmic resistance, Vin = input, and Vout = output voltage). A digital band-pass filter with lower frequency limit of 0.5 Hz and upper frequency limit of 45 Hz is applied to the full-band ECoG to separate the spontaneous activity from lower frequencies on the one hand and ambient AC electrical noise at 50/60 Hz on the other (traces 7–10). Spreading depression is observed as a rapid rundown of spontaneous activity. Note that the spreading depression in traces 7–10 outlasts the DC shift durations in traces 3–6 at all recording electrodes. The recordings in (a) suggest that the cortical region underlying the electrode strip is more or less adequately supplied with energy. This is based on at least five arguments: (i) the negative DC shifts are relatively short-lasting at all recording sites (traces 3–6); (ii) the presence of spontaneous activity before SD indicates that rCBF must be above ∼15–23 mL/100 g/min before SD (traces 7–10)
107
; (iii) spontaneous activity quickly recovers from spreading depression at all recording sites; (iv) ptiO2 is within the normal range as recorded with an intraparenchymal oxygen sensor (Licox®, Integra Lifesciences Corporation, Plainsboro, NJ, USA) (trace 2) and shows a predominantly hyperoxic response to SD (brown bar); and (v) CPP is stable within the normal range before, during and after the SD (trace 1). (b) During the following night, the patient developed a cluster of recurrent SDs with persistent spreading depression of activity. Accordingly, the SDs (traces 3–6) now occur in electrically inactive tissue (traces 7–10). Such SDs are denoted with the adjective “isoelectric.” The comparison of the SDs (DC shifts in traces 3–6) between (a) and (b) illustrates that SDs associated with and without spreading depression (traces 7–10) are “of the same nature” as already pointed out by Leão in 1947.
108
However, the prolongation of the negative DC shifts of the clustered SDs in (b) (cf. particularly SD2) compared to the isolated SD in (a) indicates that there is now some degree of energy compromise in the recording area. Note also that the response of ptiO2 to SD has changed from (a) to (b). Each episode of SD in electrode 3 is now associated with an initial decrease of ptiO2 (brown bars) and subsequent increases are reduced or absent in (b) in contrast to the isolated SD in (a).95,96 Between traces 6 and 7, a scheme of the standard subdural electrode strip is shown.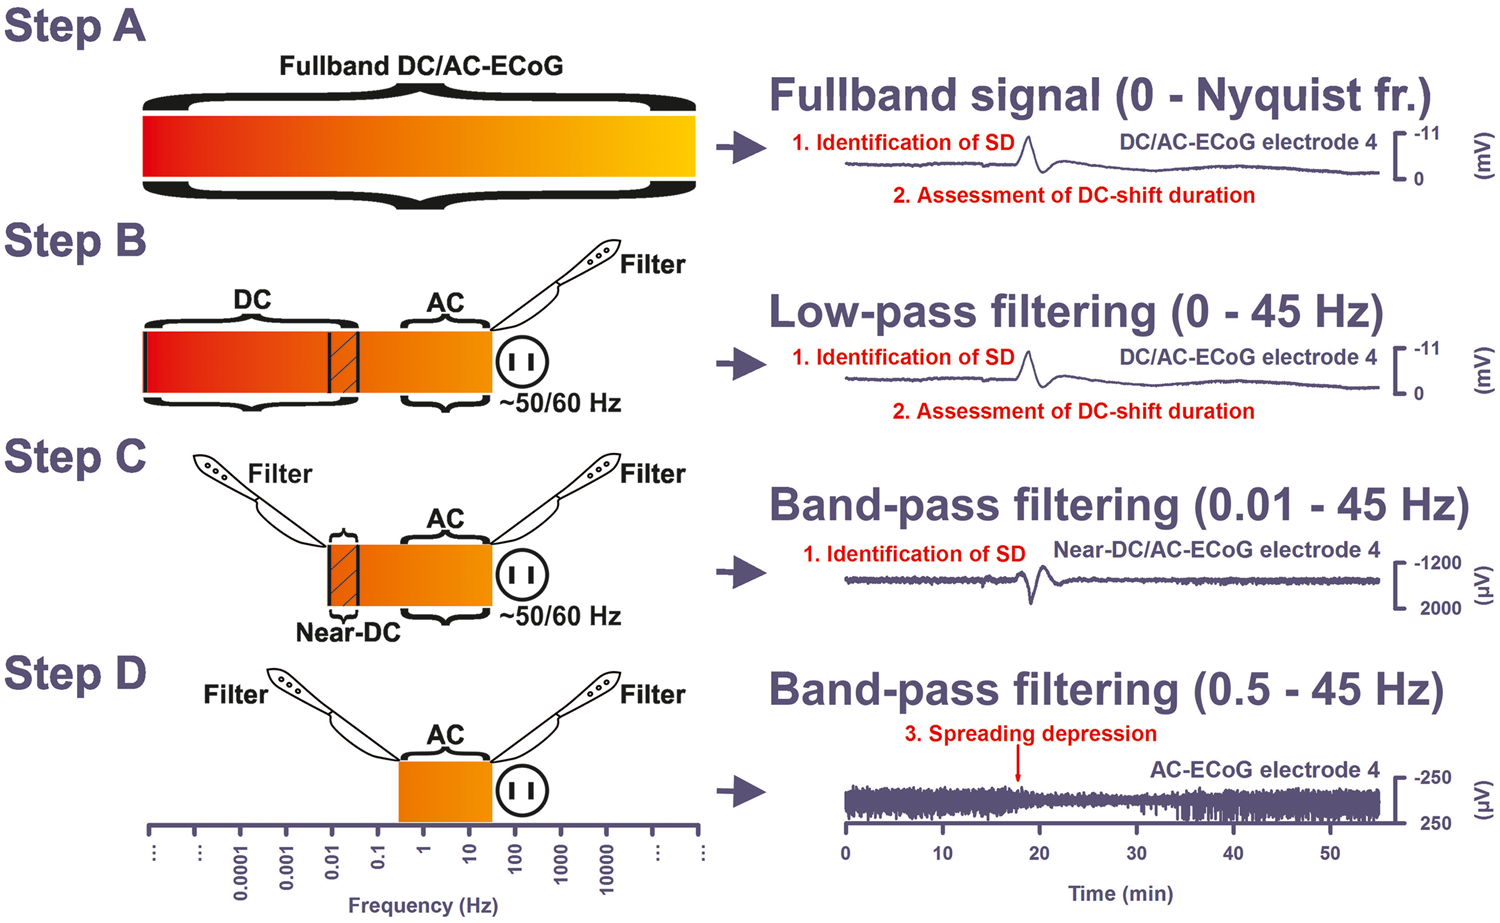
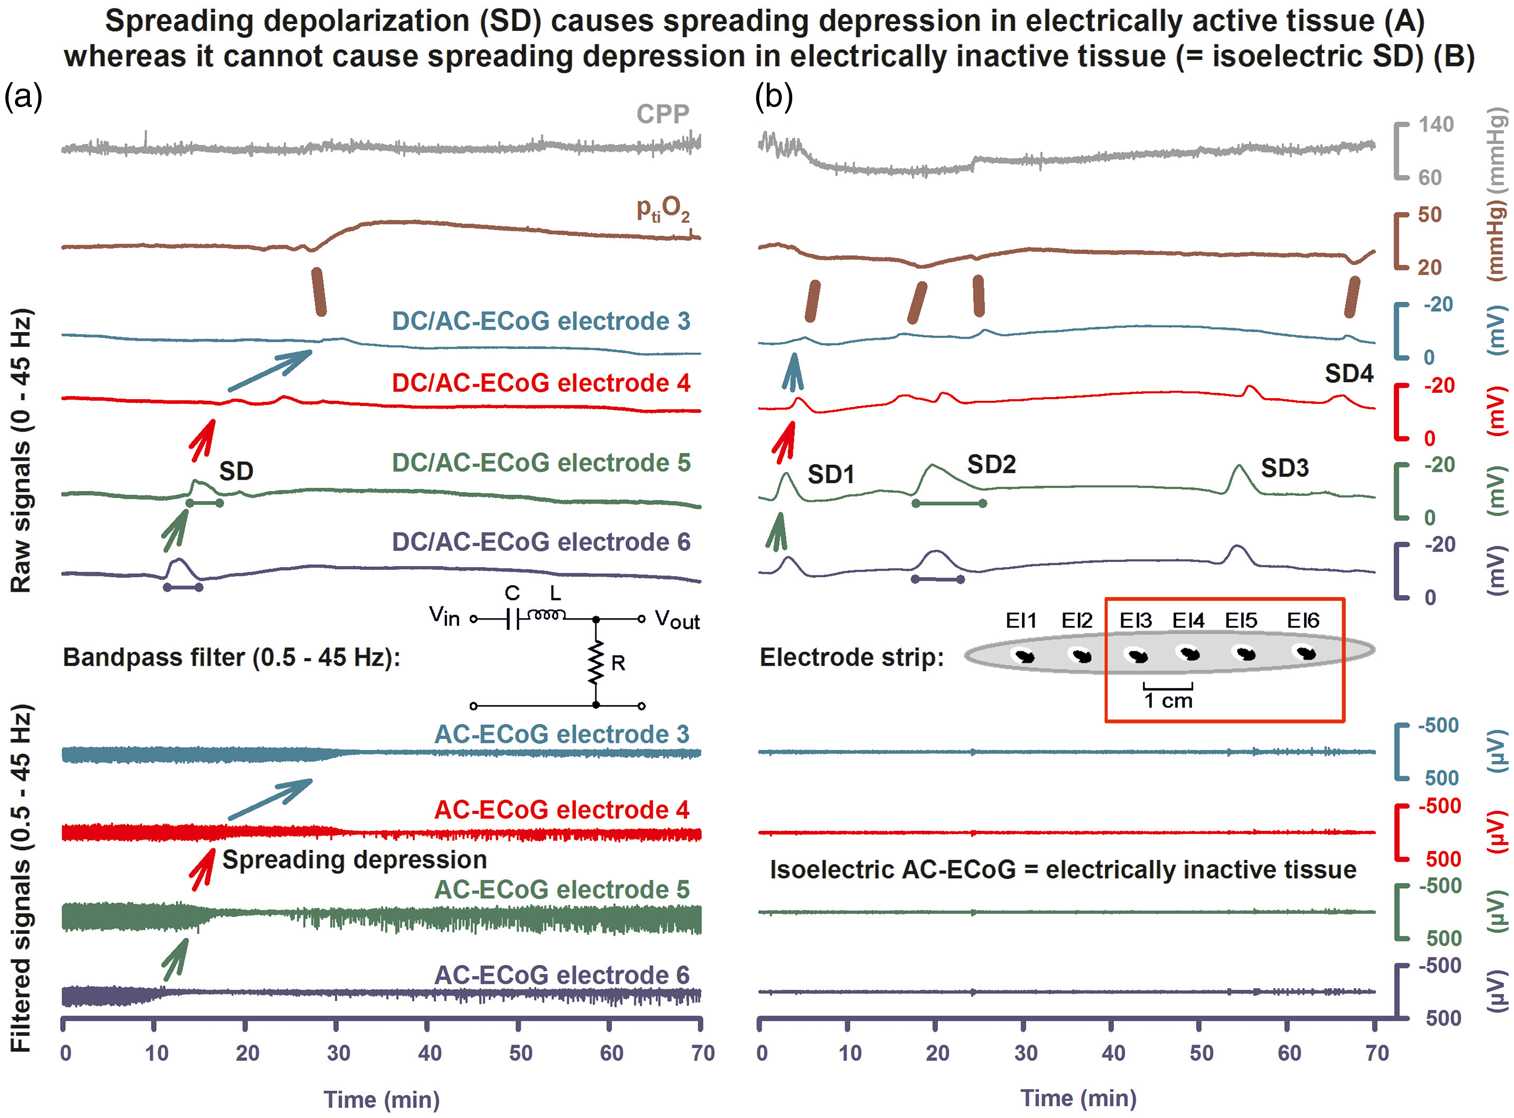
In electrically active tissue, SD usually causes spreading depression of spontaneous activity 109 because the sustained depolarization exceeds the inactivation threshold for the action potential generating channels. 110 At a given point in the tissue, the depression nevertheless outlasts the depolarization, suggesting that it is maintained by other mechanisms that affect synaptic function such as: (a) intracellular zinc and calcium accumulation, (b) extracellular adenosine accumulation, and/or (c) Na,K-ATPase activation (Figures 1 and 2(a)).111–114 Spontaneous activity of the brain within the alternating current (AC) range exceeding 0.5 Hz has an amplitude of at least an order of magnitude smaller than the giant DC shift of SD. High-pass filtering at ∼0.5 Hz is therefore necessary to separate the spontaneous activity from lower frequencies to assess changes during SD. Often, as shown in Figures 1 and 2(a), a band-pass filter with a lower frequency limit of 0.5 Hz and an upper frequency limit of 45 Hz is used to additionally remove 50/60 Hz ambient AC electrical noise. A typical sampling rate in such clinical recordings is 200 Hz.
Theoretically, SD could also be measured by microelectrodes sensitive to any of the neurotransmitters, ions, metabolites, or signaling molecules that change in the extracellular space during SD. Glutamate is of particular interest because of its role in the concept of excitotoxicity, and the extracellular rise in glutamate is synchronous with the onset, sustainment, and resolution of the negative DC shift of SD. 16 However, glutamate can only be measured long-term in the clinic by microdialysis, and currently used microdialysis is inferior to ECoG because the temporal resolution is 720,000 times lower.115,116 Yet, rapid sampling microdialysis could offer new solutions. Rapid sampling technology revealed, for example, an abrupt increase in extracellular lactate and a decrease in glucose as part of the metabolic signatures of SD in patients with TBI.117,118
Differentiation between SD and IEE in the clinic
In human ECoG recordings, IEE and SD are easily distinguished because the negative DC shift of SD is several times larger than the negative DC shift of an IEE.
58
Moreover, ictal epileptiform field potentials are characterized by rhythmic discharges, whereas SD typically causes depression of spontaneous activity (Figures 1 and 2(a)). IEEs can spread at either a similar rate to SDs or at a much faster rate of around 90 mm/min.
58
Spreading convulsion is a peculiar hybrid phenomenon between IEE and SD, characterized by epileptiform field potentials on the tailing end of the DC shift instead of the usually triggered spreading depression (Figure 3(d)).40,57,58
Instructions how to identify SDs and score depression durations. (a) This illustrates the routine calculations based on monopolar recordings. Raw monopolar ECoG recordings of two neighboring electrodes are shown in the upper two traces (band-pass: 0–45 Hz). The negative DC shift of SD is assessed in these recordings. Near-DC/AC-recordings can be derived from the raw recordings using a digital band-pass filter between 0.01 and 45 Hz (traces 3 and 4) and AC-ECoG recordings using a digital bandpass filter between 0.5 and 45 Hz (traces 5 and 6) (also compare Figure 1). Spreading depression is observed in the AC-ECoG recordings as a rapidly developing reduction in the amplitudes of spontaneous activity which spreads together with SD between adjacent recording sites. The squared spontaneous activity is also called AC-ECoG power. The power in contrast to the simple AC-ECoG signals can be used as a measure to quantify local brain activity over time because there are no negative and positive values that neutralize each other. The integral of the power is based on a method of computing time integrals over a sliding window according to a time decay function. This mathematical procedure provides a smoothed curve easing visual assessment of changes in AC-ECoG power. The method has become standard to score depression durations of SD55,91,97 and is also useful in the screening for IEEs.58,119 Depression durations of SD are scored beginning at the initial decrease in the integral of power and ending at the start of the recovery phase (cf. *). The caveat is added that the interrater reliability of this method is high in our experience but there remains a certain degree of subjectivity. Table 2 gives the formulas for the calculations in LabChart (ADInstruments, Oxford, UK). (b) SD-induced depression durations can be scored in either each of the six monopolar ECoG channels as in (a) or each of the five bipolar ones as in (b) to determine the longest recorded depression duration of all channels for each SD in minutes. Bipolar recordings have the theoretical advantage that they are more robust in the clinical setting because the external reference can get lost during patient movements or nursing procedures. However, this can be prevented when the external reference is secured with collodion-saturated gauze. Although depression period assessments can vary considerably between the two configurations, they were not consistently greater or lesser for either; addition of a second active electrode in the bipolar derivation could either augment or dilute effects observed in a single active electrode.
120
TDDDs were similar between mono- and bipolar recordings. This suggests that there is in general no advantage of bipolar versus monopolar recordings in assessing either the degree or duration of spreading depression. SPCs are even more distorted in bipolar than in monopolar recordings but they are still sufficient to identify SDs. (c) The local recovery from SD requires activation of energy-dependent membrane pumps such as Na, K-ATPases. A short-lasting DC shift thus indicates that there is enough ATP to fuel the local membrane pumps for the recovery from SD at the recording site. This feature renders the local negative DC shift duration a useful measure for: (i) the local tissue energy status and (ii) the local risk of injury (excitotoxicity) at the recording site. Accordingly, the upper two traces indicate that the tissue is more energy compromised at electrode 5 than 2 because the negative DC shift of SD is longer (gray lines). Note that despite the prolonged recovery phase the initial DC deflection still occurs rapidly. The local information on the energy status is lost when only the near-DC is recorded as in traces 3 and 4. SPCs in near-DC/AC recordings thus merely serve as an identifier of SD. (d) A spreading convulsion is an SD in which epileptic field potentials arise on the tailing end of the DC shift.58,109,121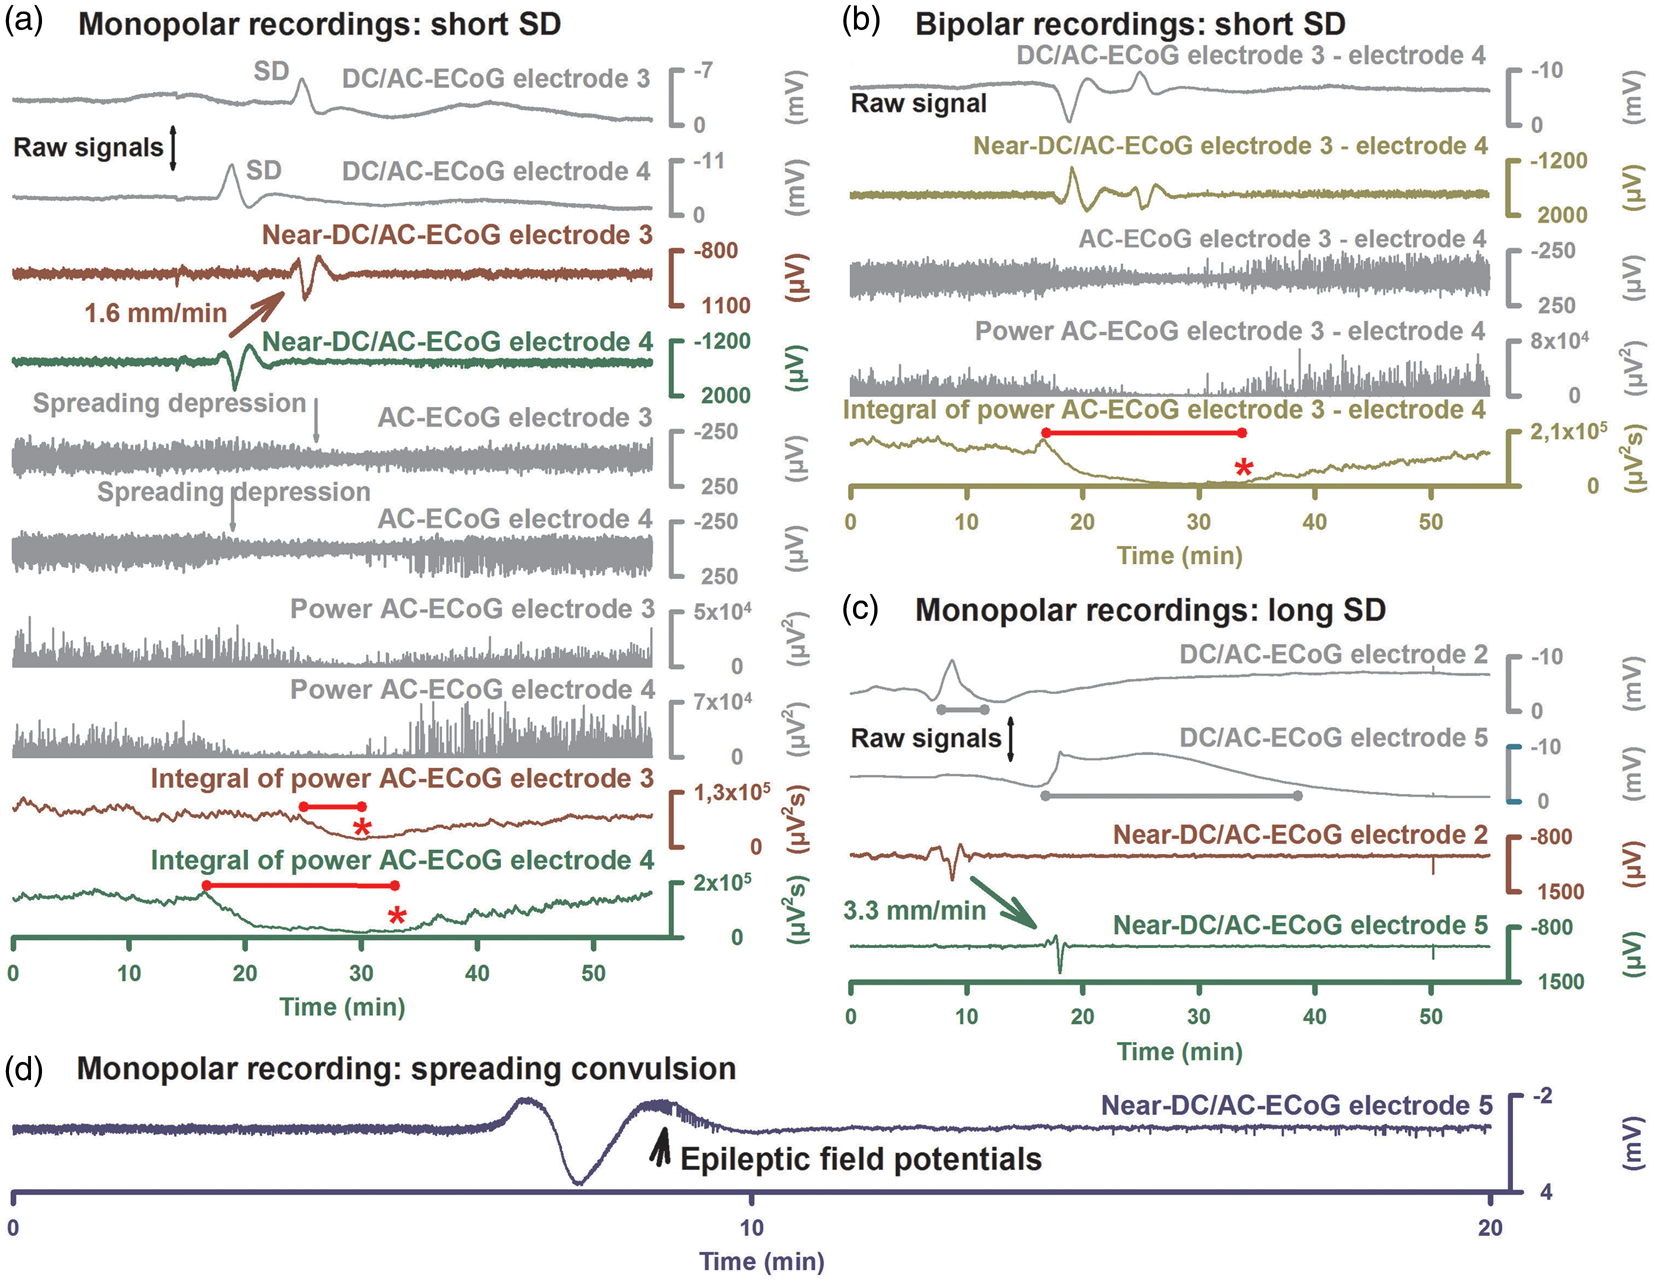
Similar to SDs, IEEs often occur in patients with severe cerebral injuries in both the acute and subacute period. 122 However, SDs are more common than IEEs.58,119 The estimated incidence of IEEs in continuous EEG or ECoG recordings during the first week after the initial insult can be as high as 23% in TBI, 123 38% in aSAH,58,122,124 31% in ICH, 125 and 27% in ischemic stroke. 126 SDs in the acute and subacute period were recorded in about 56% of patients with TBI,57,90 60–70% of patients with ICH,3,94 70–80% of patients with aSAH,55,58 and practically 100% of patients with MHS.4,97 The human findings agree with experimental and theoretical studies that both IEEs and SDs can result from an acute increase in neuronal excitability and/or an energy supply-demand mismatch.110,127–131 Accordingly, properly monitored patients with acute status epilepticus often show not only IEEs but also SDs, though there is great variability in spatio-temporal patterning of these activities. 119 By contrast, chronically increased excitability causes IEEs but has an inhibitory effect on SDs in animals.132–134
Pragmatic definitions for the assessment of ECoG-recorded SDs, IEEs, and IIC in neurocritical care.

Normal and inverse hemodynamic response to SD
The normal hemodynamic response to SD in naïve, healthy tissue of most investigated species including humans40,98,140 consists of a prominent short-lasting hyperemia (cf. rCBF at optode 3 in Figure 4) followed by a mild, long-lasting oligemia.
151
Closer inspection shows even four hemodynamic phases of SD as reviewed recently.
141
SD causes neither significant cellular energy shortage nor any histologically obvious cellular damage in adequately perfused tissue when the neurovascular coupling is intact47,152 although tissue hypoxia may develop in distant territories of cortical capillaries because the cerebral metabolic rate of oxygen (CMRO2) markedly rises during SD.23,151
Spreading hyperemia versus spreading ischemia in response to SD. Recordings of a 47-year-old male with WFNS grade 4, Fisher grade 3 aSAH due to rupture of an anterior communicating artery aneurysm, recording on day 9 after the initial bleeding. (a) The upper three traces show the large negative DC shift that indicates SD. The SD propagates from electrode 4 to electrode 3 at a rate of 3.5 mm/min and to electrode 5 at 5.6 mm/min assuming an ideal linear spread along the strip (band-pass: 0–45 Hz). Traces 4–6 show the spreading depression of spontaneous activity in response to SD (band-pass: 0.5–45 Hz). Traces 7–9 give the responses of rCBF to SD as measured with optodes neighboring electrodes 3–5 using laser-Doppler flowmetry.
95
Trace ten depicts ptiO2 in proximity to electrode 5 whereas trace 11 shows CPP which remains within the normal range. The event is interesting since SD causes spreading hyperemia at optode 3 (= normal hemodynamic response). Accordingly, the negative DC shift is short-lasting at electrode 3. In contrast, spreading ischemia is coupled to the SD at optode 5 (= inverse hemodynamic response). Accordingly, the negative DC shift is longer-lasting and spreading depression of activity is more pronounced and longer-lasting at electrode 5 than at electrode 3. ptiO2 shows a hypoxic response to SD. Note that the SD starts at electrode 4 but a full-blown inverse response is only observed at optode/electrode 5. (b) As illustrated in the left panel (refers to the situation at electrode/optode 5 in (a), spreading ischemia results from a vicious circle in which the sustained neuronal depolarization triggers a perfusion deficit by severe vasoconstriction. The perfusion deficit leads to energy depletion. The energy depletion causes failure of neuronal and glial membrane pumps. The failure of the membrane pumps prevents cortical repolarization. Therefore, the release of vasoconstrictors persists which maintains the process.2,143,144 The prolonged negative DC shift is the necessary electrophysiological criterion that defines spreading ischemia.2,39 An initial hypoperfusion in response to SD can hence not be rated as a spreading ischemia if is not accompanied by a prolonged negative DC shift. On the right, a scheme of the normal hemodynamic response to SD is shown for comparison (refers to the situation at electrode/optode 3 in (a)). Note that normal and inverse hemodynamic responses to SD do not follow an all-or-nothing principle but show a continuum toward increasing pathology.
142
It may also be added that a hyperemic response to SD does not preclude that the respective SD damages the tissue at the recording site.105,153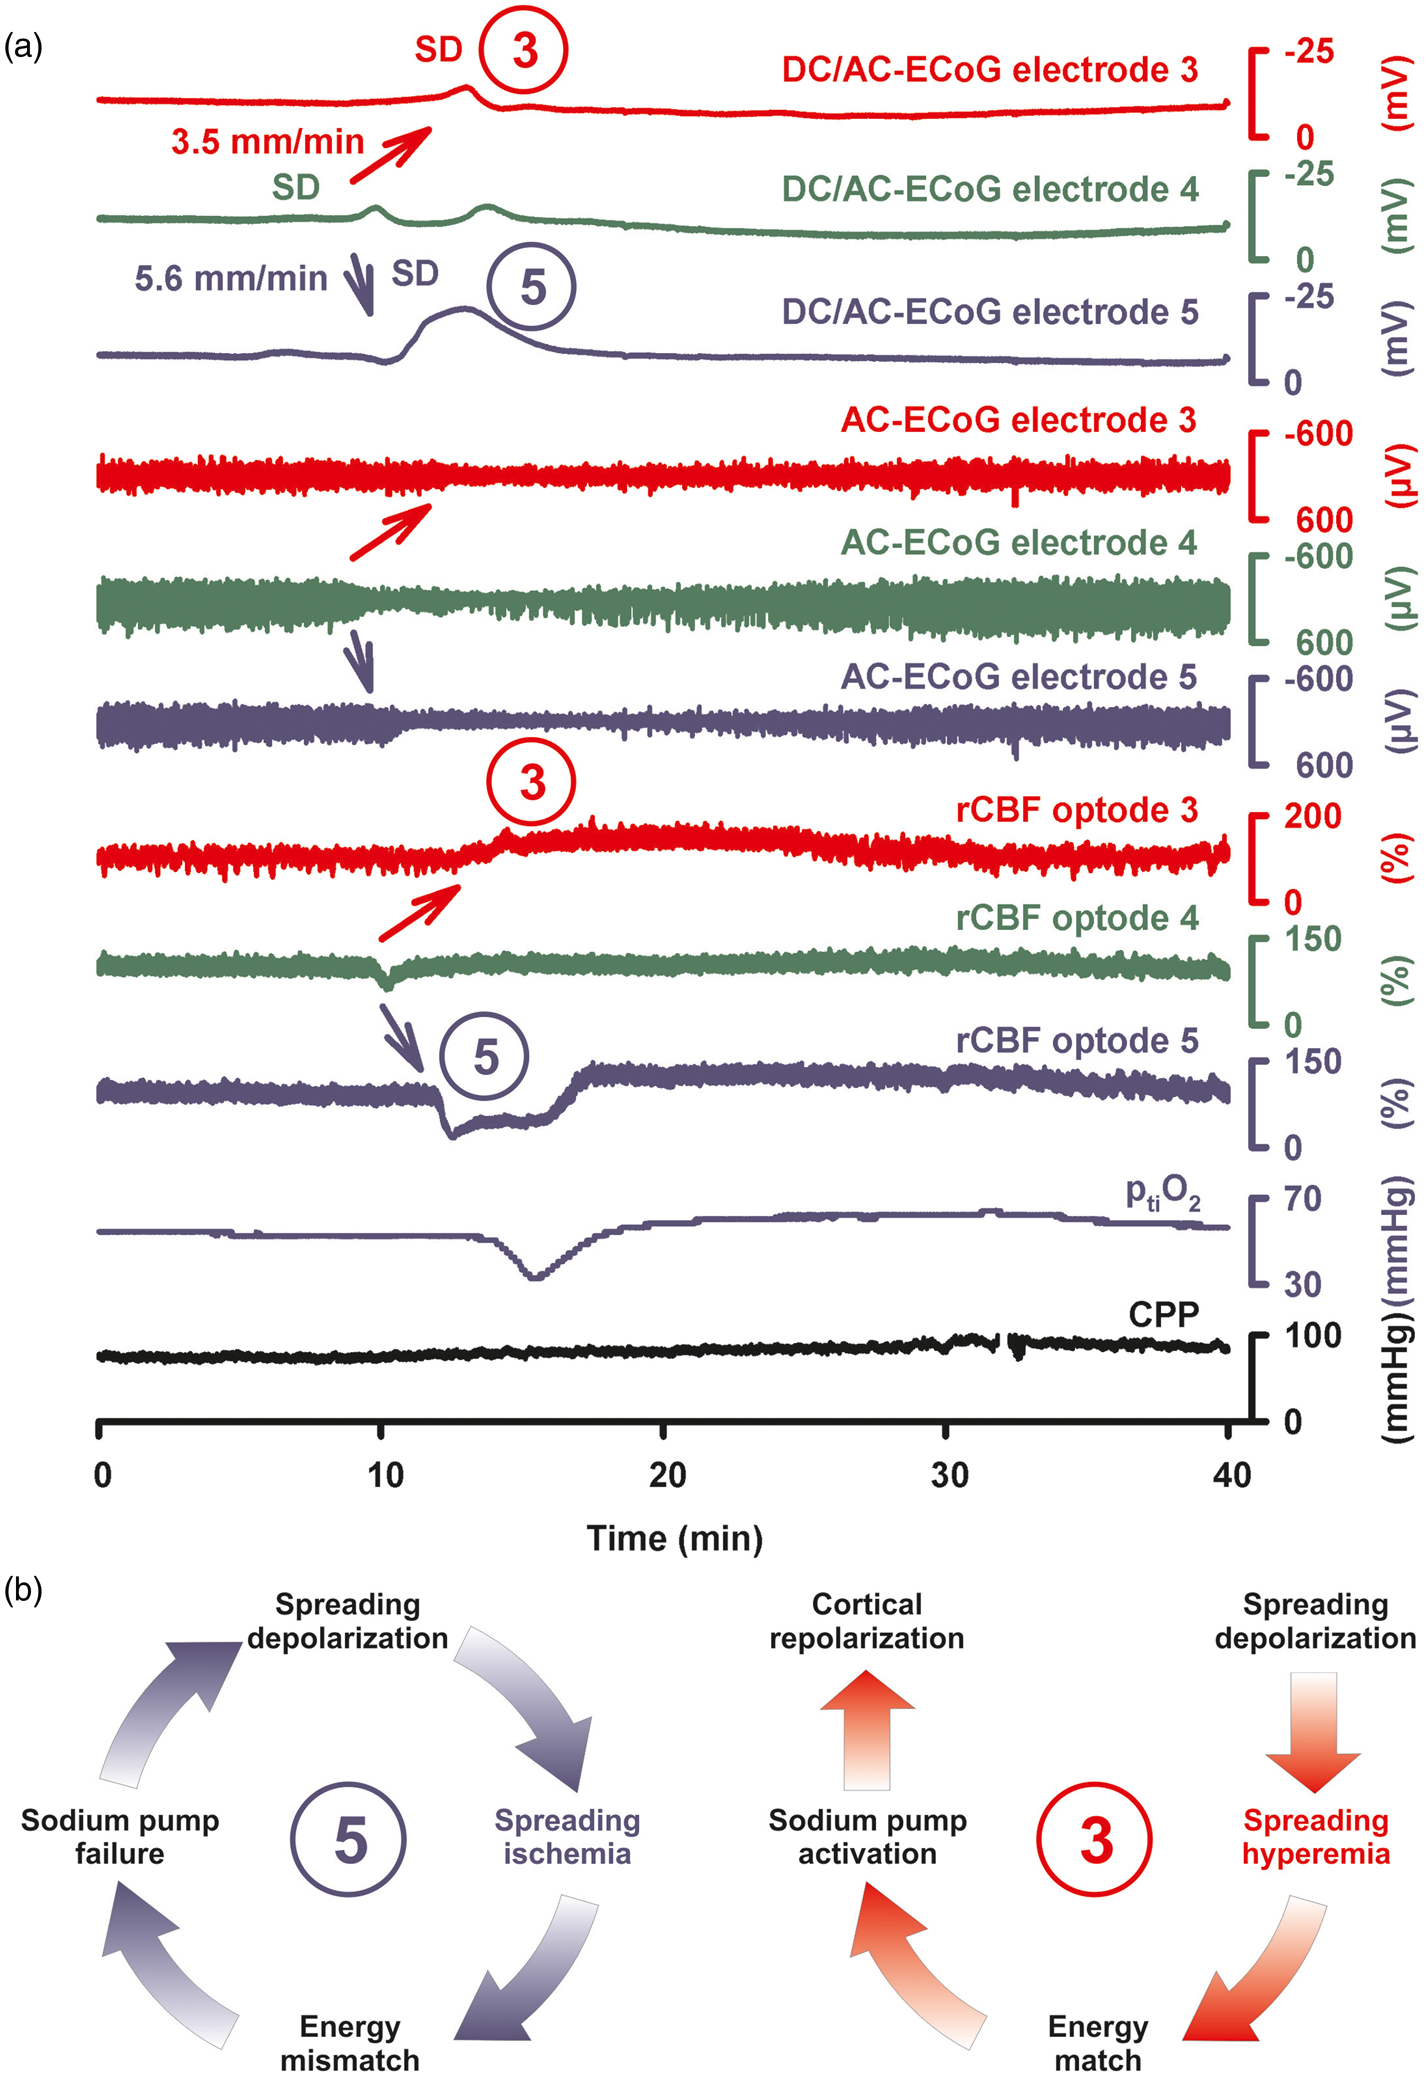
By contrast, SD can trigger severe focal ischemia in animals in moderately ischemic or even adequately perfused tissue when neurovascular coupling is impaired and the hemodynamic response to SD is inverted. In this case, SD induces initial, severe microvascular constriction, instead of vasodilatation, which persists as long as the tissue remains depolarized.2,38,39,141,154–157 This type of focal ischemia propagates together with the neuronal depolarization wave and is therefore referred to as spreading ischemia.39,158 Strictly speaking, the term spreading ischemia only describes the SD-induced initial perfusion deficit (cf. rCBF at optode 5 in Figure 4) when it leads to a prolonged negative DC shift (cf. DC/AC-ECoG at electrode 5 in Figure 4).2,143
Across tissue, hemodynamic responses to SD often show a continuum from an inverse ischemic response to an increasingly normal hyperemic response or the other way round, as shown, for example, from optodes 3 to 4 to 5 in Figure 4. 39 This results from local variations in condition-related augmentation or, respectively, damping of various SD-induced vasoeffectors along the path of the wave.2,141 Causative conditions include not only changes in the milieu of the interstitial fluid 39 but also the basal level of rCBF. 157 Experimentally, spreading ischemia can be the sole cause of widespread cortical infarcts. 159 In the ischemic penumbra, it contributes to lesion progression.38,154,160 In the clinic, it was identified in patients with aSAH, TBI, and MHS (Figure 4).4,95,161
Notably, spreading ischemia might explain at least a fraction of the CPP-independent drops in ptiO2 in patients with aSAH and TBI (ptiO2 in Figures 2(b) and 4).162,163 In the interpretation of ptiO2, however, it should be borne in mind that decreases might be observed when the rCBF response is still quite normal because of the marked increase in CMRO2 imposed by SD.95,96,151,155
Peculiarities of SD in ischemia
Focal cerebral ischemia is one of the most crucial among the many triggers of SD.2,108,164,165 Typically, the first SD starts in the ischemic core at one or more points in the tissue 2–5 min after the onset of ischemia.107,108,156,160,166,167 Notably, SD does not mark the onset of cell death, but rather starts the clock on the countdown to cell death. Specifically, it marks the onset of the toxic disturbance in neuronal homeostasis that initiates the cascades leading to cell death.15,164 If these disturbances outlast a threshold duration, the so-called commitment point, neurons will die.
11
This implies that neurons can survive SD in the ischemic core if the tissue is reperfused and repolarizes before the commitment point.164,168,169 Conversely, however, neurons will die if the commitment point is reached, even if there is subsequent reperfusion, repolarization, and some recovery of spontaneous activity.164,168 The mechanism of cell death is predominantly necrosis when neurons experience very long-lasting depolarization of around 30–60 min or longer (Figure 5). This shifts toward apoptosis and, hence, to slower death within the necrotic–apoptotic continuum when there is local reperfusion and recovery from SD after the commitment point but before ∼30–60 min.169,170 The commitment point also depends crucially on the absolute local level of perfusion and differs between different types of neurons.
171
Evolution of a brain infarct early after aSAH. Thirty-eight-year-old male with WFNS grade 5, Fisher grade 3 aSAH due to rupture of an anterior communicating artery aneurysm. (a) In the left panel, SD of moderate duration is shown that occurred on day 1 after the initial bleeding. Note the negative DC shift propagating from electrode 6 to 5 in traces 5 and 6 (green arrow). The DC shift is accompanied by spreading depression followed by recovery of the activity in traces 7 and 8 (green arrow). The upper two traces show MAP (intraarterial line in the radial artery) and CPP (= MAP-ICP [intraventricular measurement]). Trace 3 gives rCBF as measured with laser-Doppler flowmetry (PeriFlux System 5000, Perimed AB, Järfälla, Sweden) at a distance of 3 cm from electrode 5. Note the slight increase of rCBF around the time point of SD appearance (upwards pointing red arrow = normal hemodynamic response). Trace 4 displays ptiO2 as measured with an intraparenchymal oxygen sensor at a distance of about 2 cm from electrode 5. Autoregulation seems disturbed since the small decrease of MAP and CPP at the end of the recording episode causes a simultaneous decrease in rCBF and ptiO2. From the beginning, ptiO2 is below the normal range. However, the true value may be somewhat underestimated by the Licox® sensor because Clark-type polarographic probes consume oxygen.
172
In the right panel, it seems that disturbance of autoregulation causes a serious problem shortly after the preceding SD in the left panel. MAP rapidly falls from 120 to 75 mmHg and CPP from 105 to 60 mmHg (downwards pointing black arrow). Although these values are still in the normal range, rCBF falls simultaneously by about 30% and ptiO2 falls below the detection limit. About 40s after ptiO2 has reached the lower detection limit SD starts in electrode 6 in a distance of about 3 cm from the oxygen sensor and spreads to electrode 5 at a rate of 2.1 mm/min (traces 5 and 6). In contrast to the preceding SD in the left panel, the negative DC shift only recovers 1 hr later (stars in traces 5 and 6) after MAP, CPP, rCBF, and ptiO2 have spontaneously recovered to prior levels. Interestingly, the SD in the right panel is associated with spreading depression of activity in a similar fashion to the preceding SD (traces 7 and 8). This indicates that rCBF must still have been above ∼15–23 mL/100 g/min at electrodes 5 and 6 when the SD invaded the underlying cortex.
107
Most likely, the SD triggered spreading ischemia in this region. Otherwise it would be difficult to explain why the DC shift was prolonged to such an extent. Accordingly, rCBF at a distance of 3 cm from electrode 5 now shows a decrease in rCBF around the time point of SD appearance (downwards pointing arrow = inverse hemodynamic response). Another suspicious decrease in rCBF is seen 20 min later. Note also that spreading depression of activity in traces 7 and 8 is now persistent in contrast to the previous spreading depression in the left panel. (b) From left to right: the computed tomography (CT) scan on admission (day 0) shows the initial intracerebral hemorrhage. The red arrow indicates the later position of electrode 6. No evidence of ischemic damage is found in this area on day 0. The next CT was performed 2 days after the event in (a). The red arrow points to electrode 6 of the subdural recording strip. An electrode artifact precludes assessment of the recording area in the second CT. However, new infarcts in the territory of the left anterior cerebral artery and right temporal lobe are observed. The third picture shows a fluid attenuated inversion recovery (FLAIR) MRI on day 9. In addition to the territorial infarct in the left anterior cerebral artery territory, cortical necroses in the right frontal recording area, anterior cortex neighboring the interhemispheric cleft, insular and parietotemporal cortex are observed. The fourth picture gives the FLAIR image at 7 months depicting the widespread brain infarcts including the recording area. At this time point the patient showed severe left-sided hemiparesis and lower moderate disability on the extended Glasgow Outcome Scale.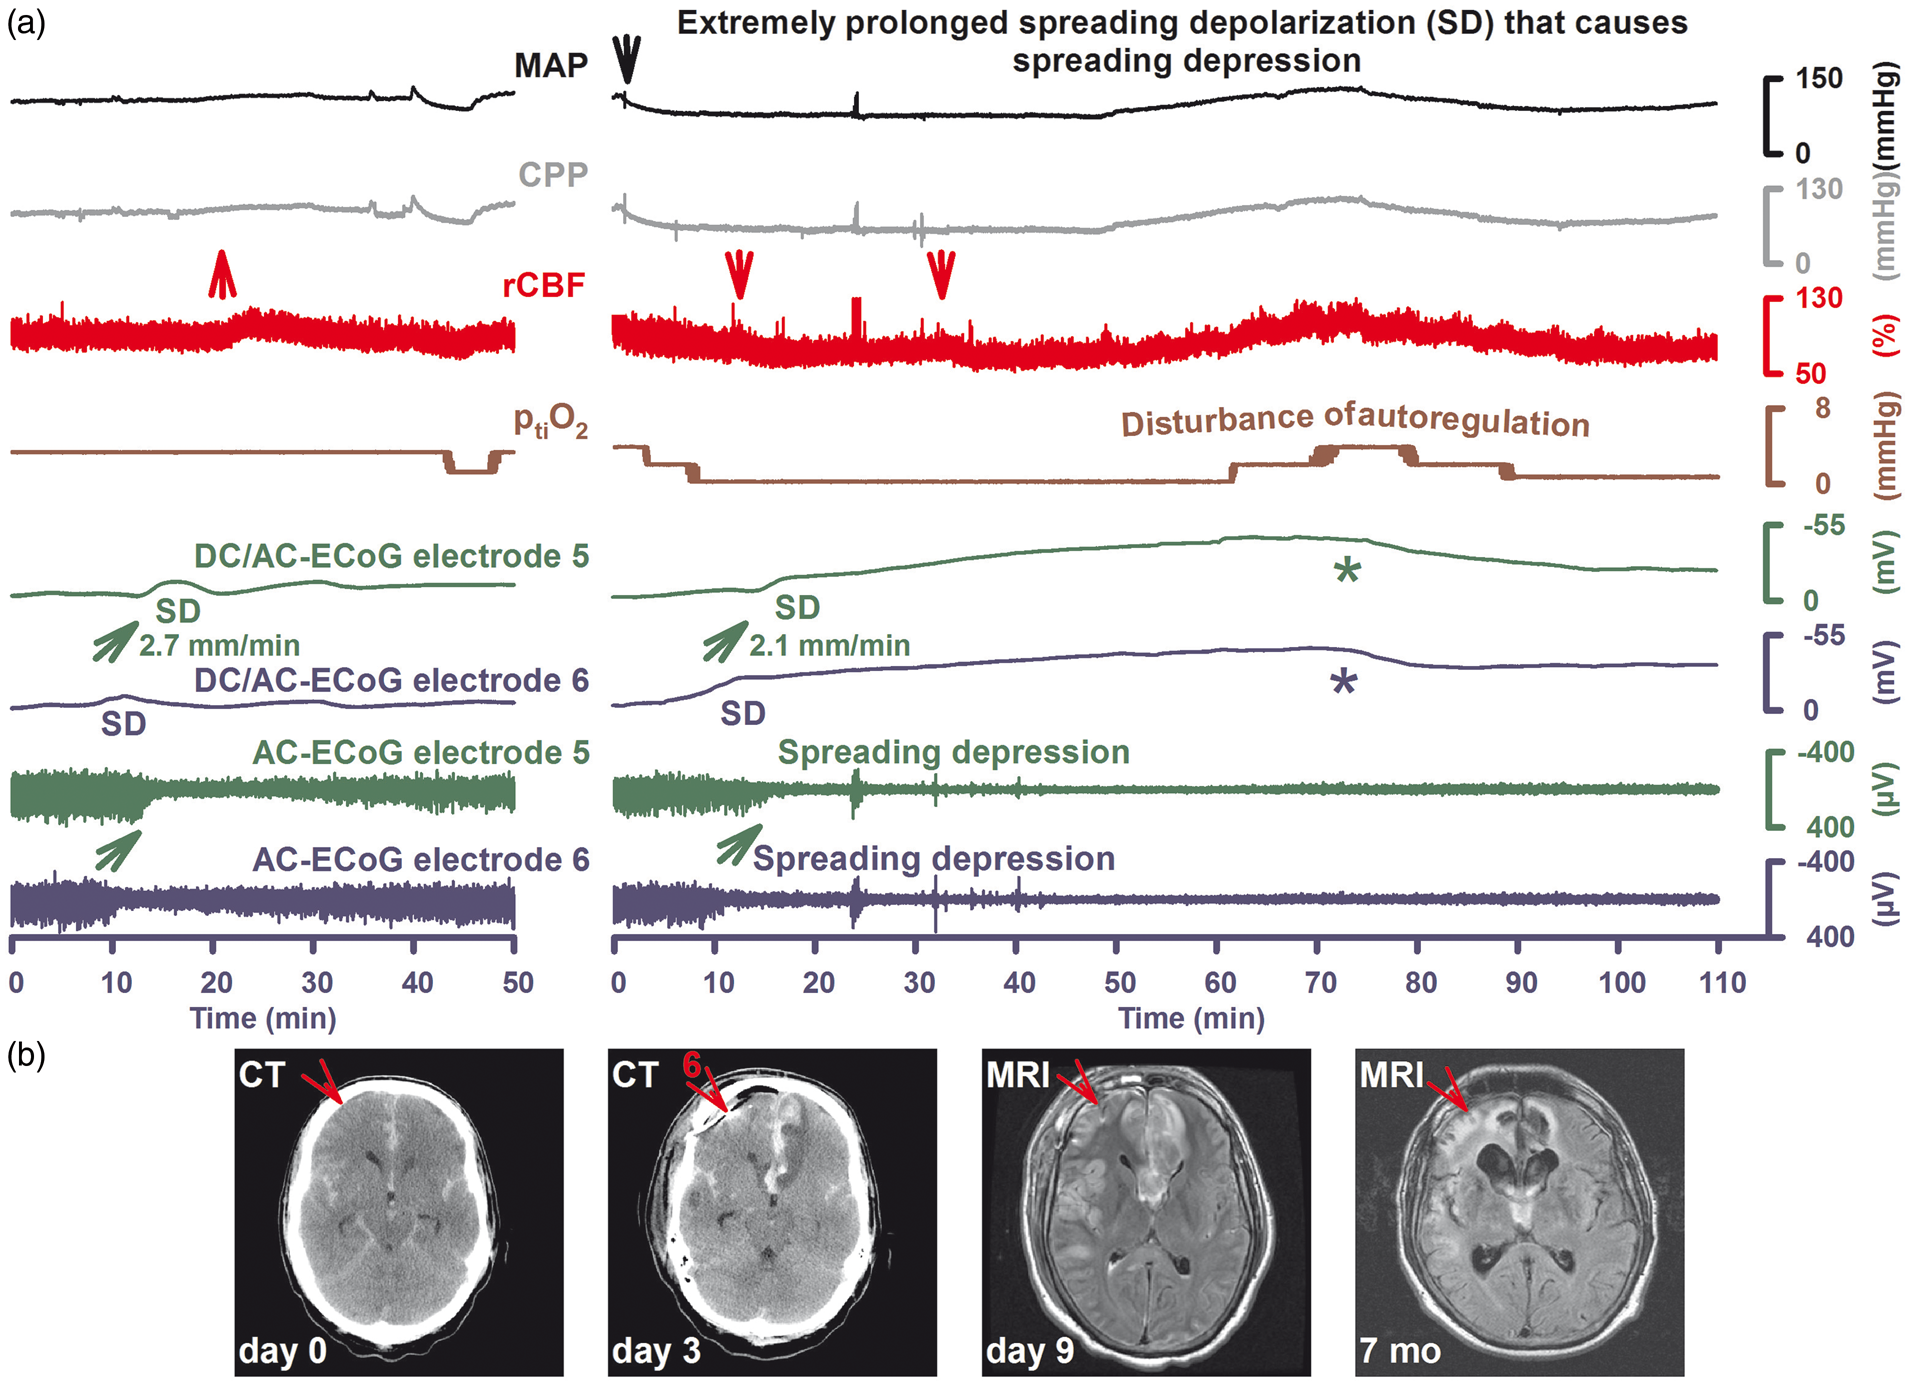
The initial SD that occurs in severely ischemic tissue is often denoted with the adjective “anoxic”. 173 Notably, anoxic SD spreads in a similar fashion to SD in nonischemic tissue but it may start from multiple points in the tissue.156,167,174 From a focal ischemic core, the anoxic SD then spreads against the gradients of oxygen, glucose, and perfusion into the adequately supplied surrounding tissue. The full continuum of SD is observed in this single initial wave, and also in subsequent spontaneous SDs. 45 The continuum entails changing characteristics of the wave determined by the local conditions of the tissue. Most importantly, the duration of the depolarization and near-complete breakdown of ion homeostasis, as indicated by the negative DC shift, varies from persistent in the ischemic core to short-lasting in the periphery, since repolarization requires activation of energy-dependent membrane pumps such as Na,K-ATPases. 135 Short-lasting DC shifts thus indicate enough ATP at the recording site to fuel repolarization. This feature renders the negative DC shift duration a useful measure for (a) the tissue energy status and (b) the risk of injury (excitotoxicity) at the recording site (Figures 3 and 5).1,16,91,95,108,115
The concept of the SD continuum is critical to clinical monitoring since many SDs observed in patients have intermediate characteristics, as opposed to the two extremes of SD in either severely ischemic or normal tissue. 15 It is also important because there are large variations in mechanistic aspects and pharmacological sensitivity of SDs along the continuum, as dictated by local tissue conditions, and these have implications for the efficacy of therapeutic targeting. For a more comprehensive account of the differences that arise along the SD continuum, we refer the reader to the following perspectives.1,15,20,45,104,115,175–180
Part 3: Remote detection of new ischemic zones
Clusters of SD
Following the first SD minutes after onset of an ischemic insult, further SDs develop in the ischemic penumbra in a recurring pattern that creates the characteristic pattern of temporal clustering (Figures 2(b), 6, and 7). Recording of an SD cluster signals newly developing ischemic damage not only when the recording device is located in the ischemic zone, but also when it is located remotely, since SDs also invade surrounding adequately perfused tissue (Figure 8).105,107,115,165,179–182 The recurrent SDs spread not only concentrically from the ischemic zone, but they can also cycle around the center if there is a permanently depolarized core.4,183 Experimental evidence suggests that hypoperfusion or even increase in CMRO2 by functional activation may be sufficient to trigger recurrent SDs. 184 During their course, they recruit further tissue into death, but the cumulative local duration of the negative DC shifts rather than the sheer number of SDs correlated with the dynamics of infarct growth 185 and the final infarct size in animals.182,186
SD clusters are also typically observed in the human brain in patients with aSAH, ICH, TBI, or MHS (Figure 6).3,55,91,94,97,116 In patients with aSAH, they correlated with the advent of DCI and it was found that they can be associated with new transient or permanent neurological deficits such as aphasia or hemiparesis.15,55 As a rule of thumb, negative DC shifts of such clusters become shorter with greater distance from the ischemic center (Figure 7). Nevertheless, relatively short-lasting negative DC shifts as in Figure 6 may still be compatible with development of subsequent damage at the recording site. Whether or not damage develops may also depend on whether the DC shifts are superimposed on a negative ultraslow potential (NUP). For example, it can be seen at electrodes 5 and 6 in Figure 6 that the DC potential returns to baseline after the first SD of the cluster but then it becomes mildly negative shortly thereafter (* in Figure 6). During later course of the cluster, the DC potential remains within this mildly negative range at electrodes 5 and 6, and subsequent SDs are superimposed on the NUP. By contrast, no such NUP is observed at electrode 3, which is more distal from the ischemic center as indicated by the SD spread from electrode 6 to 3. In animals, NUPs are associated with incomplete recovery of the typical ion changes of SD.10,36,105,165 It is assumed, therefore, that the NUP indicates that only a fraction of neurons in the tissue has repolarized at the recording site and that the remaining fraction is persistently depolarized.
Persistent spreading depression of spontaneous activity can be associated with short-lasting, very stereotypical SDs. Fifty-seven-year-old male with WFNS grade 1, Fisher grade 3 aSAH due to rupture of an MCA aneurysm. Traces 1–5 give the raw ECoG recordings (band-pass: 0–45 Hz) at electrodes 2–6 showing the propagation of stereotypical negative DC potential shifts across the cortex indicating a cluster of SDs (oblique arrows). Traces 6–10 display the changes in spontaneous activity in the AC-ECoG recordings (band-pass: 0.5–45 Hz). Note that the first SD is an isoelectric SD at electrode 6 but a spreading depression at electrodes 2–5. From one SD to the next, the isoelectricity then expands in the tissue so that the third SD is only a spreading depression at electrode 2 but an isoelectric SD at electrodes 3–6. In other words, spreading depression causes the zone of electrically inactive tissue to grow. Experimental evidence in fact suggests that the zone of electrically inactive tissue can even expand into surrounding, adequately perfused tissue. This view is supported here by the observation that, for example, the third negative DC shift at electrode 3 is indistinguishable from the second one although the third SD is an isoelectric SD but the second SD a spreading depression at electrode 3. Another interesting detail is that electrodes 5 and 6 are significant for a shallow negative DC shift between the recurrent SDs (*). This could represent a NUP as explained in the text. Modified with permission from Oliveira-Ferreira et al.
105
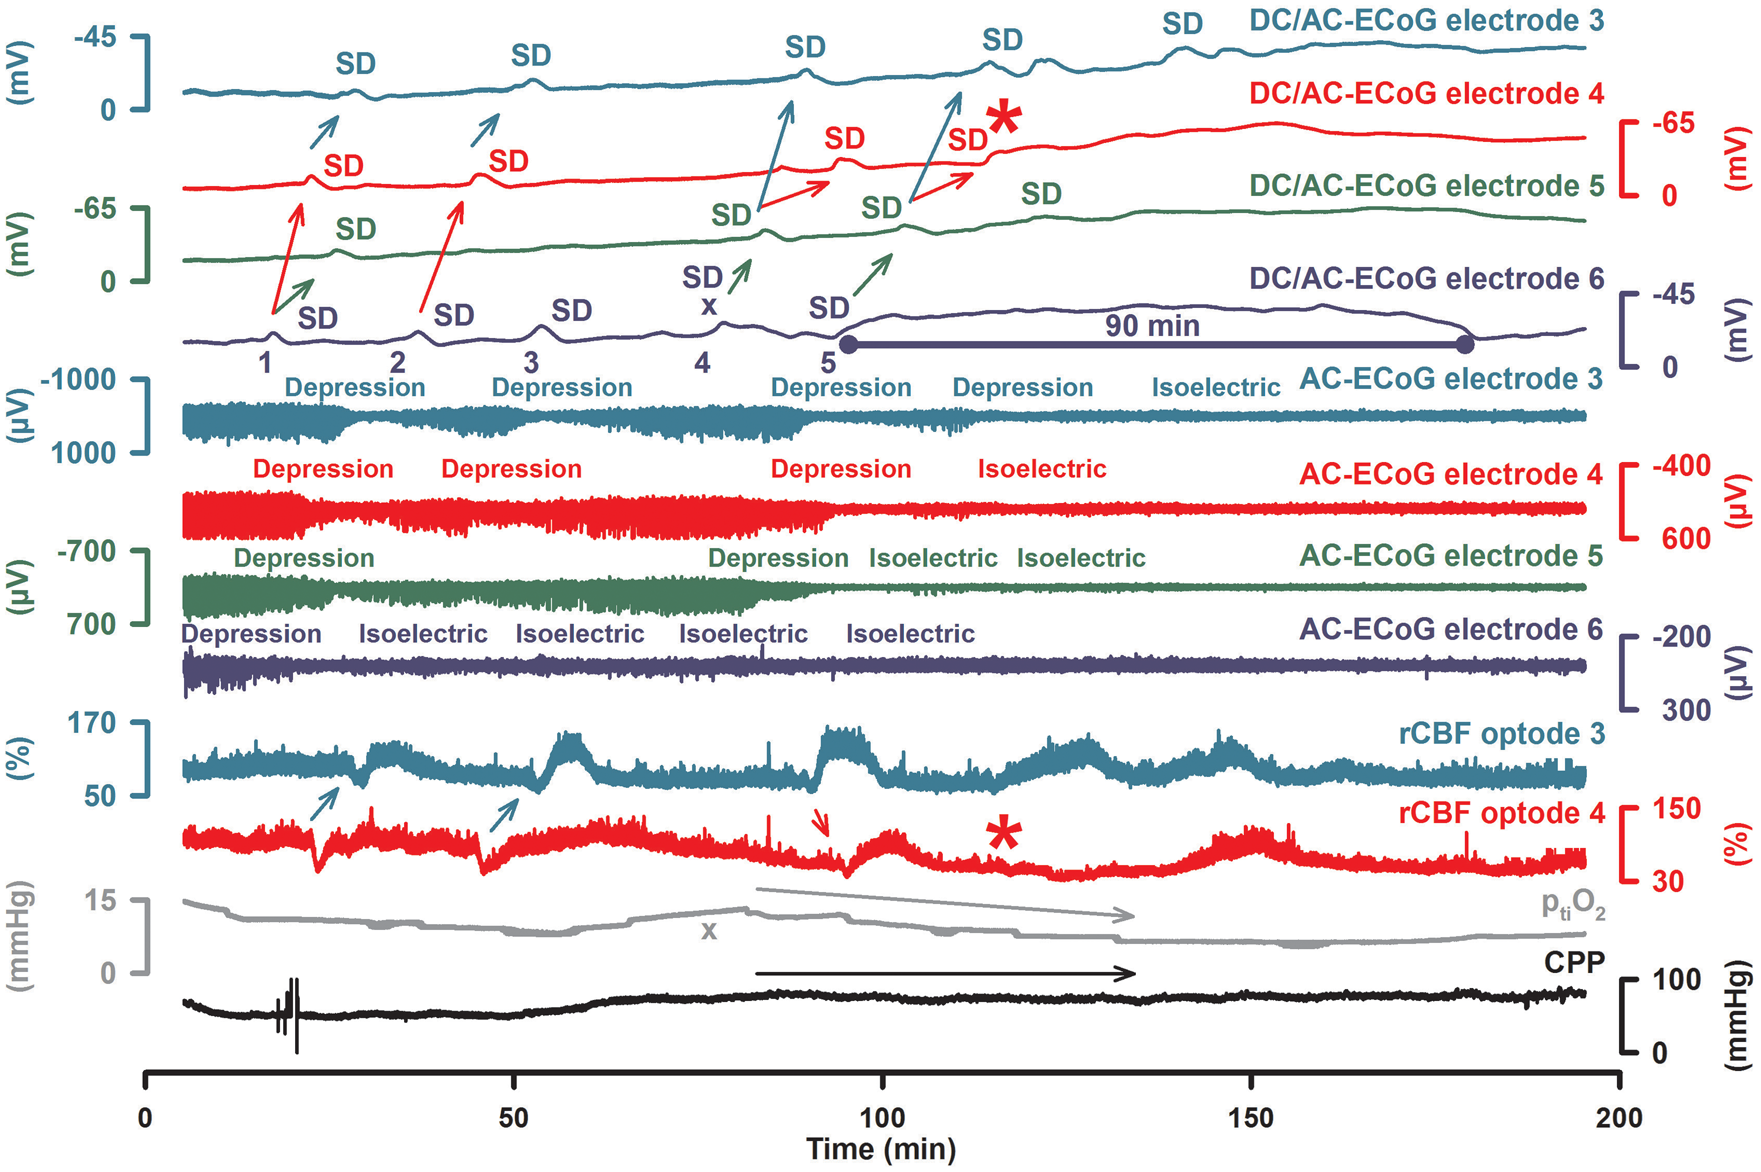
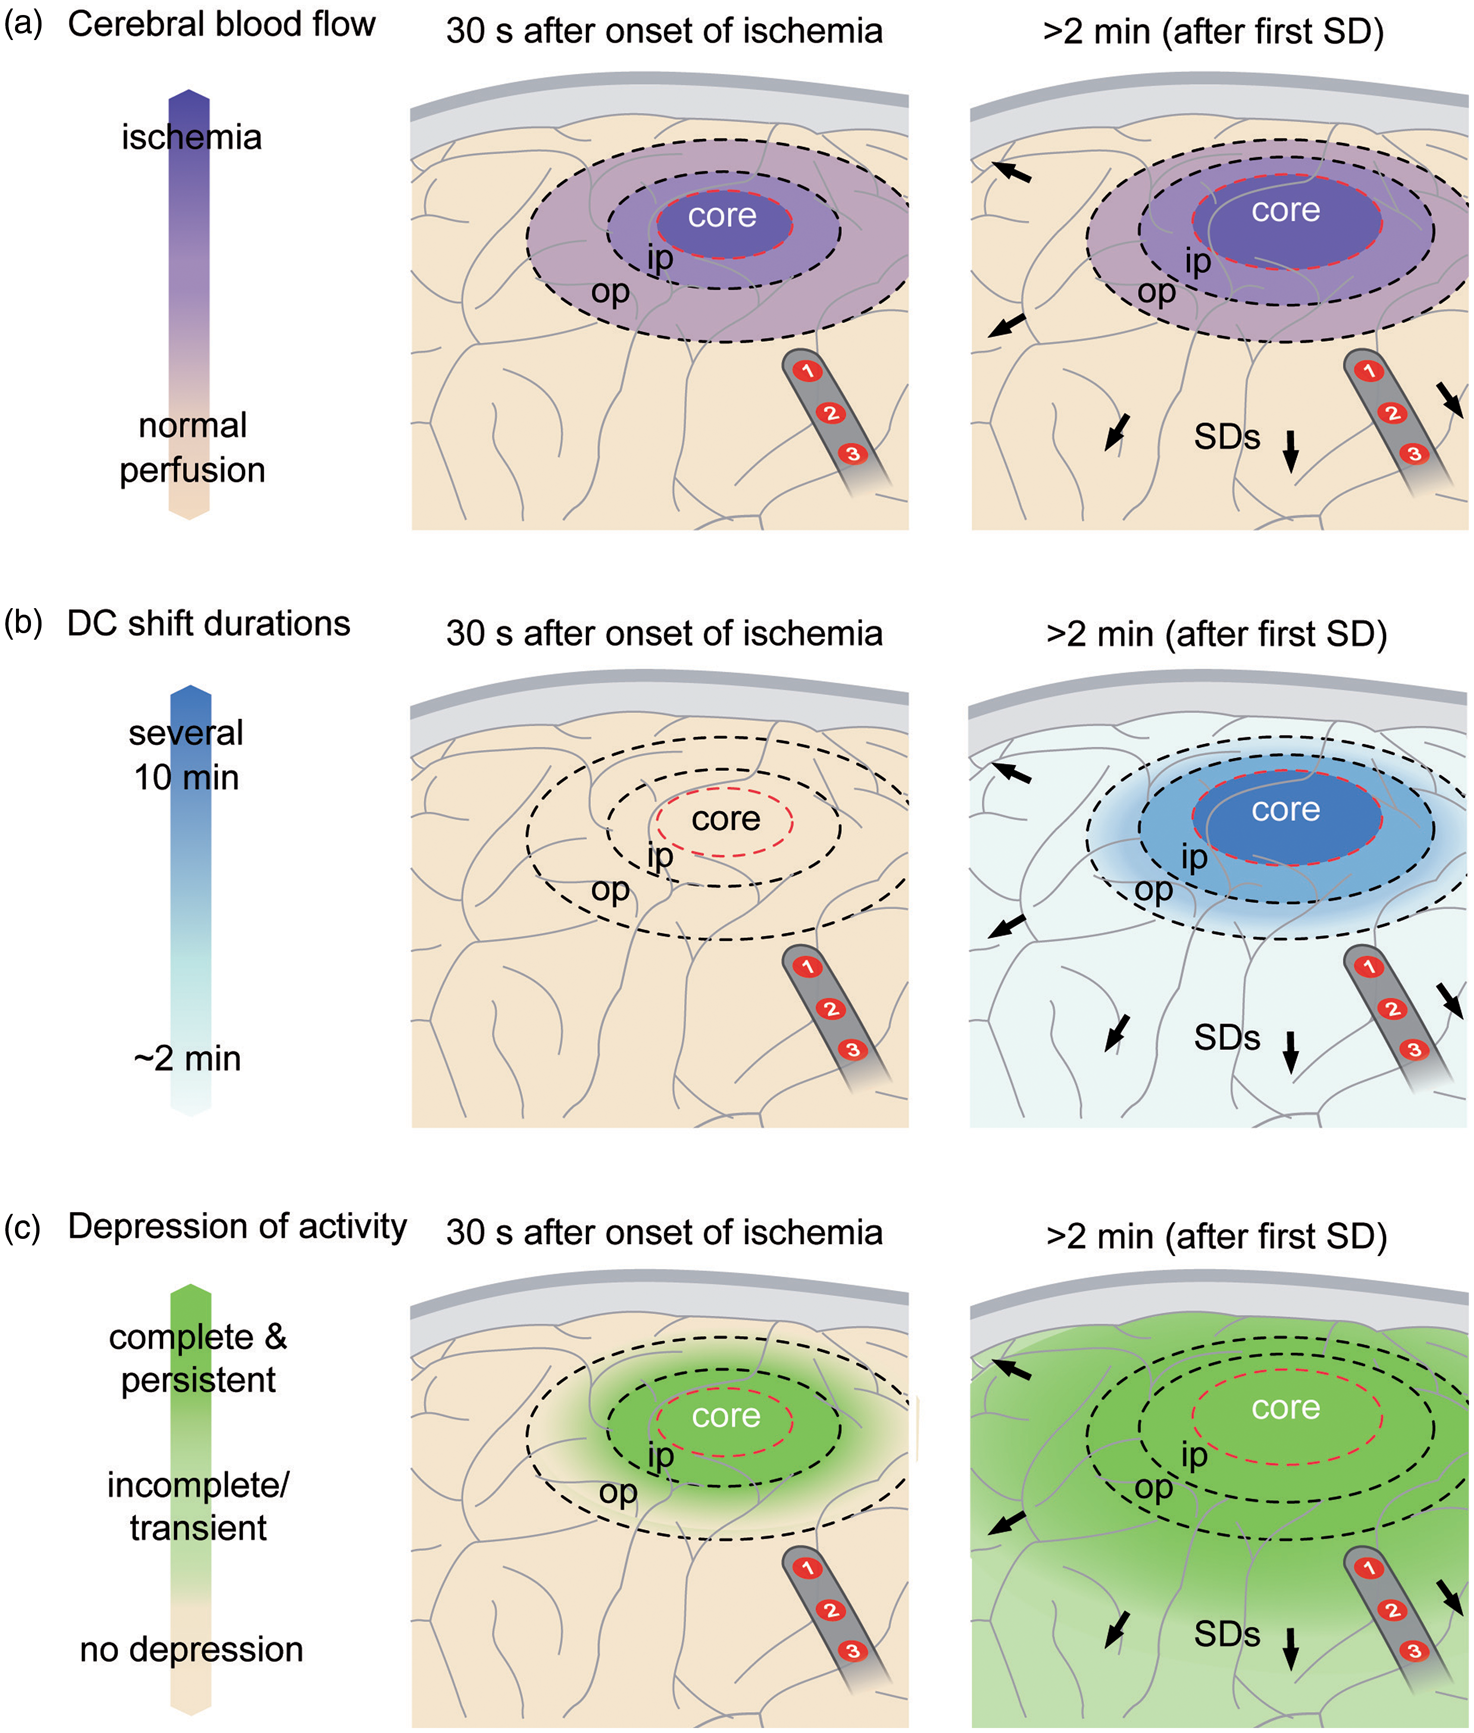
Development of a very prolonged negative DC shift during a cluster of recurrent SDs. Fifty-one-year-old female with WFNS grade 5, Fisher grade 3 aSAH due to rupture of an MCA aneurysm. Pathophysiology of focal cerebral ischemia. In the experimental literature, the ischemic core has been roughly defined by a perfusion level below ∼15 mL/100 g/min, the inner penumbra (ip) by a perfusion level below ∼20 mL/100 g/min and the outer penumbra (op) by a perfusion level below ∼55 mL/100 g/min (a).
107
The first electrophysiological change in response to ischemia is nonspreading depression of activity
15
which is complete in core and inner penumbra about 30–40 s after the onset of ischemia (c, left panel). At this time point, ischemia has not induced SD yet. The first SD starts in the ischemic core at one or more points in the tissue typically 2–5 min after the onset of ischemia.
108
In the core, the negative DC shift is usually persistent but its duration becomes progressively shorter-lasting along its path in the tissue while the SD spreads against the gradients of oxygen, glucose and perfusion into the adequately supplied surrounding tissue (b, right panel). With greater distance from the inner ischemic penumbra, nonspreading depression is less and less complete and SD therefore induces increasing degrees of spreading depression.
15
Spreading depression thus causes the zone of electrically inactive tissue to expand beyond the inner ischemic penumbra. Experimental evidence suggests that the zone of electrically inactive tissue even grows into surrounding, adequately perfused tissue (c, right panel). Following the first SD after onset of an ischemic insult, further SDs develop in the ischemic zone in a recurring pattern that creates the characteristic pattern of temporal clustering. A subdural electrode strip may thus detect newly developing ischemic zones via (i) clustered SDs and/or (ii) impaired recovery of spontaneous activity even if the recording device is placed remotely from the ischemic zone. In the figure, electrodes 1 and 2 would show a cluster of isoelectric SDs although the strip is located outside of the ischemic zone.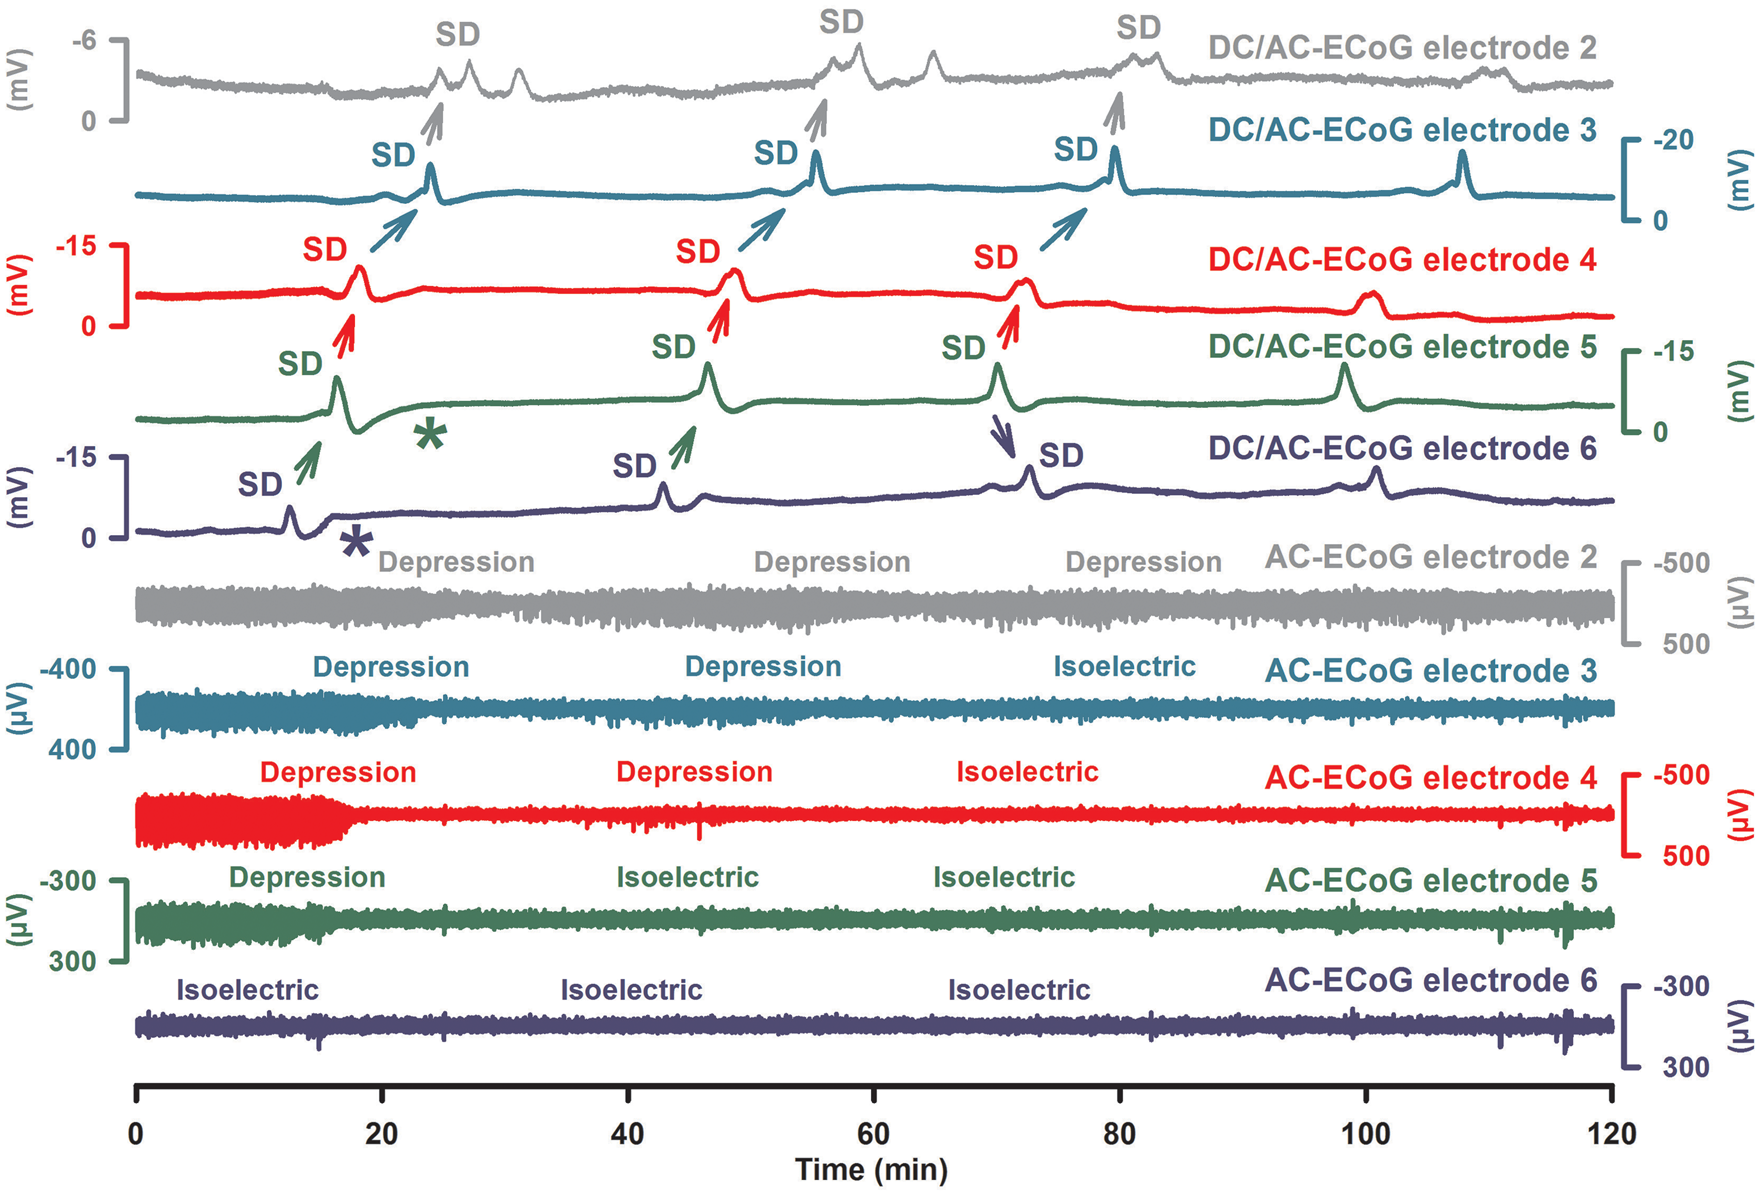
SD-induced persistent spreading depression of activity
Spontaneous electrical activity can only be maintained in tissue if rCBF is above the range of ∼15–23 mL/100 g/min. 107 An abrupt decrease of rCBF below this range inevitably causes arrest of spontaneous activity within several tens of seconds well before ischemia induces SD (left panel in Figure 8). This arrest of spontaneous activity develops simultaneously (= non-spreading depression) in all tissue with a critical rCBF reduction and is associated with neuronal hyperpolarization, in stark contrast to spreading depression.2,108,188,189 For a more comprehensive account of nonspreading depression, we refer the reader to a recent review. 15 Importantly, the first ischemia-induced SD cannot initiate spreading depression in the ischemic core and inner penumbra because these zones have already been subject to nonspreading depression and activity cannot be further depressed. In other words, the local occurrence of spreading depression of spontaneous activity indicates that the level of rCBF is above ∼15–23 mL/100 g/min and the tissue is not severely ischemic in the moment when SD invades it (Figures 5–7).
With greater distance from the inner ischemic penumbra, nonspreading depression is less and less complete and SD therefore induces increasing degrees of spreading depression. 15 Spreading depression thus causes the zone of electrically inactive tissue to expand beyond the inner ischemic penumbra. Experimental evidence in fact suggests that the zone of electrically inactive tissue even grows into surrounding, adequately perfused tissue (right panel in Figure 8). As SDs originating in the ischemic zone repetitively invade the surrounding tissue, as explained above, they keep a belt of adequately perfused tissue around this ischemic zone in a state of depressed electrical activity. This effect was first described in an experimental model in which ischemia was locally induced by topical cortical application of the vasoconstrictor endothelin-1 (ET-1). 105 rCBF and ECoG were recorded both in the cranial window of ET-1 application and at a second window remote from the ischemic zone, where persistent depression developed as a result of invading SDs. The same effect is also evidenced in the middle cerebral artery occlusion (MCAO) model as seen, for example, in Figure 2 in the article by Dijkhuizen et al. 182 and Figures 1(c) and 4 in the article by Hartings et al. 190
Clinical observations are consistent with these experimental results. In patients, clusters of SDs often lead to persistent depression of electrical activity (Figure 6), and several lines of evidence suggest that these patterns develop in nonischemic cortex. First, in a large majority of these cases, the depression starts in a spreading rather than nonspreading manner (Figures 6 and 7), demonstrating that SD, rather than pre-existing ischemia, is the cause of depression. Second, most of these SDs in electrically inactive tissue have DC shifts of short duration, similar to SDs that induce spreading depression in spontaneously active tissue (Figure 6).91,105 Third, ptiO2 preceding SD was similar and differences in ptiO2 responses to SD were only subtle between SDs in electrically inactive tissue and SDs in electrically active tissue. 64 Fourth, the N-methyl-D-aspartate receptor (NMDAR) antagonist ketamine was sufficient to block clusters of SDs in electrically inactive tissue, such that spontaneous activity returned.139,191 If inactivity had been ischemia-induced nonspreading depression rather than SD-induced persistent spreading depression, the activity should not have returned after blockade of the cluster. Also, the NMDAR antagonist would not have been sufficient to block the cluster in more severely energy deprived tissue, as shown in animal studies192–195 and a case report. 95
Persistent SD-induced depression of electrical activity causes a large increase of the total depression duration of the respective recording day (cf. below). This variable demonstrated the strongest association with patient outcome among various quantitative measures of SD burden.58,64
Isoelectric SDs
SDs in electrically inactive tissue are denoted with the adjective “isoelectric” (Figures 2(b), 6, and 7). The concept above suggests that isoelectric SDs can be recorded both in tissue with and without local energy deprivation. Nevertheless, isoelectric SDs indicate that there is energy deprivation somewhere in the tissue, even if not at the recording site (Figure 8). Consistent with this interpretation, isoelectric SDs were associated with a highly significant eightfold increase in the risk of unfavorable outcome at 6 months in a prospective, observational multicenter study of patients with TBI, in contrast to SDs in electrically active tissue. 57
These findings suggest that, in addition to the clustering of SDs,55,116 the recording of isoelectric SDs55,90,91 or SDs with significantly prolonged depression durations55,58,90 has great value to remotely detect newly developing ischemic zones. Remote diagnosis of new ischemic zones is of particular relevance to patients with acute brain injury because the exact location of future developing pathology is usually unknown when the neurosurgeon implants neuromonitoring devices. It is also a particular advantage of ECoG over other neuromonitoring modalities, such as microdialysis and ptiO2 measurements, that measure only local conditions and may not detect clinically important changes developing elsewhere in an injured lobe or hemisphere. 116
Part 4: Recommendations of the COSBID study group on how to record, score, and classify SDs
Subdural ECoG recordings and minimally invasive alternatives: Technical aspects
The current gold standard for monitoring SDs in the clinic is ECoG with a linear subdural platinum electrode strip. The one most widely used contains six platinum contacts with 4.2 mm2 exposed surface spaced at 10 mm along the strip (Wyler, 5 mm diameter, Ad-Tech, Racine, WI, USA). The strip is placed subdurally on the surface of the cortex to monitor viable tissue at risk for secondary injury. In patients with aSAH the strip is targeted to the vascular territory of the aneurysm-carrying vessel55,58,95,96,196 because it is often covered with blood and, thus, a predilection site for DCI.197,198 In TBI, the strip is placed on peri-contusional cortex or subjacent to an evacuated subdural hematoma,57,90,91,161,199 in ICH on perihematomal cortex 94 and in MHS on peri-infarct cortex.4,97 Ground is provided by a platinum needle (Technomed Europe, Maastricht, Netherlands or Grass Technologies, Warwick, RI, USA) or Ag/AgCl scalp electrode, or more simply, a self-adhesive Ag/AgCl patch electrode on the shoulder.161,196 For DC referential recordings, a platinum needle or Ag/AgCl sticky electrode is placed for a reference, usually on the mastoid or frontal apex away from muscle attachments. Recordings are usually performed for up to 14 days in aSAH and 7 days in other conditions.
The tail of the electrode strip is tunneled subcutaneously beneath the scalp and exited 2–3 cm from the craniotomy scalp incision. It should then be coiled and sutured to the scalp to provide strain relief and guard against accidental displacement. When the strip is implanted after craniotomy, the previously removed bone flap may be re-secured with a titanium clamp or plating system followed by standard wound closure paying special attention not to place any sutures around the electrode. Notably, the neurosurgeon should be aware of the following pitfalls: (a) gentle traction may not be sufficient to remove the strip after the monitoring period when the strip is trapped/pinched by the bone flap or the titanium fixation, or the subcutaneous tunnel is too tight; (b) a cerebrospinal fluid (CSF)-fistula may develop. Therefore, the following precautions should be taken: (a) sufficient bone should be removed with an osteotome or rongeur where the tail of the strip exits and through which the strip is withdrawn by gentle traction at the end of monitoring; (b) the tail of the strip should exit the craniotomy and scalp in line with the electrode strip and not be curved or bent at an angle; (c) no plating hardware should be used next to the location of the strip; and (d) the subcutaneous tunnel should be prepared sufficiently long and dilated, for example, with a Halsted-Mosquito clamp. To avoid a CSF-fistula, an additional fully penetrating skin suture should be performed at half-distance from the scalp exit point and a sufficient amount of absorbable hemostatic gelatin sponge should be placed under the bone flap, particularly in the area of the strip. Antibiotic treatment beyond standard preoperative prophylaxis is not recommended.
Analysis of 30 patients with severe aSAH who received a subdural strip for ECoG recordings and 30 control patients showed no evidence that procedures of the ECoG study led to any significant impairment of patients as assessed during clinical course and follow-up examination after 6 months. In particular, the subdural strip did not lead to any increased rate of hemorrhage or local damage of brain tissue as assessed through serial neuroimaging studies by a neuroradiologist or meningitis/ventriculitis. 75
For patients who do not require craniotomy for treatment of their injuries, it is also possible to place a subdural electrode strip through a burr hole. This has been routinely practiced in aSAH patients undergoing endovascular coil embolization at German neurosurgical centers for almost a decade,95,196 and for even longer in patients with intractable epilepsy.200,201 Another option is to monitor with an intraparenchymal electrode array (Spencer, 1.1 mm diameter, Ad-Tech, Racine, WI, USA) that can be tunneled from a burr hole or placed through a multi-lumen bolt, as is customary practice for ICP and ptiO2 monitoring.202,203 Such intraparenchymal sensors show a good safety profile. In a case series of 61 patients with acute brain injury undergoing invasive parenchymal brain monitoring, including use of depth electrodes, hemorrhage, and infections were rare. 204 The risk of a CSF-fistula is lower with a depth electrode compared to a subdural strip.
Yet, subdural strips also have advantages over intraparenchymal devices that inevitably cause minor necrosis at the insertion site. Histological and immunohistochemical analysis of brain tissue surgically resected from epilepsy patients suggested, for example, that depth electrodes cause upregulation of active inflammatory cell types and extravasation of plasma proteins, indicating significant local disruption of the blood-brain barrier (BBB), in an area that is 30 times the area of the physical insult. 205 Subdural electrode strips not only avoid this local insult, which might influence measured signals, but also permit recording from a larger cortical area. A study in this issue found that monitoring only a single cortical location, as with an intraparenchymal depth array, may fail to capture 43% of SDs that occur in a broader area of subdural strip monitoring. 120 Further, DC potential measurements with intraparenchymal electrodes might be strongly influenced by the large and complex SD-triggered changes in pH and ptiO2, which are less pronounced in the microenvironment of the cortical surface away from neurons. For example, pH typically changes by about 0.5 units9,10 and ptiO2 by up to 30 mmHg in the cortex during SD,95,96,161 and such changes generate large and complex interfering voltage shifts on platinum electrodes. Caution is however warranted regarding both subdural and parenchymal implants in patients receiving antiplatelet agents or having low platelet counts or dysfunctional platelets or other reasons for a bleeding diathesis.
Although Ag/AgCl and calomel electrodes are ideal for recording low-frequency potentials due to their resistive and nonpolarizing character, their toxicity precludes use for invasive recordings in patients. 206 Platinum electrodes by contrast are polarizable, and it has been assumed that this capacitive behavior distorts low frequency and DC potentials. Thus, clinical ECoG monitoring has been accomplished mainly with AC-coupled amplifiers with a 0.01–0.02 Hz lower frequency limit. It has only more recently become clear that DC-coupled amplifiers can be used for continuous ECoG monitoring as well, with the great advantage that DC shift durations can be measured, as discussed here and shown in the figures.16,58,95,196,207 The surprisingly high fidelity in recording these slow potentials is explained by the large contact area of electrodes and the high input impedance of amplifiers. 208 The practical experience of DC recordings suggests that they are a suitable substitute for AC techniques and are fully consistent with the present recommendations. 120
Nonetheless, it would be worthwhile to explore better electrode materials for invasive human applications and, beyond subdural recordings, noninvasive technologies such as continuous scalp EEG should be further advanced. 209 Although correlates of SD were clearly identified in continuous scalp EEG recordings when performed simultaneously with subdural ECoG,196,210 scalp EEG alone is not yet sufficient to reliably diagnose SDs and further studies of the combined technologies are strongly recommended. Scalp EEG may hold particular promise for noninvasive monitoring of SD if it is combined with other noninvasive technologies, such as near-infrared spectroscopy or diffuse correlation spectroscopy, that measure rCBF or its surrogates.211,212
Terminology
In the following and Table 1, we provide a set of terms that describe the various patterns of activity related to SD, based solely on observations from human recordings, 15 and without implied meaning, assumption of underlying mechanisms, or presumed effect on the tissue. We recommend use of these neutral terms and classifications as a common clinical language and to objectively evaluate hypotheses concerning the application of SD monitoring. In our opinion, terms such as spreading depression-like depolarization, peri-infarct depolarization, or brain injury depolarization have their historical place, but are either nonspecific or overly specific with connotations that may hinder objective analysis of the clinical data. Specifically, they obscure the fact that all SDs belong to the same class of waves which exist on a continuum and occur across a wide variety of clinical conditions.15,45
It is also emphasized that there are striking neurobiological differences between “depression” and “depolarization” as explained above. In fact, depressed activity can be associated with either neuronal depolarization (spreading depression) or neuronal hyperpolarization (nonspreading depression). 189 Although the terms depression and depolarization are often used interchangeably, awareness of the distinction between them is the key to understanding their divergent clinical implications. Furthermore, SD can occur without spreading depression, but not vice versa. Therefore, the term spreading depression should only be used if spreading depression of spontaneous activity is actually recorded.
Anoxic, asphyxial, and aglycemic SD are special cases at the extreme end of the SD continuum. Historically, they refer to the initial SD that is triggered by the corresponding insult, such as vascular occlusion and consequent severe ischemia in the case of anoxic SD.173,213,214 In such cases, energy compromise causes nonspreading depression of activity up to minutes before it causes SD, as explained above and shown in the left panel of Figure 8. However, anoxia/ischemia may also occur during SD in a manner that is distinct in both mechanism and electrophysiologic signature. Specifically, if the hemodynamic response to SD is inverted, SD can cause a severe ischemia (and hence, anoxia) that begins only after the onset of SD. 39 In such cases, SD can induce spreading depression of activity in the electrically active tissue that it invades (Figure 5). 2 Notably, the mechanisms responsible for anoxia/ischemia in these two conditions are very different, and for this reason we discourage use of anoxic SD or terms alike because they are ambiguous. Rather, we advocate properly describing and quantifying electrophysiological variables including the DC shift duration and amplitude and the depression pattern of a given SD to distinguish these conditions in an objective manner. In addition, invasive measurements of arterial pressure and local tissue ptiO2 can be informative by providing evidence of global arrest of the circulation and tissue anoxia, respectively. Further, serial neuroimages of delayed infarction in the recording area may provide post hoc evidence that SDs occurred in conjunction with severe focal hypoxia/ischemia. Figure 5 gives a good example for the complexity of such events.
Practical recommendations on how to record, score, and classify SDs
Box 1 summarizes the work flow of the basic analysis as explained below.
Basic analysis of baseline activity, SDs and IEEs in neurocritical care.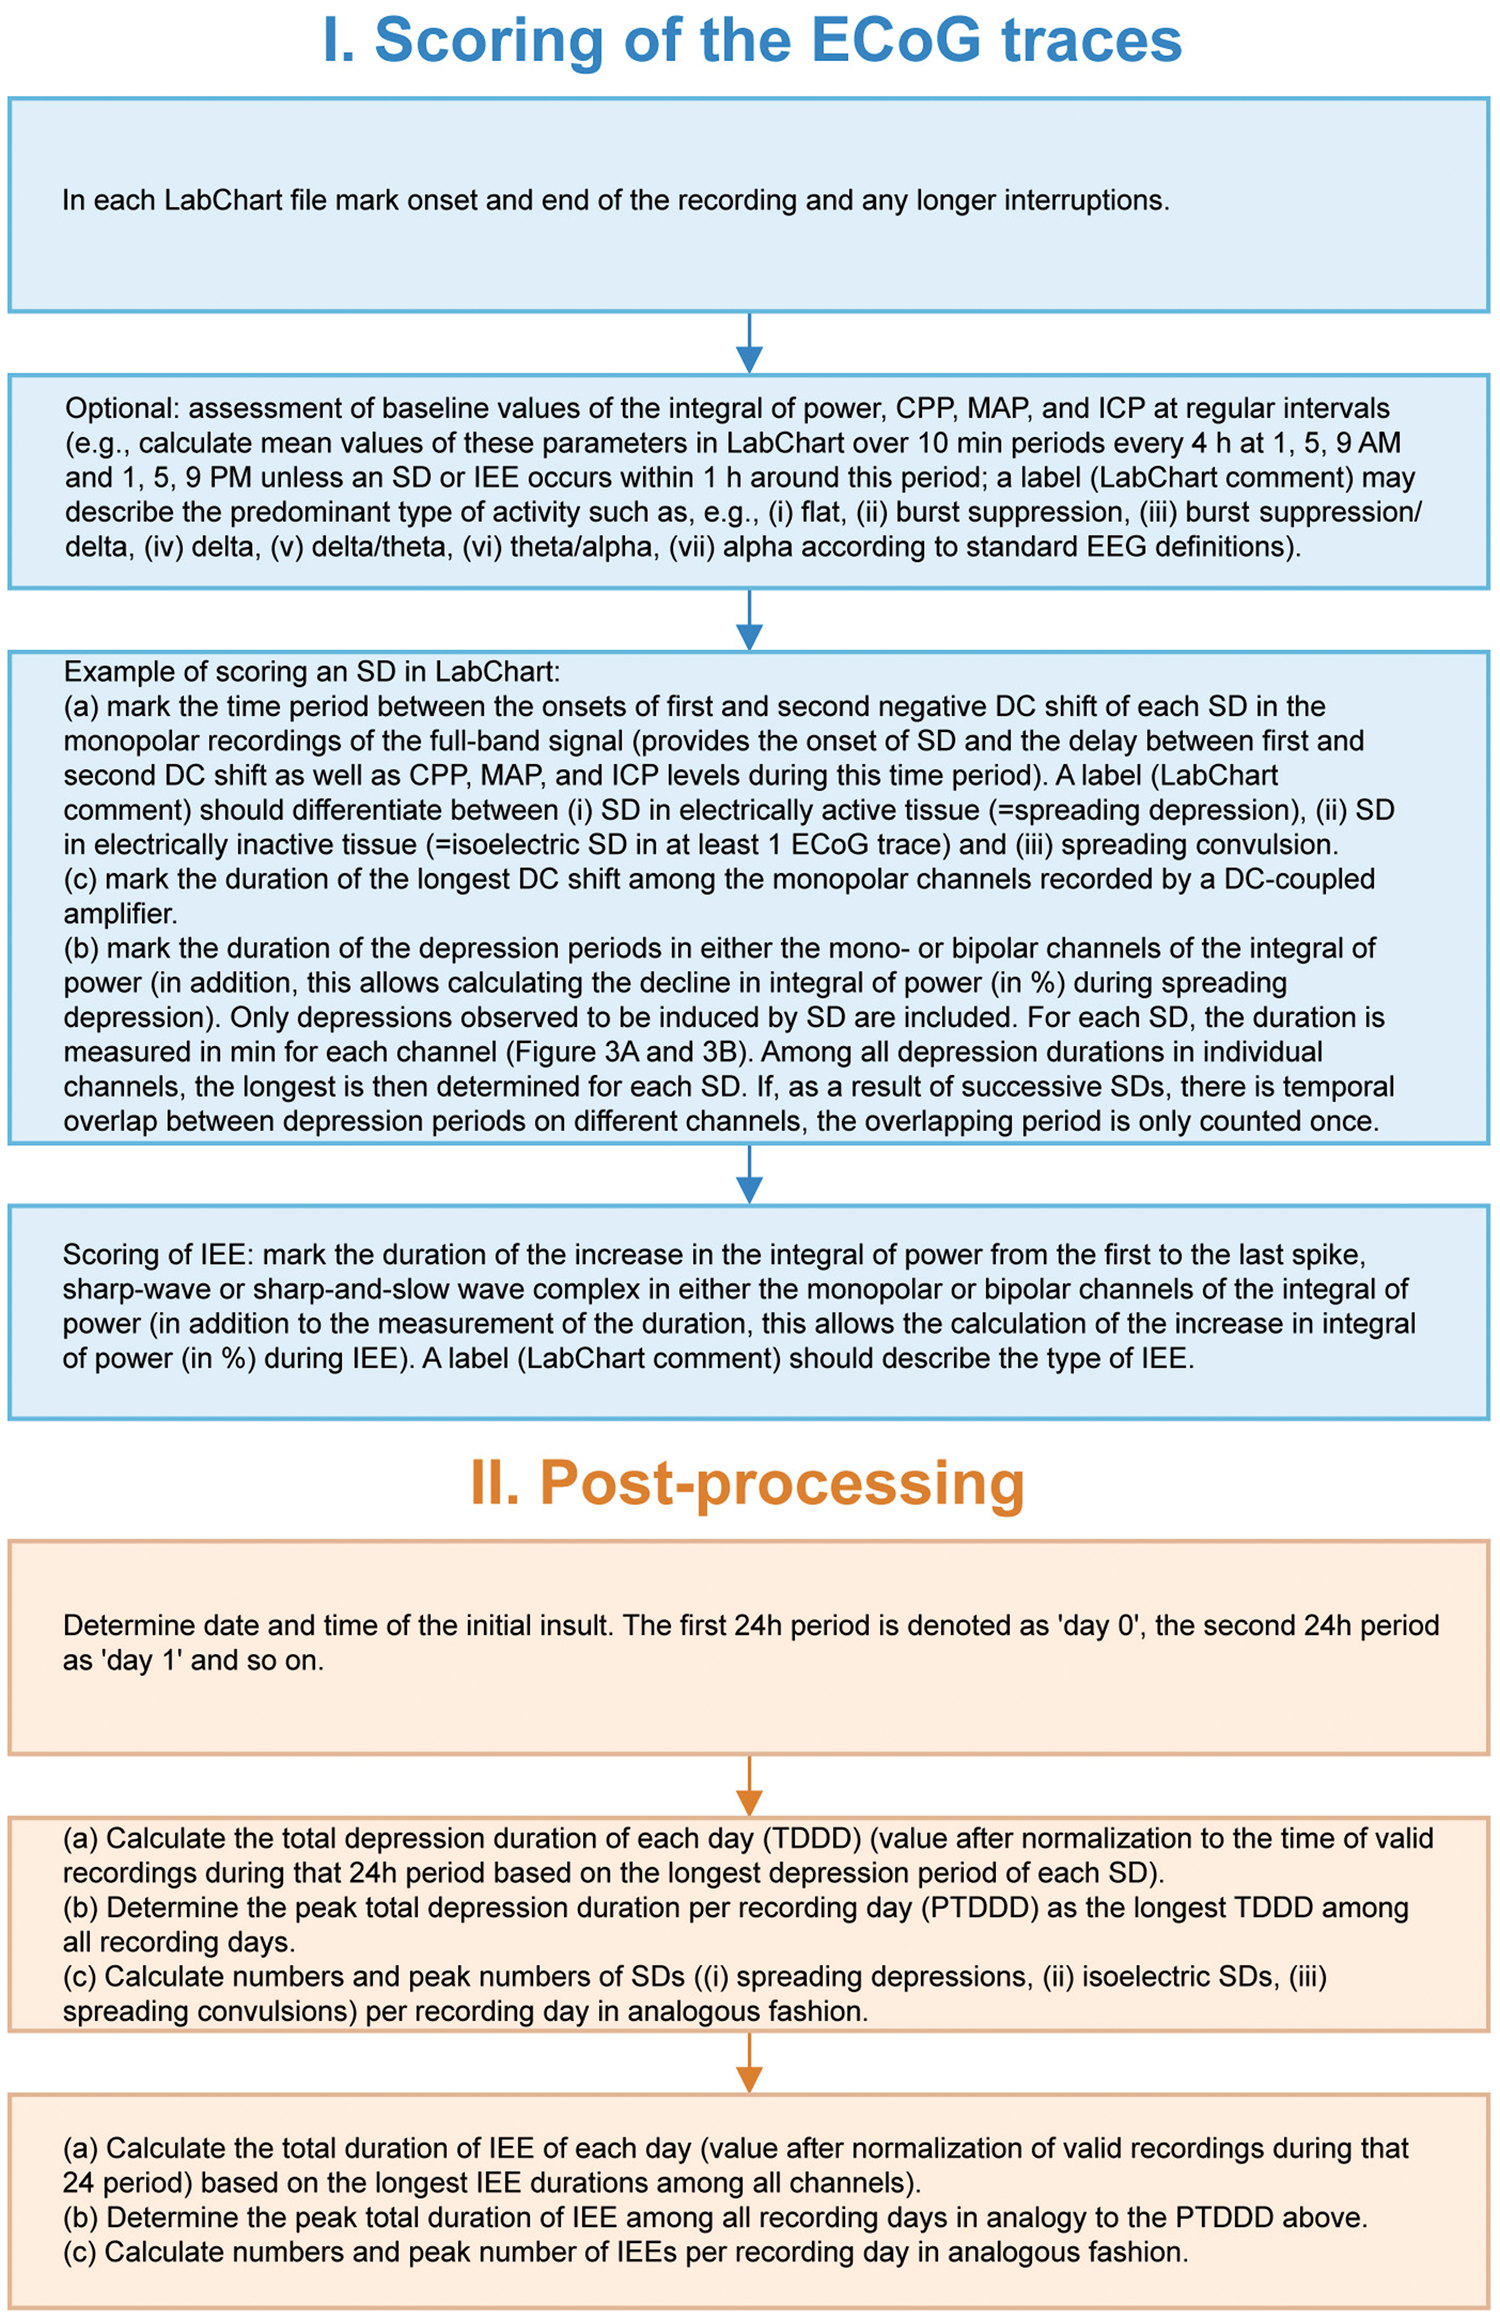
SD is used as the generic term for all waves in the human ECoG characterized by an abrupt, negative DC shift with sequential onset in adjacent electrodes (Figures 5 and 7).55,90 Assessment of the raw DC shift can only be achieved if the amplifier is DC-coupled, that is, has no lower frequency limit. With an AC-coupled amplifier with lower frequency limit of 0.01 or 0.02 Hz, the cortical DC shift of SD is distorted by the filtering190,215 but is still recorded as a stereotyped slow potential change (SPC) that serves as a hallmark signature of SD.90,215 The AC-recorded SPC thus merely serves as an identifier of SD,55,90 whereas the unfiltered DC shift also allows assessment of the local duration of SD and is a useful measure for (a) the tissue energy status and (b) the risk of injury (excitotoxicity) at the recording site, as explained above (Figure 3(c)).1,91,95,105,108,115 Hereafter, use of the term DC shift should be understood to refer also to SPC when AC-coupled amplifiers are used.
After recording, ECoG data are reviewed with the use of software such as LabChart (ADInstruments, Oxford, UK), a flexible platform that provides filtering and other signal processing functions and allows multiple display views. Here, DC shifts and depression durations can be observed in either monopolar (= unipolar = referential) (Figure 3(a) and (c)) or bipolar recordings (Figure 3(b)). In the bipolar ECoG montage, electrode 2 is subtracted from electrode 1, electrode 3 from 2, and so on. In the monopolar montage each electrode is referenced to an ipsilateral subdermal platinum electrode. Monopolar recordings are superior to bipolar recordings when local information on individual electrodes is of interest. In particular, the duration of DC shifts can only be reasonably evaluated in monopolar recordings. However, bipolar recordings provide a safeguard in the clinical setting in case the external reference for monopolar recordings is displaced during patient movements or nursing procedures. SD-induced depression durations and isoelectric SDs can be assessed in both bipolar and monopolar recordings, which is fortunate because these variables are important for diagnosis of new ischemic zones, as explained above. While bipolar recordings have been the most commonly used clinical standard, monopolar assessment of depression durations may be more useful for direct comparison to DC shifts. 120
Basic analysis of SDs/settings in LabChart software (ADInstruments).
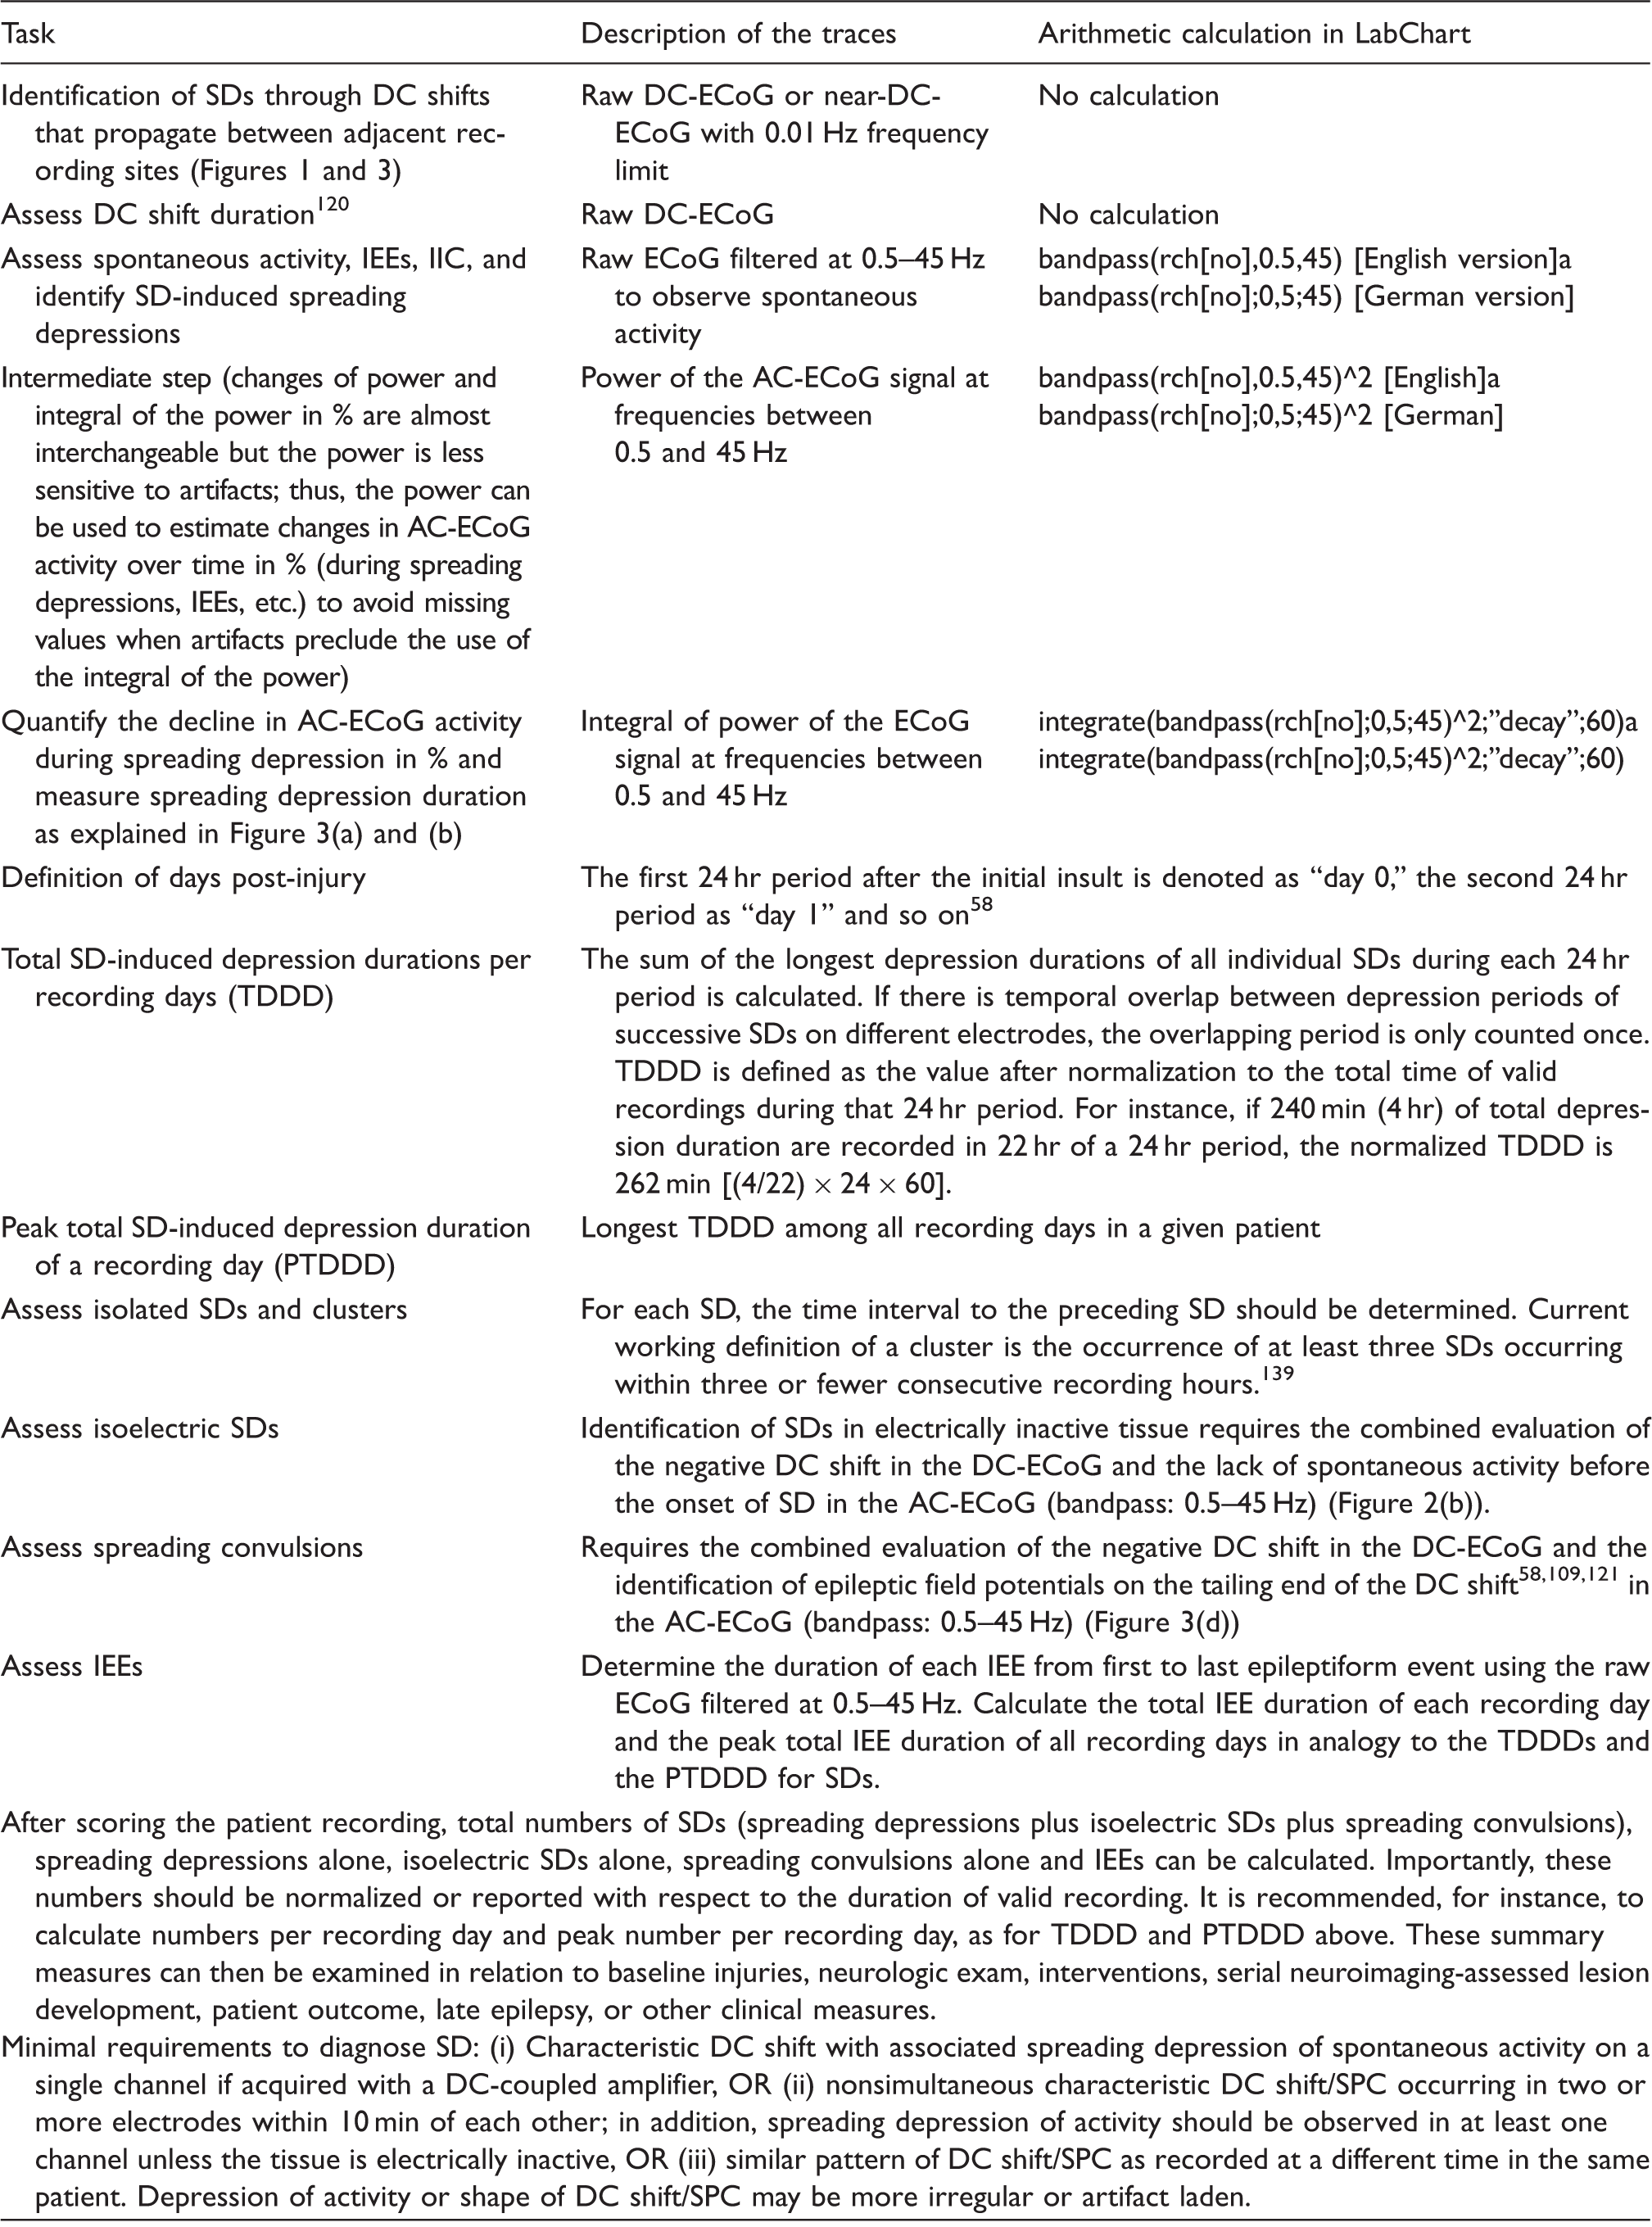
Note that the punctuation may vary according to the country settings.
Accepted minimal standards for scoring an event as SD requires either: (a) when using a DC-coupled system, an event which has a characteristic DC shift associated with spreading depression of spontaneous activity even if DC shift and spreading depression are restricted to a single channel; or (b) that there are characteristic, time-shifted DC changes (Figures 1–7) in two or more adjacent channels occurring within 10 min of each other; in addition, spreading depression of activity should be observed in at least one channel if the tissue is electrically active.
Identification of SDs is usually straightforward after training to distinguish the characteristic waveforms from other confounding physiologic or artifactual changes. 120 In cases of doubt, it is often useful to screen all recordings of a given patient because SDs have been observed to frequently repeat in a stereotyped pattern. Some events following the same pattern may be more easily identified as SD than others. Once the pattern is understood it is easier to see all SDs. If the same pattern of DC shifts is observed to repeat, an event may even be scored as SD if the above criteria are not as readily visible (e.g., artifact interferes with the DC shift on one or more channels). Diagnostic accuracy can further be improved in difficult cases when typical responses of ptiO2 or rCBF to SD are available (Figures 2, 4, and 7). However, if significant doubt remains we strongly recommend that questionable events are not scored as SDs to avoid false positives. DC shifts that occur simultaneously across all leads, or those occurring with instantaneous changes rather than smooth contours, should never be considered SD.
Events should be scored as a new event if a subsequent DC shift at a given electrode can be scored as an independent event per the criteria above. This may be particularly relevant in quickly recurrent events, and since repeated events and clusters are important prognostic factors, they should be accurately recorded. Currently, NUPs are not routinely scored due to difficulty in differentiating from drift in DC systems.
For each SD, the depression durations are calculated in minutes for each channel, as shown in Figure 3(a) and (b). Only depressions observed to be induced by SD are included. Among all depression durations in individual channels, the longest is then determined for each SD. Subsequently, the total depression duration of each 24 hr period following the initial insult is calculated as the sum of the longest depression durations of all individual SDs during that 24 hr period. If there is temporal overlap between depression periods of successive SDs on different electrodes, the overlapping period is only counted once. The first 24 hr period is usually denoted as “day 0,” the second 24 hr period as “day 1,” and so on. 58 Subsequently, the total depression duration of each day (TDDD) is defined as the value after normalization to the total time of valid recordings during that 24 hr period. 64 For instance, if 240 min (4 h) of total depression duration are recorded in 22 hr of a 24 hr period, the normalized TDDD is 262 min [(4/22) × 24 × 60]. The peak total depression duration per recording day (PTDDD) is then defined as the longest TDDD among all recording days in a given patient.
The basic ECoG analysis also dichotomizes between SDs in electrically active tissue that receive the epithet “spreading depression” and SDs measured in a zone of electrically inactive tissue, denoted with the adjective “isoelectric.” 91 Even if the DC shift arises from electrically inactive tissue in only one channel, the SD is documented as being isoelectric (e.g., Figure 6). Definitions of IEE and ictal-interictal continuum (IIC) are given in Table 1. If epileptiform field potentials arise on the tailing end of the DC shift this should be documented as “spreading convulsion” which is a historical term based on van Harreveld and Stamm (Figure 3(d)).58,109,121 If a spreading convulsion occurs in isoelectric tissue it may also be documented as “isoelectric SD” depending on the scope of the study. The caveat is added that pulse artifacts are often observed during the DC shift of isoelectric SDs and should not be mistaken for epileptiform field potentials. 58
After scoring the patient recording, total numbers of SDs (spreading depressions plus isoelectric SDs plus spreading convulsions), spreading depressions alone, isoelectric SDs alone, spreading convulsions alone, and IEEs can be calculated. Importantly, these numbers should be normalized or reported with respect to the duration of valid recording. It is recommended, for instance, to calculate numbers per recording day and peak number per recording day, as for TDDD and PTDDD above. These summary measures can then be examined in relation to baseline injuries, neurologic exam, interventions, serial neuroimaging-assessed lesion development, patient outcome, late epilepsy, or other clinical measures.
Nonspreading depression is observed as a simultaneous arrest of spontaneous activity in neighboring electrodes. However, the criteria of nonspreading depression are only fulfilled if either invasive measurements of arterial pressure prove a global arrest of the circulation or local measurements of ptiO2 indicate severe tissue hypoxia/ischemia. Otherwise, the nature of this ECoG pattern remains ambiguous.
A basic neuromonitoring protocol should also include, at least, recordings of arterial pressure, ICP, CPP, and body or brain temperature that can be reviewed together with ECoG data. Particularly with high-resolution (waveform) recordings, these variables can assist in deciphering cause and effect of multivariate physiologic changes, and are further helpful in identification of ECoG artifacts. Baseline values can also be documented at regular intervals to chart the course of neuromonitoring variables in relation to SDs. ptiO2 recordings with a sensor based on either polarography or luminescence quenching are also informative.63,216–219 When the sensor is located next to the electrode strip, ptiO2 responses to SD should be examined in a small range of ≤6 min around time points of SD appearance. 96 The ptiO2 level immediately preceding SD and at least amplitude and duration of the initial change of ptiO2 in response to SD should be analyzed. The initial change of ptiO2 can show either a decrease, no change or an increase.95,96 The ptiO2 level immediately preceding SD was previously defined as the mean ptiO2 level in the 5 min period prior to each SD. 184 Simultaneously, CPP, mean arterial pressure (MAP) and ICP can also be documented.
Conclusion
After many decades of frustration, it has turned out to be surprisingly simple to record SDs from the human brain with minimally invasive technology.89,92 Now it is time to make use of one of the most phylogenetically preserved and fundamental pathological phenomena of the brain to advance understanding of human disease.220,221 For this purpose, the recommendations proposed here have been developed based on our cooperative studies for more than a decade. Further insight into clinical application, less invasive approaches, and automation of procedures are likely to render SD monitoring an increasingly potent tool for real-time diagnosis of disturbed brain energy metabolism and lesion development in neurocritical care.
Footnotes
Funding
The author(s) disclosed receipt of the following financial support for the research, authorship, and/or publication of this article: This work was supported by Deutsche Forschungsgemeinschaft (DFG DR 323/6-1), the Bundesministerium für Bildung und Forschung (Center for Stroke Research Berlin, 01 EO 0801; BCCN 01GQ1001C B2), and Era-Net Neuron 01EW1212 to Dr Dreier, NeuroCure SESAH (EXC 257/2) to Drs Dreier and Heinemann, and DFG DR 323/5-1 to Drs Dreier, Woitzik, Vajkoczy, Sakowitz, Graf, Vatter, and Friedman. This work was supported by the Mayfield Education and Research Foundation to Dr Hartings and the Hungarian Scientific Research Fund (Grant No. K111923 to Farkas), the Bolyai János Research Scholarship of the Hungarian Academy of Sciences (BO/00327/14/5) to Dr Farkas, and the National Institutes of Health (NS083858) to Dr Kirov. Dr Sahuquillo is a recipient of a grant from the Fondo de Investigación Sanitaria (Instituto de Salud Carlos III) (FIS PI08/0480) co-financed by the European Regional Development Fund (ERDF). This work was also supported by the Toyota Foundation to Drs Fabricius and Friberg. Dr Boutelle is supported by Wellcome Trust/UK Dept of Health under the HICF Scheme (WT094912/HICF-1010-080).
Declaration of conflicting interests
The author(s) declared no potential conflicts of interest with respect to the research, authorship, and/or publication of this article.
Authors’ contributions
JP Dreier and JA Hartings drafted and finalized the manuscript and approved the manuscript before submission. All other authors contributed to the manuscript and approved the manuscript before submission.