
Abstract
Spreading depolarization (SD) is associated with profound oligemia and reduced oxygen availability in the mouse cortex during the depolarization phase. Coincident pial arteriolar constriction has been implicated as the primary mechanism for the oligemia. However, where in the vascular bed the hemodynamic response starts has been unclear. To resolve the origin of the hemodynamic response, we used optical coherence tomography (OCT) to simultaneously monitor changes in the vascular tree from capillary bed to pial arteries in mice during two consecutive SDs 15 minutes apart. We found that capillary flow dropped several seconds before pial arteriolar constriction. Moreover, penetrating arterioles constricted before pial arteries suggesting upstream propagation of constriction. Smaller caliber distal pial arteries constricted stronger than larger caliber proximal arterioles, suggesting that the farther the constriction propagates, the weaker it gets. Altogether, our data indicate that the hemodynamic response to cortical SD originates in the capillary bed.
Introduction
Spreading depolarization (SD) is a pandepolarization wave that slowly propagates (∼3 mm/min) in gray matter and affects all cell types in the tissue. First described by Leão in 1944, 1 SD is now recognized as the mechanism underlying migraine aura.2,3 Moreover, in injured brains numerous spontaneous SDs occur as a result of tissue oxygen supply-demand mismatch transients and are believed to be detrimental to tissue survival.4–7 Therefore, SD is believed to contribute to the pathophysiology of diverse neurovascular diseases from migraine to brain injury.
The cerebral blood flow (CBF) response to SD is among the largest observed in the brain. 8 In healthy brain tissue in most species, SD elicits a large hyperemia lasting a few minutes, followed by mild oligemia lasting up to an hour. In mice, however, the initial response is a marked hypoperfusion often reaching ∼50% of baseline, which coincides with the depolarization phase and causes severe oxygen supply-demand mismatch.9–11 Severe pial and penetrating arteriolar constriction has been thought to underlie this initial hypoperfusion. 10 More recently, however, pericyte constriction has been implicated. 12 Therefore, the vascular compartment responsible for the profound hypoperfusion during SD in mice has been unclear.
Here, we used high-resolution optical coherence tomography (OCT) to determine the temporal sequence of responses in the capillary bed, penetrating arterioles and pial arteries, in relation to the propagating depolarization wave. Our results show that the capillary flow reduction precedes penetrating arteriole and pial artery constriction by many seconds and cannot be explained by upstream vasoconstriction.
Materials and methods
Experiments were approved by the Massachusetts General Hospital Institutional Animal Care and Use Committee following the NIH Guide for Use and Care of Laboratory Animals, and data are reported in accordance with the ARRIVE guidelines.
General surgical preparation and monitoring
Male C57BL/6 mice (13–15 weeks of age, 24-29 grams, n = 6) were anesthetized using 1% isoflurane in 70% N2O and 30% O2 mixture using a nose cone. Arterial blood pressure (BP), pO2, pCO2 and pH were measured via a femoral artery catheter. Rectal temperature was maintained at 37 °C using a servo-controlled heating pad. Hydration was maintained by intraperitoneal injections of 0.05 ml dextrose 5% (w/v) every hour.
Closed cranial window preparation
Mice were placed in a stereotaxic frame and a closed cranial window was constructed under saline cooling over the left hemisphere (2 mm diameter, centered 2 mm lateral, 1.5 mm posterior to bregma; Figure 1), filled with 1% agarose in artificial cerebrospinal fluid, covered by a 5-mm diameter glass coverslip and sealed by dental cement. Laser Doppler-flowmetry (LDF) was used to confirm the absence of any unintentional mechanical SD induction during the preparation as an exclusion criterion. A second burr hole was drilled over the left occipital cortex to induce SD (1 mm diameter, centered 4 mm lateral, 4 mm posterior to bregma). Animals were then allowed to rest for at least 45 minutes to recover.
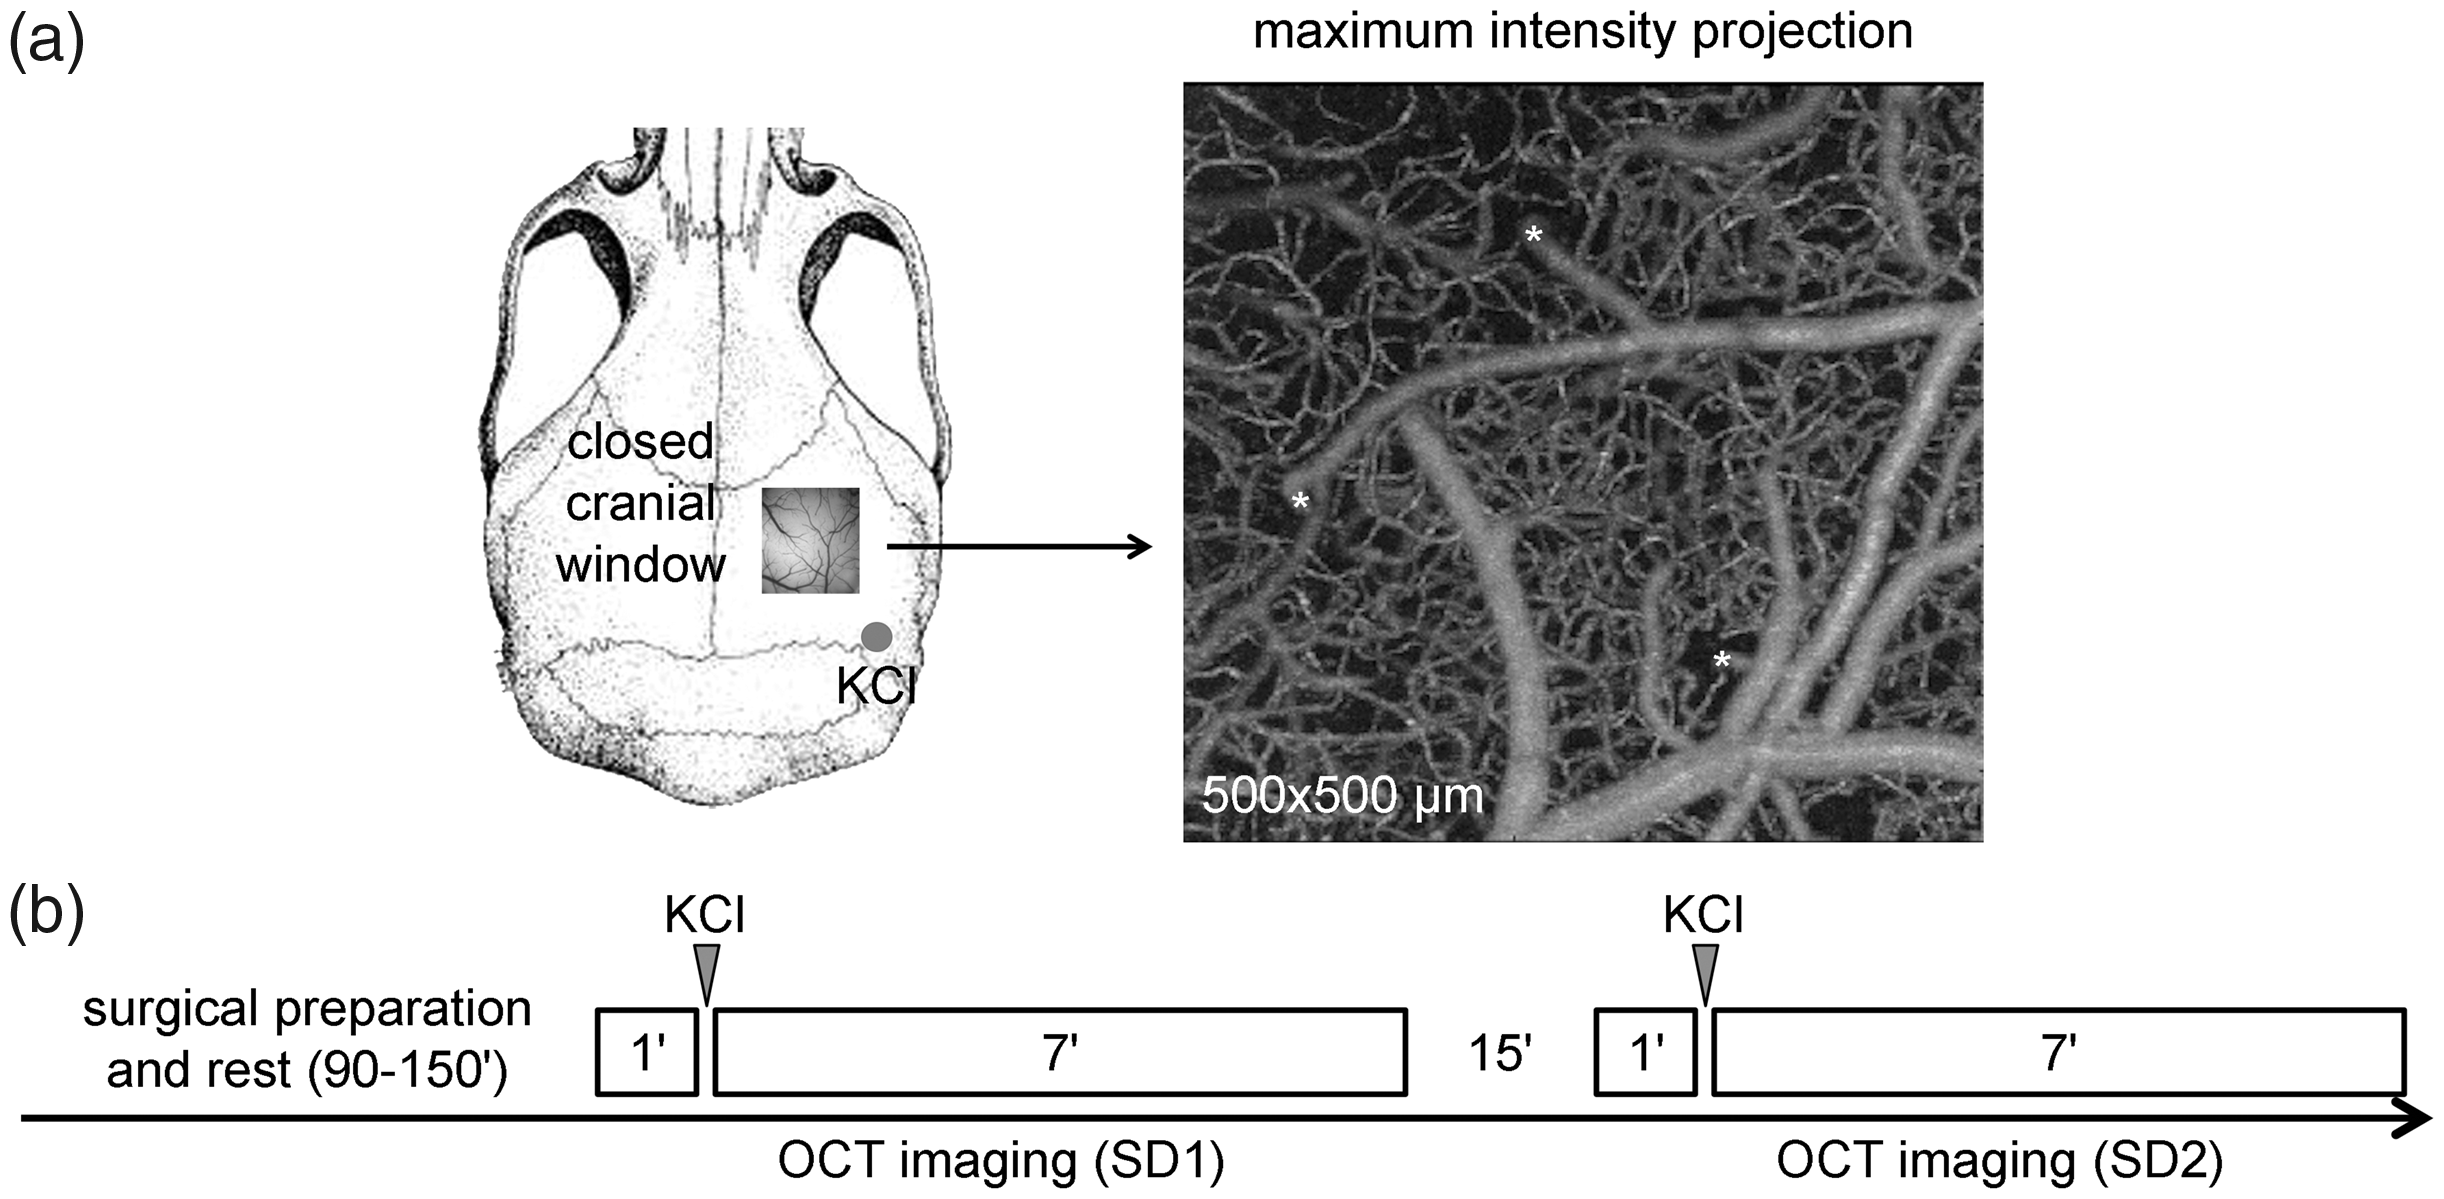
Experimental design and timeline. (a) A closed cranial window was constructed over the right parietal cortex. A small burr hole was opened over parietooccipital cortex for topical KCl application. Full-depth OCT angiograms were obtained with a field of view of 500 × 500 µm centered in the window. Pial vessels were identified under a bright field microscope as either veins or arteries. Penetrating arterioles (*) were identified as shown. (b) Experimental timeline.
SD induction
SD was induced by briefly placing a cotton ball (1 mm in diameter) soaked with 1 M KCl over the occipital burr hole approximately 50 seconds after OCT imaging was initiated and followed immediately by saline wash. A second SD was triggered in the same manner 16 minutes after completion of the first SD imaging session.
OCT imaging and analysis
OCT measures optical scattering in biological tissues with µm resolution, down to 1–2 mm depth. 13 Moreover, in comparison to traditional confocal and two-photon microscopy, OCT is label-free and is superior in terms of volumetric imaging speed by concurrently resolving all voxels along the imaging depth.14–16 Here, we used a 1300 nm spectral domain OCT operating at 46 kHz14,17 to measure the angiogram and scattering changes during SD progression. The axial resolution was 3.5 µm in tissue. The transverse resolution was 3.5 µm using a 10× objective (numerical aperture 0.26). In each animal, 107 volumetric angiograms were acquired with repeated B-lines for each SD over a period of ∼8 minutes (Figure 1). In each volume, high-resolution images were acquired over a 500 × 500 µm field of view with a transverse pixel size of 1.95 µm. We chose these parameters in order to optimize the tradeoff between temporal and spatial resolution during SD propagation. Finer scanning steps in our pilot studies came at the expense of longer acquisition time, with which we could not capture the SD wave front reliably within our FOV. With the selected parameters, acquisition time was 3.48 seconds for each angiogram.
Image analysis was performed using Matlab. OCT angiogram was obtained by the intensity difference of the repeated B-lines. 14 Maximum intensity projection was used to represent the en-face angiogram over a depth of 100 µm. Pial vessels were identified under a bright field microscope as either veins or arteries. The OCT maximum intensity projection angiograms helped locate the penetrating arterioles (Figure 1, *). Pial arteriolar diameter changes during SD were measured using ImageJ after enhancing the image contrast by 0.3% and applying a 3-D mean filter to optimize the detection of vessel outlines. Penetrating arterioles were analyzed using change in the number of perfused pixels in pre-defined regions of interest (ROIs) placed on the vertical plane at 50-100 µm depth (slice thickness ∼35 and ∼25 µm in X and Y dimensions, respectively). Capillary perfusion was analyzed in pre-defined ROIs at 150–300 µm depth without large vessels using change in the number of perfused pixels, after vessel enhancement filtering and thresholding, 18 which increases the contrast between vessel type structures and background by choosing a threshold value based on visual inspection, in order to segment capillaries from the background. 19 We maintained the imaging field and system acquisition parameters during the experiment, and used the same threshold value to segment capillaries before and after the SD. Of note, a threshold exists below which OCT fails to detect very slow erythrocytes, and therefore underestimates the density of filled vessels. 20 Nevertheless, the measurement serves as an index of severe capillary flow disturbance.
We identified the SD wavefront by tissue scattering change, which is coincident with the slow potential shift marking the depolarization phase of SD.21–27 A baseline intensity volume was generated by averaging 3 consecutive volumes before the SD. The scattering change was obtained by subtracting the baseline intensity volume from the current volume of interest. En-face scattering change was obtained by averaging the volumetric scattering change over imaging depth. We set the time that SD arrived in an ROI as time 0 to co-register and plot the time courses of arteriolar diameter and capillary perfusion changes over time.
Statistical analysis
In the absence of an intervention or group comparisons, blinding was not applicable. Data normality was tested using Shapiro-Wilk test, and non-normal distributed data were analyzed using non-parametric tests. The results are expressed as the mean ± standard deviation. All statistical tests are indicated where the data are presented.
Results
Epidural KCl application onto the parietal cortex triggered an SD in all mice. The SD wave was associated with an abrupt reduction in perfused capillary density accompanied by arteriolar constriction propagating across the imaging field (Figure 2(a)). Using the scattering changes associated with SD wave front as a marker for SD onset in each ROI (i.e. time 0; Figure 2(b)), we temporally co-registered all ROIs and found that the capillary perfusion dropped much earlier and more abruptly than the pial artery diameter after SD onset (Figure 2(c)). The nadir in capillary perfusion was reached nearly 10 seconds before the maximal pial arteriolar constriction. Penetrating arterioles constricted with a latency between the capillary bed and the pial artery (p = 0.036; n = 11 pial and 10 penetrating arteries for SD1, 10 pial arteries for SD2; Figure 2(d)). Thus, hemodynamic changes clearly progressed from smaller to larger caliber vessel segments after SD onset, indicating that capillary perfusion drop was independent of upstream constriction.
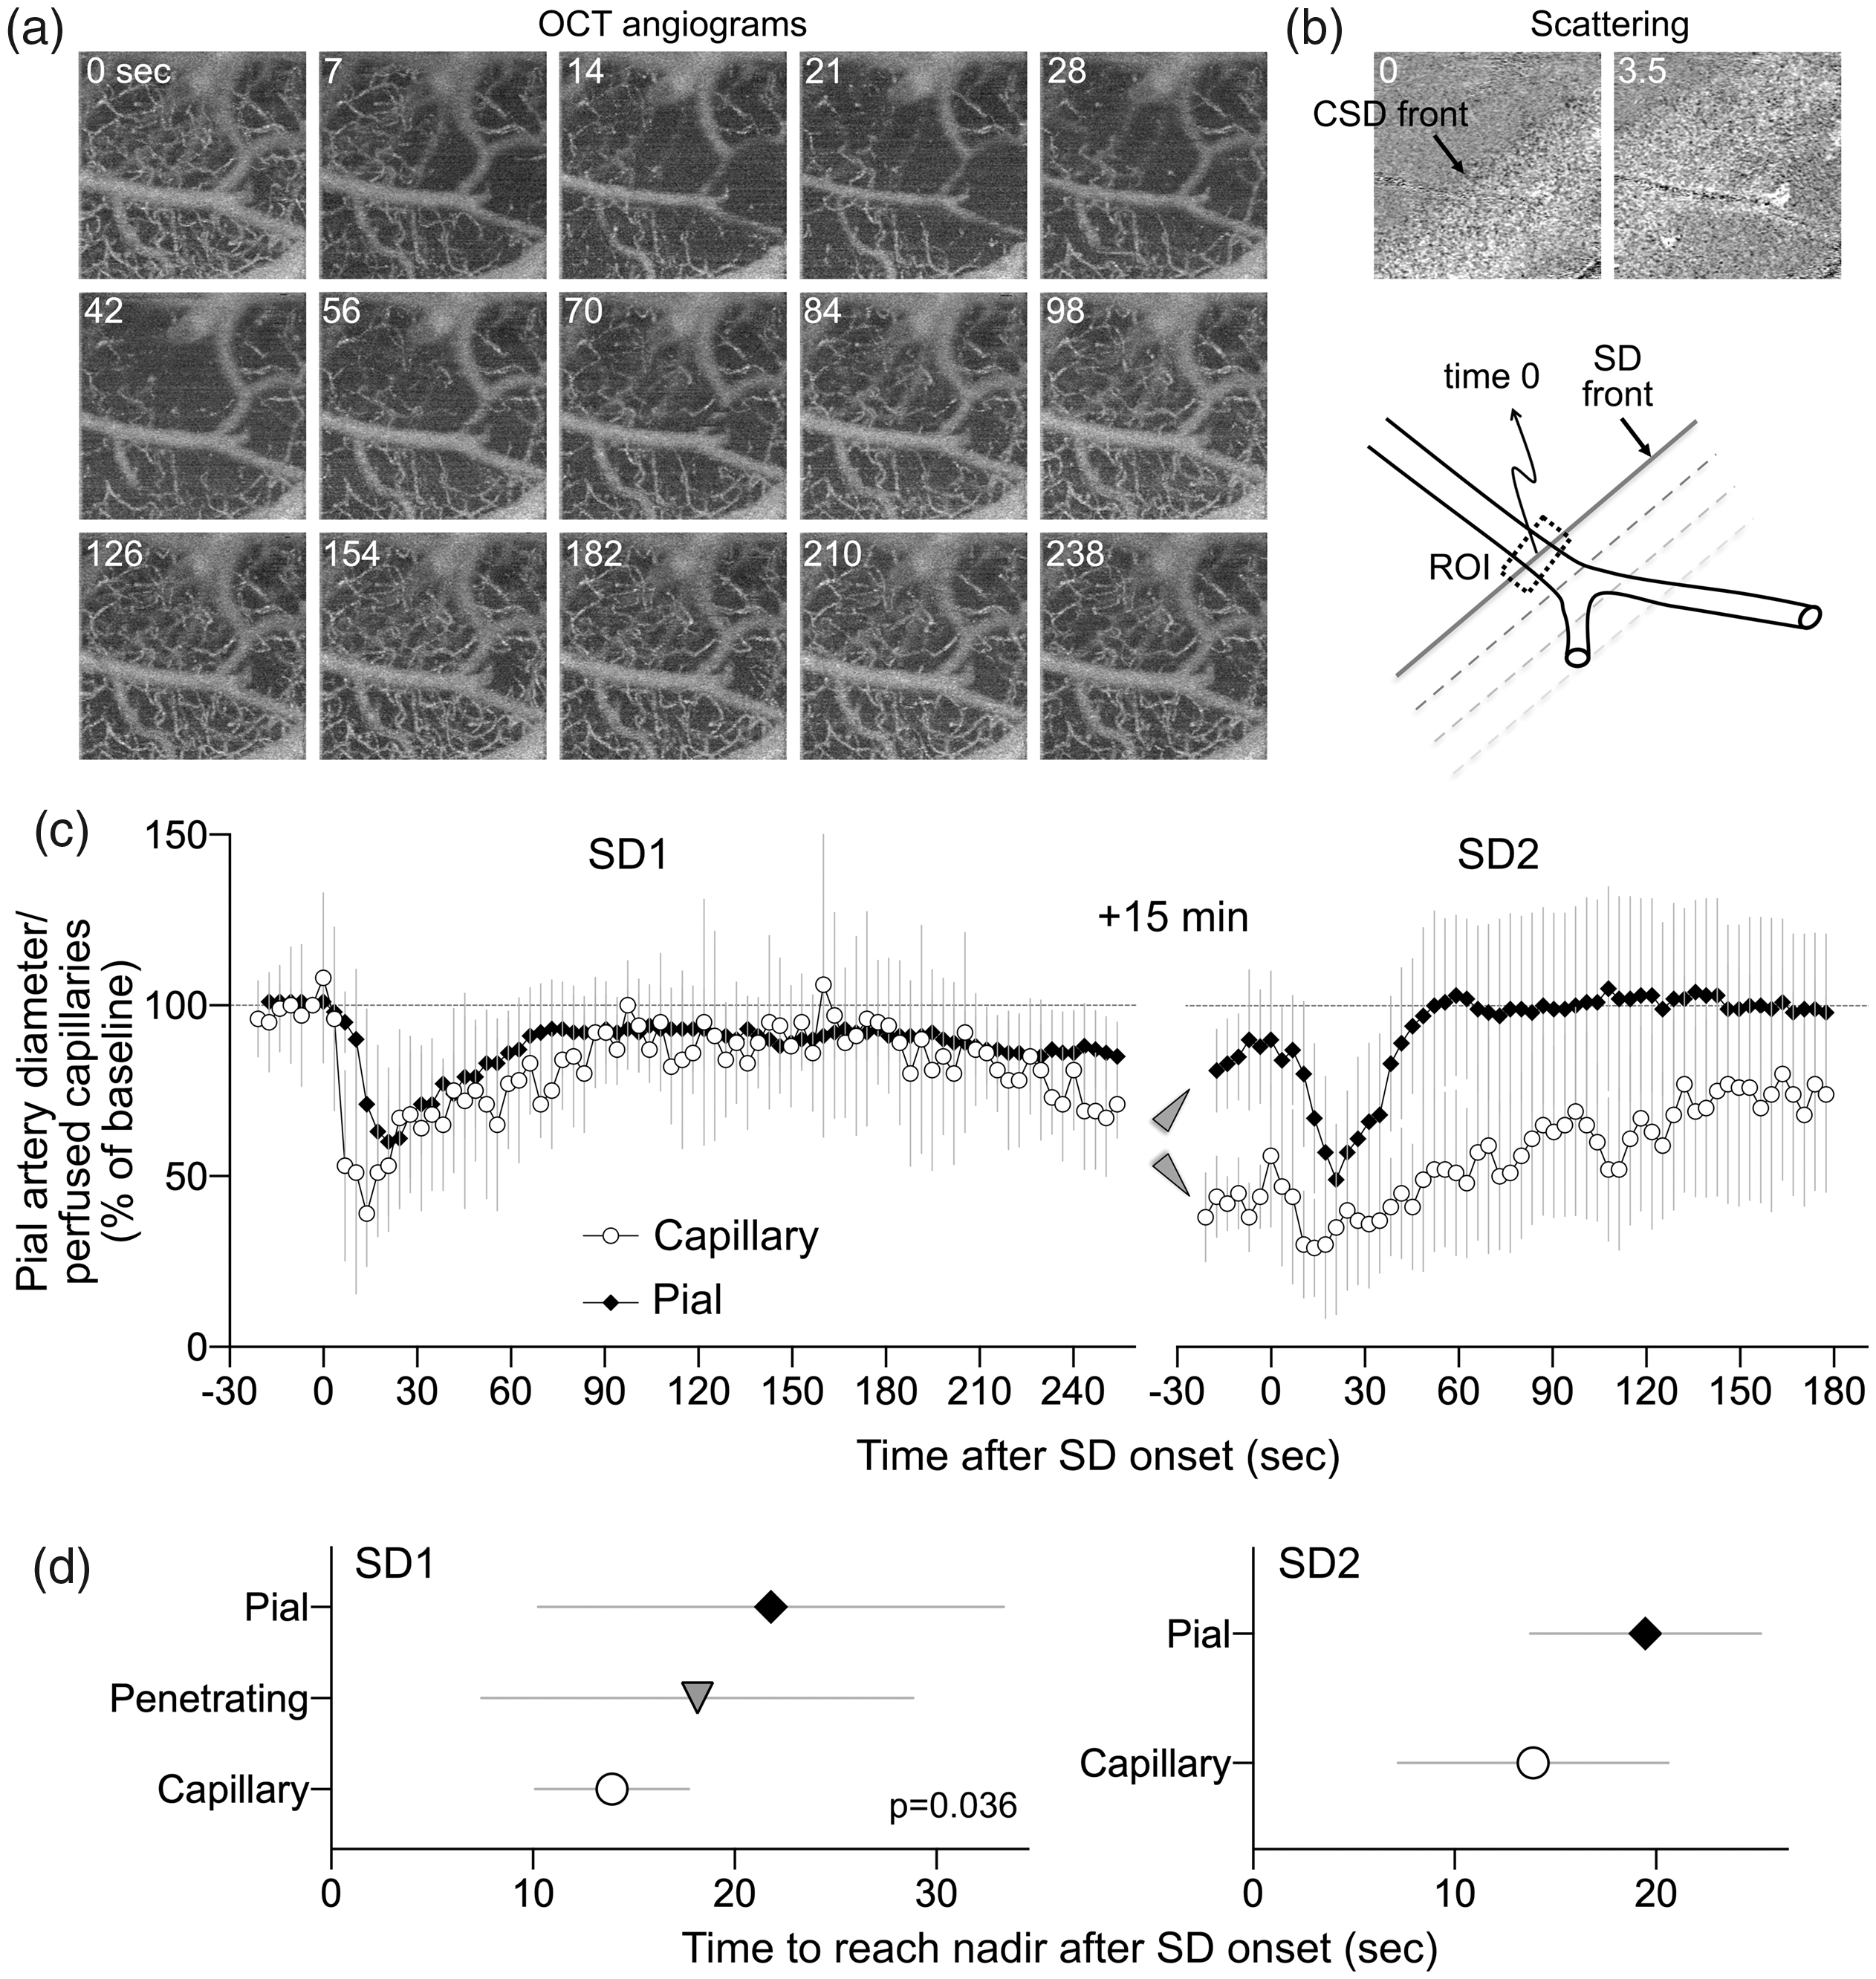
SD-induced changes in capillary perfusion and arteriolar diameter. (a) Time lapse OCT angiograms showing SD propagation across the field of view (right to left). Time is indicated on upper left (sec). (b) Scattering changes associated with SD were used to identify the wave front. Time when the wave front reached the ROI is taken as time 0 to temporally co-register all ROIs (a pial arteriolar ROI is shown as an example). (c) Perfusion signal changes over time expressed as percent of baseline during two consecutive SDs 15 minutes apart. Note that capillary response was calculated using the number of pixels with perfused capillaries, whereas arteriolar response was calculated using average OCT signal intensity within the ROI, precluding comparison of the magnitude and slope of the response among these segments. Arrowheads point to the difference between pial arterial and capillary post-SD oligemia. (d) Because averaging individual time courses from each ROI obscured the timing of responses individually, we measured the time to reach nadir during SD for each ROI in each animal. The time to reach nadir significantly differed among the vascular segments with a progression from capillary to penetrating followed by pial arteries (one-way ANOVA). Penetrating arterioles were not easily identified during the second SD and therefore not analyzed. Data are mean ± standard deviation.
In the wake of SD, both capillary perfusion and pial arteriolar diameter decreased as was evident at the beginning of the second imaging session 15 minutes later (Figure 2(c), arrowheads). This was consistent with post-SD oligemia. However, the decrease in capillary perfusion (∼60%) was much more severe than the mild pial arteriolar constriction (∼20%), once again highlighting a dissociation between capillary perfusion and pial arterial caliber. The vascular response to the second SD was similar to the first, with decreased capillary perfusion once again leading ahead of the pial arterial constriction; penetrating arterioles were not reliably identified during second SD, and therefore, not analyzed.
Since the propagation speed of SD wave front does not significantly differ between superficial and deeper cortical layers within the depth range (<300 µm) studied herein, 28 these data suggested that the effect of SD on vasculature started within the capillary bed and propagated upstream along the vasculature. Therefore, we next examined the relationship between baseline pial arterial diameter and the magnitude of constriction during SD (Figure 3(a)). Pial arteries constricted by nearly 50% on average during SD (Figure 3(b)). We found an inverse relationship where more distal, smaller caliber arterioles constricted more than the proximal, larger caliber vessels (R2=0.44, p = 0.025). This was consistent with an upstream conduction of SD-induced vasomotor changes along the vascular wall. 23
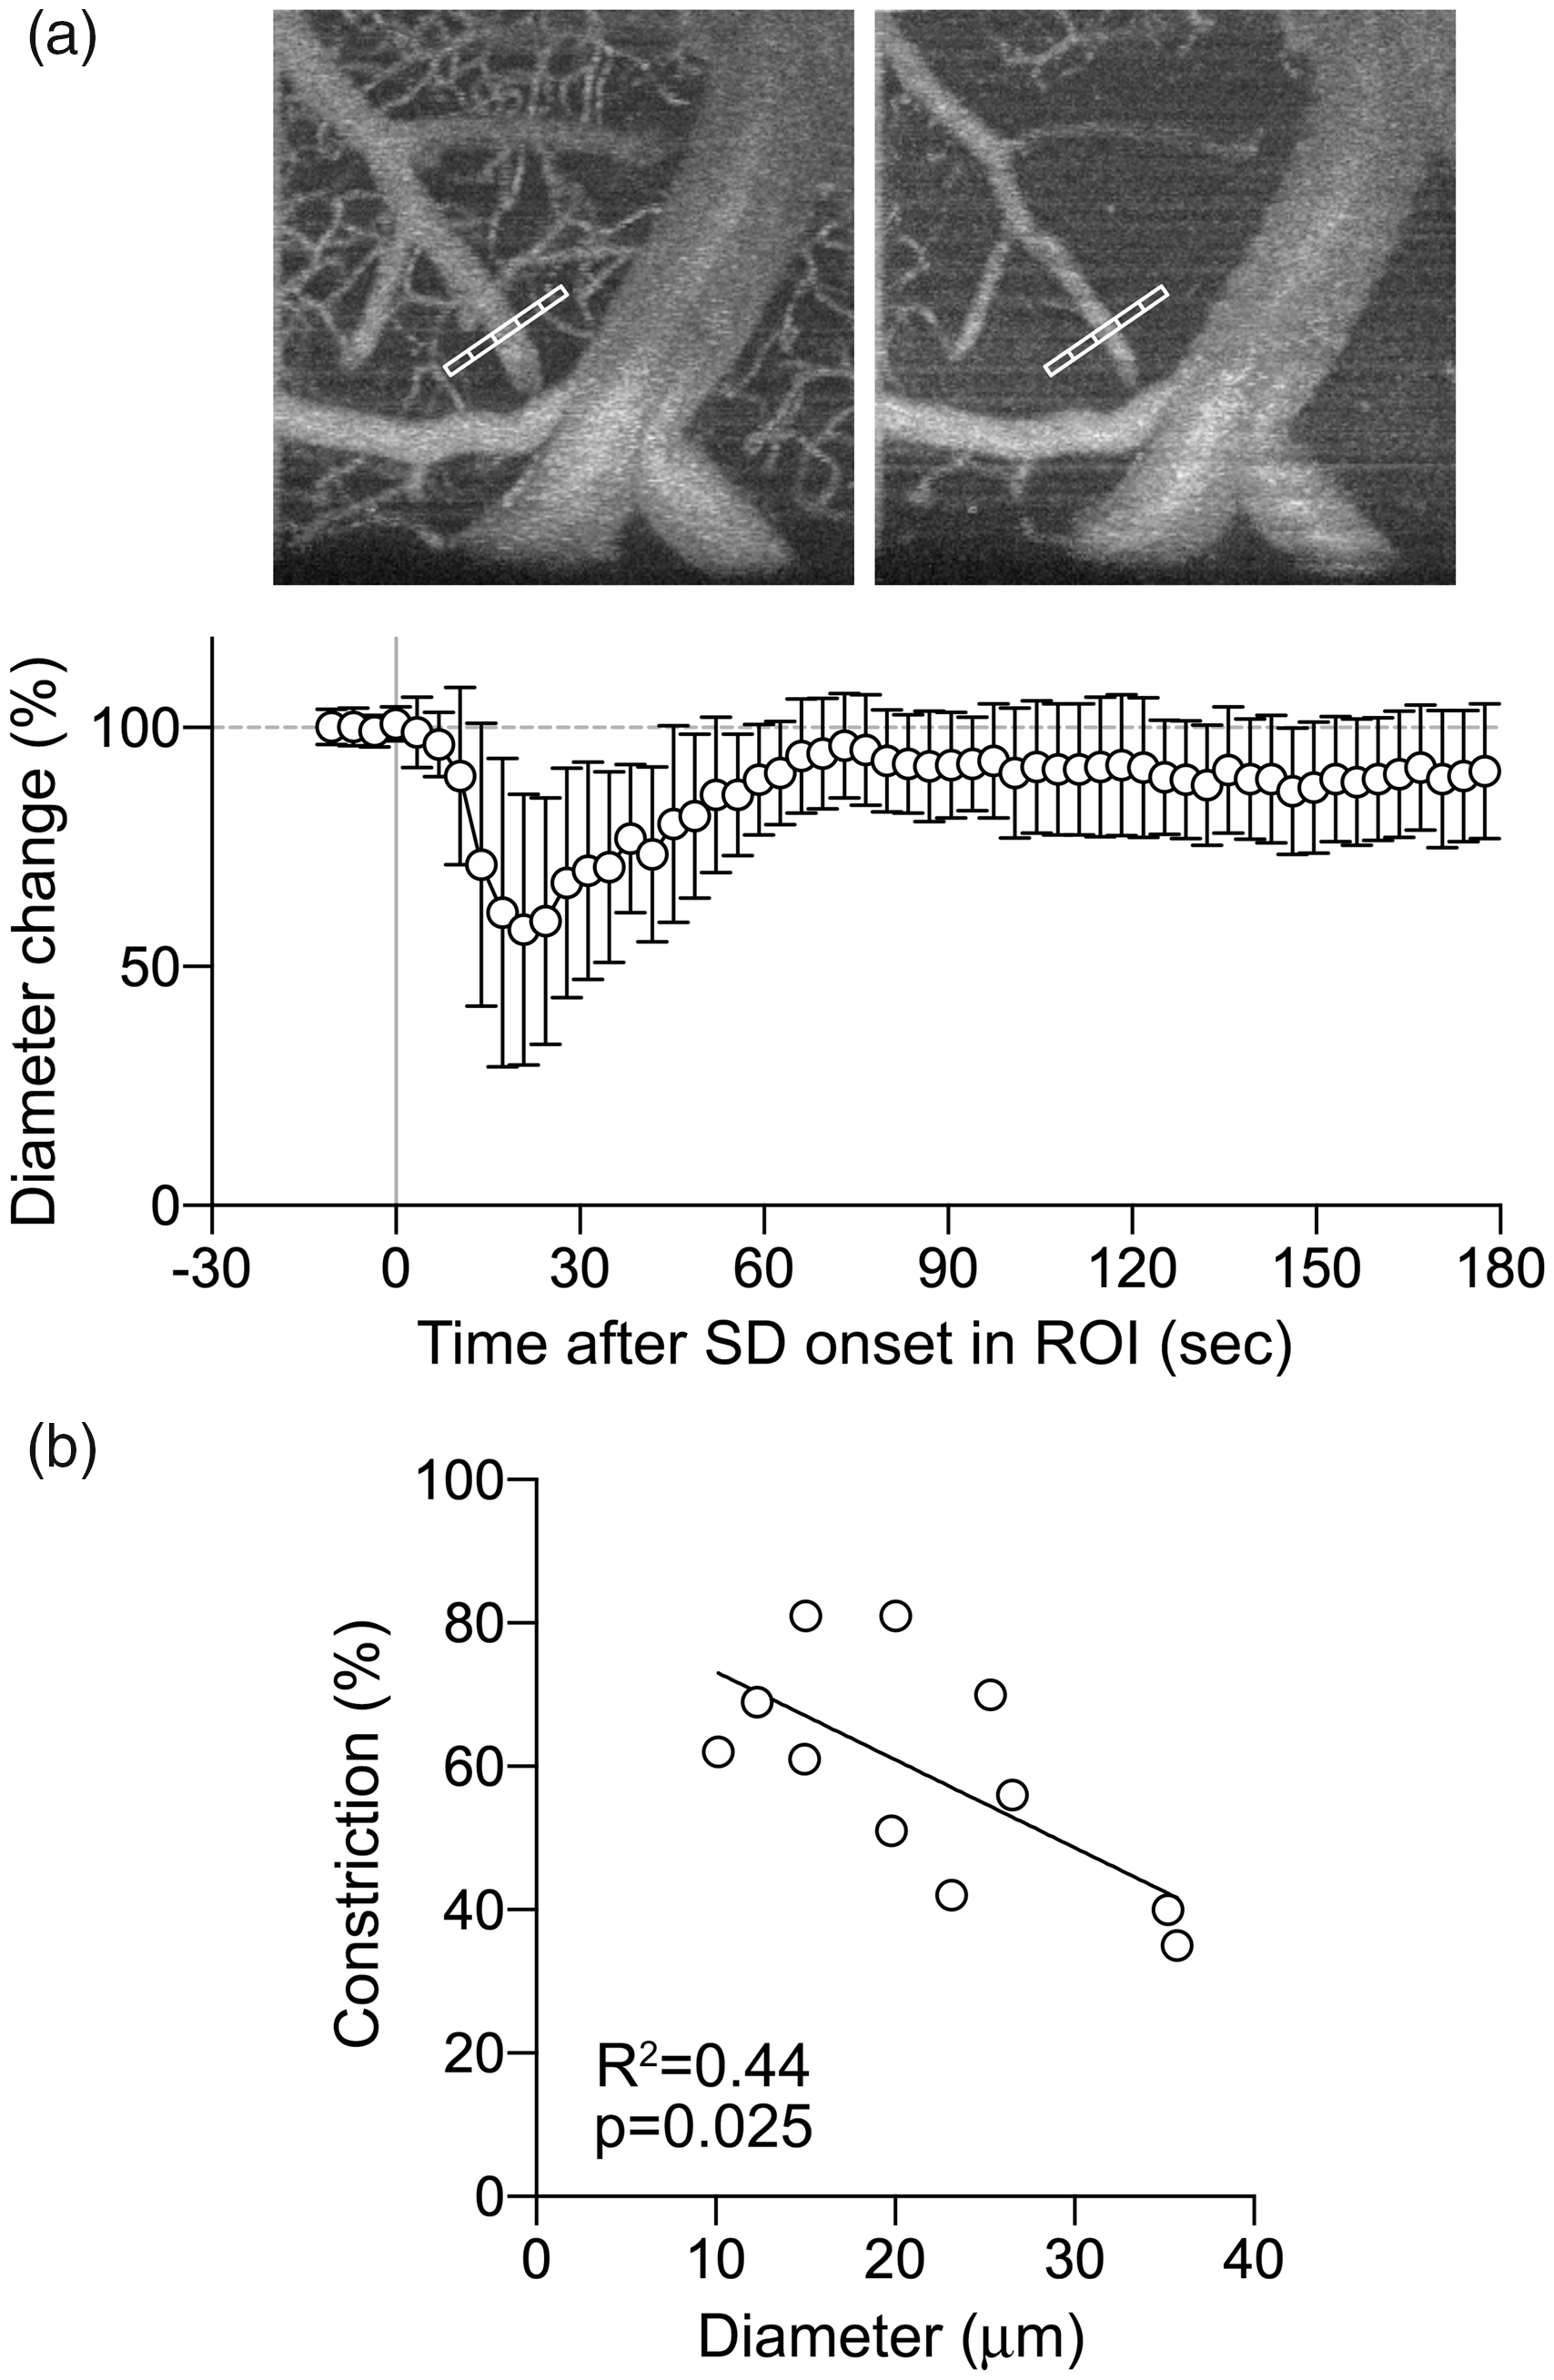
SD-induced changes in pial arterial diameter. (a) A representative OCT angiogram showing measurement of pial arterial constriction and magnitude of changes as % of baseline (mean ± standard deviation). (b) There was a significant inverse relationship between the baseline diameter and magnitude of constriction of pial arteries.
Lastly, we examined the tissue optical scattering changes during SD (Figure 4). The SD wave front was associated with an abrupt but brief decrease in tissue scattering followed by a longer lasting increase. These changes did not differ between first and second SD.
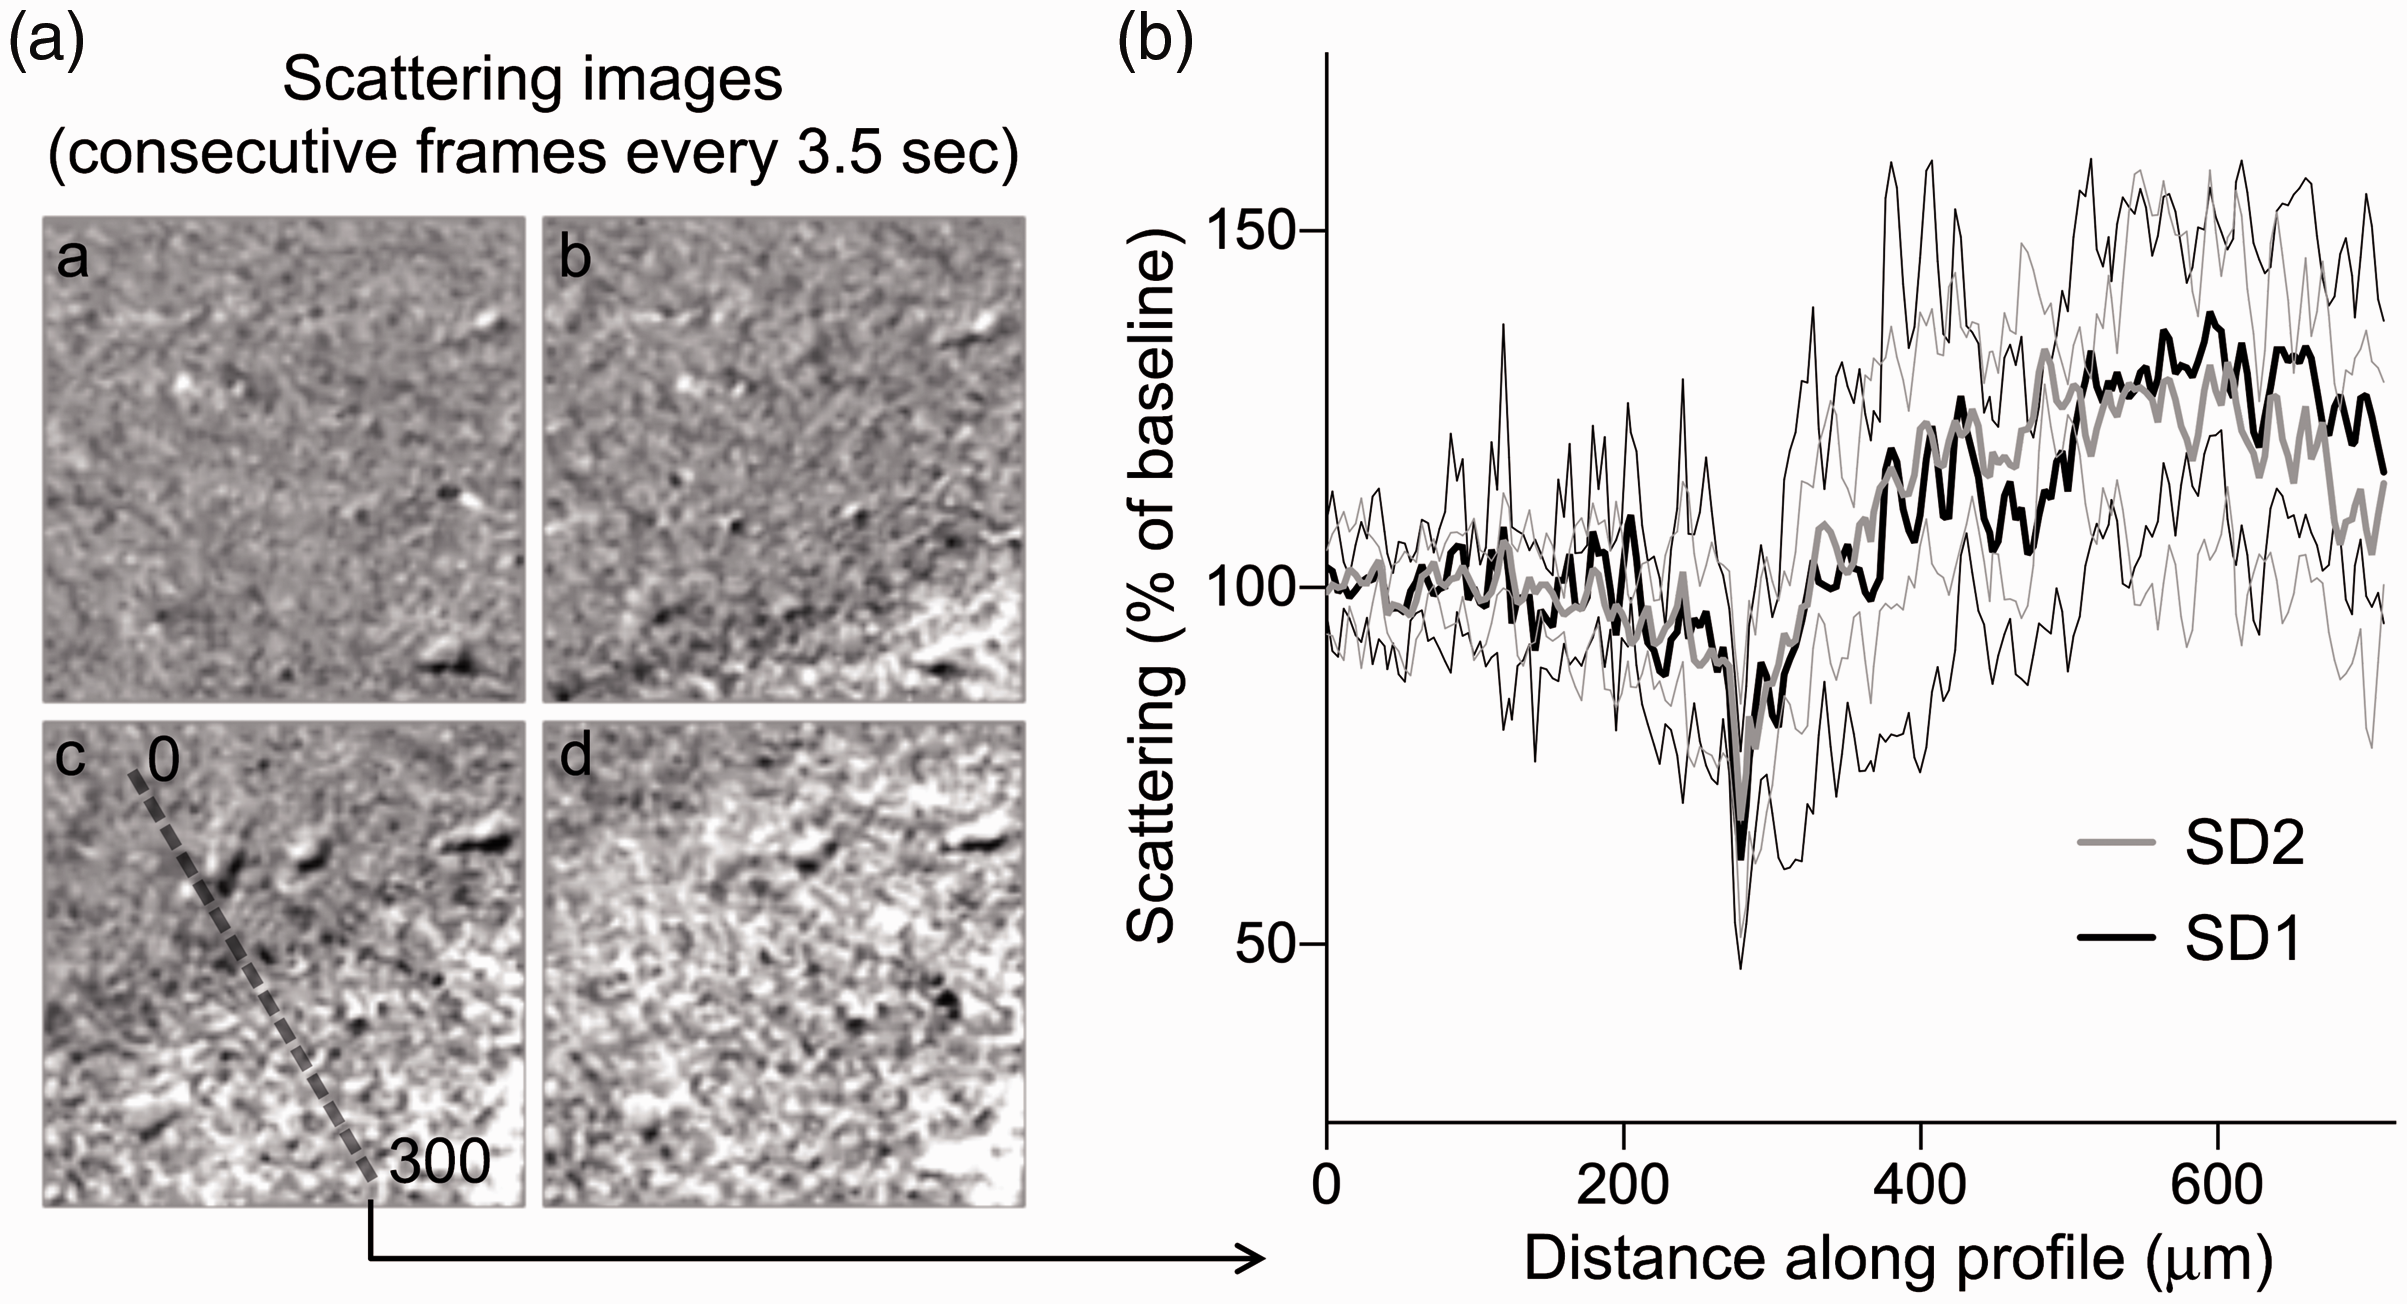
SD-induced changes in light scattering at high spatial resolution. (a) Time lapse light scattering images showing SD propagation and the line profile placed perpendicular to the wave front in the frame when SD reached the center of the field of view. (b) Scattering changes as a function of distance along the line profile placed as shown in the example in (a). Thick black and gray lines show the mean whereas the thin black and gray lines show the standard deviation of changes during the first and second SDs, respectively. There was a consistent initial dip in light scattering at the SD onset affecting ∼25 µm of cortex. This was followed by a slower and longer lasting increase in light scattering.
Discussion
Our study using depth-resolved OCT provides direct evidence suggesting that the capillary bed is the first and most severely affected vascular compartment during SD. Capillary perfusion started to drop immediately at SD onset. Upstream segments responded many seconds later, with a distal to proximal progression suggesting vascular conduction.
The mechanism of capillary perfusion drop in advance of upstream vasoconstriction is unclear. Capillary perfusion arrest has been reported in rat cortex during SD. 29 A modest (≤10%) diffuse reduction in capillary diameters has been shown to coincide with elevated pericyte Ca2+ concentrations during SD in mice. 12 However, its timing in relation to arterial diameter change has not been examined and it has been unclear whether the magnitude of capillary diameter change can explain the profound capillary perfusion arrest as seen in this and previous studies. 12 We did not quantify microvascular blood flow, but rather the fraction of perfused capillaries. As noted earlier, OCT fails to detect moving blood cells when their velocity drops below a threshold value of ∼0.02 mm/sec, potentially underestimating the blood flow. 30 However, this threshold velocity is <10% of normal red blood cell velocity in brain capillaries, 31 and thus any apparent capillary dropout due to subthreshold flow velocities still indicates very low flow. Indeed, the magnitude of perfusion drop on OCT images closely matched previous flow measurements during SD in mice using laser Doppler and laser speckle flowmetry.9,11 Therefore, the observed capillary perfusion arrest is unlikely to be an artifact of the OCT technique.
The capillary bed is believed to offer significant hemodynamic resistance to blood flow in the normal brain. 32 Previous reports on capillary blood cell velocities during SD ranged from a complete stop12 to a mixed response with decreased as well as several-fold increased erythrocyte velocities. 33 Whether such heterogeneity occurs within the same region of microcirculation during the DC shift, however, is unclear. In high-flow capillaries, tissue oxygen extraction is limited by blood’s short capillary transit time, and the dramatic microvascular redistribution of blood after SD may therefore reduce oxygen availability, even if the net blood flow is not reduced.34,35 The dramatic changes in capillary patency therefore seem to represent the earliest phases of the development of profound oligemia and reduced oxygen availability after SD.
The temporal sequence of vascular response from the capillary bed to penetrating and then pial artery implicated vascular conduction of the vasomotor signal, as previously reported for pial arteries during SD. 23 In fact, conduction of vasomotor signals along the arterial wall through inter-endothelial communication is a well recognized mechanism by which events taking place within the parenchymal microvasculature can affect the upstream arterioles and arteries millimeters away.36–41 The phenomenon may also explain the stronger constriction in distal pial arteries compared with the more proximal larger caliber pial arteries, since vascular conduction of vasomotor signal diminishes over distance. Therefore, parenchymal ion and/or neurotransmitter fluxes sensed by the capillary endothelial cell during SD, including a massive extracellular K+ surge (∼20–60 mM)42,43 that is expected to depolarize the endothelial cell, may be conducted to the penetrating and then the pial arteries via interendothelial communication. Indeed, capillaries have been implicated as essential regulators of cerebral perfusion,44–46 not surprising given their proximity to and limited physical barriers separating them from the brain parenchyma. Taken together, our data show that SD is another example where capillaries play a key role in flow regulation.
It should be noted that the hemodynamic response within the field of view may be influenced by remote ‘plumbing’ effects due to constriction in nearby vascular beds invaded by SD prior to the vascular bed within the field of view. However, the temporal relationship of such remote influence to the response within the field of view is expected to be variable across animals depending on whether the nearby vessel is proximal or distal to the approaching SD wavefront, and potentially averaged out. Another possibility is that the vascular conduction of responses from nearby pial arteries undergoing SD ahead of the field of view may propagate into the field of view before the SD wavefront and initiate a response; 23 however, this would be expected to trigger earlier pial artery responses and thus diminish the lag between the capillary bed and pial arteries.
Our study has limitations as well. First, the OCT method we used could not provide an accurate estimate of perfusion because of the non-linear relationship between the OCT signal and flow speed and the lower limit of speed below which no flow is registered. Therefore, our readout was the number of perfused pixels rather than average perfusion signal. Second, we did not directly confirm the temporal correspondence between the scattering changes and the DC shift during SD; this has been done in the past by us and others, albeit not with OCT.21–27 Third, although our OCT images allowed us to place the ROI at a location and depth that is free of large vessels, we could not resolve small caliber precapillary arterioles and post capillary venules, and these likely contributed to the overall hemodynamic response. However, their contribution was likely small since our metric was the number of perfused pixels rather than the magnitude of perfusion signal.
Footnotes
Authors’ contributions
MA contributed to the study design, performed the experiments, and analyzed the data. BL, HW, and SK contributed to data analysis and the process of the experimental data. SS, DB, and LØ contributed to the design and implementation of the research, and to the analysis of the results. CA contributed to the study design, data analysis, and interpretation and supervised the project. All authors provided critical feedback and helped shape the research, analysis, and manuscript.
Declaration of conflicting interests
The author(s) declare no potential conflict of interest with respect to the research, authorship, and publication of this article.
Funding
The author(s) disclosed receipt of the following financial support for the research, authorship, and/or publication of this article: This work was supported by NIH R01NS115401 (SS and CA), NIH K99EB023993 (HW), Chan Zuckerberg Initiative Imaging Scientist grant, and VELUX Foundation, ARCADIA II, 0,026,167 (LØ).