
Abstract
Minor stroke due to large vessel occlusion (LVO) is associated with poor outcomes. Hypoperfused tissue fate may be more accurately predicted by severity-weighted multiple perfusion strata than by a single perfusion threshold. We investigated whether poor perfusion profile evaluated by multiple Tmax strata is associated with early neurological deterioration (END) in patients with minor stroke with LVO. Ninety-four patients with a baseline National Institute of Health Stroke Scale score ≤5 and anterior circulation LVO admitted within 24 hours of onset were included. Tmax strata proportions (Tmax 2–4 s, 4–6 s, 6–8 s, 8–10 s, and >10 s) against the entire hypoperfusion volume (Tmax >2 s) were measured. The perfusion profile was defined as the shift of the distribution of the Tmax strata proportions towards worse hypoperfusion severity compared with that of the entire cohort using the Wilcoxon-Mann-Whitney generalised odds ratio (OR); its performance to predict END was tested. The area under the curve of perfusion profile was 0.785 (95% confidence interval [CI]: 0.691–0.878, p < 0.001). Poor perfusion profile (generalised OR >1.052) was independently associated with END (adjusted OR 13.42 [95% CI: 4.38–41.15], p < 0.001). Thus, perfusion profile with severity-weighted multiple Tmax strata may predict END in minor stroke and LVO.
Introduction
Minor stroke is not a benign condition: approximately one-third of the patients have to live with persistent disability.1–3 In particular, patients with large vessel occlusion (LVO) presenting with mild symptoms have been associated with early neurological deterioration (END) and poor long-term outcomes.4–6 In these patients, the development of END during the best medical treatment is associated with less favourable outcomes despite rescue thrombectomy following clinical deterioration.7–9 Therefore, identifying the factors associated with END in this population is crucial to apply potential preventive strategies.
In a substantial amount of cases, END is associated with infarct growth in the same vascular territory. 10 The progression from oligemic tissue to a non-functional state and, eventually, to infarcted tissue may lead to clinical deterioration. 11 Perfusion-weighted imaging (PWI) could be a useful tool for identifying hypoperfused brain regions. Previous studies have demonstrated that perfusion delay lesions and mismatch between PWI and diffusion-weighted imaging (DWI) is associated with infarct growth 12 and END.4,13,14 However, these studies used single perfusion thresholds as variables, which may mask the distribution of perfusion severities. Moreover, no single threshold can precisely predict tissue fate, given that the ischemic tolerance of each neuron might be different. 15
Clinically silent (i.e., no symptoms) non-core-non-penumbral tissues can also progress to functionally impaired or infarcted tissue 16 and the risk of progression to infarct increases with the severity of perfusion defects. 17 Given this relationship between perfusion deficits and tissue fate, a perfusion severity-weighted approach could be a good END predictor in minor stroke but has seldom been investigated. Moreover, based on its theoretical merits, perfusion severity-weighted models may outperform single perfusion threshold models. This study aimed to evaluate whether the perfusion profile estimated by severity-weighted multiple Tmax strata is a reliable predictor for END in minor stroke and LVO. We additionally evaluated whether this parameter outperforms other single perfusion thresholds or the hypoperfusion intensity ratio (HIR) in predicting END.
Materials and methods
Study population
This study is a secondary analysis from a previously published observational study that investigated the performance of PWI/DWI variables in predicting END in patients with minor stroke and LVO. 4 Therefore, the study methods and the baseline characteristics of the participants have already been published. The study included a total of 94 patients from the prospectively maintained institutional stroke registry admitted between January 2011 and May 2019 (n = 7945) and who met the following inclusion criteria: (1) onset to arrival within 24 hours of last known normal (n = 5465); (2) baseline National Institutes of Health Stroke Scale (NIHSS) score of 5 or less (n = 3001); (3) pre-stroke modified Rankin Scale (mRS) of 0 or 1 (n = 2705); and (4) acute anterior circulation LVO (defined by occlusion of intracranial segment of the internal carotid artery, proximal segment of the middle cerebral artery [M1 or M2 trunk], or tandem occlusion) identified on baseline magnetic resonance angiography (n = 158). The exclusion criteria were as follows: (1) LVO due to moyamoya disease (n = 15); (2) treatment with endovascular therapy (EVT) before END (n = 14); or (3) did not undergo PWI (n = 35). This study adhered to the Helsinki declaration, the Belmont report, and International Council of Harmonization (ICH) guideline for Good Clinical Practice (GCP). Our study protocol was approved by the institutional review board (IRB approval number: Kyungpook National University Hospital 2020-04-001). Informed consent was waived because of the retrospective study design and minimal risk to the participants. All study participants were completely anonymised.
Data collection
Baseline demographics were obtained from either the institutional stroke registry or the electronic medical record. DWI lesion volumes were measured using automated imaging software with minimal manual editing (Olea Sphere 3.0 – SP6, Olea Medical, La Ciotat, France). We performed dynamic susceptibility PWI and obtained the Tmax value (time to the maximum of the residue function generated by deconvolution). Tmax delay lesion volumes of each threshold (Tmax >2 s, >4 s, >6 s, >8 s, and >10 s) were measured using the same software program. For this analysis, Tmax volumes of 2-s Tmax strata from Tmax 2–4 s to Tmax 8–10 s were calculated. Proportions of hypoperfused tissue of every 2-s Tmax strata (Tmax 2–4 s, 4–6 s, 6–8 s, and 8–10 s) and Tmax >10 s against the entire hypoperfusion volume (Tmax >2 s) were measured.
Primary and secondary outcomes were END and 3-month unfavourable outcome (defined by an mRS of 2−6), respectively. We defined END as any neurological worsening or new neurological symptoms reported accompanied by an increment in the total NIHSS score ≥2 or an increment in the motor score (5a–6b) ≥1 within 72 hours of onset.18–20 This facilitated the exclusion of systemic causes. Patients were admitted to a high dependency unit where vital signs and neurological status were routinely checked frequently, and neurological changes were immediately reported by the on-duty neurologist or by staff physicians.
Statistical analysis
The distributions of all variables were tested for normality with the Kolmogorov–Smirnov test. If data were skewed, a natural logarithmic transformation was applied to produce normally distributed data. Data are presented as number (proportion), mean ± standard deviation, or median and interquartile range (IQR). To compare variables between the patients with good and poor perfusion profiles, continuous variables were analysed using Student’s t-test or Mann-Whitney U test and categorical variables were analysed with Pearson’s chi-square test or Fisher’s exact test, as appropriate.
Perfusion profile was defined as the shift towards worse hypoperfusion severity in the distribution of the Tmax strata proportions compared with that of entire cohort using Wilcoxon-Mann-Whitney generalised odds ratio (OR; Figure 1). 21 Its performance to predict END was tested using a receiver operating characteristic (ROC) curve analysis and was compared with the other PWI/DWI variables including Tmax >6 s, Tmax >6 s – DWI, Tmax 4–6 s, and HIR (Tmax >10 s/Tmax >6 s and Tmax >10 s/Tmax >4 s). Moreover, the resulting generalised OR was dichotomised at the cut-off point that produced the maximum Youden’s Index (sensitivity + specificity – 1). 22 Patients with poor perfusion profiles were those pertaining to the high dichotomy of the generalised OR, whereas patients with good perfusion profiles were those pertaining to the low dichotomy of the generalised OR. Univariable and multivariable logistic regression analyses were performed to examine the association between perfusion profiles and clinical outcomes. All imbalanced variables between the two groups (defined as p < 0.1) were adjusted with backward stepwise selection (Model 1). Furthermore, we performed additional analyses to investigate whether the biologically plausible cut-off value of generalised OR 1.000 could also categorise the perfusion profile into poor versus good for predicting outcomes; a generalised OR >1.000 indicated worse hypoperfusion severity of the Tmax strata proportions distribution compared with that of the entire cohort (Model 2).
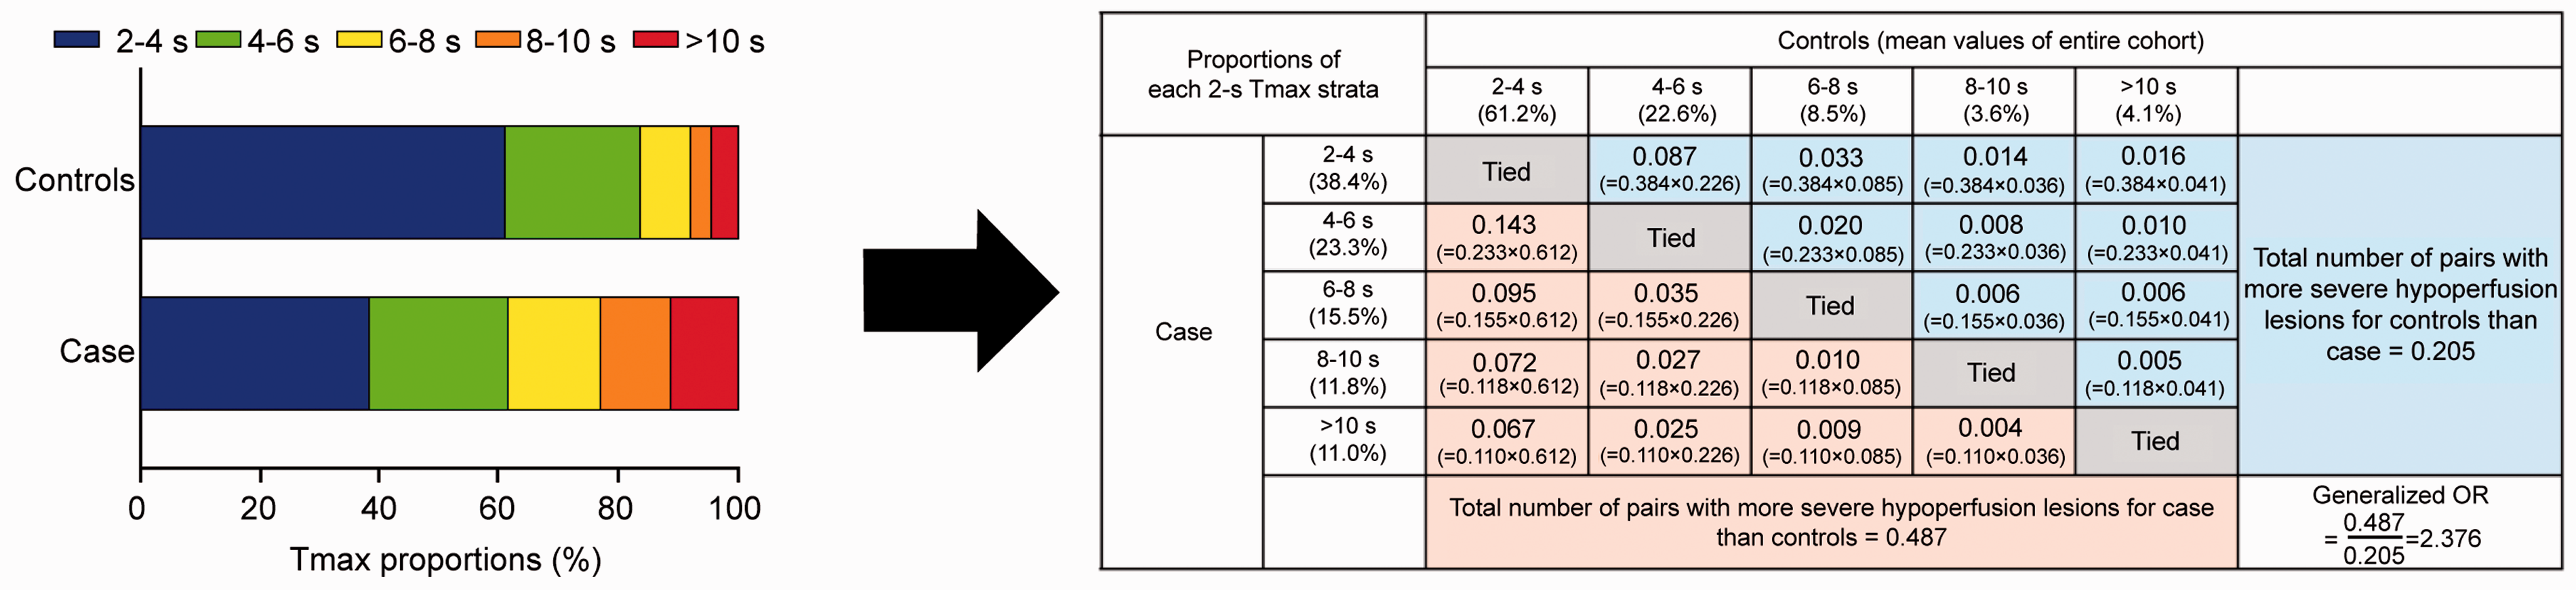
Conceptual outline of patients’ perfusion profile evaluated using Wilcoxon-Mann-Witney generalised odds ratio (OR). All pairs with more severe hypoperfusion lesion proportions in case than in controls (pink shade) were weighed against all pairs with more severe hypoperfusion lesion proportions in controls than in case (light blue shade), generating a generalised OR.
The effect of the entire hypoperfusion volume (Tmax >2 s) was analysed separately with the interaction term “perfusion profile (1: the high dichotomy of the generalised OR) × Tmax >2 s (1: over the median volume of Tmax >2 s)”. Significance levels were set at a two-sided p-value <0.05. Statistical analyses were performed using SPSS 25.0 (SPSS Inc., Chicago, IL, USA) and the MedCalc 19.5.1 Statistical Program (MedCalc Software, Ostend, Belgium).
Results
Ninety-four patients with acute LVO and mild symptoms were enrolled in this study. END was reported in 37 (39.4%) patients. All cases were characterised by progressive stroke of the affected vascular territory. Table 1 summarises demographics and clinical characteristics at baseline. There were no statistical differences in baseline variables between patients with good and poor perfusion profiles, except for onset-to-door time, recanalisation therapy, and occurrence of END. Those with poor perfusion profile had shorter onset-to-door time (in hours; 2.3 [IQR 1.2–5.1]) than those with good perfusion profile (4.4 [IQR 1.9–13.8], p = 0.011). Patients with a poor perfusion profile received more intravenous tissue-type plasminogen activator and rescue EVT than those with a good perfusion profile (44.4% vs. 16.3%, p = 0.003 and 46.7% vs. 4.1%, p < 0.001, respectively). Moreover, those with a poor perfusion profile experienced more END (68.9% vs 12.2%, p < 0.001). Initial DWI volume and entire hypoperfusion lesion volumes with a Tmax >2 s were not statistically different between the two groups. The mean proportions of Tmax 2–4 s, 4–6 s, 6–8 s, 8–10 s, and >10 s against Tmax >2 s for all participants were 61.2%, 22.6%, 8.5%, 3.6%, and 4.1%, respectively. The mean proportions of Tmax 4–6 s, 6–8 s, 8–10 s, and >10 s against Tmax >2 s were significantly higher (25.6% vs 19.7%, 12.7% vs 4.6%, 6.0% vs 1.3%, and 6.8% vs 1.7%, respectively), but the proportion of Tmax 2–4 s against Tmax >2 s was significantly lower in the poor than in good perfusion profile group (48.9% vs 72.6%, respectively). Moreover, median Tmax >10 s/Tmax >6 s and Tmax >10 s/Tmax >4 s of all participants were 0.11 (IQR, 0.00–0.29) and 0.05 (IQR, 0.00–0.14), respectively.
Patient baseline characteristics.
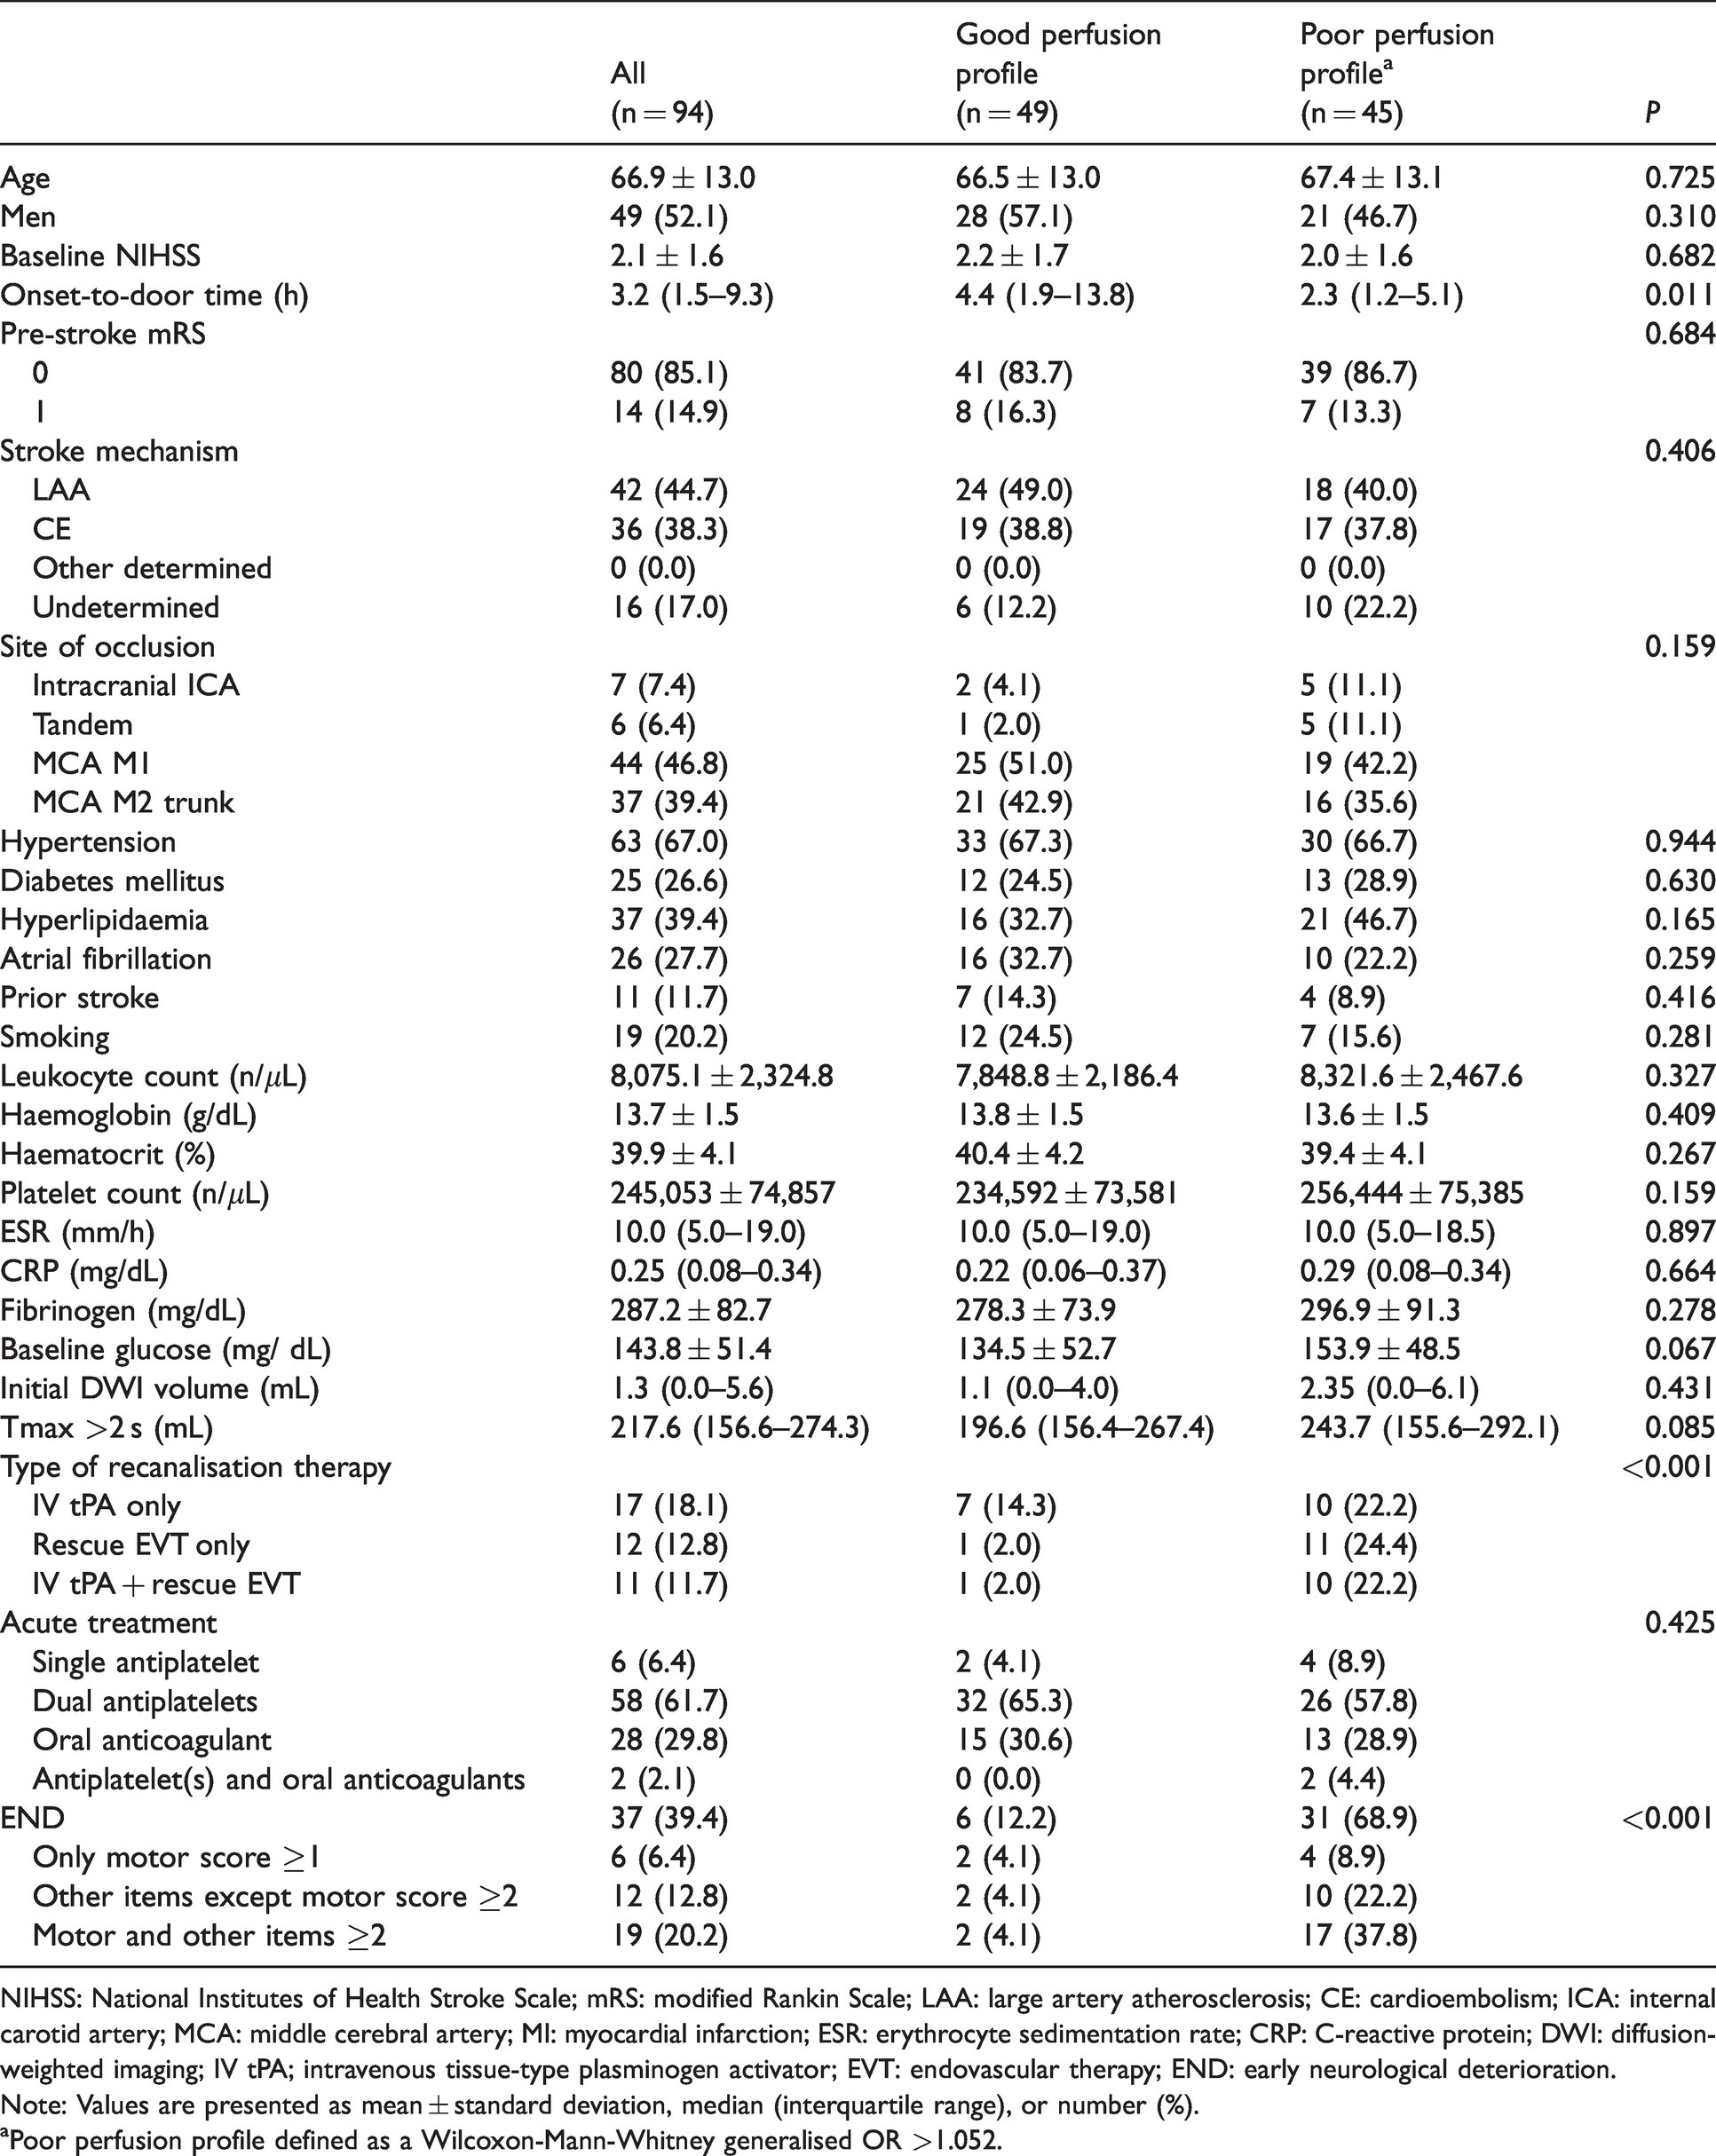
NIHSS: National Institutes of Health Stroke Scale; mRS: modified Rankin Scale; LAA: large artery atherosclerosis; CE: cardioembolism; ICA: internal carotid artery; MCA: middle cerebral artery; MI: myocardial infarction; ESR: erythrocyte sedimentation rate; CRP: C-reactive protein; DWI: diffusion-weighted imaging; IV tPA; intravenous tissue-type plasminogen activator; EVT: endovascular therapy; END: early neurological deterioration.
Note: Values are presented as mean ± standard deviation, median (interquartile range), or number (%).
aPoor perfusion profile defined as a Wilcoxon-Mann-Whitney generalised OR >1.052.
Figure 2 demonstrates illustrative cases of different perfusion profiles and entire hypoperfusion lesion volumes. It represents how those with similar entire hypoperfusion lesion volumes can have different perfusion profile severities (Figure 2(a) vs. (b) or (c) vs. (d)). Moreover, the perfusion profile evaluated by proportions of multiple Tmax strata predicts END more precisely than hypoperfusion lesions of single thresholds (Tmax >2 s) in specific cases (Figure 2(b) vs. (c)).
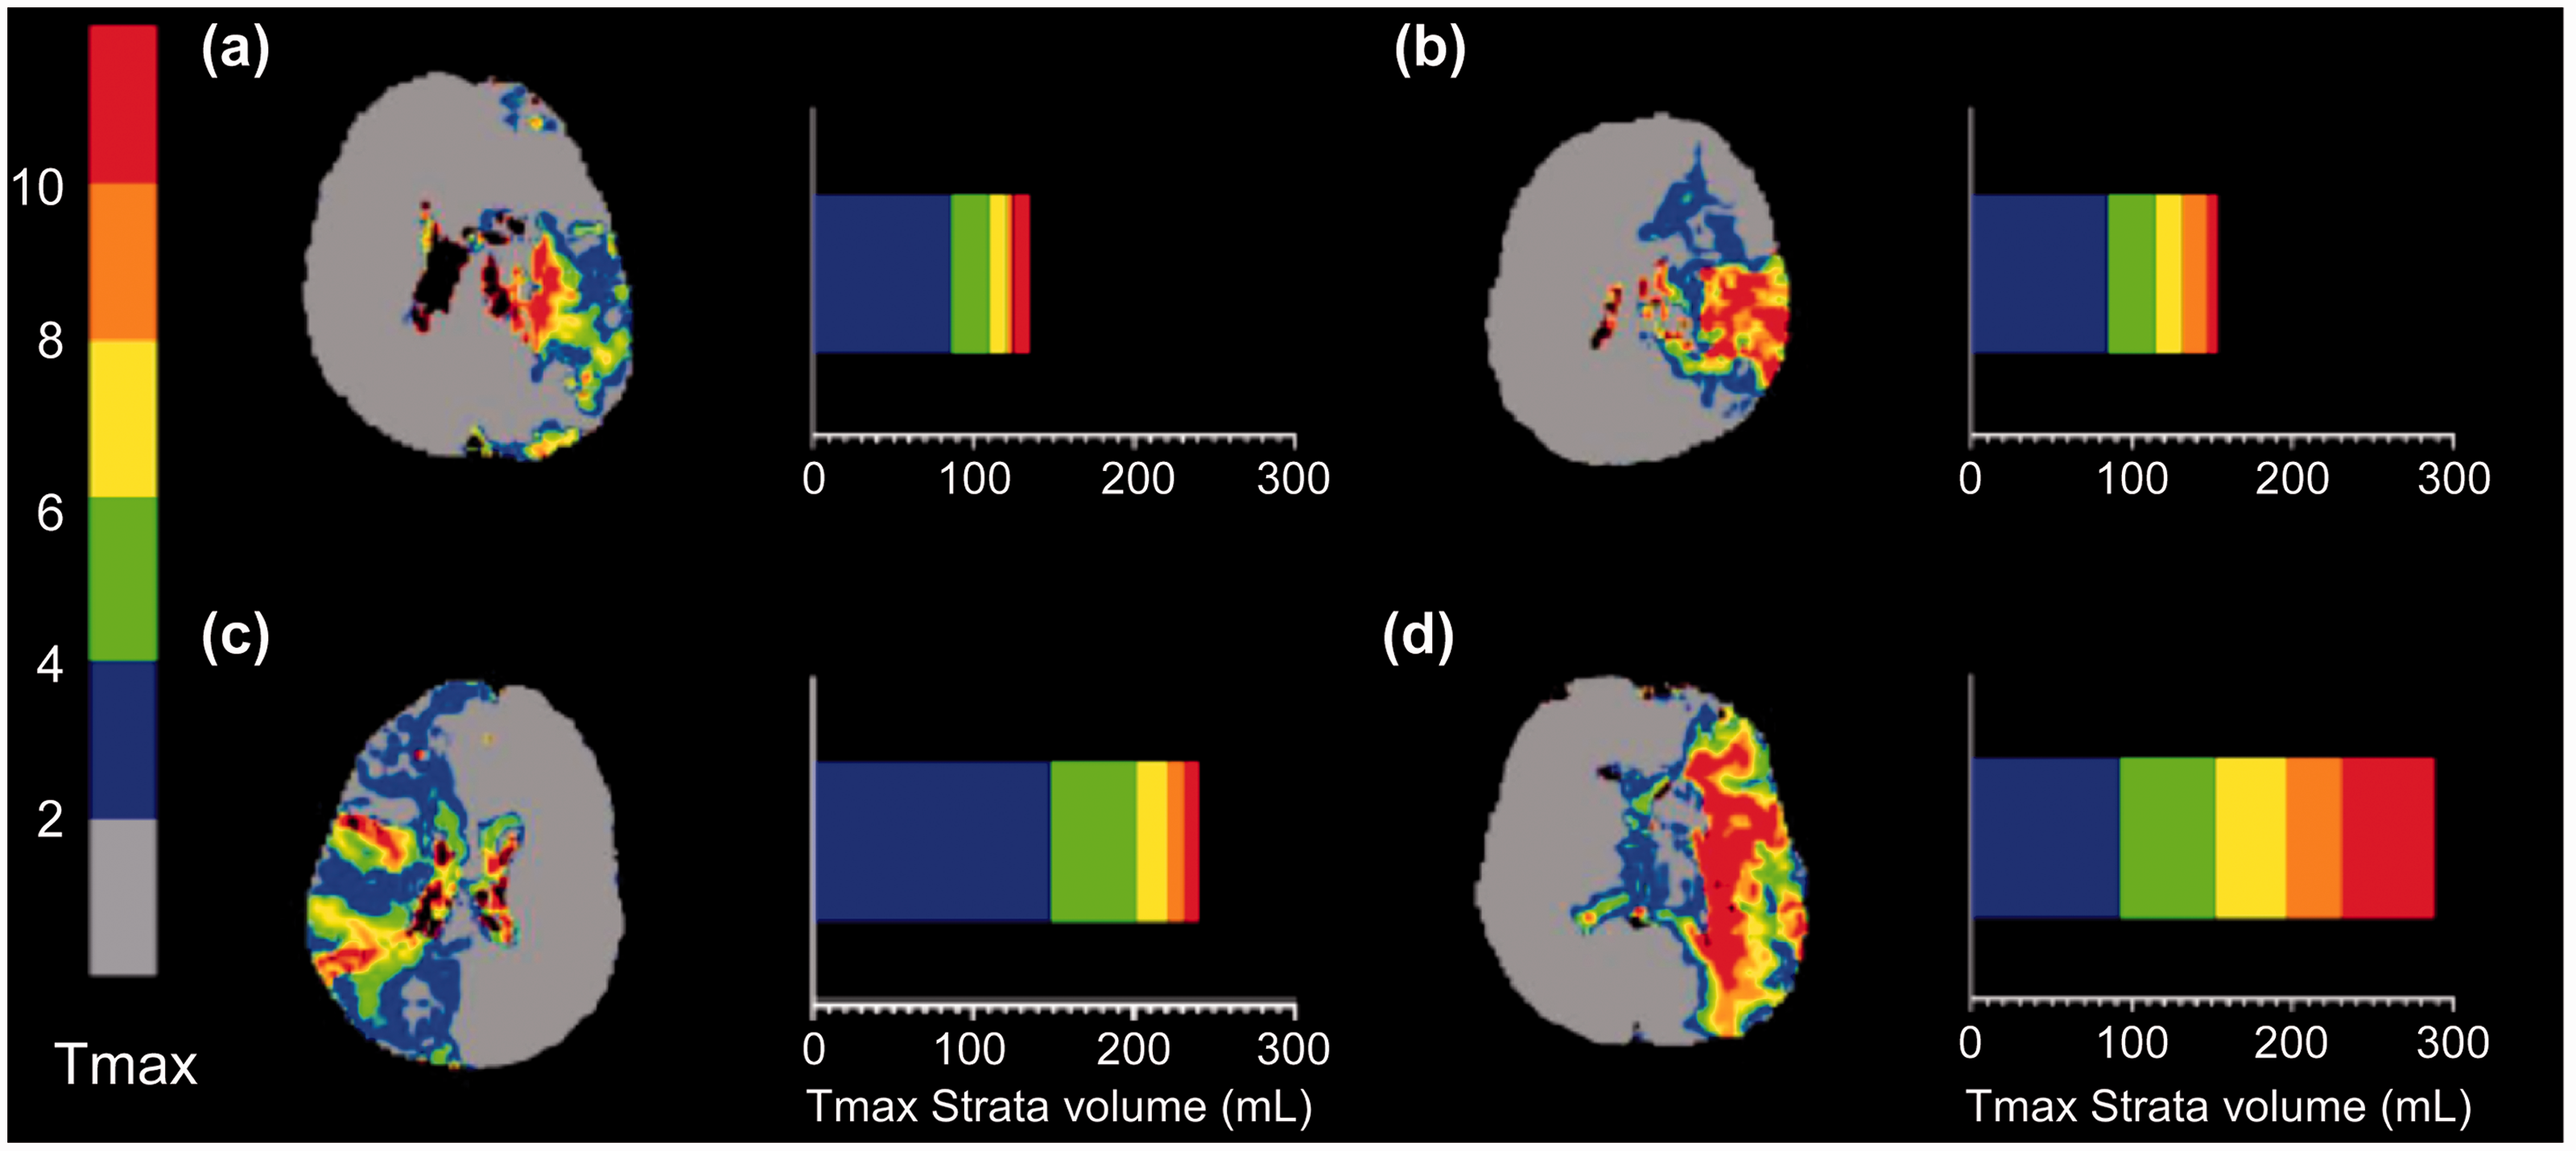
Illustrative cases of different Tmax >2 s volumes and perfusion profiles. Patients with poor perfusion profile experienced early neurological deterioration (END) [(b) and (d)], whereas patients with good perfusion profile showed no END [(a) and (c)]. Perfusion profiles predict END well both in those with large and small entire hypoperfusion lesion volumes (Tmax >2 s).
The perfusion profile evaluated by multiple Tmax strata proportions was right skewed and a natural logarithmic transformation was applied (ln [generalised OR + 1]). Afterwards, the Kolmogorov-Smirnov Z value changed from 1.26 to 0.84 and the transformed data conformed more to a normal distribution. The transformed variable was used for ROC curve analysis and logistic regression analyses and then transformed back to obtain the generalised OR. The perfusion profile showed fair performance for predicting END (area under the curve [AUC] 0.785 [95% confidence interval (CI): 0.691–0.878]). The ROC curve of the perfusion profile outperformed Tmax 4–6 s (AUC 0.648 [95% CI: 0.535–0.762], p = 0.024) and HIR (either Tmax >10 s/Tmax >6 s: AUC 0.608 [95% CI: 0.491–0.725], p = 0.003, or Tmax >10 s/Tmax >4 s: AUC 0.610 [95% CI: 0.493-0.727], p = 0.003), and exceeded the other imaging variables, although the comparisons were not statistically significant (Tmax >6 s: AUC 0.725 [95% CI: 0.622–0.829], p = 0.074; and Tmax >6 s– DWI: AUC 0.753 [95% CI: 0.654–0.852], p = 0.294, respectively; Table 2 and Figure 3).
ROC curve analysis of imaging variables at each threshold for predicting END.
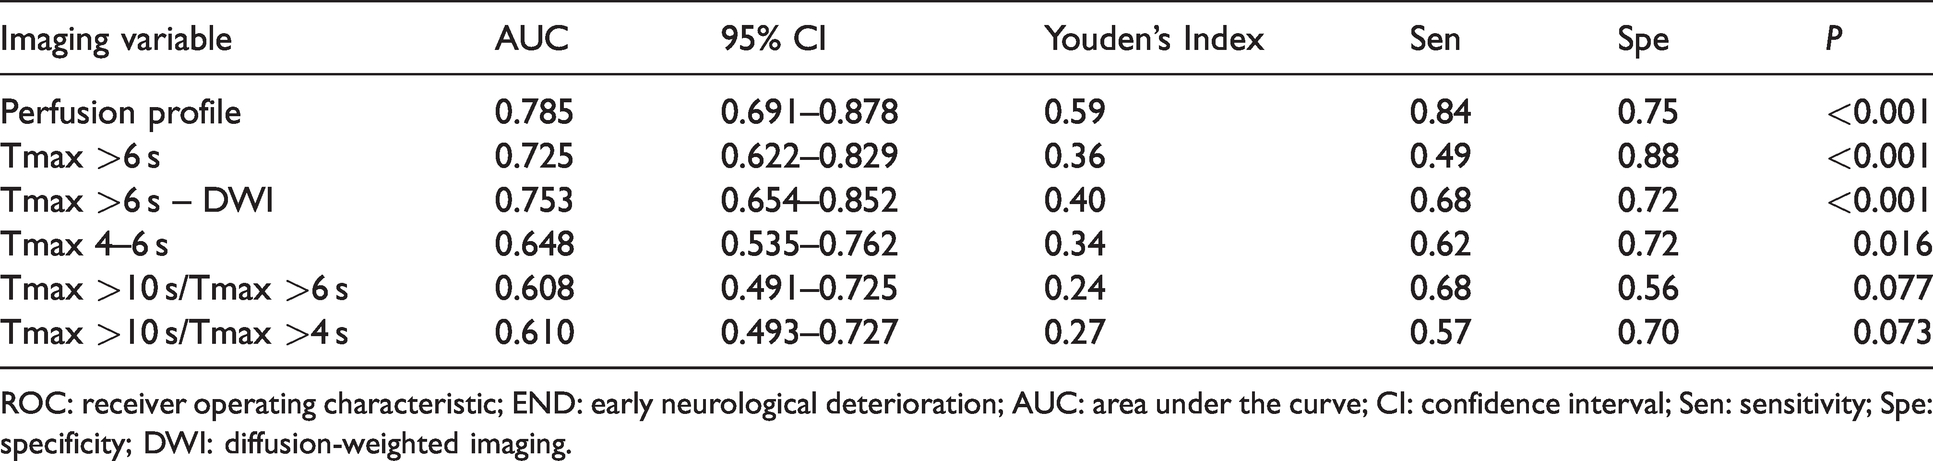
ROC: receiver operating characteristic; END: early neurological deterioration; AUC: area under the curve; CI: confidence interval; Sen: sensitivity; Spe: specificity; DWI: diffusion-weighted imaging.
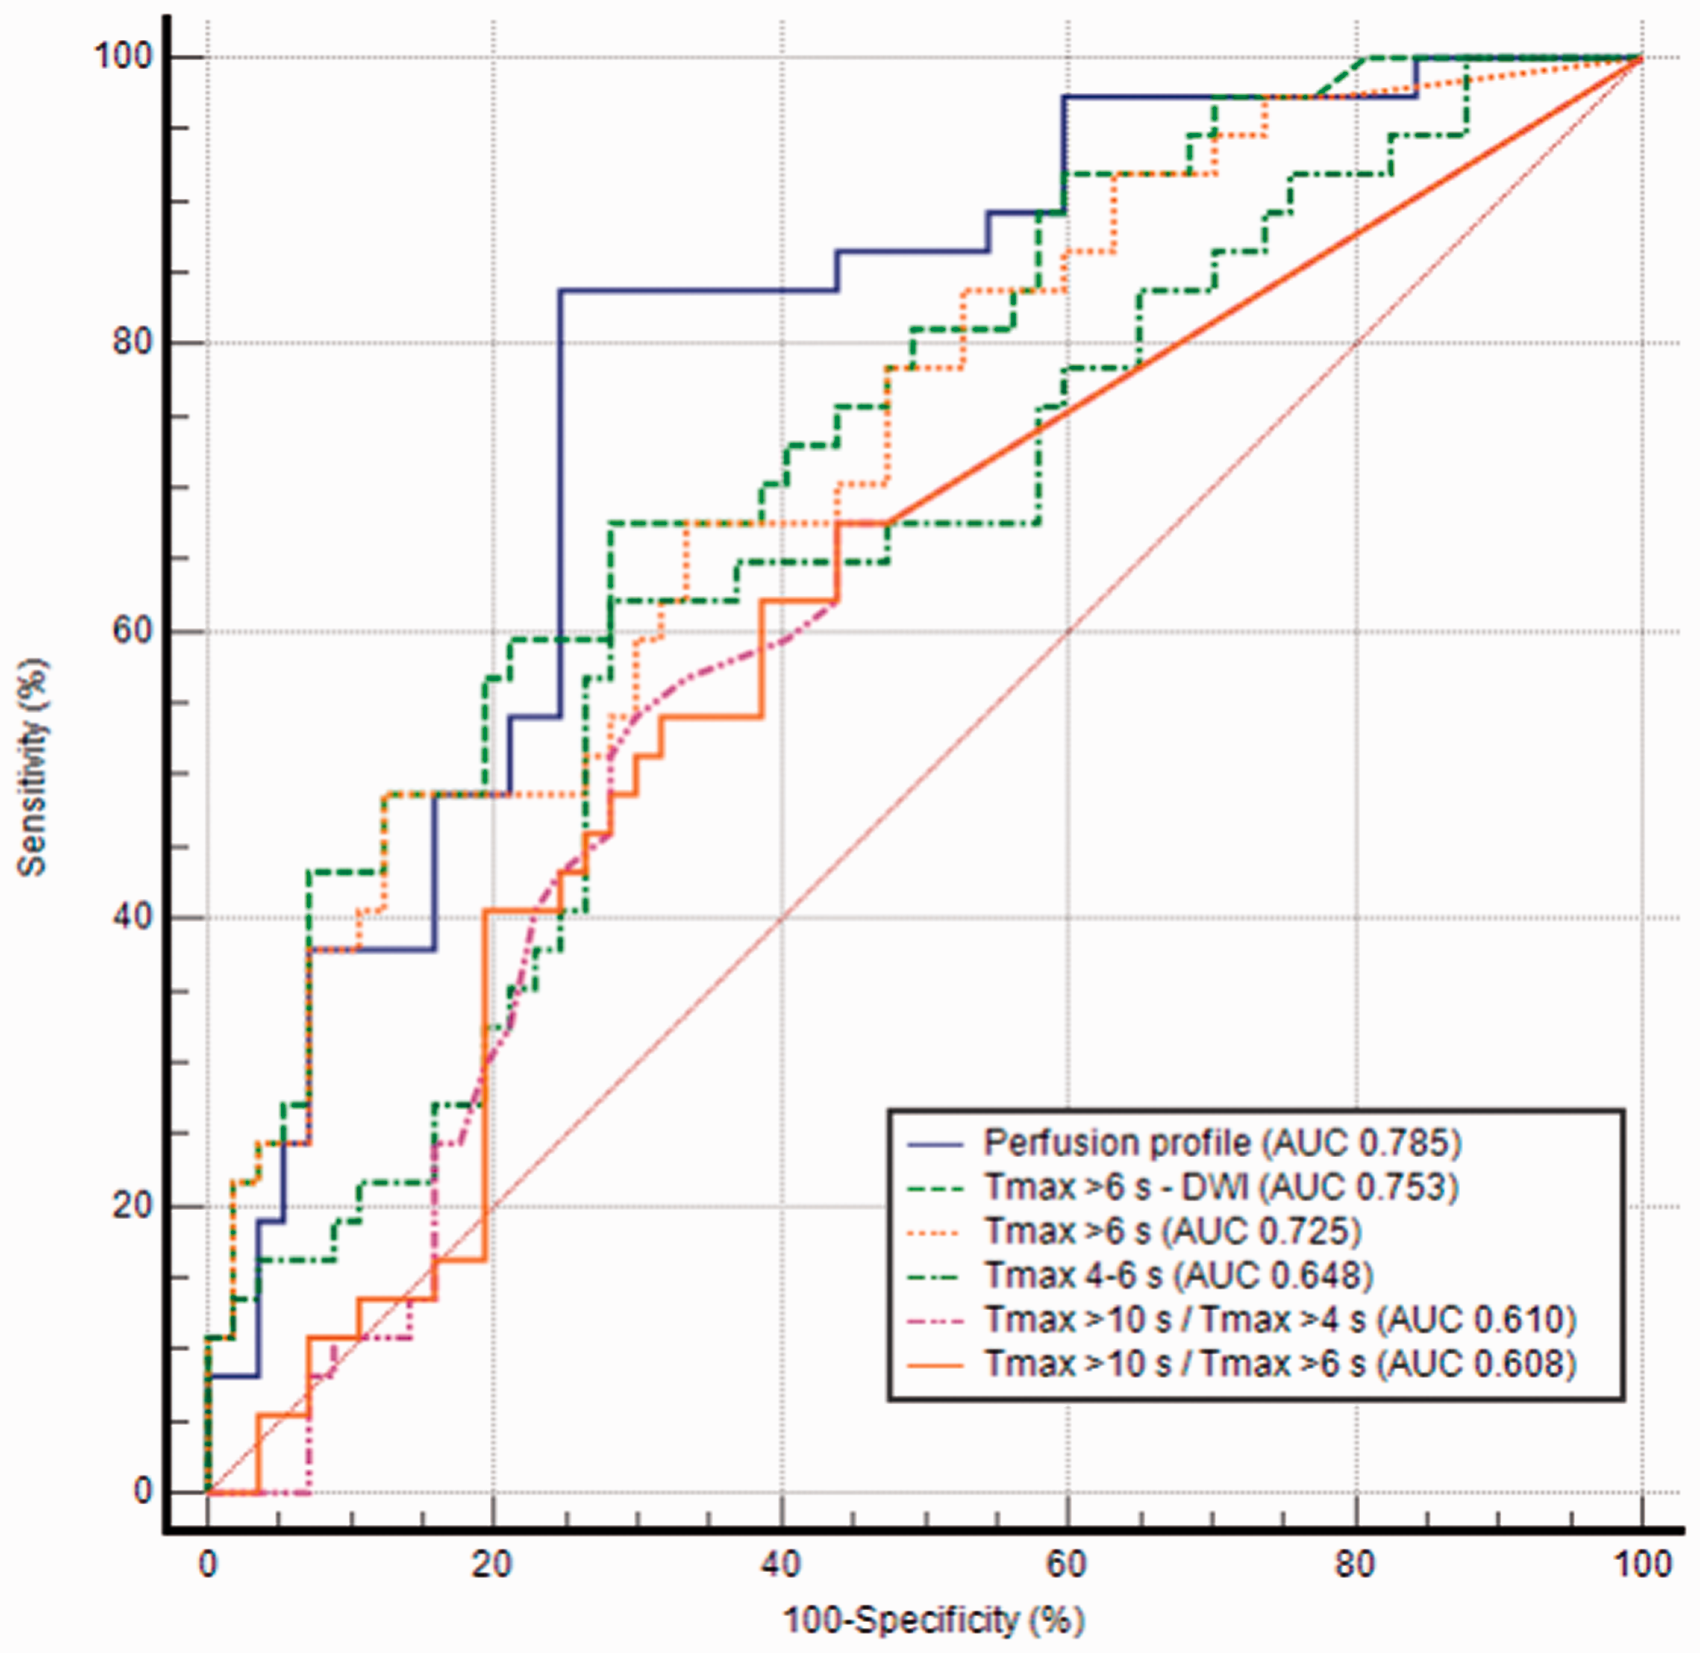
Receiver operating characteristic curve analysis of imaging variables for predicting early neurological deterioration. With area under the curve (AUC) of 0.785, perfusion profile outperformed Tmax 4–6 s (AUC 0.648, p = 0.024), Tmax >10 s/Tmax >6 s (AUC 0.608, p = 0.003), and Tmax >10 s/Tmax >4 s (AUC 0.610, p = 0.003) significantly and exceeded the other imaging variables, although the comparisons were not statistically significant.
In Model 1, a poor perfusion profile for predicting END was defined as having a generalised OR >1.052, based on Youden’s Index. According to univariable logistic regression analysis, patients with poor perfusion profiles were more likely to develop END compared with those with good perfusion profiles (OR 15.87 [95% CI: 5.49–45.90], p < 0.001; Table 3). After adjusting for imbalanced variables between the two groups, patients with poor perfusion profile significantly tended to develop END (adjusted OR [aOR] 13.42 [95% CI: 4.38–41.15], p < 0.001). Furthermore, those with poor perfusion profiles were associated with unfavourable outcomes at 3 months (OR 4.57 [95% CI: 1.36–15.31], p = 0.014; Table 3). Poor perfusion profiles were independently correlated with unfavourable outcomes at 3 months after adjusting for the confounding variables (aOR 7.82 [95% CI: 1.83–33.45], p = 0.006). To determine whether the effect of poor perfusion profiles on the occurrence of END differed by entire hypoperfusion lesion volume, the interaction term between poor perfusion profile and volume of Tmax >2 s was tested. However, there was no significant interaction between the two variables (p value for interaction = 0.234), which indicated that poor perfusion profiles were associated with END both in patients with large and with small entire hypoperfusion lesion volumes.
Logistic regression analysis investigating the association between clinical and imaging variables and END and 3-month unfavourable outcome.
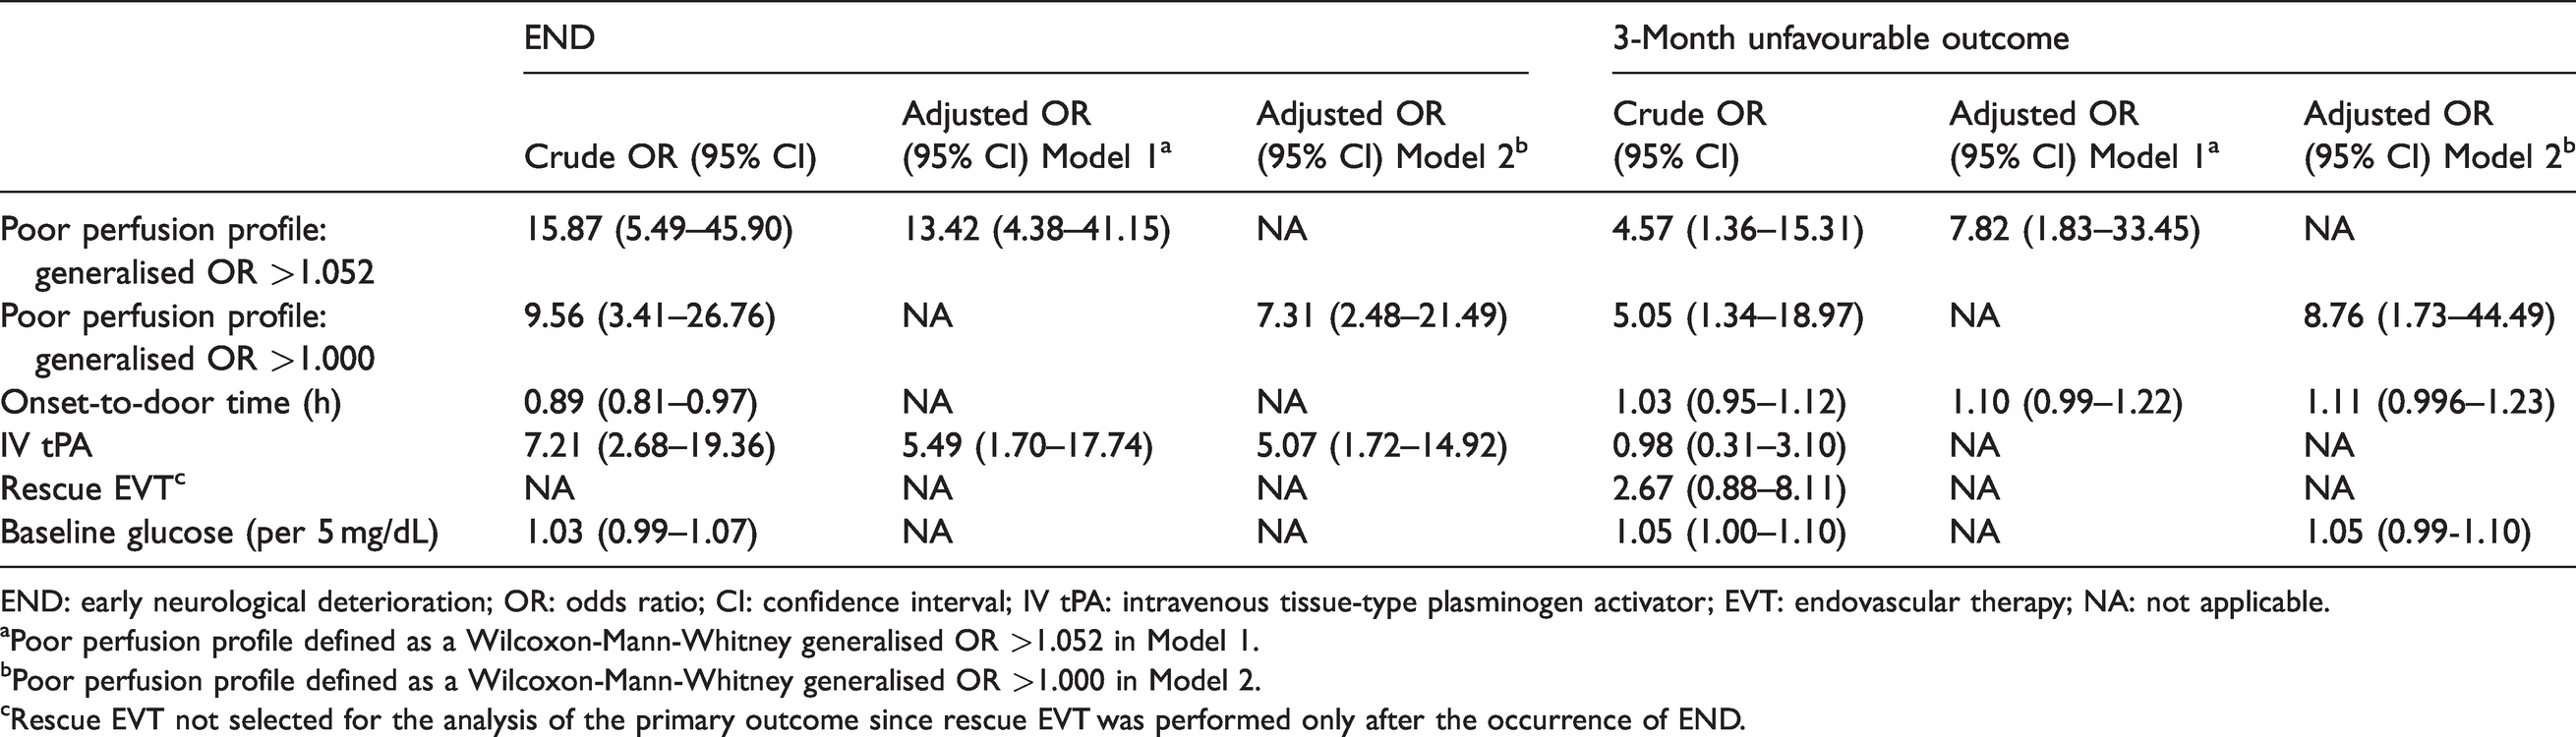
END: early neurological deterioration; OR: odds ratio; CI: confidence interval; IV tPA: intravenous tissue-type plasminogen activator; EVT: endovascular therapy; NA: not applicable.
aPoor perfusion profile defined as a Wilcoxon-Mann-Whitney generalised OR >1.052 in Model 1.
bPoor perfusion profile defined as a Wilcoxon-Mann-Whitney generalised OR >1.000 in Model 2.
cRescue EVT not selected for the analysis of the primary outcome since rescue EVT was performed only after the occurrence of END.
In Model 2, the poor perfusion profile with cut-off value of generalised OR >1.000 also showed associations with END (OR 9.56 [95% CI: 3.41-26.76], p < 0.001) and unfavourable outcomes at 3 months (OR 5.05 [95% CI: 1.34-18.97], p = 0.017; Table 3). These associations remained significant after adjusting for confounding variables (aOR 7.31 [95% CI 2.48–21.49], p < 0.001, for END; aOR 8.76 [95% CI 1.73–44.49], p = 0.009, for 3-month unfavourable outcomes). The interactions between the poor perfusion profile in Model 2 and entire hypoperfusion lesion volume were not significant (p value for interaction = 0.408)
Discussion
This study suggests that the perfusion profile evaluated by multiple Tmax strata proportions can reliably predict END in patients with minor stroke and LVO. The perfusion profile is comparable with and may outperform other imaging variables consisting of a single perfusion threshold or HIR. Poor perfusion profile was associated with END regardless of the entire hypoperfusion lesion volume in patients with LVO presenting with mild stroke symptoms.
Multiple studies have demonstrated that imaging variables, including the mismatch between DWI and PWI and perfusion deficits of specific thresholds, are associated with END.4,13,14,23 Although these results have highlighted the usefulness of these variables in predicting clinical outcomes, applying a single perfusion threshold to all stroke patients and to all brain tissues seems neither reasonable nor accurate given the differences between individuals and tissue characteristics.15,17 Moreover, perfusion deficit lesions and mismatch lesions in the classic core/penumbra model are already functionally impaired 24 and not expected to predict END, which, however, was not be proven true in the previous studies.4,13,14 This counterintuitive result is better explained by the fact that the area traditionally regarded as core or penumbra actually contains oligemic tissue and the proportions of penumbra/core and oligemia in the lesion might differ according to hypoperfusion severity.17,25 Specifically, the approach using multiple hypoperfusion strata for predicting END may be useful in patients with mild symptoms whose non-functional tissue (i.e. core/penumbra that causes symptoms) is small within the hypoperfused area. In this population, the perfusion severity-weighted model may well reflect oligemia’s risk for progression to penumbra/infarction in case of hemodynamic instability via collateral failure or systemic factors including blood pressure drop and thrombus extension.11,26
A new perfusion parameter was devised (reflecting distributions of hypoperfusion severities) to predict END; this parameter only requires the proportions of each 2-s strata of Tmax against Tmax >2 s and can be easily obtained with semiautomated methods. High Tmax values within non-core-non-penumbral area may reflect microvascular integrity, indicate poor collateral circulation, 27 and contain large proportions of tissue at high-risk of infarction, which can lead to fluctuations in neurological status.15,28,29 Accordingly, among patients with similar entire hypoperfusion lesion volumes, those with larger proportions of severe Tmax delays were more likely to develop END. By its conceptual merits, it was expected to overcome the shortcomings of a single-threshold-based approach, which oversimplifies the risk of hypoperfusion lesions progressing to infarction. The perfusion profile outperformed Tmax 4–6 s, probably because it may better reflect oligemic tissue at high-risk of progression. Since the enrolled patients presented with minor symptoms, most patients were likely to have good collateral status and low HIR values. The low variability observed in HIR may have reduced the statistical power to detect its impact on END, consistent with previous studies of similar populations.30,31 This could have resulted in the better performance of the perfusion profile over HIR. However, it did not outperform other perfusion metrics including Tmax >6 s and Tmax >6 s – DWI, despite its larger AUC values. Further large-scale studies are needed to compare the performance of these metrics.
A poor perfusion profile was also independently associated with unfavourable outcomes at 3 months in our study cohort. However, this result should be interpreted with caution. Individuals who develop END are more likely to have long-term unfavourable outcomes.32,33 Furthermore, various factors, including acute treatment strategies and rescue EVT, affect long-term functional outcomes, which may limit the causal relationship between the baseline perfusion profile and long-term functional outcomes.
Our results suggest that improving cerebral perfusion status might be a potential treatment strategy in minor stroke and LVO with poor perfusion profile. Although their benefits are uncertain and need to be proved in future studies, various therapeutic interventions including upfront EVT, collateral blood flow augmentation, and neuroprotection by enhancing ischemic tolerance might be considered in patients with a poor perfusion profile.
A few limitations were noted in our study. Although we prespecified the definition of poor perfusion profile before statistical analysis, the cut-point value was retrospectively identified by ROC curve analysis. To overcome this methodological limitation, we conducted additional analyses with a prospectively defined biologically plausible cut-off point: a generalised OR of 1.000. However, because of the small sample size of our study, these parameters should be externally validated. Moreover, the generalisability of our results to computed tomography perfusion-based approach or a general stroke population was not confirmed since only magnetic resonance PWI was employed and minor strokes were included in this analysis. Furthermore, considering the dynamic change in the perfusion status over time in the acute stage of ischemic stroke, 34 imaging parameters evaluated only with baseline PWI may be inaccurate predictors in hemodynamically inconsistent patients or in patients with long time intervals from PWI to END. Further studies monitoring the perfusion status at acute stages of ischemic stroke, comparing PWI between baseline and at the time of END, and precisely predict END in this population are needed. Moreover, due to the lack of follow-up neuroimaging, the hypoperfused tissue fate of every Tmax strata could not be evaluated at the tissue level. Lastly, it may be difficult to categorise perfusion status into poor versus good perfusion profile based on raw PWI data just by visual estimation. An automated imaging software evaluating the perfusion status could be developed to help clinicians identify patients at high risk of END in this population.
In conclusion, the perfusion profile evaluated by multiple Tmax strata predicts END in patients with minor stroke and LVO. The present results indicate that severity-weighted perfusion abnormalities may be comparable with or outperform single threshold-based perfusion abnormalities in this population. Given the theoretically more elaborate approach to tissue fate, this method may be applicable to the other study cohort and deserves a further well-designed investigation.
Footnotes
Funding
The author(s) received no financial support for the research, authorship, and/or publication of this article.
Acknowledgements
None.
Declaration of conflicting interests
The author(s) declared no potential conflicts of interest with respect to the research, authorship, and/or publication of this article.
Authors’ contributions
D-S Gwak, the first author, established the study idea, analysed and interpreted the data, and wrote the manuscript; WC Choi, J-A Kwon, D-H Shim, and Y-W Kim established the study protocol and database, and Y-H Hwang, the corresponding author, established the study concept and design, interpreted the data, drafted the manuscript, and made critical revisions in the manuscript with intellectual content. All the authors approved the version to be published.