
Abstract
A widely used cerebrovascular stimulus and common pathophysiologic condition, hypercapnia is of great interest in brain research. However, it remains controversial how hypercapnia affects brain hemodynamics and energy metabolism. By using multi-parametric photoacoustic microscopy, the multifaceted responses of the awake mouse brain to different levels of hypercapnia are investigated. Our results show significant and vessel type-dependent increases of the vessel diameter and blood flow in response to the hypercapnic challenges, along with a decrease in oxygen extraction fraction due to elevated venous blood oxygenation. Interestingly, the increased blood flow and decreased oxygen extraction are not commensurate with each other, which leads to reduced cerebral oxygen metabolism. Further, time-lapse imaging over 2-hour chronic hypercapnic challenges reveals that the structural, functional, and metabolic changes induced by severe hypercapnia (10% CO2) are not only more pronounced but more enduring than those induced by mild hypercapnia (5% CO2), indicating that the extent of brain’s compensatory response to chronic hypercapnia is inversely related to the severity of the challenge. Offering quantitative, dynamic, and CO2 level-dependent insights into the hemodynamic and metabolic responses of the brain to hypercapnia, these findings might provide useful guidance to the application of hypercapnia in brain research.
Introduction
Referring to the elevated carbon dioxide (CO2) level in the blood, hypercapnia has long been used as a potent stimulus for the cerebral vasculature.1–3 Even a small increase in the partial pressure of CO2 (pCO2) has noticeable impacts on the cerebral blood flow (CBF), due to its strong vasodilatory effect. 4 Because of its practicality, reliability, fast recovery, and low toxicity, hypercapnia has been widely used in cerebrovascular research.5–7 Multiple approaches have been developed to induce hypercapnia, including holding breath, 8 , 9 inspiring CO2 10 , 11 and rebreathing exhaled gas. 12
Hypercapnia is the most commonly used stimulus for measuring cerebrovascular reactivity (CVR), which denotes the responsiveness of the cerebral vasculature to vasoactive challenges. 13 Readily measurable both experimentally and clinically, the CVR in response to hypercapnic challenges is an important indicator of cerebral perfusion reserve and vascular function and its alteration has been associated with multiple brain disorders, including ischemic stroke, 14 brain tumor, 15 traumatic brain injury, 16 , 17 and Alzheimer’s disease. 18 Understanding the response of the normal mouse brain to hypercapnia, as presented herein, will pave the way for follow-up studies in the diseased brain and will help the establishment and dissemination of CVR as a diagnostic marker.
Moreover, hypercapnia is widely used to calibrate functional magnetic resonance imaging (fMRI) for quantitative imaging of cerebral oxygen metabolism. 19 With the assumption that short-term hypercapnia alters CBF but not the cerebral metabolic rate of oxygen (CMRO2), it has been used to calibrate the blood oxygen level-dependent (BOLD) signal against CBF 20 . Thus, quantitative assessments of the cerebral metabolic changes in response to hypercapnic challenges may facilitate the optimization of fMRI for CMRO2 imaging with improved accuracy.21–23
In recent years, photoacoustic microscopy (PAM) has drawn increasing attention and been widely applied in biomedical research. 24 , 25 Capable of imaging the optical absorption contrast acoustically, PAM combines the advantages of both optical imaging and ultrasound imaging. 25 , 26 Capitalizing on the strong optical absorption of hemoglobin in the visible range of the light spectrum, PAM is capable of imaging the vasculature in vivo at capillary-level resolution and in a label-free manner. 27 Through spectroscopic separation of oxy- and deoxy-hemoglobin (HbO2 and HbR, respectively), the oxygen saturation of hemoglobin (sO2) can be measured in individual microvessels. 28 Recent advances have enabled PAM to measure two other important hemodynamic parameters—the total concentration of hemoglobin (CHb) and CBF 29 . By combining the simultaneously measured CHb, sO2 and CBF, the multi-parametric PAM has demonstrated its ability to measure regional CMRO2 in mice,30–32 making it an ideal tool to study the effects of hypercapnia on cerebral hemodynamics and oxygen metabolism.
In this work, we comprehensively characterized the multifaceted effects of hypercapnia on cerebral hemodynamics and oxygen metabolism in the mouse brain using the multi-parametric PAM. Given the fact that general anesthesia has strong influence on cerebral hemodynamics and activity, which is known to affect the metabolic response of the brain to hypercapnia, 33 the head-restraint apparatus we previously developed for PAM of the awake brain was adopted. To avoid the out-of-focus issue when imaging across the uneven brain surface, the real-time contour-scanning strategy we recently developed was applied. 34 The structural (i.e., vessel diameter), functional (i.e., CHb, sO2 and CBF), and oxygen-metabolic (i.e., oxygen extraction fraction (OEF) and CMRO2) responses of the awake mouse brain to mild and severe hypercapnia (inhalation of 5% and 10% CO2, respectively) were quantified and compared. The dependences of the responses on the vessel type (arteriole vs. venule) and diameter were studied.
Material and methods
Animal preparation
Male CD-1 mice (9–12 weeks old, 35–45 grams, Charles River Laboratory) were used. All experimental procedures were carried out in conformity with the animal protocol approved by the Institutional Animal Care and Use Committee (IACUC) at the University of Virginia and were conducted in compliance with the Animal Welfare Act (AWA), National Institute of Health Guide for the Care and Use of Laboratory Animals, and ARRIVE (Animal Research: Reporting in Vivo Experiments) guideline 2.0. 35 One day prior to the experiment, a thinned-skull window was created under anesthesia with 1.5% isoflurane for optimal image quality. This one-hour anesthesia was not expected to have a strong residual effect on animal physiology, including cerebrovascular and metabolic responses, during the imaging studies that took place one day later. First, the scalp was shaved with an electric razor. Then, a 2.5-cm incision was made along the middle line. After the scalp was retracted to expose the region of interest (ROI), periosteum on the skull was removed using a scalpel and a scissor. Following the established protocol, 36 the skull was thinned down to ∼100 μm using a surgical dental drill, during which saline flushing was performed periodically to prevent overheat and bleeding. After the window preparation, the mouse scalp was closed using surgical clips, and the incision was treated with povidone iodine to prevent infection. Before returning to its home cage, the animal was injected with 5 mg/kg of ketoprofen subcutaneously for pain relief.
Photoacoustic microscopy of awake mouse brain
As shown in Supplementary Figure S1, two ns-pulsed lasers (BX40-2-G, Edgewave) were used for photoacoustic excitation. To spectroscopically differentiate HbO2 and HbR for sO2 measurement, a polarization-maintaining single-mode fiber (F-SPA, Newport) was used to partially convert one laser output from 532 nm to 558 nm via the stimulated Raman scattering effect. The 558-nm Stokes light was isolated by a bandpass filter (FB560-10, Thorlabs) after the fiber output. Then, the two beams of different wavelengths were combined using a dichroic mirror (FF538-FDi01, Semrock) and coupled into the same single-mode fiber (P1-460B-FC-2, Thorlabs). A beam sampler (BSF10-A, Thorlabs) was placed before the fiber input to pick off ∼5% of the light for real-time monitoring of the laser intensity fluctuation by a high-speed photodiode (FDS100, Thorlabs). The fiber output was mounted on the three-axis scanning head of the PAM system, where the dual-wavelength laser beam was collimated and then focused by a pair of achromatic doublets (AC127-025-A, Thorlabs). An iris (SM05D5, Thorlabs) was placed between the two doublets to control the beam width. The focused beam passed through the central opening of a ring-shaped ultrasonic transducer (inner and outer diameters: 2.2 and 4.0 mm, respectively; focal length: 6.0 mm; central frequency: 35 MHz; 6-dB intensity bandwidth: 70%) and was confocally aligned with the acoustic focus.
To avoid the out-of-focus problem caused by the uneven brain surface, our newly developed real-time contour-scanning strategy was used. 34 Briefly, the contour scan was implemented by moving the scanning head mounted on a vertical motorized stage along the curvature of the mouse brain. To achieve real-time contour scan without prior knowledge of the brain shape, the surface contour of the current B-scan was utilized to guide the contour scan of the next B-scan, which was adjacent to the current B-scan with a small interval of 10 µm. More details can be found in our previous technical report. 34
To avoid the influence of general anesthesia on cerebral hemodynamics and oxygen metabolism, awake-brain imaging was carried out in this study. To secure the awake brain for high-resolution imaging, a nut was adhered to the skull contralateral to the ROI using dental cement about 6 hours before experiments. After cement solidification, the mouse head was fixed in a head-restraint apparatus using a screw and the mouse limbs were rested on an air-floated treadmill. The air pressure was adjusted to allow the mouse to move freely with a reduced reaction force for stress relief. To help the mouse acclimate to head restraint and relieve stress, each mouse was subjected to three training sessions before the imaging studies. Each session lasted for 45minutes, during which the mouse was provided with drink as a positive reward. Animals with signs of pain or stress due to the restraint were excluded from the studies. Then, the mouse, along with the head-restraint apparatus, was placed under the scanning head of the PAM system. For acoustic coupling, a smear of ultrasound gel was applied between the thinned-skull window and a thin sheet of plastic wrap in the bottom of the water tank. The water was kept at 37 °C throughout the imaging period. The detailed procedure for PAM of the awake mouse brain has been previously reported by us. 30
Quantification of cerebral hemodynamics and oxygen metabolism
Capitalizing on the different optical absorption spectra of oxy- and deoxy-hemoglobin (HbO2 and HbR, respectively), their relative concentrations ([HbR] and [HbO2]) can be estimated based on a dual-wavelength PAM measurement. Using photoacoustic signals from two wavelengths (i.e., 532 nm and 558 nm), the sO2 can be calculated as
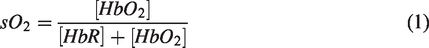
Consequently, the oxygen extraction fraction (OEF) in this region can be derived as
Besides, the CHb can be quantified via statistical analysis of the amplitude fluctuation of the A-line signals acquired at 532 nm—a near-isosbestic point of hemoglobin. Briefly, the average count of RBCs within the detection volume of PAM can be estimated as


Furthermore, the blood flow speed can be quantified via correlation analysis of the PAM A-lines. As reported before,
28
blood flow induces the decorrelation of sequentially acquired A-lines. Thus, the blood flow speed can be quantified by extracting the decay constant of the decorrelation curve. Then, the volumetric blood flow can be calculated by combining the flow speed revealed by the correlation analysis and the vessel diameter extracted from vessel segmentation
32
Based on all the hemodynamic parameters calculated above, the CMRO2 can be derived by using Fick’s law as

Hypercapnia model
To induce hypercapnia, the inhalation gas with preset CO2 concentrations (5% and 10%) was used in this study. Different CO2 concentrations were achieved by mixing pure CO2 and medical air at different flow rates regulated by separate flowmeters. The CO2 concentration of the mixed gas was calibrated by using an anesthesia monitor (ULT KIT, Datex Engstrom).
Blood gas analysis
To confirm that the inhalation of 5% and 10% CO2 induced different levels of hypercapnia, we collected arterial blood samples from the restrained awake mouse with a nosecone mask to prevent gas exchange with ambient air. The awake mouse was put into a tube-shaped animal holder with a small open window at the chest area, allowing convenient access to the heart of the restrained awake mouse. The tube-shaped animal holder has a nosecone mask at one end for CO2 inhalation and a small hole at the other end for placement of the mouse tail to prevent the body movement. After 30-minute CO2 inhalation, a cardiac puncture was performed using a 25-gauge syringe to draw blood from the left ventricle in the awake mouse. To alleviate potential pain, the mouse was subcutaneously injected with 0.25% bupivacaine in the chest area prior to the hypercapnic challenges. The collected blood (about 0.2 mL) was analyzed by a blood gas machine (IRMA, Diametrics Medical) to measure the arterial pCO2 (i.e., PaCO2) and pH. The animal was euthanized immediately after the blood collection.
Statistical analysis
One-way analysis of variance (ANOVA) and post hoc test was used in Figures 3 to 5 to show the structural, functional, and metabolic changes relative to their baseline values and also in Figure S4 to analyze the time dependence of the functional and metabolic changes. Also, two-way ANOVA with repeated measurement was used to compare the differential responses of the brain to mild vs. severe hypercapnia at each time point (Figures 3 and 4) or within each vascular group (Figure 5). Unpaired two-sample t-test was used in Figures S2 and S3 to compare the measurements under different physiological conditions (i.e., normocapnia, mild hypercapnia, and severe hypercapnia). Note that a parametric or non-parametric test was selected based on a Kolmogorov–Smirnov test for normality to assess whether the data followed a normal distribution. All statistical data are presented in the format of mean ± standard deviation. P-values <0.05 were considered significant.
Results
Time-lapse imaging of dynamic cerebrovascular responses to hypercapnia
The cortical ROI of the awake mouse was repeatedly imaged by multi-parametric PAM to record the dynamic responses of cerebral hemodynamics and metabolism to hypercapnia. First, baseline images were taken under normocapnia. After the switch from medical air to the hypercapnic gas, time-lapse imaging was performed every 30 minutes for 2 hours.
To study the dose dependence of cerebrovascular responses to hypercapnia, two different levels of hypercapnia were induced in awake mice by inhalation of hypercapnic gas with 5% or 10% CO2. As shown in Supplementary Figure S2, after 30-minute inhalation of excessive CO2, the blood pH dropped and the PaCO2 elevated in both groups. Compared to the baseline (40.63 ± 2.70 mmHg), the PaCO2 increased to 58.53 ± 3.89 mmHg (p < 0.01) under mild hypercapnia and 83.10 ± 7.88 mmHg (p < 0.01) under severe hypercapnia (Supplementary Figure S2(a)). Associated was decreases in the blood pH from 7.33 ± 0.01 under normocapnia to 7.19 ± 0.05 (p < 0.01) under mild hypercapnia and to 7.09 ± 0.02 (p < 0.01) under severe hypercapnia (Supplementary Figure S2(b)). Our results are in good agreement with recent studies in rats and piglets under similar hypercapnic challenges. 40 , 41
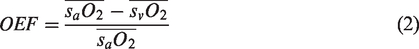
The arterial and venous sO2 were readily distinguishable when the mouse was under normocapnia (Figures 1 and 2). However, a noticeable elevation in the venous sO2 was observed within 30-minute induction of mild hypercapnia (white arrows in Figure 1) making it less distinguishable from the arterial sO2. Accompanied were blood flow speed increase and arterial dilation (yellow arrows in Figure 1) which together led to an increase in regional CBF. Continuous multi-parametric imaging over the 2-hour period of mild hypoxia shows a gradual renormalization of sO2 and blood flow. Increases in the venous sO2 and the blood flow were also observed under severe hypercapnia (Figure 2). However, in contrast to the hemodynamic renormalization after 120 minutes of mild hypercapnia, the venous sO2 and the blood flow remained noticeably higher than their baseline values throughout the 2-hour challenge with 10% CO2 (white and yellow arrows in Figure 2). Besides the hemodynamic changes, arterial dilation was also observed in response to severe hypercapnia.
Time-lapse PAM of sO2 and blood flow speed during the 120-minute hypercapnic challenge induced by 5% CO2 inspiration. The yellow and white arrows highlight changes in the arteriole and venule, respectively. Scale bar: 500 µm.
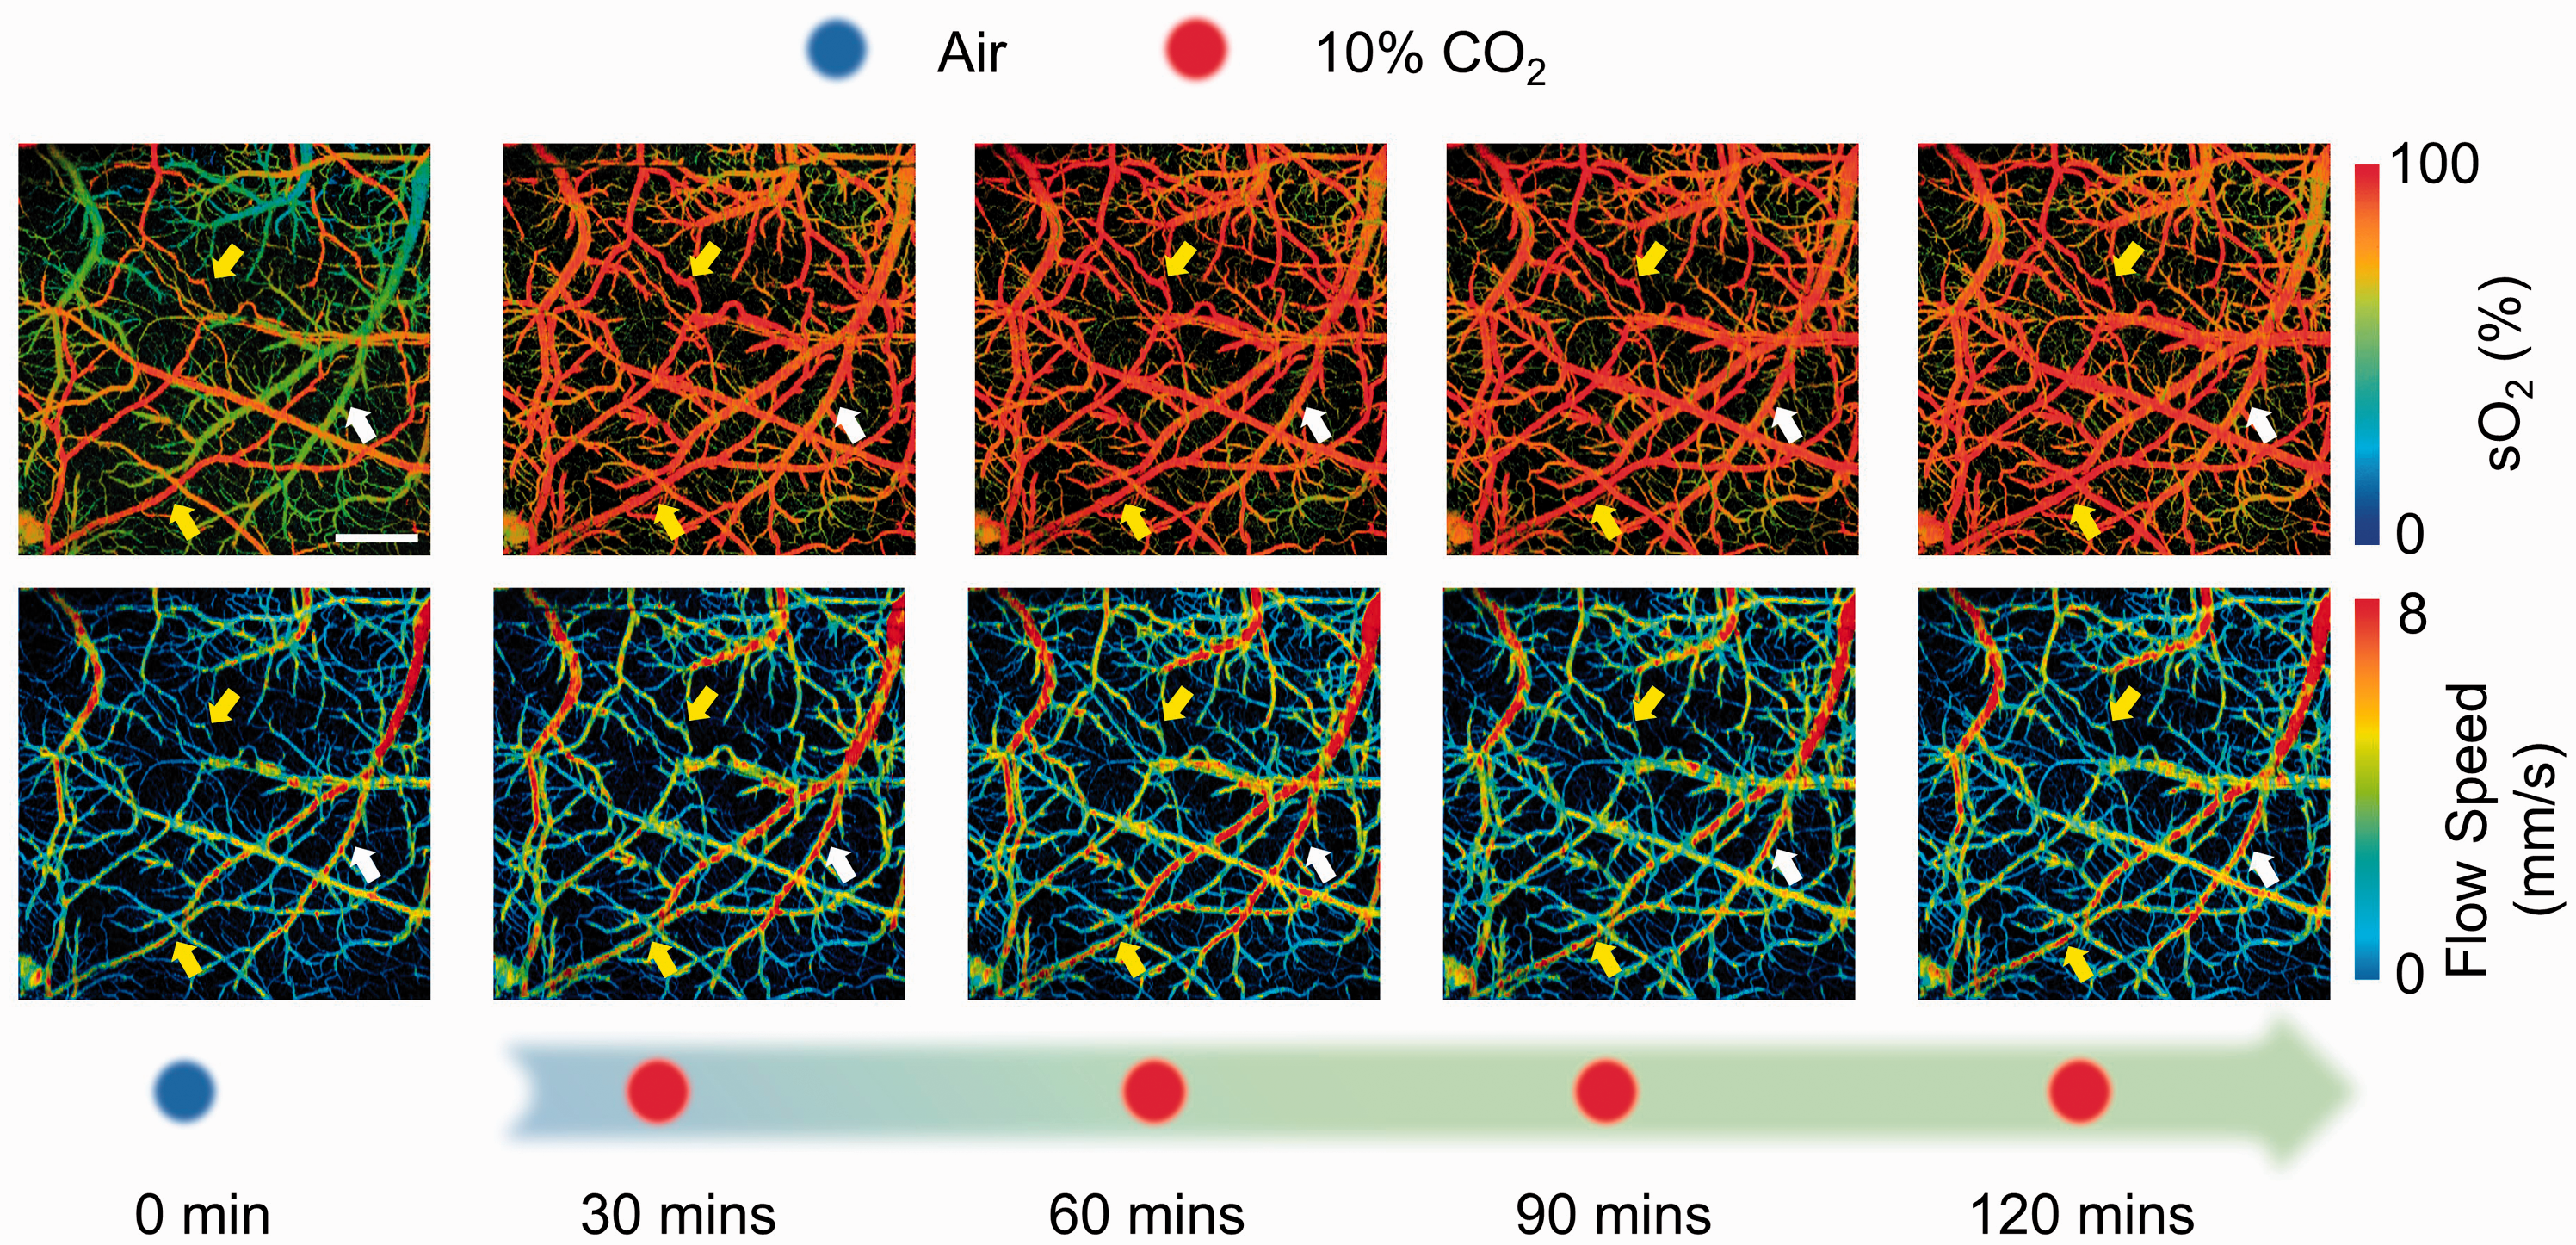
Time-lapse PAM of sO2 and blood flow speed during the 120-minute hypercapnic challenge induced by 10% CO2 inspiration. The yellow and white arrows highlight changes in the arteriole and venule, respectively. Scale bar: 500 µm.
Hypercapnia-induced changes in the cerebrovascular function
With the aid of vessel segmentation analysis, the average diameter, CHb, sO2 and blood flow speed of individual microvessels in the ROI were quantified before and after the induction of hypercapnia, from which the percentage changes from their baseline values were calculated (Figure 3). Note that there were no statistically significant differences between the baseline vascular parameters in the two groups of animals subject to mild or severe hypercapnia (Supplementary Figure S3).
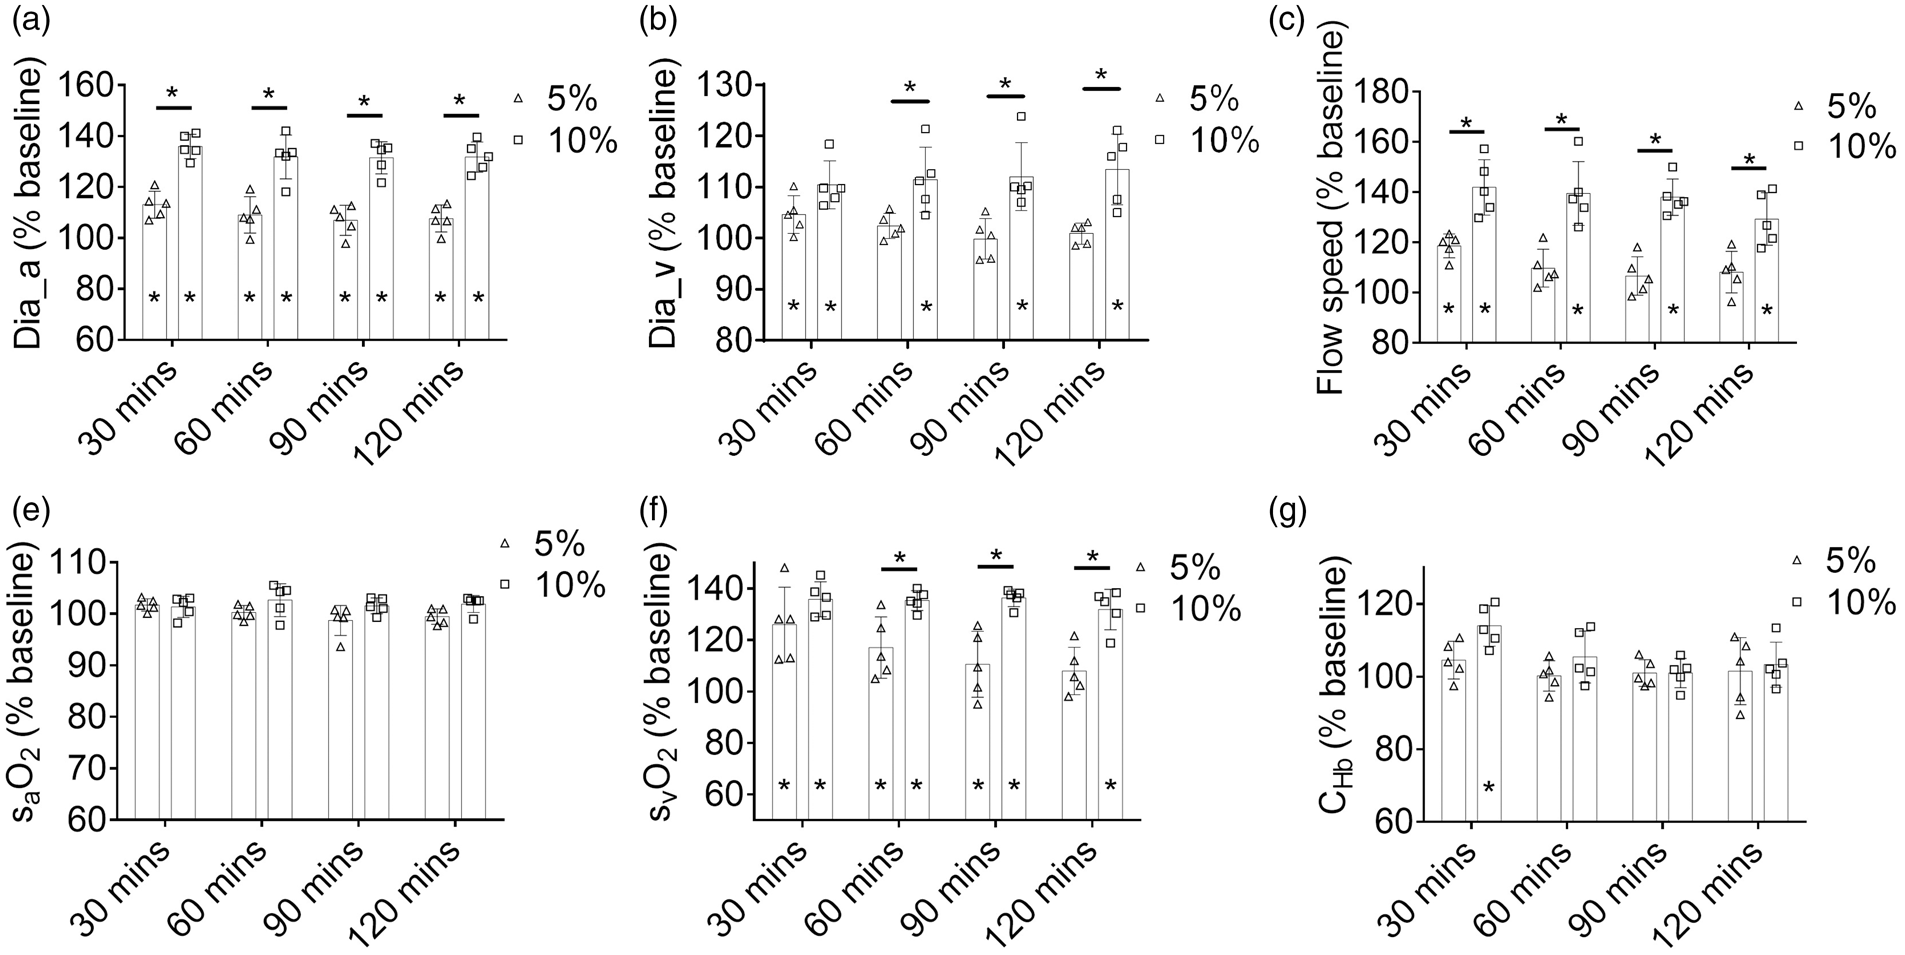
Changes in the average (a) arteriole diameter, (b) venule diameter, (c) flow speed, (d) arterial sO2, (e) venous sO2, and (f) CHb over the 120-minute hypercapnic challenge induced by 5% or 10% CO2 inhalation. Data are presented as mean ± SD (n = 5). *,p < 0.05.
Significant and enduring arterial dilation was observed under both mild and severe hypercapnia (Figure 3(a)), but the vasodilatory effect was more pronounced under severe hypercapnia [135.9 ± 4.7% (p < 0.01) of the baseline at 30 minutes and 131.8 ± 5.9% (p < 0.01) at 120 minutes] than mild hypercapnia [113.1 ± 5.3% (p < 0.01) at 30 minutes and 107.7 ± 5.2% (p = 0.026) at 120 minutes]. In contrast, enduring venous dilation was observed only under severe hypercapnia but not mild hypercapnia (Figure 3(b)). The venous dilation maintained above 10% throughout the 2-hour period of severe hypercapnia [from 110.4 ± 4.6% (p = 0.011) of the baseline at 30 minutes to 113.5 ± 6.9% (p = 0.013) at 120 minutes], while the mild hypercapnia-induced venous dilation was rather transient and less pronounced—showing moderately enlarged diameter (104.6 ± 3.5% of the baseline, p = 0.04) at 30 minutes and returning to the baseline (100.9 ± 2.0%, p = 0.33) at 120 minutes. Inhalation of CO2 also increased the blood flow speed (Figure 3(c)). Similar to the venous dilation, the flow speed increase under severe hypercapnia [141.9 ± 11.1% (p < 0.01) of the baseline at 30 minutes and 129.3 ± 10.4% (p < 0.01) at 120 minutes] was more pronounced and enduring than that under mild hypercapnia [118.6 ± 4.8% (p < 0.01) at 30 minutes and 108.1 ± 8.3% (p < 0.01) at 120 minutes]. Also, the two-way ANOVA analysis showed that the CO2 level was a major contributor to the differential responses in blood flow speed [F(1, 8)=29.55, p < 0.01]. While the arterial sO2 remained unchanged under both mild and severe hypercapnia (Figure 3(d)), the venous sO2 was significantly elevated under both conditions (126.1 ± 14.6% (p < 0.01) and 135.9 ± 6.8% (p < 0.01) of the baseline at 30 minutes under mild and severe hypercapnia, respectively). Similar to the blood flow speed, the venous sO2 gradually returned to the baseline level (108.0 ± 9.2% at 120 minutes, p = 0.10) under mild hypercapnia (Figure 3(e)). In contrast, the venous sO2 remained significantly above the baseline throughout the 2-hour severe hypercapnia (131.9 ± 7.9% at 120 minutes, p < 0.01). It is worth noting that both time [F(3, 24) = 8.416, p < 0.01] and CO2 levels [F(1, 8)=12.98, p < 0.01] were significant factors underlying the changes in venous sO2 and that there was a strong interaction between the two factors [F(3, 24)=5.01, p < 0.01]. The CHb remained unchanged under mild hypercapnia, but slightly increased in the first 30 minutes of severe hypercapnia (113.9 ± 5.6% of the baseline, p < 0.01) and then returned to the baseline level (Figure 3(f)).
Hypercapnia-induced changes in the cerebral oxygen metabolism
Combining the structural and functional cerebrovascular parameters measured by multi-parametric PAM and quantified using the segmentation analysis, the regional CBF and OEF can be derived, from which the CMRO2 can be estimated. The methodology for the quantification of CBF, OEF, and CMRO2 is detailed in the section of Material and Methods.
As shown in Figure 4(a), a substantial and enduring increase in the regional CBF in response to severe hypercapnia was observed over the course of the 120-minute PAM monitoring [from 185.2 ± 14.3% (p < 0.01) of the baseline at 30 minutes to 174.7 ± 13.4% (p < 0.01) at 120 minutes]. In contrast, the CBF increase caused by mild hypercapnia was less pronounced and more transient [from 128.3 ± 6.9% (p < 0.01) at 30 minutes to 113.5 ± 15.5% (p = 0.19) at 120 minutes]. The two-way ANOVA analysis showed that both the CO2 level [F(1, 8)=65.84, p < 0.01] and time [F(3, 24)=3.87, p = 0.022] have significant impacts on the changes in CBF. The increase in CBF was coupled with a drop in the regional OEF, which was mainly due to the increase of venous sO2 since the arterial sO2 remained unchanged. As shown in Figure 4(b), the OEF showed an abrupt decrease under both mild and severe hypercapnia [42.2 ± 18.0% (p < 0.01) and 10.5 ± 6.3% (p < 0.01) of the baseline at 30 minutes, respectively], followed by a gradual and hypercapnia level-dependent recovery [81.1 ± 15.2% (p = 0.047) and 24.4 ± 20.9% (p < 0.01) at 120 minutes for mild and severe hypercapnia]. Given the lack of changes in arterial sO2 and CHb, CMRO2 was proportional to the product of CBF and OEF, according to equation (6). Although the increased CBF and decreased OEF had opposite effects on CMRO2, it resulted in a reduced CMRO2 under hypercapnia, which indicates that OEF plays a dominant role. Interestingly, the amplitude and duration of the reduction are CO2 level-dependent (Figure 4(c)). Under mild hypercapnia, the CMRO2 reduced to 56.9 ± 23.1% (p = 0.036) of the baseline in the first 30 minutes and then gradually returned to the baseline at 120 minutes (91.4 ± 13.9%, p = 0.18). In contrast, severe hypercapnia induced a more substantial initial decrease in the CMRO2 (25.9 ± 7.7%, p < 0.01), which partially recovered over the 2-hour monitoring period but remained significantly lower than the baseline level (45.8 ± 28.1% at 120 minutes, p = 0.018). The two-way ANOVA analysis showed that the CO2 level was a major contributor to the changes in both OEF [F(1, 8) = 21.12, p < 0.01] and CMRO2 [F(1, 8) = 9.36, p = 0.016].
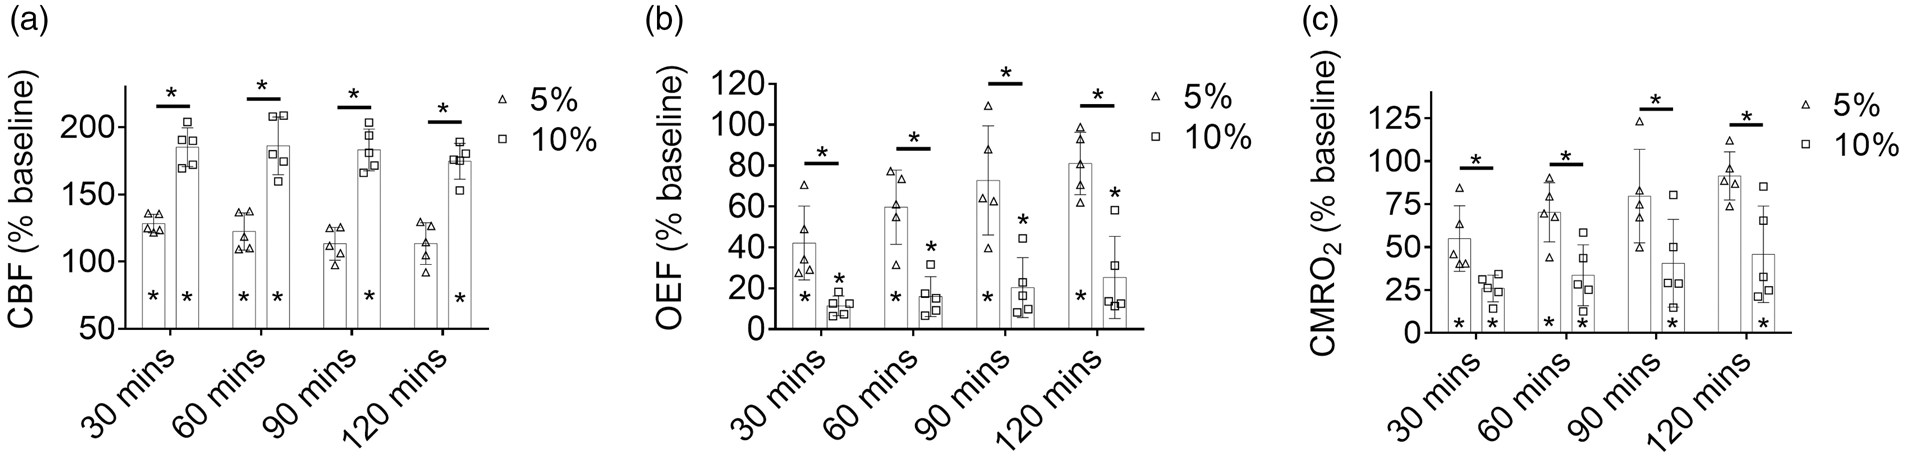
Changes in (a) CBF, (b) OEF, and (c) CMRO2 over the 120-minute hypercapnic challenge induced by 5% or 10% CO2 inhalation. Data are presented as mean ± SD (n = 5). *, p < 0.05.
Vessel type-dependent responses to hypercapnia
According to Figure 3, the difference in the acute cerebrovascular responses (i.e., 30 minutes) to mild and severe hypercapnia can be mainly attributed to that in the vessel diameter and blood flow. To investigate whether the differential responses are vessel type-dependent and, if so, which type(s) is most responsible, we classified the segmented vessels into four different categories based on the baseline diameter and sO2 measured under normocapnia (large vessel vs. small vessel, and arteriole vs. venule). Vessels with a diameter less than 40 µm were considered small arterioles/venules. 30 , 32
As shown in Figure 5(a), within 30 minutes of CO2 challenge, although all four types of cortical vessels underwent vasodilation in response to both levels of hypercapnia, the small arteriole was a major contributor to the differential responses [118.6 ± 17.0% (p < 0.01) under mild hypercapnia and 148.9 ± 12.1% (p < 0.01) under severe hypercapnia]. Similarly, small arterioles showed a more significant increase in flow speed in response to severe hypercapnia than mild hypercapnia (159.2 ± 38.4% vs. 123.3 ± 20.7%, p < 0.01). In contrast, the flow speed increases in large arterioles under both levels of hypercapnia showed no difference (120.4 ± 12.2% vs. 121.9 ± 12.3%, p = 0.77), as shown in Figure 5(b). Commensurate with the arteriolar flow increase were those in small and larger venues, both of which were significantly larger under severe hypercapnia. The increases in vessel diameter and flow speed together resulted in the elevation of volumetric blood flow (Figure 5(c)), which again showed that the small arteriole is a major contributor to the hypercapnia level-dependent response [181.2 ± 71.7% (p < 0.01) and 355.3 ± 93.7% (p < 0.01)].
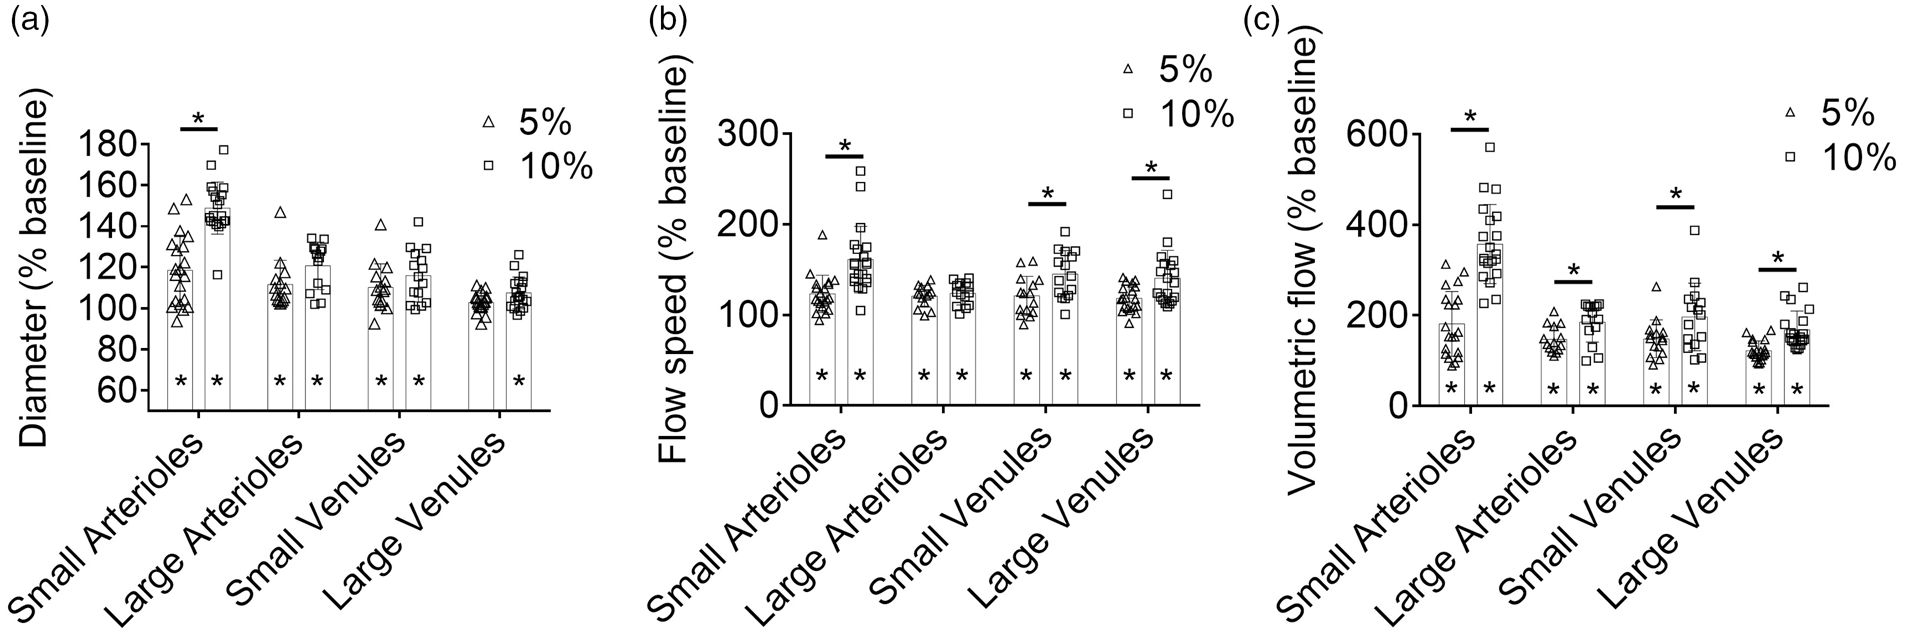
Vessel type-dependent responses of (a) vessel diameter, (b) flow speed, and (c) volumetric flow to hypercapnia within the first 30-minute inhalation of 5% or 10% CO2. These vessels (20 small arterioles, 14 large arterioles, 15 small venules, and 19 large venules) were from five mice. Data are presented as mean ± SD. *, p < 0.05.
Discussion
Accounting for ∼20% of the total oxygen consumption of the body at rest but lacking of ability to store oxygen, the brain relies on adequate blood supply to function properly. 42 The delicate balance between the energy demand imposed by neural activities and the oxygen supply provided by the blood circulation is maintained by ubiquitously presented microvessels in the brain. Subtle changes in the autoregulation of microvascular diameter, blood oxygenation, and/or blood flow can lead to severe problems in brain function and metabolism. Indeed, impairments of the CVR, particularly in the microvasculature, have been associated with a wide range of brain diseases, including stroke, tumor, small vessel disease, traumatic brain injury, and Alzheimer’s disease. 13 Thus, quantitative assessment of the CVR is crucial for understanding the vascular underpinning of brain physiology and pathology. Recent advances in fMRI have enabled single-vessel imaging at the mesoscopic level; 43 however, the CVR of small arterioles and venules remains inaccessible. More importantly, it remains a challenge to fully dissect and interpret the BOLD signal, which blends the multifaceted changes in sO2, CBF, blood volume, and CMRO2. Although allowing high-resolution imaging of the microvasculature, 44 , 45 ultrasound localization microscopy and multi-photon microscopy (MPM) require angiographic agents and have limited accessibility to sO2 (and thus OEF and CMRO2). Uniquely capable of comprehensive imaging of microvascular blood perfusion, oxygenation, flow, and concomitant tissue oxygen extraction and metabolism, 30 , 32 multi-parametric PAM is ideally suited for quantitative and comprehensive assessment of CVR.
Using multi-parametric PAM, we studied the effects of hypercapnia—a widely used physiological challenge for the CVR measurement13—on cerebral hemodynamics and oxygen metabolism in the awake mouse brain under the resting state. Our results provide microscopic insights into different aspects of CVR. Specifically, our data show multifaceted vascular reactivity of the awake mouse brain to hypercapnic challenges, including the increases in vessel diameter, flow speed, and venous sO2. These vascular responses lead to increased regional CBF and decreased OEF, which, however, are not commensurate with each other and result in reduced CMRO2.
Longitudinal monitoring of the cerebrovascular and metabolic responses to hypercapnia further reveal that they are dynamic and CO2 level dependent. Specifically, the metabolic responses (i.e., OEF and CMRO2) of the awake mouse brain to 5% CO2 were time-dependent and showed a gradual and significant recovery over the two-hour monitoring, in contrast to the moderate and statistically insignificant recovery under severe hypercapnia (Figure S4). The multifaceted vascular and metabolic responses to mild hypercapnia (5% CO2) are less pronounced and enduring than those to severe hypercapnia (10% CO2). Also, the microscopic resolution of multi-parametric PAM and the segmentation-enabled single-vessel analysis together enable us to dissect the differential responses of arterioles and venules of different diameters to the different levels of hypercapnia, revealing that the small arteriole plays an essential role in the hypercapnia level-dependent CVR.
Our findings are in general agreement with earlier hypercapnia studies in both animals and humans. Specifically, the vasodilatory responses of the awake mouse brain to mild hypercapnia observed by multi-parametric PAM (13.1% in arterioles and 4.6% in venules) are in agreement with those observed by MPM (10.5% in arterioles and 4.1% in venules). 46 Also, the mild hypercapnia-induced increase of blood flow speed in the awake mouse brain is observed by both PAM and laser speckle imaging (LSI), 46 although the increase observed in our study (18.6%) is larger than that in the LSI study (9.6%). Moreover, the mild hypercapnia-induced increase of venous sO2 observed by PAM in the awake mouse brain (26.1%) is consistent with that observed by fMRI in the awake human brain (26.1% in Xu et al. 47 and .200% in Jain et al. 6 ). Further, the predominant responses of small arterioles to hypercapnia observed by PAM echo previous observations by MPM in the awake mouse brain. 46 The gradual recovery of cerebral hemodynamics and metabolism during the 2-hour hypercapnia is in line with the previously reported compensatory response to chronic hypercapnia, 48 and the more significant recovery under mild hypercapnia is in agreement with the previous observation that the extent of compensation is inversely related to the severity of hypercapnia. 48 Also, the hypercapnia level-dependent CMRO2 suppression is consistent with the dose-dependent effect of hypercapnia on spontaneous neural activity observed in nonhuman primates by intracortical recording. 49
Although the mild hypercapnia-induced change in the venous sO2 (also OEF, which can be directly derived from sO2) measured by PAM agrees with that measured by fMRI, there is a considerable discrepancy in the observed CBF changes—28.3% increase in our PAM study vs. 54.5% or 63.3% in previous fMRI studies. 6 , 47 The discrepant findings might be partially attributed to the regional heterogeneity of brain’s responses to hypercapnia. 50 Indeed, in our microscopic PAM study, CBF was measured over the motor cortex. While in the macroscopic fMRI studies, CBF was measured either in the superior sagittal sinus 47 or over the entire brain. 6 Thus, although with similar OEF measurements, the different readouts of the CBF response might lead to different findings of the effect of hypercapnia on CMRO2.
Our findings of reduced CMRO2 under hypercapnia is in general agreement with some previous findings in animals 51 and humans, 47 despite other studies to the contrary. 6 , 50 However, the mild hypercapnia-induced CMRO2 reduction observed by PAM (43.1%) in the awake mouse brain is higher than that observed by PET in the anesthetized nonhuman primate brain (29.4%) 51 and by fMRI in the awake human brain (13.4%). 47 The discrepancy might be due to the differences in the imaging methodology, the duration of the hypercapnic challenge, the use of anesthetic agents, the species studied, and the regional heterogeneity of brain’s responses to hypercapnia.
The present study has limitations. The first lies in the imaging speed of the multi-parametric PAM. Due to the relatively low speed of the mechanical scan, the PAM system used in this study requires ∼20 minutes to acquire a set of multi-parametric images. Thus, the duration of hypercapnia used in this study is much longer than that typically used in fMRI studies (3–5minutes), 6 , 47 which may lead to different findings because acute increases in PaCO2 have not shown significant reduction in CMRO2 in normal humans. 51 Also, the long duration of hypercapnia with high PaCO2 may lead to global cerebral edema and suppress the brain activity. 13 , 52 To improve the imaging speed of PAM, higher repetition-rate lasers and faster scanning mechanisms are needed. Our recent development has improved the imaging speed of multi-parametric PAM by 20-fold, 55 enabling follow-up studies in the acute hypercapnia setting. It is worth noting that studies of cerebral blood flow dynamics in awake mice using optical coherence tomography and two-photon microscopy have been reported recently, providing alternative apporaches to study the brain responses to acute hypercapnia. 53 , 54 Second, the methods for the induction and maintenance of hypercapnia can be improved. Mixing CO2 with air, which was previously used for fMRI studies, 6 might lead to slightly reduced oxygen content in the gas mixture (20% and 19% O2 in the mild and severe hypercapnia settings, respectively). 56 Although there is no evidence that such mild hypoxia can influence the cerebral hemodynamics and metabolism, premixed hypercapnic gas with 21% O2 should be used in future studies to avoid possible confounding effects. 13 Also, the hypercapnia level should be maintained by monitoring end-tidal pCO2. Inspiration of CO2 with a fixed concentration might induce variations in PaCO2. 7 It is worth mentioning that the end-tidal pCO2 measurement is more commonly used in hypercapnia studies because it is non-invasive and can be performed continuously. In this study, however, we measured the PaCO2 instead due to the difficulty of measuring the end-tidal pCO2 in awake mice. Thus, our reported PaCO2 values under hypercapnia may be different from the end-tidal pCO2 values reported in some previous studies. 13 Moreover, to ensure a consistent PaCO2 level, dynamic end-tidal forcing and perspective end-tidal targeting techniques can be used,57–59 which, however, involves sophisticated airway control and gas delivery.
In summary, we have studied the cerebral hemodynamic and oxygen-metabolic responses to CO2 inhalation-induced mild and severe hypercapnia in the awake mouse using multi-parametric PAM. Our results show that both mild and severe hypercapnia (inducted by 5% and 10% CO2 inhalation, respectively) can induce significant vasodilation, flow speed increase, and venous sO2 elevation, which together result in increased CBF and decreased OEF. Instead of maintaining CMRO2 at the level of normocapnia, the coupled changes in CBF and OEF are not commensurate with each other and lead to reduced regional CMRO2, indicating that hypercapnia has a suppressive effect on brain activity and metabolism. Further, side-by-side comparison of the PAM readouts under mild and severe hypercapnia shows that cerebral hemodynamic and metabolic responses are hypercapnia level-dependent and that severe hypercapnia induces more pronounced and enduring responses. These findings may guide the application of CO2 manipulation to assess cerebrovascular reactivity and the use of hypercapnia to calibrate fMRI signals. In addition, many patients with pulmonary diseases have CO2 retention, our findings imply complex hemodynamic and metabolic changes in their brain.
Supplemental Material
sj-pdf-1-jcb-10.1177_0271678X211010352 - Supplemental material for Hemodynamic and oxygen-metabolic responses of the awake mouse brain to hypercapnia revealed by multi-parametric photoacoustic microscopy
Supplemental material, sj-pdf-1-jcb-10.1177_0271678X211010352 for Hemodynamic and oxygen-metabolic responses of the awake mouse brain to hypercapnia revealed by multi-parametric photoacoustic microscopy by Rui Cao, Angela Tran, Jun Li, Zhiqiang Xu, Naidi Sun, Zhiyi Zuo and Song Hu in Journal of Cerebral Blood Flow & Metabolism
Footnotes
Funding
The authors disclosed receipt of the following financial support for the research, authorship, and/or publication of this article: this study was supported by the National Institutes of Health (NS099261 and NS099118), the National Science Foundation (20,23,988), and the American Heart Association (15SDG25960005).
Declaration of conflicting interests
The author(s) declared no potential conflicts of interest with respect to the research, authorship, and/or publication of this article.
Authors’ contributions
SH and RC conceived the study; RC and AT performed experiments and data analysis; RC and JL established the animal model and blood gas analysis; RC, ZX, and NS built the multi-parametric PAM system; RC, AT, ZZ, and SH wrote the manuscript.
Supplementary material
Supplemental material for this article is available online.
References
Supplementary Material
Please find the following supplemental material available below.
For Open Access articles published under a Creative Commons License, all supplemental material carries the same license as the article it is associated with.
For non-Open Access articles published, all supplemental material carries a non-exclusive license, and permission requests for re-use of supplemental material or any part of supplemental material shall be sent directly to the copyright owner as specified in the copyright notice associated with the article.