
Abstract
The perivascular astrocyte endfoot is a specialized and diffusion-limited subcellular compartment that fully ensheathes the cerebral vasculature. Despite their ubiquitous presence, a detailed understanding of endfoot physiology remains elusive, in part due to a limited understanding of the proteins that distinguish the endfoot from the greater astrocyte body. Here, we developed a technique to isolate astrocyte endfeet from brain tissue, which was used to study the endfoot proteome in comparison to the astrocyte somata. In our approach, brain microvessels, which retain their endfoot processes, were isolated from mouse brain and dissociated, whereupon endfeet were recovered using an antibody-based column astrocyte isolation kit. Our findings expand the known set of proteins enriched at the endfoot from 10 to 516, which comprised more than 1/5th of the entire detected astrocyte proteome. Numerous critical electron transport chain proteins were expressed only at the endfeet, while enzymes involved in glycogen storage were distributed to the somata, indicating subcellular metabolic compartmentalization. The endfoot proteome also included numerous proteins that, while known to have important contributions to blood-brain barrier function, were not previously known to localize to the endfoot. Our findings highlight the importance of the endfoot and suggest new routes of investigation into endfoot function.
Introduction
Astrocytes comprise ∼30% of the neuroparenchymal volume and are numerically equal to neurons.1,2 Astrocytes mediate numerous roles that are distributed among their many specialized processes. Through these processes, each astrocyte contacts ∼4 neuronal somata, ∼105 synapses, and 1–2 blood vessels.3,4
Perivascular astrocyte endfeet are highly specialized, diffusion-limited cellular processes that fully ensheathe the vertebrate cerebral vasculature.5–9 Despite their ubiquitous presence, a detailed understanding of endfoot physiology remains elusive. Endfeet have been linked to numerous functions, including nutrient uptake,10,11 modulation of vascular tone,12–15 brain water homeostasis, 16 blood-brain barrier (BBB) differentiation, 17 and glymphatic flux. 18 However, their precise contribution to these functions, and even their necessity to a healthy brain, remains incompletely understood.
Progress in understanding endfoot physiology has been stymied by a limited understanding of the proteins that distinguish the endfoot from the greater astrocyte body. To date there are only 10 astrocytic proteins known to be enriched at the endfoot. These endfoot proteins include aquaporin-4, 19 β-dystroglycan, 20 α1-syntrophin, 21 dystrophin, 22 α-dystrobrevin, 22 utrophin, 23 limitrin, 24 laminin, 25 glucose transporter (GLUT) 1, 26 and connexin-30. 27 The technical challenges involved in isolating specific subcellular processes have posed an obstacle to studying the endfoot as a distinct entity.
Here, to overcome this obstacle, we developed a novel technique to isolate astrocyte endfeet from brain tissue. We then studied the proteome of astrocyte endfeet in comparison to the astrocyte somata. Our dataset expands the known endfoot-specific proteome from the previously reported 10 proteins to 516 proteins, which together comprised more than 1/5th of the detected astrocyte proteome. Interestingly, numerous critical electron transport chain (ETC) proteins were exclusively detected at the endfeet, while enzymes involved in glycogen storage were mostly distributed to the somata, indicating subcellular metabolic compartmentalization. The endfoot proteome also included numerous proteins that, while previously known to have important contributions to BBB development and function, were not previously known to localize to the endfoot.
Materials AND methods
Isolation of astrocyte endfeet and somata
Animal experiments were approved by the Institutional Animal Care and Use Committee of the University of Maryland and were performed in accordance with the NIH Guide for the Care and Use of Laboratory Animals. Experiments are reported in compliance with the ARRIVE guidelines. Approximately 50 mice were utilized for this study.
Astrocyte endfeet were isolated from adult (22–25 g) male C57BL/6 mice (Figure 1(a)). Prior to brain harvest, mice were euthanized with pentobarbital overdose, whereupon they were intracardially perfused with cold saline and the whole brain was dissected from the skull. All subsequent steps were conducted on ice. First, cerebral microvessels were isolated from mouse brain using the method described by Boulay et al.28,29 Importantly, these microvessels remain coated with β-dystroglycan and aquaporin-4 positive astrocyte endfeet that are “amputated” from their parent astrocyte somata (Figure 1(b) to (d)). Isolated microvessels were then dissociated into a single cell suspension for 60 minutes at 37 °C in 20 U/mL DNAseI and 100 µg/mL Liberase DL (cat. 5,40,11,60,001 Millipore Sigma), followed by centrifugation at 300 g for 30 min to clear large cells and debris. The remaining suspension was pelleted at 13,000 g for 30 min, and then resuspended in AstroMACS separation buffer (cat. 130-117-336, Miltenyi Biotec. The Miltenyi Biotec adult mouse astrocyte isolation protocol (cat. 130-097-678, Miltenyi Biotec),30,31 which relies on the plasmalemma marker ACSA-2 to separate astrocytes, was used to isolate astrocyte endfeet from the suspension. Approximately 5 µg of endfoot protein was obtained from a single adult mouse brain.
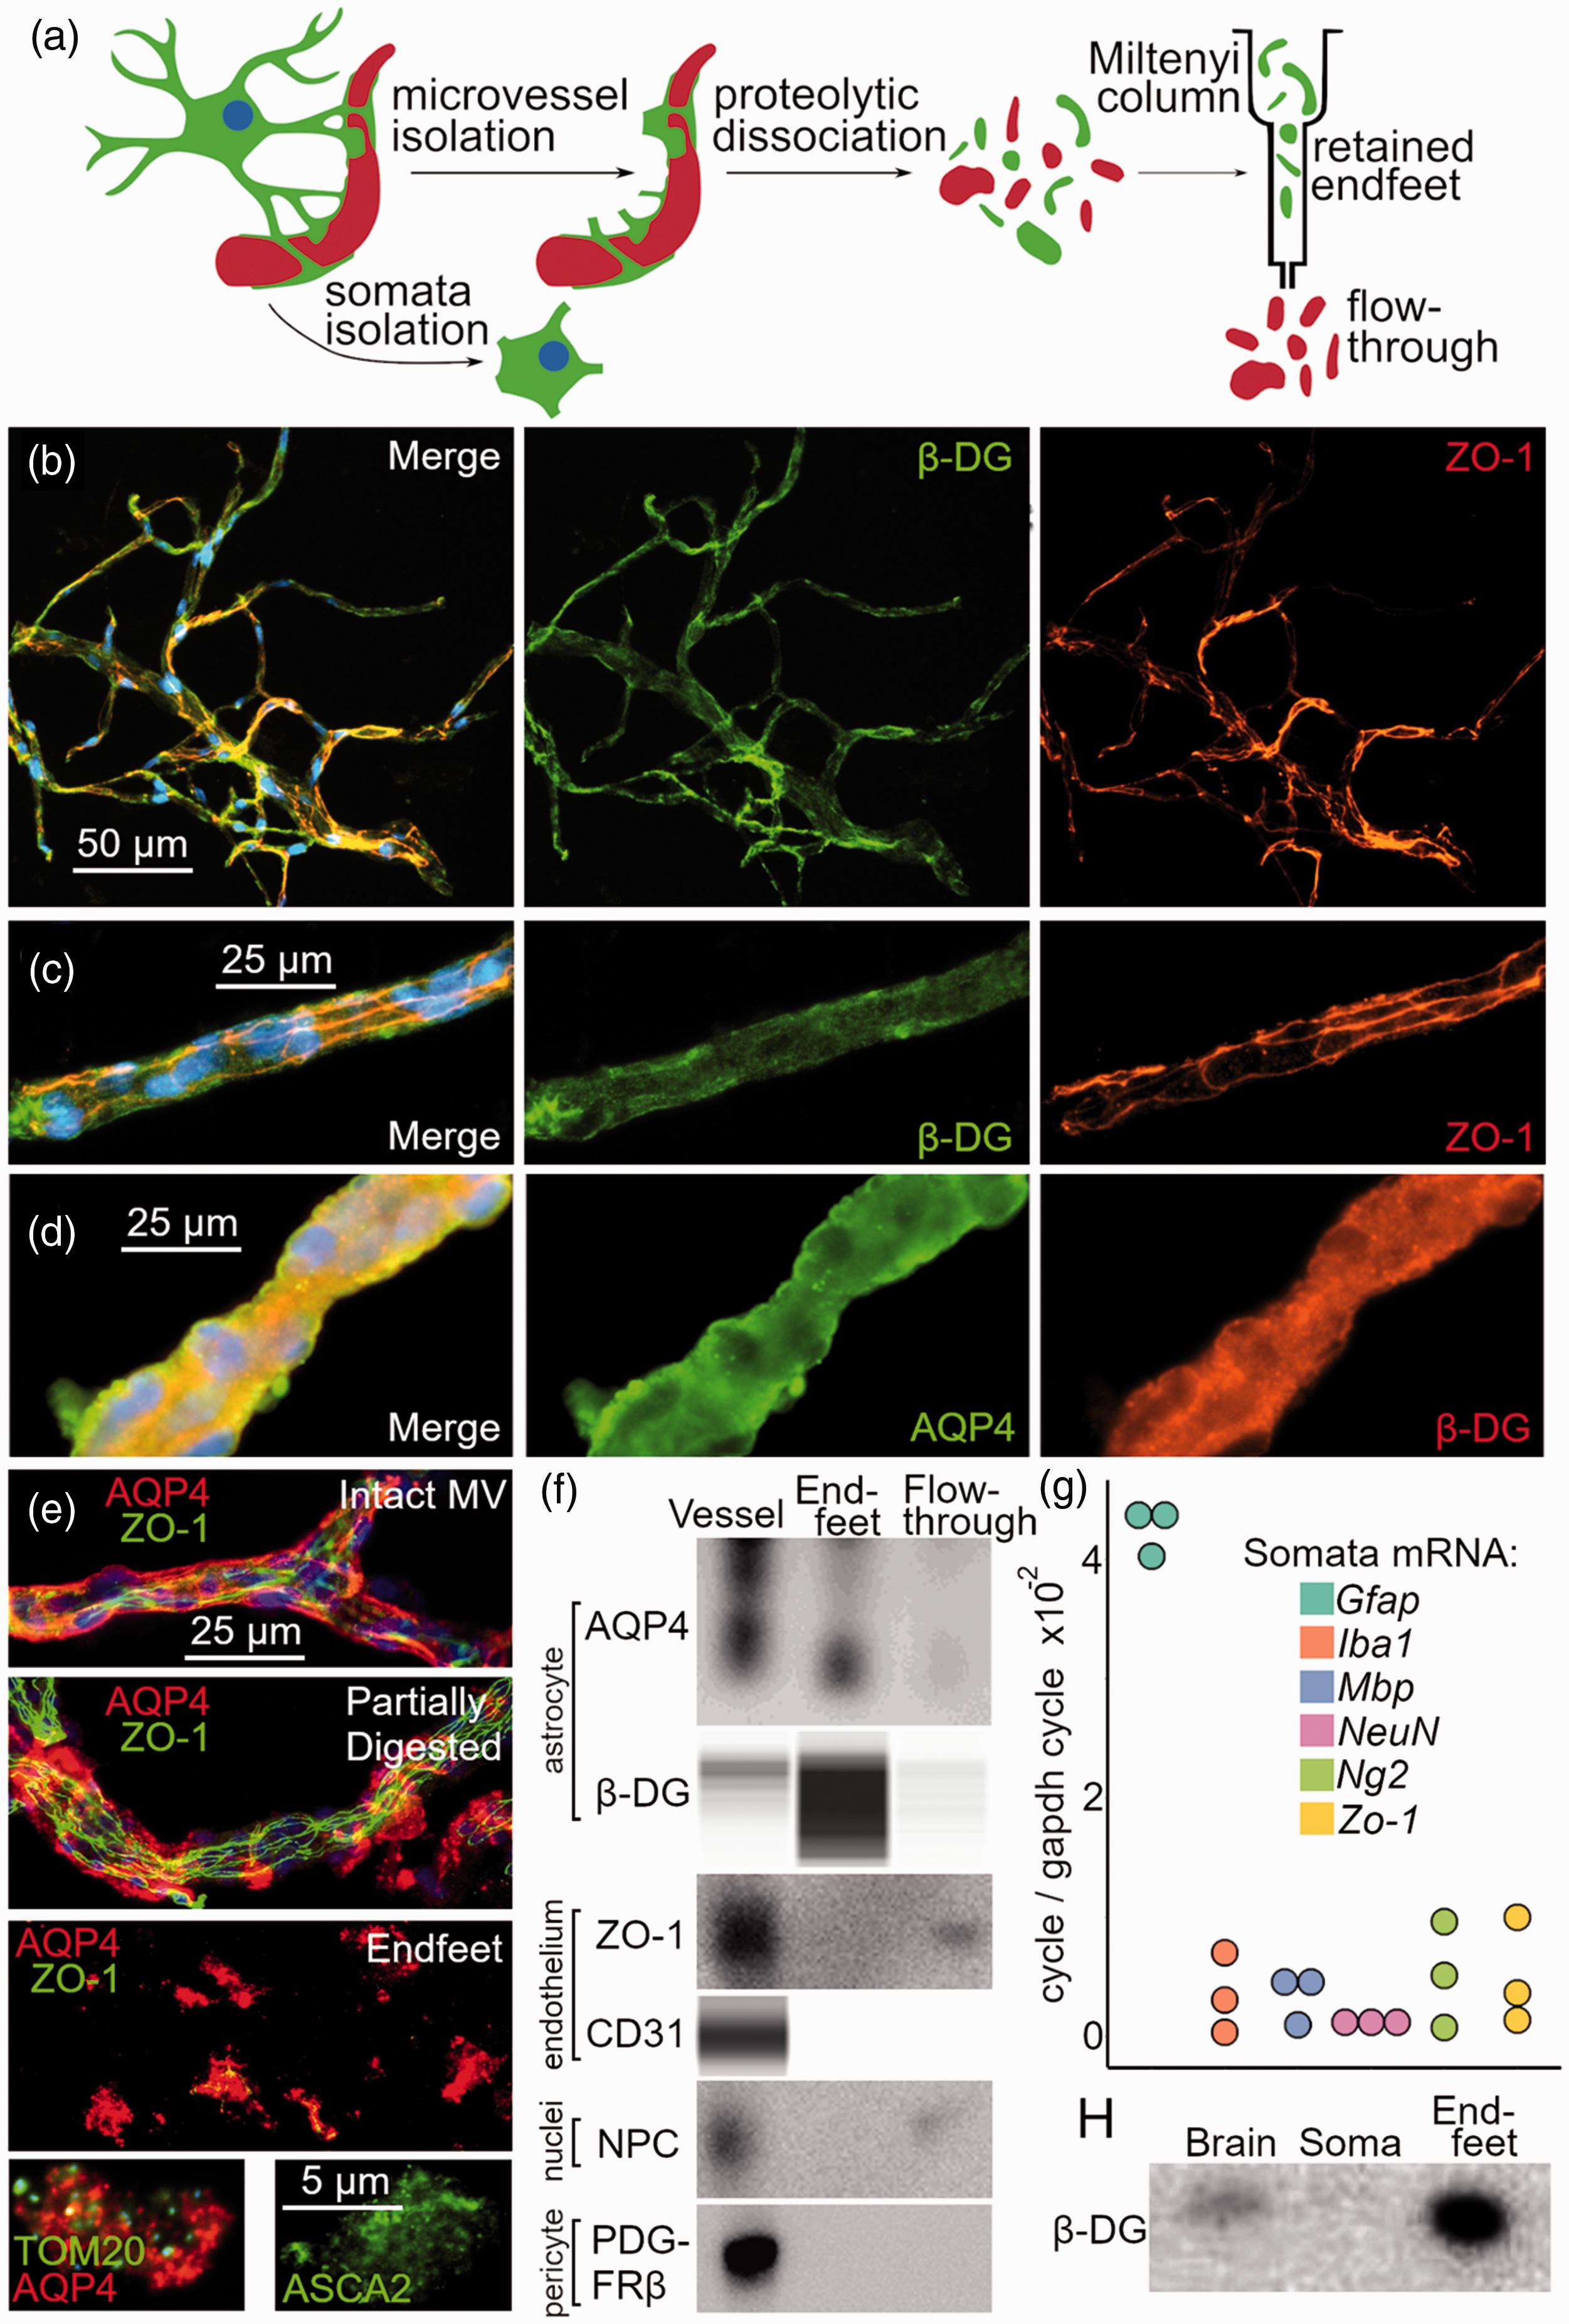
Isolation of perivascular astrocyte endfeet. (a) Diagram of the endfoot isolation protocol showing steps of isolation: (i) isolation of microvessels, (ii) proteolytic dissociation of microvessels into single-cell suspension and (iii) column-based magnetic bead separation of endfeet from suspension. (b–d) Micrographs of isolated mouse microvessels (MV) (b–d) immunolabeled for endfoot markers β-dystroglycan (β-DG) and aquaporin-4 (AQP4), and endothelial marker zonulin-1 (ZO-1); DAPI labeling in blue. (e) Micrographs of isolated intact MV, partially digested MV, and isolated endfeet immunolabeled for AQP4 and ZO-1; individual endfeet (bottom row) also exhibit labeling for the mitochondrial marker TOM20, and the astrocyte-specific marker ASCA2; DAPI labeling in blue. (f) Immunoblot for AQP4, ZO-1, the nuclei marker nuclear pore complex (NPC), and the pericyte marker PDGFRβ, and capillary electrophoresis immunoassay for β-DG and CD31 in isolated MV, isolated endfeet, and the column flow-through, showing that MV exhibit all markers, isolated endfeet exhibit AQP4 and β-DG, and the flow-through exhibits ZO-1, CD31, and NPC, indicating enrichment of endfeet and depletion of contaminants. (g) qPCR analysis of isolated astrocyte somata demonstrating expression of Gfap, but not Ng2, Zo-1, Iba1, Mbp, or NeuN mRNA, indicating enrichment of isolated somata. (h) Immunoblot for β-DG in whole brain, isolated astrocyte somata, and isolated endfeet, showing expression of the β-DG endfoot marker in whole brain and endfeet, but not somata.
Astrocyte somata were isolated from adult (22-25 g) male C57BL/6 mice with the Miltenyi Biotec brain dissociation and astrocyte isolation kits (cat. 130-097-678, Miltenyi Biotec).30,31 Mouse brain endothelial cells were isolated from mouse brain with the Miltenyi Biotec brain dissociation and endothelium isolation kits (cat. 130-097-418; cat. 130-052-301, Miltenyi Biotec). Isolated astrocytes, endothelium, and astrocyte endfeet were immediately frozen in liquid nitrogen or plated and immunolabeled for subsequent experiments.
For somata, a single replicate in the proteomics analysis represented astrocyte somata obtained from a single animal. For endfeet, isolate from 5 animals were pooled together for each replicate. For qPCR, pooling was not necessary.
Conventional immunoblot and capillary electrophoresis immunoassay
For immunoblot assay, tissue samples were lysed in ice-cold lysis buffer (1% Triton X-100 in DPBS) with protease inhibitor (cat. 11,69,74,98,001 Roche). Immunoblots were prepared with standard methods, probed with antibodies raised against-ZO-1 (cat. 40-2200, Invitrogen), PDGFRβ (cat. 3169, Cell Signaling Technology), nuclear pore complex (cat. NBP1-05390, Novus Biologicals), AQP4 (cat. AB3594, Millipore), and visualized with chemiluminescence. 10 µg of total protein was loaded into each well.
The capillary electrophoresis-based Jess system (ProteinSimple) was also used for immunodetection. Protein lysates were mixed with NuPAGE LDS buffer (cat. NP0007, Invitrogen), reducing agent (cat. NP0009, Invitrogen), and the SimpleWes Fluorescent Master Mix (cat. PS-FL01-8, ProteinSimple). 3 µg of total protein per capillary was separated using a standard protocol with a 15-second loading step and a 30-minute separation step. After blocking (cat. 042-203, ProteinSimple), capillaries were incubated with primary antibodies against β-actin (cat. 3700; Cell Signaling Technologies), COX5A (cat. ab180129; Abcam), NDUFA1 (cat. ab195807; Abcam), RECK (cat. ab238162; Abcam), PODXL (cat. ab205350; Abcam), or GABA Transporter 2 (cat. ab229815; Abcam). Data visualization and analysis were performed using the Compass for SW software (version 4.1.0; ProteinSimple).
Quantitative Real-Time polymerase chain reaction
Quantitative real time polymerase chain reaction (qPCR) was used to validate astrocyte somata and endfoot enriched proteins using methods described previously. 32 Supplementary Table 1 contains the list of primers.
Proteomics by nano-flow UPLC-coupled high resolution mass spectrometry
Astrocyte endfeet or somata (n = 4 replicates) were solubilized in 5% sodium deoxycholate and were washed, reduced, alkylated and trypsinolyzed in filter as described.33,34 Tryptic peptides were separated on a nanoACQUITY UPLC analytical column (BEH130 C18, 1.7 μm, 75 μm × 200 mm, Waters) over a 165-minute linear acetonitrile gradient (3–40%) with 0.1% formic acid on a Waters nano-ACQUITY UPLC system and analyzed on a coupled Thermo Scientific Orbitrap Fusion Lumos Tribrid mass spectrometer as described. 35 Full scans were acquired at a resolution of 240,000, and precursors were selected for fragmentation by collision-induced dissociation (normalized collision energy at 35%) for a maximum 3-second cycle. Tandem mass spectra were searched against a UniProt mouse reference proteome using the Sequest HT and the MS Amanda algorithms with a maximum precursor mass error tolerance of 10 ppm.36,37 Carbamidomethylation of cysteine and deamidation of asparagine and glutamine were treated as static and dynamic modifications, respectively. Resulting hits were validated at a maximum false discovery rate (FDR) of 0.01 using the semi-supervised machine learning algorithm Percolator. 38 Label-free quantifications were performed using Minora, an aligned Accurate Mass and Retention Time (AMRT) cluster quantification algorithm (Thermo Scientific, 2017). Protein abundance ratios between the endfeet and the bodies were measured by comparing the MS1 peak volumes of peptide ions, which represent total protein abundance, and whose identities were confirmed by MS2 sequencing as described above.
Proteome informatic and statistical analysis
Proteins showing a z-score of fold change >1 with an FDR adjusted ANOVA p-value <0.05 were considered significantly changed and used for further analysis. 39 Proteome informatic analysis was performed as described previously. 40 Ingenuity pathway analysis was used to predict canonical pathways according to the proteins that were significantly different using a Fisher's exact test p-value < 0.01 with a non-zero absolute activity z-score. 41
Immunolabeling
Immunolabeling of isolated vessels or coronal frozen sections of mouse brain was performed as previously described with primary antibodies against GFAP (cat. C9205; Sigma-Aldrich), β-dystroglycan (cat. B-DG-CE; Leica Biosystems), SFXN5 (cat. ab172971; Abcam), ZO-1 (cat. 40-2200; Invitrogen), aquaporin-4 (cat. AB3594; Millipore), TOM-20 (cat. 6,12,278 BD Biosciences), and ASCA2 (cat. 130-099-138; Miltenyi Biotec). 42 Immunolabelled samples were imaged with standard epifluorescence microscopy (Nikon Eclipse 90i, Nikon Instruments). Negative controls consisted of the secondary antibody applied in the absence of a primary antibody. SFXN5 specificity to the astrocyte mitochondria was also confirmed by demonstrating lack of co-localization with microglia (Supplementary Figure 1).
For quantification of mitochondrial subcellular coverage, images were obtained of mouse cortex from four mice. Either β-dystroglycan (representing endfeet) or GFAP (representing somata and main processes) signals were thresholded at 1.5× background intensity and were used to mask the SFXN5 signals (representing astrocyte mitochondria). Mitochondrial percent area was then calculated by dividing the area occupied by mitochondria by the total area of the mask.
Statistics
Data are presented as mean ± SD. Analysis was performed with Origin Pro (V8; OriginLab Corp, North Hampton MA). Data normality was confirmed with the Shapiro-Wilk test. Student t-test and 1-way ANOVA with Tukey’s HSD post-hoc comparisons were used where appropriate.
Results
Isolation of astrocyte endfeet
To characterize the endfoot proteome, we developed a method to isolate astrocyte endfeet from mouse brain tissue (Figure 1(a)). First, microvessels were prepared from whole brain using previously published methods. Isolated microvessels retain their endfoot layer, with the endfeet becoming “amputated” from their parent somata during isolation (Figure 1(b) to (d)). Isolated microvessels were then dissociated into a suspension of individual vesicles, whereupon endfeet were recovered using the astrocyte isolation kit from Miltenyi Biotec (Figure 1(e)). Isolated endfeet consisted of ∼5–10 µm non-nucleated vesicles, which exhibited immunolabeling for the endfoot marker aquaporin-4 and ASCA-2, the astrocyte specific surface protein (Figure 1(e)). As expected, isolated endfeet also contained numerous TOM20-positive mitochondria (Figure 1(e)).
The sequential steps in the endfoot isolation were validated with immunoassay of cell-specific markers to demonstrate enrichment of the endfoot fraction and depletion of other components of the microvasculature. On immunoassay, endfeet exhibited aquaporin-4 and β-dystroglycan (astrocyte markers), but not zonulin-1 or CD31 (endothelial markers), PDGFRβ (pericyte marker), or nuclear pore complex (nuclei marker) (Figure 1(f)). Immunolabeling experiments showed scant, but overall low levels of zonulin-1 labeling in isolated endfeet (Figure 1(e)). Overall, these experiments indicate low levels of contaminants.
To serve as a comparator, astrocyte somata also were isolated from adult mouse brains using the Miltenyi Biotec brain dissociation and astrocyte isolation kits. qPCR analysis verified that isolated astrocytes exhibited GFAP, but not NeuN, Iba1, MBP, NG2, or zonulin-1 transcripts (Figure 1(g)).
To determine if isolated astrocyte somata retained their endfoot processes, we used immunoblot to probe somata and endfeet for β-dystroglycan, an endfoot marker. β-dystroglycan was detected in endfeet but not somata, indicating that during isolation, mechanical severing and loss of endfoot processes occurs (Figure 1(h)).
The astrocyte endfoot proteome
We submitted four samples of endfeet and somata to nano-flow UPLC coupled high resolution mass spectrometry. A total of 2560 proteins were detected among all samples. Hierarchical clustering indicated markedly different expression patterns between somata and endfeet (Figure 2(a)). Notably, 516 proteins, which comprised more than 1/5th of all detected proteins, were exclusively found in astrocyte endfeet (Figure 2(b)). With regards to the remaining proteins, 41 were detected exclusively in the astrocyte somata. 105 proteins were detected in both the endfoot and the somata, but were significantly more enriched in the somata compared to the endfoot. The remaining proteins were present in the endfoot and somata at similar levels of abundance. Complete proteomics results can be found in supplementary material (Supplementary Table 2).
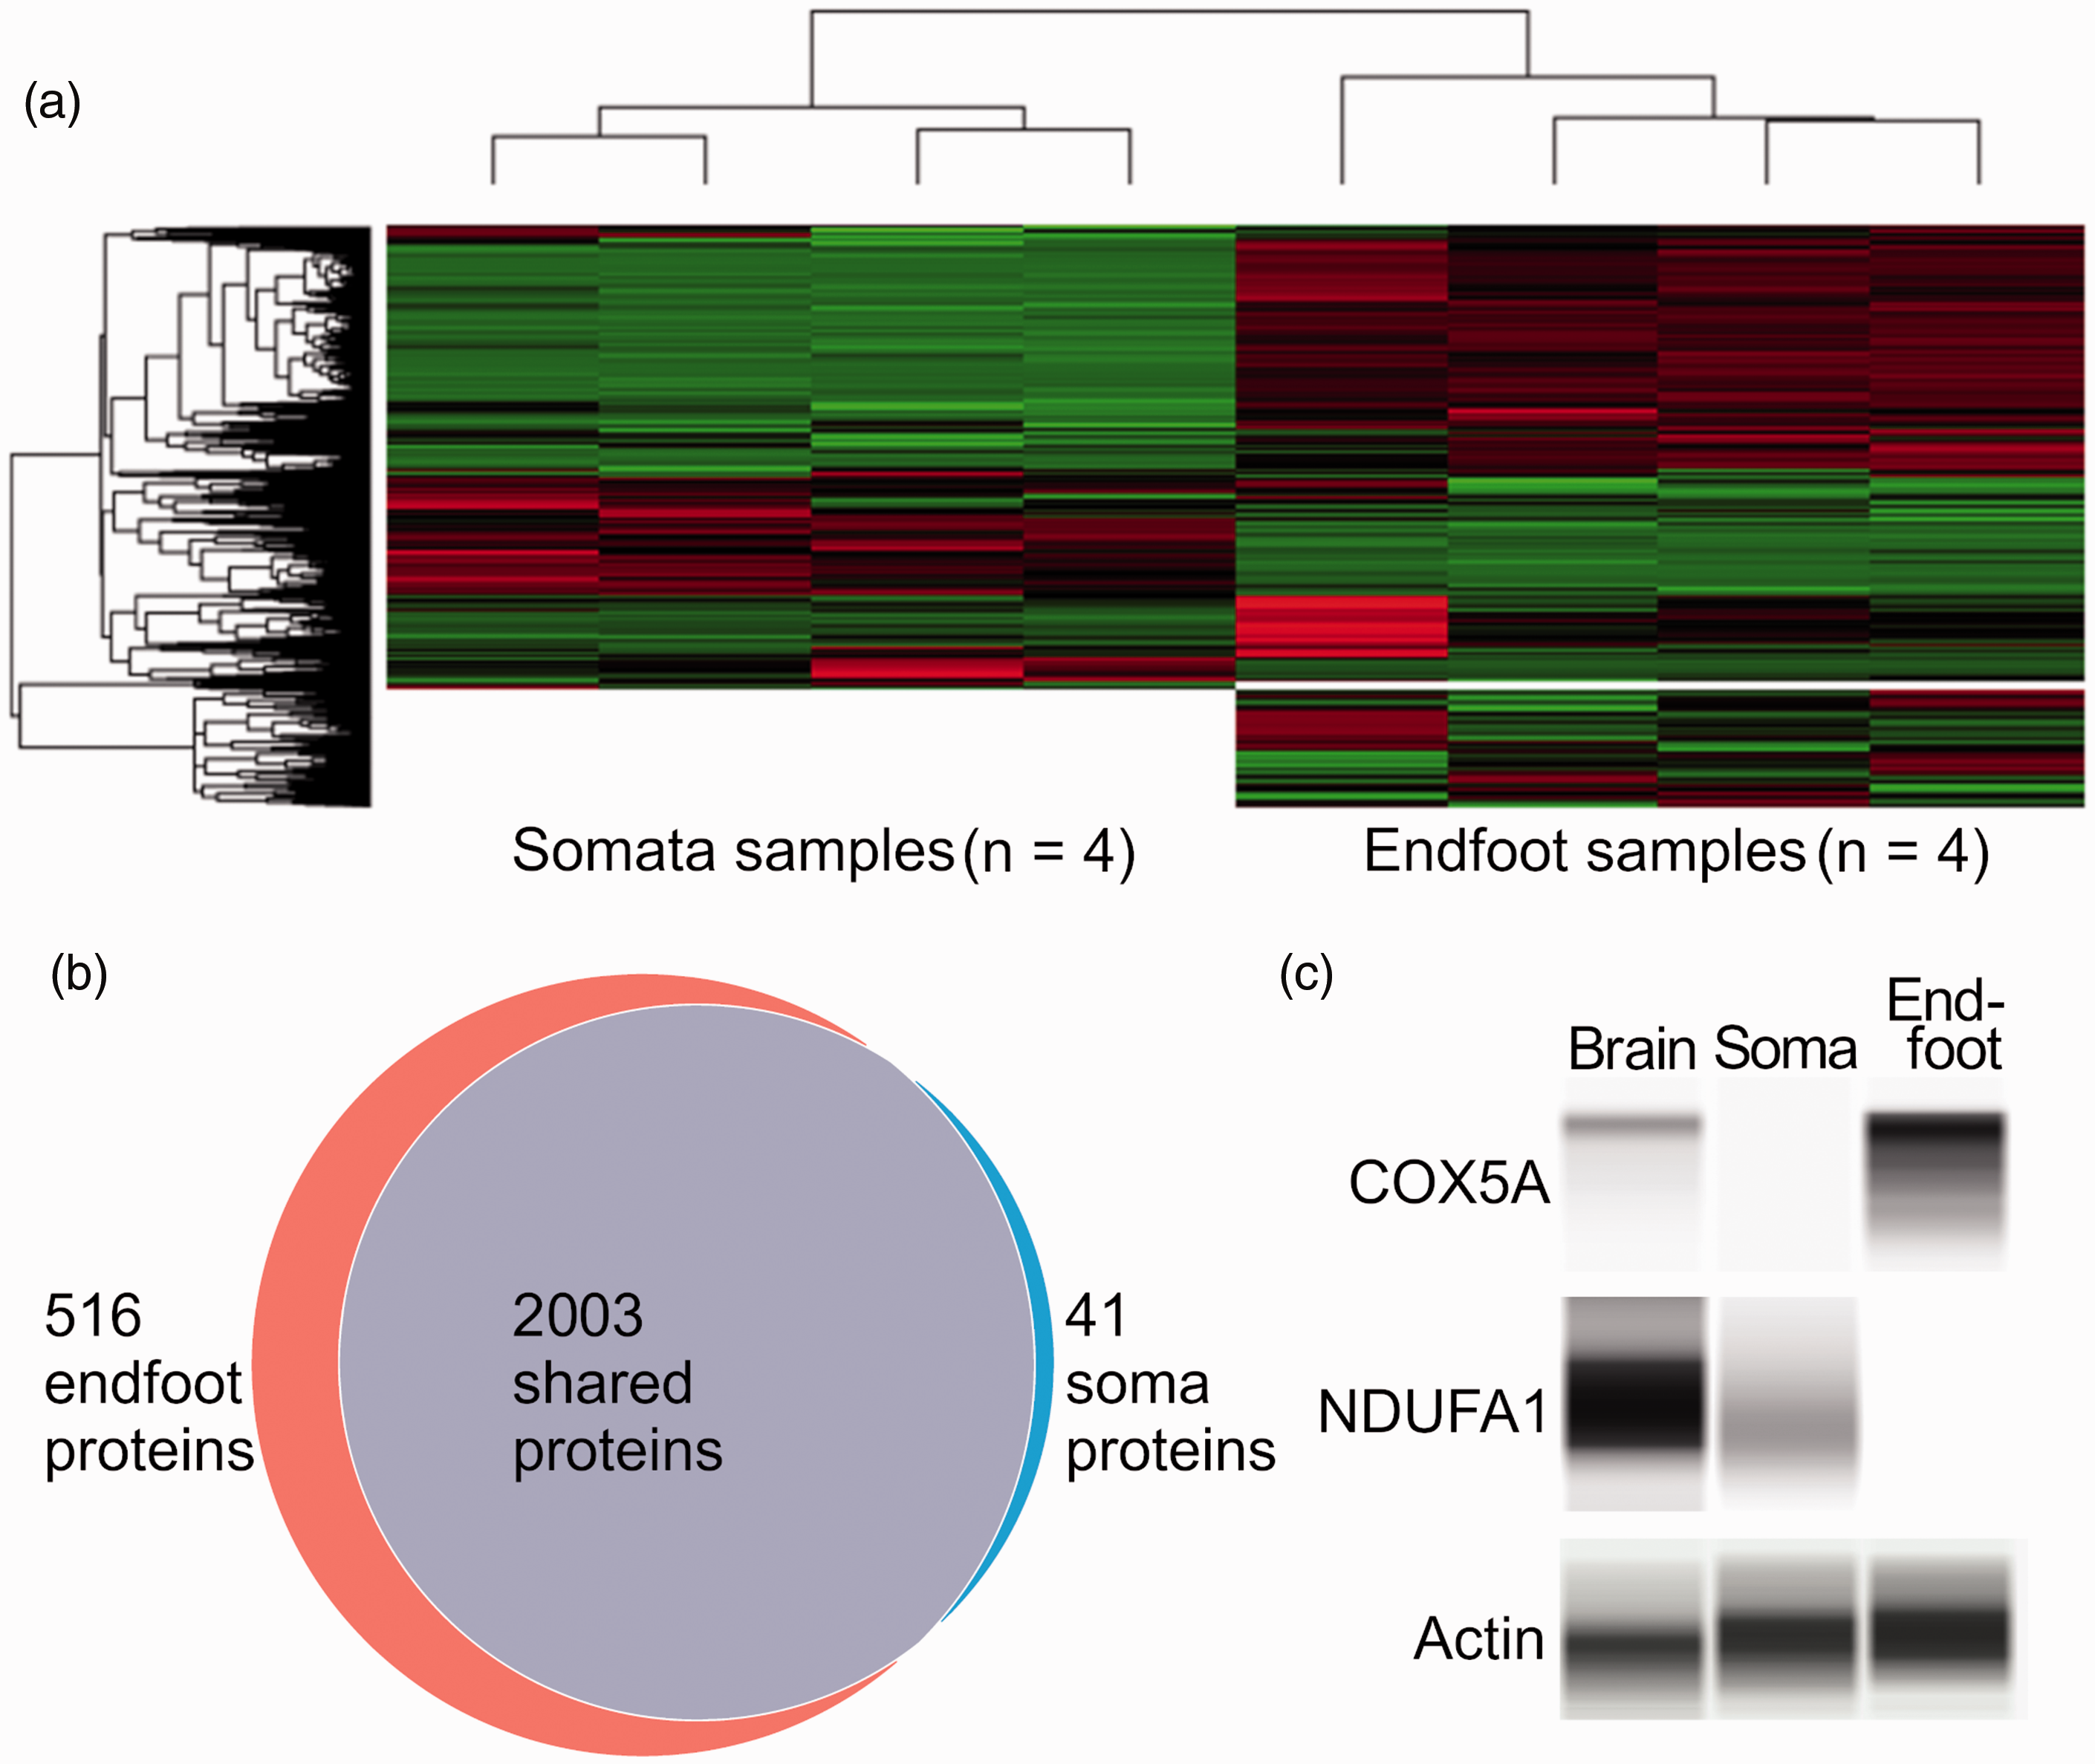
Comparative proteomics of the astrocyte endfoot versus somata. (a) Hierarchical clustering of the 2560 proteins detected between somata and endfeet, with red indicating upregulation and values displayed on a log10 scale. (b) Venn diagram of endfoot specific, shared and somata specific. (c) Capillary electrophoresis immunoassay of COX5A, NUFA1, and the loading control actin in whole brain, astrocyte somata, and astrocyte endfeet, confirming proteomics data that showed enrichment of COX5A in endfeet, and of NDUFA1 in somata.
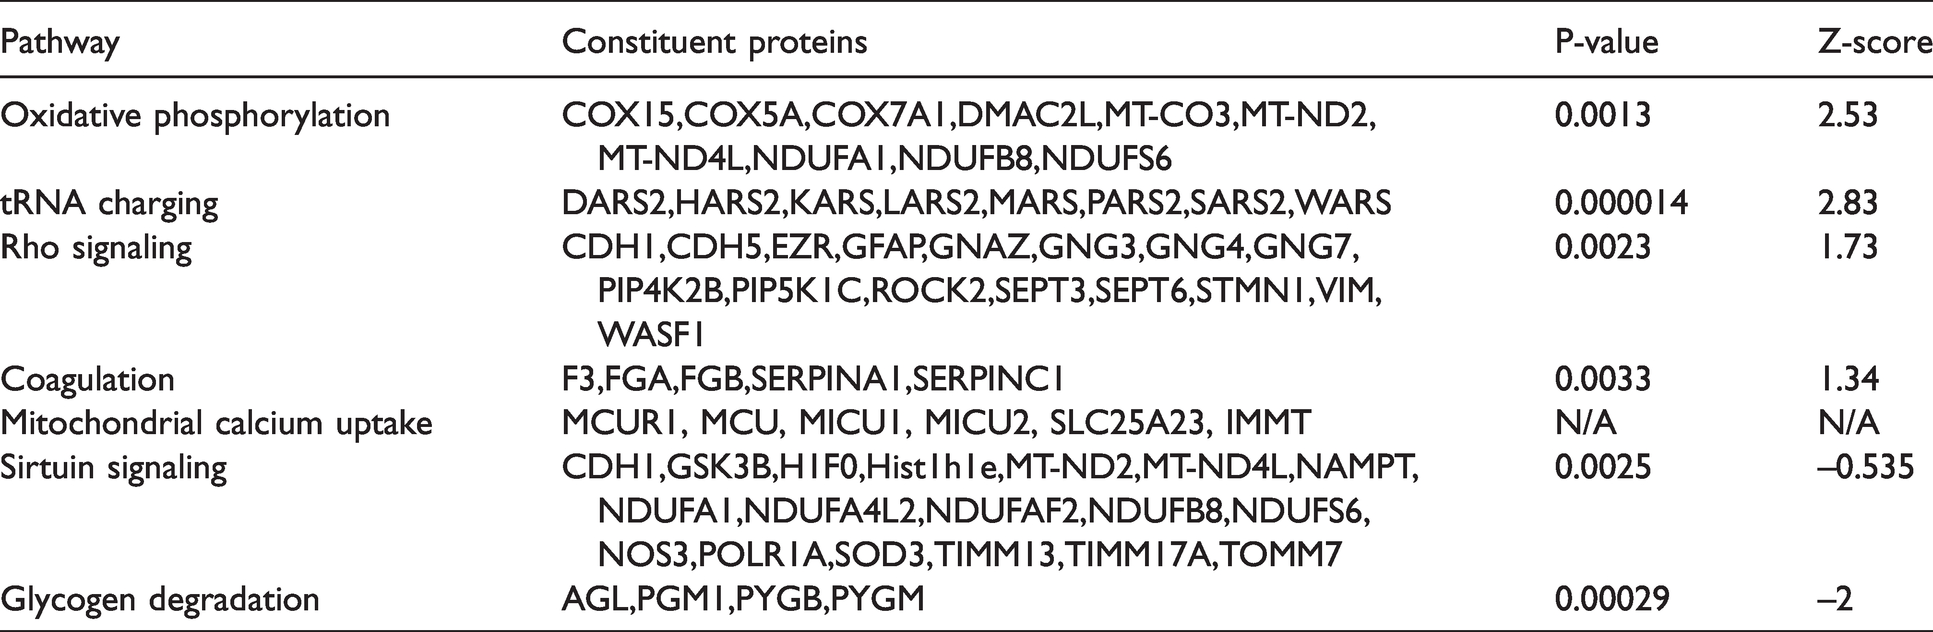
Canonical pathway analysis was performed to investigate patterns of protein expression. Pathways enriched in the endfoot included oxidative phosphorylation, tRNA charging, Rho GTPase signaling, and coagulation system (Table 1). Interestingly, the endfeet also exhibited greater expression of proteins associated with mitochondrial calcium uptake, including MCUR1, MCU, MICU1 and 2, SLC25A23, and IMMT. The astrocyte somata were enriched in glycogen degradation and sirtuin signaling (Table 1).
Pathway analysis of proteomic data.
To validate the proteomics data, we performed capillary electrophoresis immunoassay of several oxidative phosphorylation proteins found to differ between cellular compartments. As predicted by the proteomics data, COX5A was enriched at the endfeet, while NDUFA1 was enriched in the somata (Figure 2(c)).
Proteins involved in oxidative phosphorylation are enriched at astrocyte endfeet
To visualize differences in abundance of proteins involved in metabolism, we diagramed the glycolytic, glycogen, glutamate, tricarboxylic acid cycle and ETC pathways (Figure 3). Interestingly, all steps of the glycolytic pathway and tricarboxylic acid cycle were fully expressed by both the endfoot and somata. However, several key ETC subunits were only detectable in endfeet. These included the complex I proteins MTND2, ND4L, NDUFB8, NDUFS6, NDUFAF2 and NDUFA4L2, the complex IV proteins COX15, COX5A, COX7A1, MT-CO3, COA3, COA7, GM11273, and the ATP synthase protein COX5A (Figure 3).
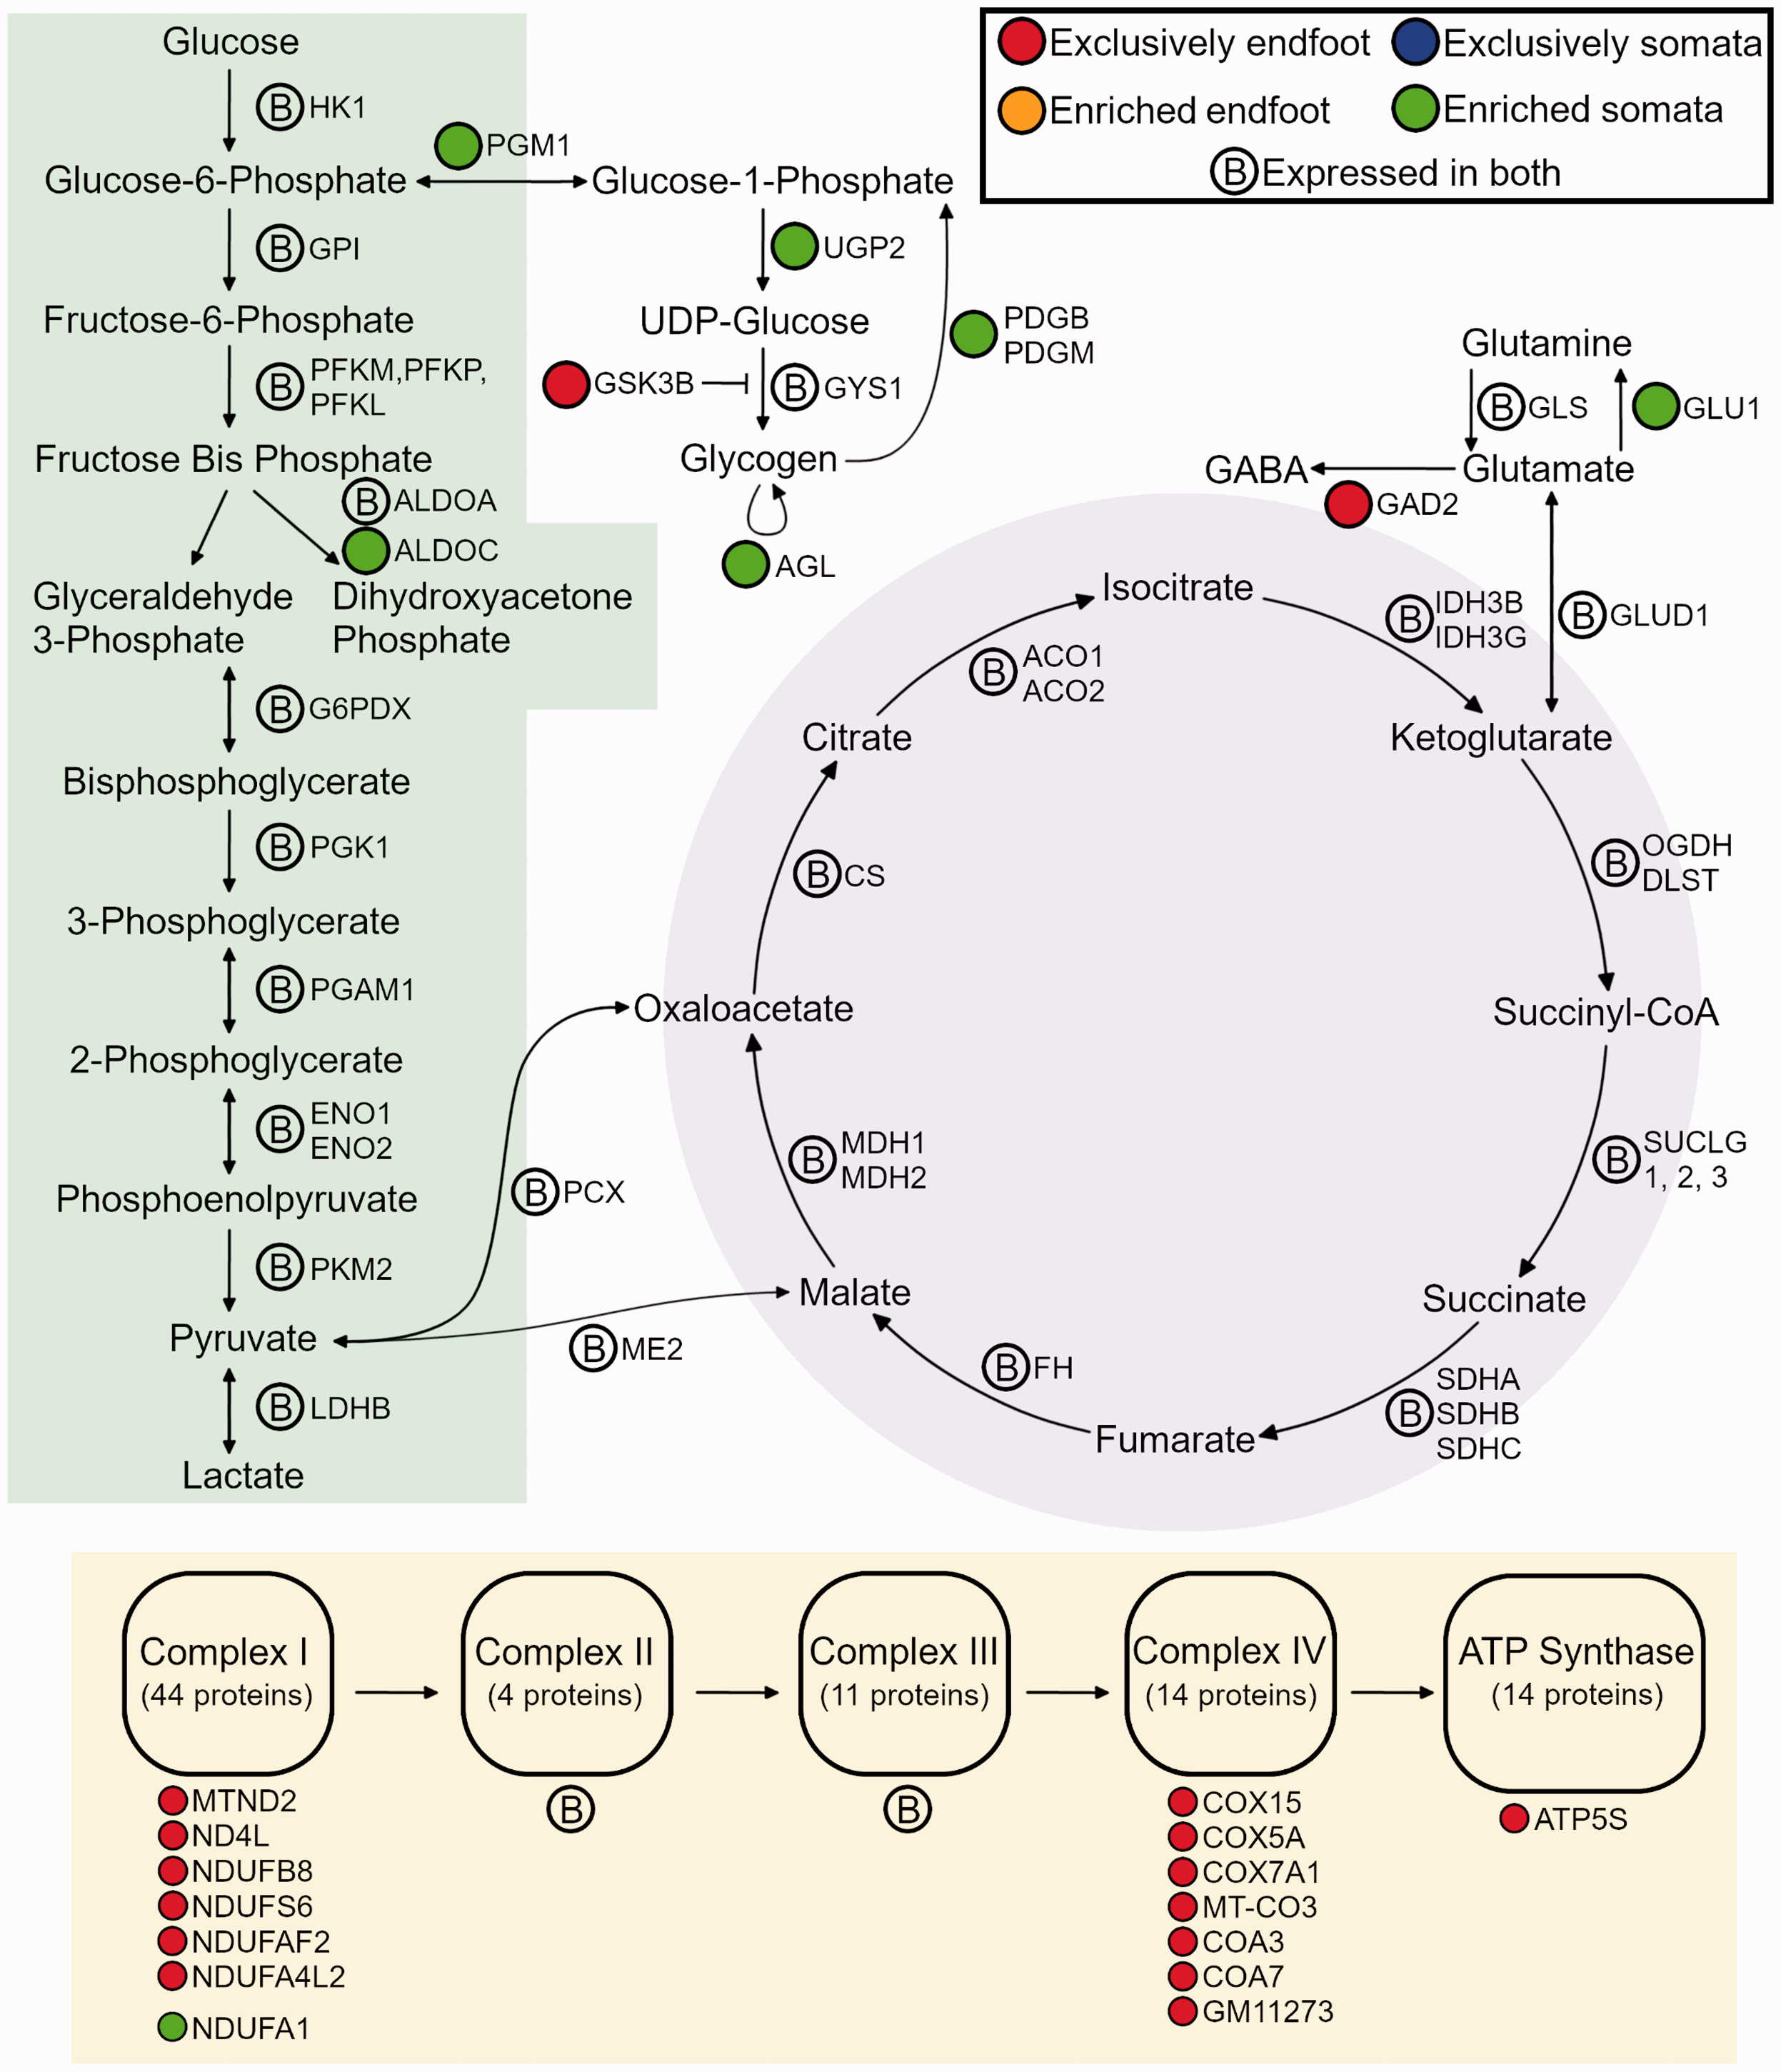
Differential expression of metabolic pathways in endfoot versus somata. Diagram of the glycolytic pathway (green highlight), tricarboxylic acid cycle (purple highlight), electron transport chain (yellow highlight), and glycogen and glutamate pathways; protein abbreviations are depicted for each metabolic step, and colored tags depict differences in abundance between endfeet and somata, per the key in the upper right; if no difference was reported between endfeet and somata, an encircled B is depicted beside the protein name.
Interestingly, several other metabolic pathways were differentially expressed. Enzymes that are related to glycogen synthesis and degradation were enriched in the somata, while GSK3B, which phosphorylates and inactivates glycogen synthase, was exclusively found in the endfeet (Figure 3). Together, these differences suggest that glycogen dynamics may be localized to the somata. In addition, several differences in glutamate processing were apparent. GAD2, which processes GABA from glutamate was found only in endfeet, whereas GLU1, which processes glutamine from glutamate, was enriched in the somata (Figure 3).
Astrocyte endfeet are densely packed with mitochondria
Since the proteomics data indicated compartmentalization of oxidative phosphorylation within the astrocyte endfeet, we investigated the distribution of mitochondria in astrocytes in vivo. Naïve mouse brain tissues were immunolabeled for sideroflexin-5 (SFXN5). SFXN5 is a mitochondrial amino acid transporter that is capable of transporting serine and potentially citrate, although its function has not been extensively characterized. 43 Prior studies have shown that it is exclusively expressed by astrocytic mitochondria, making it a useful marker protein. 44 In the cortical grey matter, SFXN5+ mitochondria colocalized with GFAP+ astrocytic somata and main branches (Figure 4(a)). Interestingly, SFXN5 signal was increased at the perivascular astrocyte endfeet (Figure 4(b)). Quantification of SFXN5 percent area in the various astrocyte sub-compartments revealed that SFXN5 density was lowest in the background parenchyma (3.46 ± 0.37% area), intermediate in somata (20.72 ± 2.79% area), and highest in endfeet (29.03 ± 1.89% area) (Figure 4(c)).

Enrichment of mitochondria at the astrocyte endfoot (a, b) Micrographs of mouse brain immunolabeled with SFXN5 (red) and GFAP or β-dystroglycan (β-DG) (green) with DAPI counterstain (blue) showing enrichment of SFXN5-positive astrocyte mitochondria at the perivascular endfoot (b) versus the somata (a) (c) Quantification of astrocyte SFXN5+ mitochondrial density in the background neuropil (BG), GFAP-positive somata, and β-DG positive endfeet, showing increased density in endfeet versus somata; n = 4 mice, * p < 0.05 versus BG, and # p < 0.05 versus somata on ANOVA.
Endfoot proteins indicate new endfoot functions
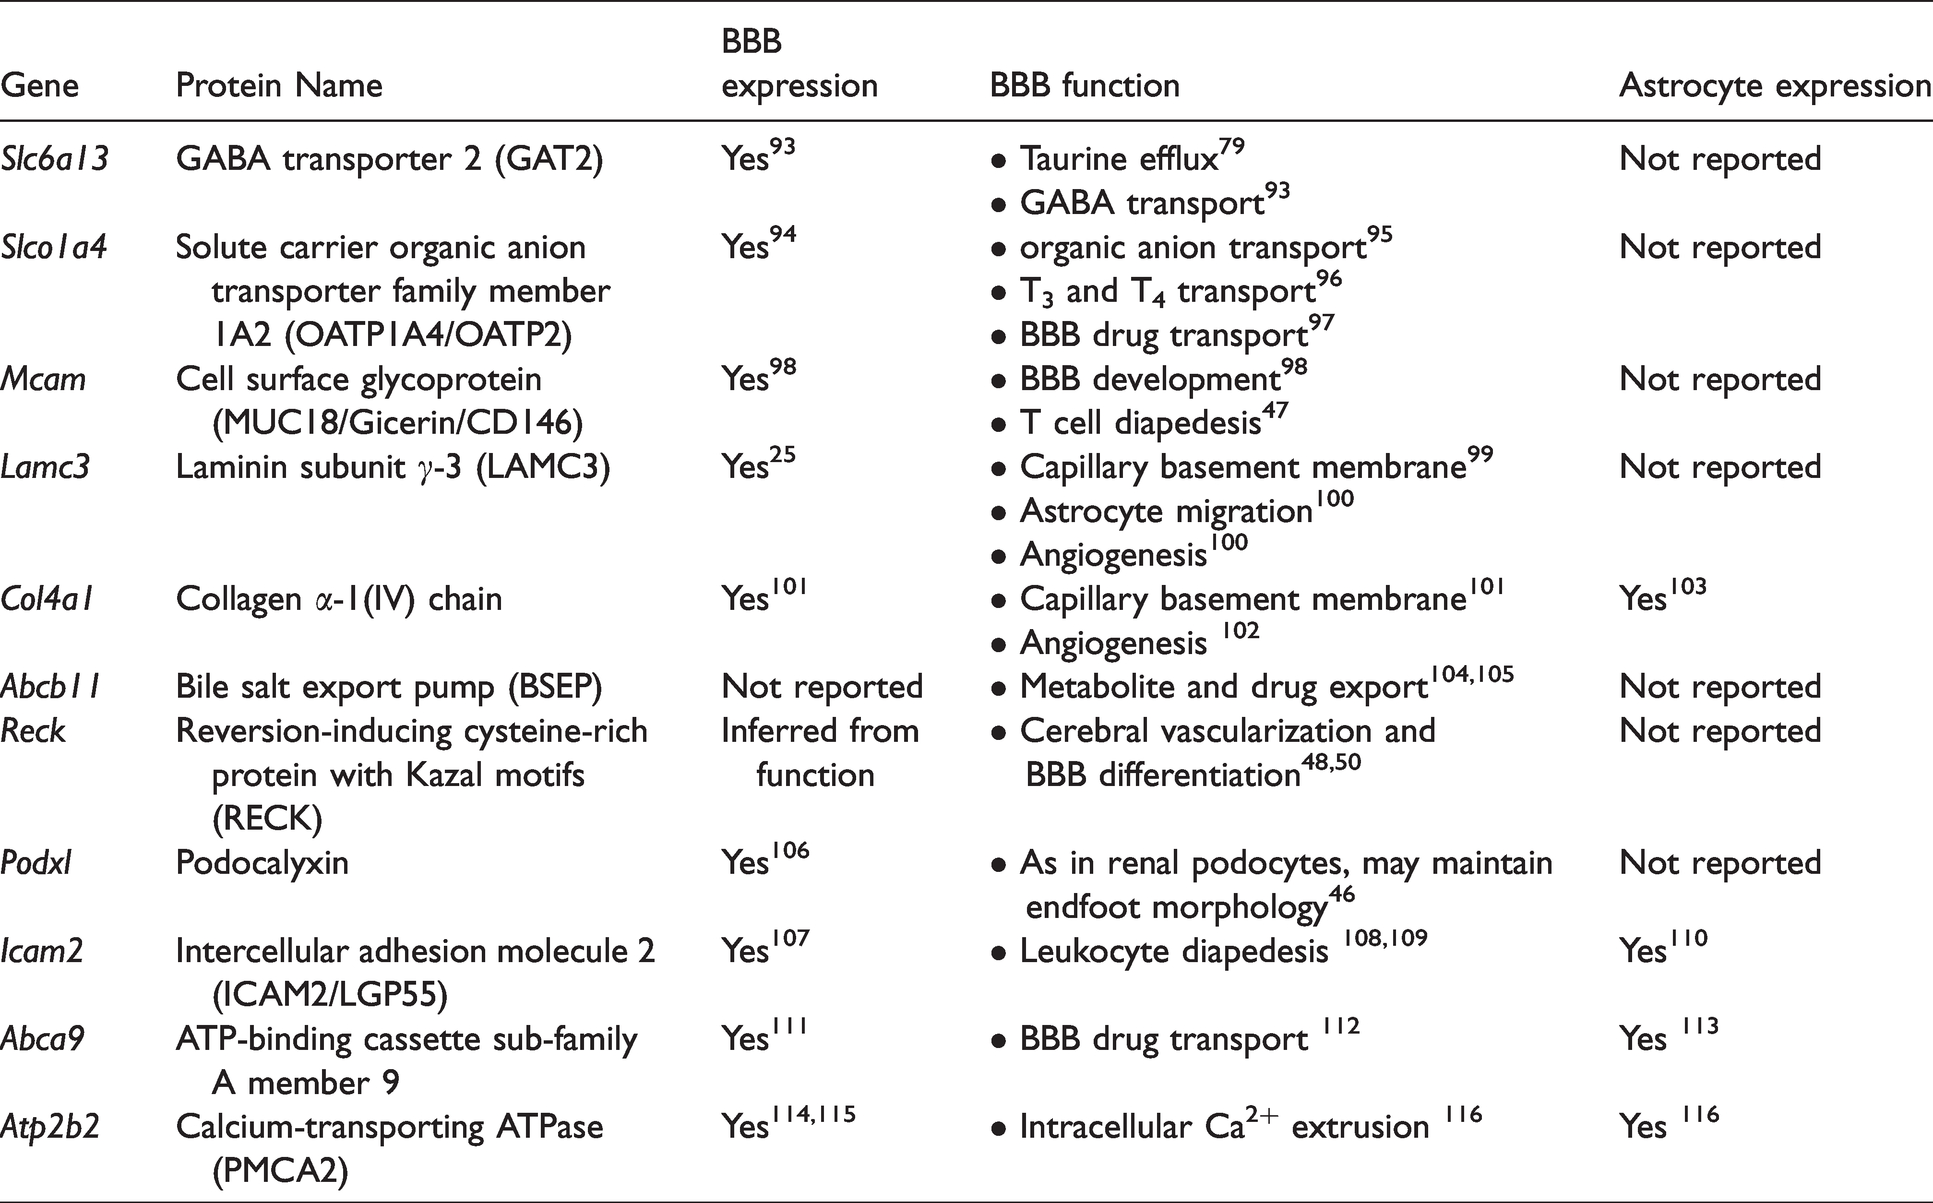
To better understand the potential function of the endfoot proteins, we performed literature searches on the most abundant endfoot specific proteins (Table 2). Excepting one protein (bile salt export pump), all proteins had been previously detected at the BBB. Interestingly, only four of these proteins had been previously demonstrated to be expressed by astrocytes. Endfoot enrichment of three proteins listed in Table 2 that were not previously reported to be expressed in astrocytes was confirmed with capillary electrophoresis immunoassay of isolated endfeet (Figure 5). To validate astrocyte expression of proteins in Table 2, astrocytes isolated from mouse brain were probed with qPCR for mRNA for proteins in Table 2. Endothelial cells and flow-through from endfoot isolation served as comparators. mRNA for all proteins in Table 2 were detected in astrocyte somata (Supplementary Table 3). Many of these proteins were previously found to be critical to the normal development and function of the BBB, and their abundant expression at the astrocyte endfoot imparts a new importance to the endfoot.
Top proteins exclusively found in the astrocyte endfoot. Literature searches were conducted to determine if any prior studies showed protein expression at the blood-brain barrier, protein expression by astrocytes, and possible endfoot function.
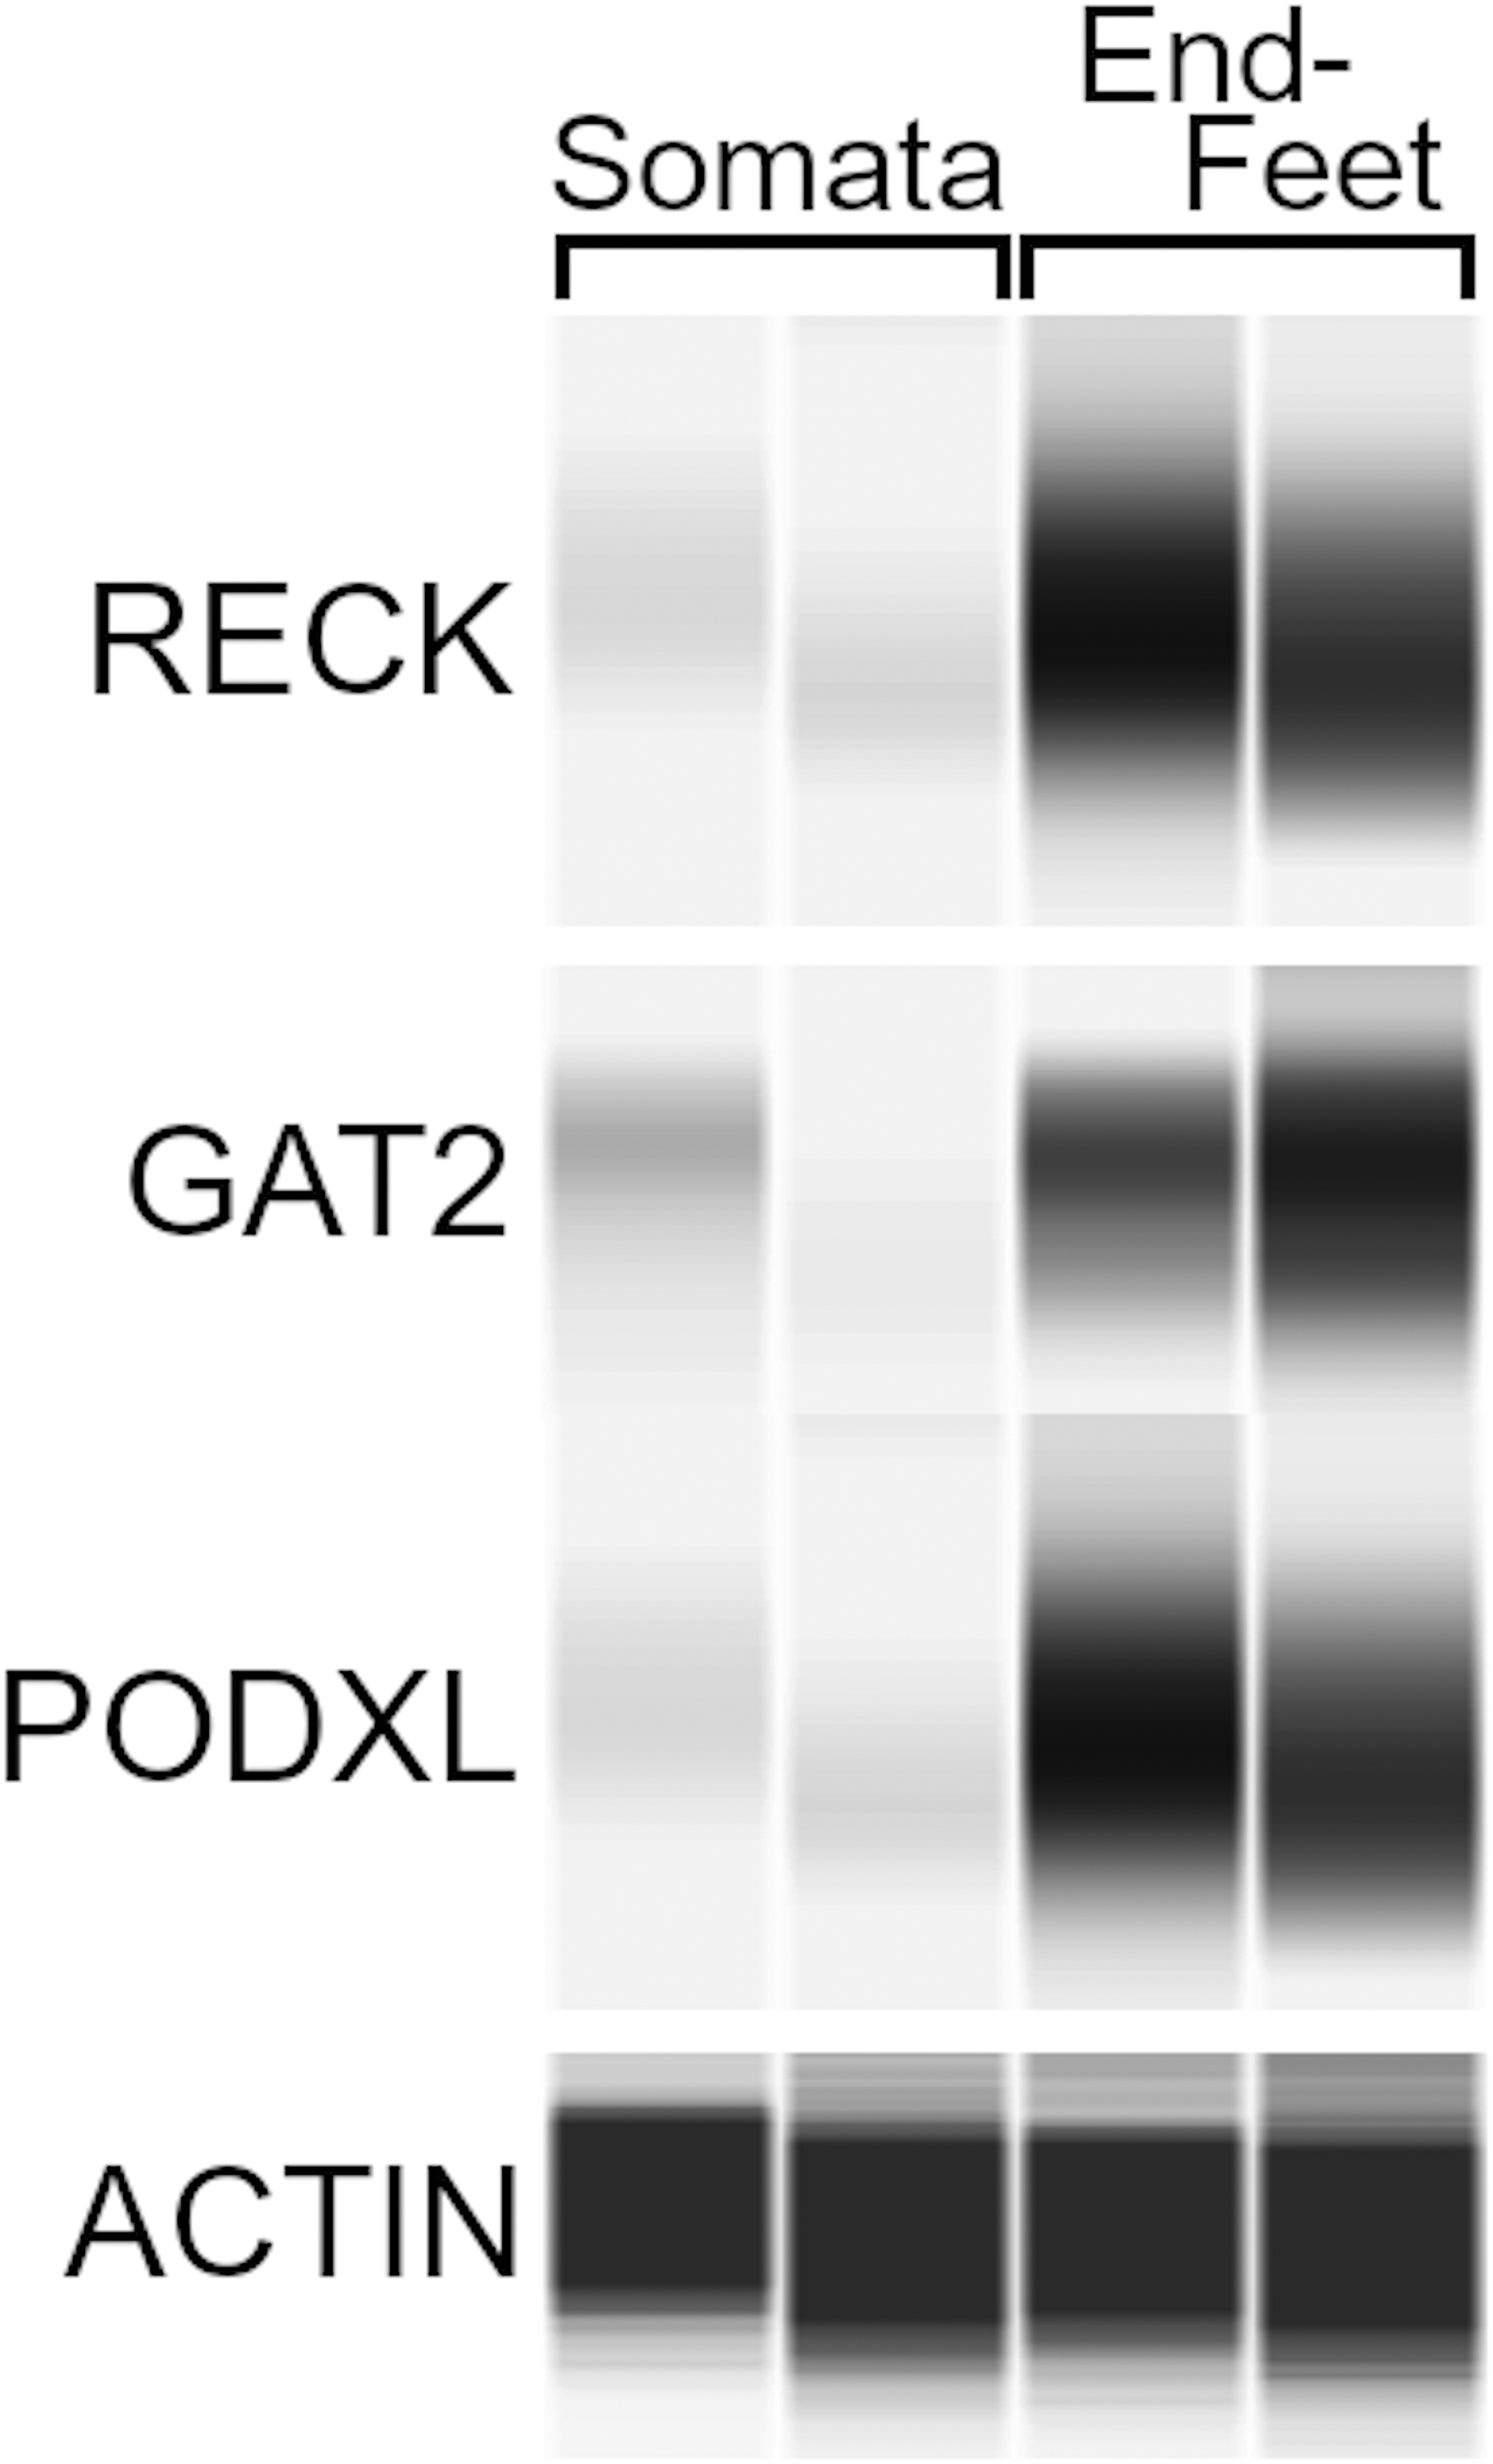
Validation of new localization of BBB proteins to the astrocyte endfoot. Capillary electrophoresis immunoassay of isolated astrocyte somata and isolated astrocyte endfeet probed with antibodies against reversion-inducing cysteine-rich protein with Kazal motifs (RECK), GABA transporter 2 (GAT2), and podocalyxin (PODXL), depicted with actin loading controls, verifying endfoot expression and enrichment predicted by mass spectrometry analysis; n = 2 mice.
Discussion
Using a novel technique to isolate astrocyte endfeet from brain tissue, we studied the endfoot proteome. Our results expand the list of known endfoot-specific proteins from 10 to 516 proteins. Furthermore, our data indicate that astrocytes exhibit substantial metabolic compartmentalization, with apparent endfoot sequestration of numerous critical components of the electron transport chain.
Our analysis yielded a total of 2560 proteins. Of these, 516 proteins were exclusively detected in the endfoot, indicating that a surprisingly large portion of the astrocyte proteome is dedicated to endfoot function. A subgroup of the 10 proteins previously known to be enriched at the endfoot were detected in our analysis. As predicted by prior literature, β-dystroglycan and β2-syntrophin were detected only in the endfoot compartment. Integrin α6, GLUT1, α1-syntrophin, dystrophin, dystrobrevin were detected, and were 3.9-, 4.7-, 2.8-, 2.5-, and 7.8-fold more abundant in the endfoot, although these values did not rise to statistical significance after correction for multiple comparisons. Interestingly, although utrophin and aquaporin-4 were detected, these proteins were not significantly enriched at the endfoot. With regards to aquaporin-4, a widely used endfoot marker, vesicular- and Golgi-associated aquaporin-4 in the somata may equilibrate the protein abundance between somata and endfoot. 45 Finally, neither limitrin nor β4 integrin were detected. Alternative fractionation techniques may be needed to detect these proteins.
Within the most abundant endfoot proteins, many had known BBB functions, although most were not previously known to localize to the endfoot (Table 2). For example, podocalyxin, a large negatively charged protein is known to coat the renal podocyte endfoot and maintains their morphology. 46 In addition, the cell surface glycoprotein MUC18 was known to regulate leukocyte diapedesis across the BBB, although an endfoot specific role was not known. 47 Our results have implications for multiple endfoot roles, which are discussed in the following sections.
BBB differentiation
The astrocyte endfoot is an important mediator of BBB differentiation and maintenance via production of various signaling molecules such as Wnt and SHH.48,49 Our dataset did not contain many of these factors, perhaps because alternative fractionation techniques may be needed to detect these secreted proteins. However, we found that astrocyte endfeet strongly expressed the reversion-inducing cysteine-rich protein with Kazal motifs (RECK). RECK was previously found to be an important mediator of cerebral vascularization and maintenance of BBB differentiation, although it was not previously known to be expressed by the endfoot.48,50 We also found that endfeet are enriched in platelet derived growth factor receptor α (PDGFRα), which contributes to BBB breakdown and edema formation after intracerebral hemorrhage. 51
Regulation of vascular tone
Due to their close approximation to synapses and the cerebrovasculature, astrocytes were long suspected to mediate functional hyperemia. Astrocytes respond to neuronal activity with intracellular calcium transients that trigger the release of vasoactive substances, resulting in vasoconstriction or dilatation.6,52–54 Our data indicated enrichment of mitochondrial calcium uptake machinery at the endfoot, including MCUR1, MCU, MICU1, MICU2, SLC25A23, and IMMT. These mitochondrial transport proteins modulate cytosolic calcium and regulate mitochondrial respiration. 55 Further work will be needed to determine if these specific proteins modulate the calcium transients involved in vasoregulation, which remains an important yet incompletely understood phenomenon.
Astrocyte endfoot metabolism
Our results indicate that numerous subunits of ETC complex I, IV, and ATP synthase are exclusively found in the endfoot (Figure 3). Many of these proteins, including MTND2, 56 ND4L, 57 NDUFB8, 58 NDUFS6, 59 NDUFAF2, 60 COX15, 61 COX5, 62 COA3, 63 COA7, 64 are critical components of their respective ETC complexes and, if deficient result in severe metabolic syndromes. Until recently, it was assumed that astrocytes were energetically quiescent cells that were mostly reliant upon glycolysis.65,66 Newer data indicate that astrocytes exhibit full expression and function of the tricarboxylic acid cycle and ETC pathways. 67 Our results suggest that a large portion of astrocyte oxidative phosphorylation may be localized to the endfeet. Since astrocytes mediate ∼30% of total brain oxidative phosphorylation,68,69 a large proportion of total brain oxidative capacity may therefore take place in the astrocyte endfoot.
Sequestration of ETC enzymes to the endfoot was associated with greater SFXN5+ mitochondrial density at this compartment. In astrocytes, mitochondria are trafficked to and concentrated in areas of high metabolic demand. 70 Mitochondrial enrichment at the endfoot may be supported by local biogenesis and differential trafficking. In neurons, localized biogenesis was recently reported to support the mitochondrial pool present in axonal neurites. 71 Astrocytes exhibit local mRNA translation at the astrocyte endfoot, which may contribute to compartmentalized mitochondrial biogenesis. 29 In perisynaptic astrocyte processes, Miro1 was found to mediate repositioning of mitochondria to areas of active calcium signaling, potentially to support mitochondrial calcium buffering. 72 In our data, Miro1 was detected in both somata and endfeet, and was ∼2.5-fold more abundant in the endfoot, although this difference was not statistically significant.
The purpose of endfoot metabolic compartmentalization remains unclear. ETC compartmentalization to the endfoot may support its many energy-intensive functions. In other cells, subcellular metabolic compartmentalization is employed to optimize ATP delivery to distant compartments since diffusion of ATP through cytosol is limited by cytoplasmic viscosity, bulky intracellular machinery and labyrinthine ramifications.73,74 Neurons utilize metabolic compartmentalization, with synapses exhibiting differences in ETC subunit abundance. 75 Alternatively, compartmentalization of the ETC and mitochondria to the endfoot may support endfoot purinergic signaling. 76 A highly oxidative endfoot carries implications for CNS disease. After injury, endfeet deteriorate and detach from cerebral vessels which may underlie substantial morbidity.77,78 Protection of the endfoot after injury should be explored as a potential therapeutic strategy.
Modulation of neuronal signaling
Our results indicate that GABA processing machinery is enriched at the endfoot. These proteins include glutamate decarboxylase 2 (GAD2), which generates GABA from glutamate, and sodium- and chloride-dependent GABA transporter 2 (GAT2), which mediates transmembrane GABA transport. In the brain, GAT2 is present surrounding microvessels, 79 where it is partially expressed by GABAergic neurons that modulate vascular tone. 80 Our results suggest that astrocyte endfeet may contribute to perivascular GABAergic signaling, and may modulate resting neuronal tone and neurovascular coupling.81,82 Given the multiple forms of GAD and GAT expressed by astrocytes and the complex nature of GABAergic signaling in the adult CNS, additional work is needed to determine the precise role of the endfoot in this signaling environment. 83
Neuroinflammation
Since the endfeet examined in the present study were obtained from healthy brain tissue, it is unsurprising that many molecules associated with neuroinflammation were not detected. Interestingly, our data indicated endfoot expression of the mitochondrial translocator protein (TSPO). TSPO is a mitochondrial cholesterol transport mediator involved in steroidogenesis and mitochondrial transition pore opening that has attracted great interest as a positron emission tomography (PET) marker for neuroinflammation.84–86 Reactive astrocytes upregulate TSPO at early time points during neuroinflammation and are important contributors to the brain TSPO PET signal.87,88 In our dataset, TSPO was detected in both astrocyte somata and endfeet and was 2.7-fold more abundant in the endfoot, although this difference did not rise to statistical significance. Since in some models, astrocytes comprise up to 35% of TSPO positive cells, our results indicate that endfeet may be an important source of TSPO PET signal. 89 Furthermore, endfoot TSPO may be a potentially important target for TSPO modulation for reduction of neuroinflammation.
Potential limitations
Our study has several potential limitations. The purity of our endfoot proteome rests upon the efficiency of the magnetic cellular separation step, wherein endfeet are separated from endothelial, pericyte, and smooth muscle cell “contaminants.” While data in Figure 1(f) indicate that nucleated contaminants from endothelial cells or pericytes are undetectable with immunoblot or capillary electrophoresis immunoassay, low levels of contaminants can be visually appreciated with immunohistochemistry (Figure 1(e)). While the abundance of these contaminants is low, their presence may theoretically result in false positive endfoot proteins. Future studies of the endfoot proteins reported here should include validation of their endfoot localization.
Our astrocyte proteome of 2560 proteins is smaller than other studies, some of which report up to 7265 proteins using prefractionation techniques. 90 The “missing” proteins may be less abundant and thus may have remained under the limit of detection or may have become lost or digested during endfoot isolation. In addition, multiple fractionation techniques may be needed to generate a more comprehensive proteome.
There are several other potential limitations. Firstly, we utilized male mice for our experiments. Sex-related differences have been found in the proteome of brain microvessels, particularly in proteins related to mitochondria and the electron transport chain. 91 Future experiments should be conducted in this area. Secondly, it is unclear whether the isolated somata retain other processes, such as perineuronal astrocyte processes. To our knowledge, specific molecular markers or isolation methods for these processes do not exist, which precludes investigation. Thirdly, in our study, isolated endfeet were obtained from whole brain in order to maximize protein yield, which may mask any regional heterogeneity in endfoot composition or energy metabolism. Substantial molecular and functional regional heterogeneity is present in whole astrocytes located in different brain regions, 92 particularly with regards to endfoot proteins such as AQP4. 42
Supplemental Material
sj-zip-1-jcb-10.1177_0271678X211004182 - Supplemental material for A large portion of the astrocyte proteome is dedicated to perivascular endfeet, including critical components of the electron transport chain
Supplemental material, sj-zip-1-jcb-10.1177_0271678X211004182 for A large portion of the astrocyte proteome is dedicated to perivascular endfeet, including critical components of the electron transport chain by Jesse A Stokum, Bosung Shim, Weiliang Huang, Maureen Kane, Jesse A Smith, Volodymyr Gerzanich and J Marc Simard in Journal of Cerebral Blood Flow & Metabolism
Footnotes
Funding
The author(s) disclosed receipt of the following financial support for the research, authorship, and/or publication of this article: This research was supported in part by the University of Maryland School of Pharmacy Mass Spectrometry Center (SOP1841-IQB2014). J.M.S. is supported by grants from the Department of Veterans Affairs (I01BX002889), the Department of Defense (SCI170199), the National Heart, Lung and Blood Institute (R01HL082517) and the NINDS (R01NS060801; R01NS102589; R01NS105633). V.G. is supported by a grant from the NINDS (R01NS107262).
Declaration of conflicting interests
The author(s) declared no potential conflicts of interest with respect to the research, authorship, and/or publication of this article.
Authors’ contributions
JAS conceived of the project, collected and analyzed data, and wrote the manuscript. BS collected data and edited the manuscript. WH and MK collected and analyzed data and edited the manuscript. JAS collected data and edited the manuscript. VG and JMS conceived of the project and edited the manuscript.
Supplemental material
Supplemental material for this article is available online.
Acknowledgements
The authors thank the University of Maryland School of Pharmacy Mass Spectrometry Center for their proteomics support.
References
Supplementary Material
Please find the following supplemental material available below.
For Open Access articles published under a Creative Commons License, all supplemental material carries the same license as the article it is associated with.
For non-Open Access articles published, all supplemental material carries a non-exclusive license, and permission requests for re-use of supplemental material or any part of supplemental material shall be sent directly to the copyright owner as specified in the copyright notice associated with the article.