
Abstract
13C isotopic labeling data were obtained by 1H-observed/13C-edited magnetic resonance spectroscopy in the human brain in vivo and analyzed using a mathematical model to determine metabolic rates in human grey matter and white matter. 22,5-cc and 56-cc voxels were examined for grey matter and white matter, respectively. When partial volume effects were ignored, the measured tricarboxylic acid cycle rate was 0.72 ± 0.22 (mean ± SD) and 0.29 ± 0.09 μmol min–1 g–1(mean ± SD) in voxels of ∼70% grey and ∼70% white matter, respectively. After correction for partial volume effects using a model with two tissue compartments, the tricarboxylic acid cycle rate in pure grey matter was higher (0.80 ± 0.10 mol min–1 g–1; mean ± SD) and in white matter was significantly lower (0.17 ± 0.01 μmol min–1 g–1; mean ± SD). In 1H-observed/13C-edited magnetic resonance spectroscopy labeling studies, the larger concentrations of labeled metabolites and faster metabolic rates in grey matter biased the measurements heavily toward grey matter, with labeling time courses in 70% grey matter appearing nearly identical to labeling in pure grey matter.
Noninvasive measurements of human cerebral metabolic rate in vivo are typically limited by partial volume effects caused by finite spatial resolution and tissue type mixing. This is true of methods such as positron emission tomography (PET) or, in particular, magnetic resonance spectroscopy (MRS), where measured volume sizes range from 20 to 140 cc (Beckmann et al., 1990; Rothman et al., 1992; Gruetter et al., 1994; Pan et al., 1997). Given the large reported differences in the rates of utilization of glucose and oxygen and concentrations of glutamate in grey matter (GM) and white matter (WM), it is especially important to develop methods that account for tissue heterogeneity.
Differences in metabolite concentrations caused by mixing of GM and WM have been evaluated by linear regression analysis (Doyle et al., 1995; Hetherington et al., 1996; Lim and Spielman, 1997; Mason et al., 1998; Pan et al., 1998). However, the measurements of the TCA cycle rate derived from studies of mixed voxels are often not related linearly to the content of each constituent tissue type, because of the disproportionate influence exerted by faster metabolic rates or larger concentrations of measured metabolites.
In the present study, we measured the TCA cycle rates of GM and WM in voxels representing tissue mixtures that ranged from 70% GM-30% WM to 30% GM-70% WM, using 1H-observed/13 C-edited MRS. The effects of partial volume contributions to the turnover data were evaluated through two-tissue compartment analysis on the grouped data and compared to analyses assuming only a single-tissue compartment in each voxel. This evaluation thus permitted the determination of the TCA cycle rate in pure GM and pure WM of the human brain. Such an approach will be useful for studies of functional activation or disease, where tissues of different metabolic activities are likely to be intermingled.
METHODS
Human subjects
Eight studies were conducted, five in men and three in women, ages 22 to 37. All subjects fasted overnight to decrease the endogenous, unlabeled glucose pool. A catheter was placed in each antecubital vein for infusion of [1-13C]glucose and collection of venous blood samples. [1-13C]glucose (Cambridge Isotopes, Inc., Andover, MA, U.S.A.) was infused in a 20% solution to raise the plasma glucose 13C enrichment from 1.1 % to 55 to 65% within 5 minutes and maintain the enrichment through a period of 90 minutes as described previously (Gruetter et al., 1994).
Magnetic resonance imaging and spectroscopy
A double-tuned 1H/13C volume head coil (Vaughan et al., 1993) was used to collect the MRS and magnetic resonance imaging data. Measurements were performed using a 4.1 T whole-body MR imaging spectrometer operating at 175 MHz for 1H detection and 44 MHz for 13C detection.
T1-weighted gradient-echo scout images (256 × 256 resolution, 240- × 240-mm field of view, 3-mm slice thickness) were obtained for subject positioning and to identify volumes of interest that were predominantly GM or WM. For studies of predominantly GM, a voxel of 22.5 cc (1.5 × 3 × 5 cm) was selected straddling the intrahemispheric fissure about the cingulate sulcus. For studies of predominantly WM, a voxel of 56 cc (2 × 4 × 7 cm) was selected from the centrum semiovale of the right hemisphere. Quantitative imaging of T1 was also performed on the selected volumes to determine the GM and WM content (Hetherington et al., 1996; Mason et al., 1997).
Spectroscopic data were obtained using a slice-selective coherence transfer sequence (Pan et al., 1996) with a 13C-editing pulse for heteronuclear difference editing (Hetherington et al., 1985; Rothman et al., 1985; Pan et al., 1997) with MLEV-8 decoupling, combined with two dimensions of image-selected in-vivo spectroscopy (Silver et al., 1984) and outer volume suppression for localization (Pan et al., 1997). Briefly, the method is based on the acquisition of one sub spectrum without a 13C-inversion pulse, in which the labeled and unlabeled resonances are in phase, and a second sub spectrum with a 13C-inversion pulse, in which the labeled and unlabeled resonances have opposite phase. Subtraction of the two subspectra eliminates the unlabeled resonances, leaving only the 13C-edited glutamate resonance. A sweep width of 1,600 Hz, acquisition of 256 data points, and a repetition time of 2 seconds were used. The data were acquired in time-averaged blocks of 4.4 minutes both before the glucose infusion and throughout the infusion of [1-13C]glucose. The pulse powers required for 13C inversion and decoupling were determined using direct detection of the 13C resonances of the extracranial lipids.
To enhance the quality of the analysis of the data, it was necessary to measure the 13C fractional enrichment of the glutamate C4 position. This measurement required correction for differential saturation of labeled and unlabeled glutamate, decoupling efficiency, and inversion efficiency.
To determine the differential saturation factors of 13C and 12 C-labeled glutamate (SF13C and SF12C, respectively), near the end of five of the studies an 8.8-minute block of 13C-edited data was acquired with a repetition time (TR) of 4 seconds. The peak heights of the labeled and unlabeled glutamate were compared with 4.4-minute blocks of data acquired with TR = 2 seconds just before and after the set with TR = 4 seconds.
The decoupling efficiency (DE) was measured by acquiring edited spectra with and without 13C-decoupling. The peak height of the decoupled glutamate C4 resonance was divided by the sum of the peak heights of the undecoupled peaks to obtain the decoupling efficiency. The efficiency was measured in a solution of 13C-labeled acetate in vitro, and for glutamate C4 in one of the subjects in vivo, yielding values of 85 and 90%, respectively. According to the equations of Shaka and Keeler (1987), the decoupling efficiency of 85% for the methyl group of acetate corresponds to an efficiency of 88% for the methylene group of glutamate, which differs insignificantly from the measured 90%.
The inversion efficiency (IE) was measured in a solution of 13C-labeled acetate. [2-13C]Acetate (Cambridge Isotopes, Inc.) was detected in the absence of 13C decoupling both with and without a 13C-inversion pulse and found to be inverted with 95% efficiency.
The percent enrichment (PE) was then determined for each time-averaged block of data, according to
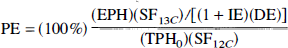
where EPH is the edited peak height, TPHo is the total peak height in the two acquisitions before the infusion, SF is the saturation correction factor, IE is the inversion efficiency, and DE is the decoupling efficiency.
Edited and unedited pairs of MR data were processed using a convolution difference of 40 Hz and 8 Hz Gaussian broadening followed by Fourier transformation. For each pair, the edited subspectrum was subtracted from the unedited subspectrum to obtain the edited difference spectrum of 13C-labeled glutamate C4. Manual baseline correction was performed to remove any broad components caused by motion-induced lipid subtraction errors. The spectra were plotted on paper, and the peak height of the glutamate C4 resonance (2.37 ppm) was measured using a ruler. The precision of the measurement is demonstrated in signal-to-noise ratio and the scatter of the data in the fits, which are discussed shortly.
Measurement of plasma glucose concentration and [1-13C] enrichment
Because 13C labeling of brain glutamate is derived from the [1-13C]glucose in the blood, accurate mathematical analysis of the time course requires sampling of the plasma glucose concentration and [1-13C]enrichment during the measurements. Before and during each study, 4-mL blood samples were obtained through one of the antecubital catheters. After centrifugation of the sample, 30 μL were used to measure the concentration of plasma glucose using a Beckman Glucose Analyzer II (Beckman Instruments, Fullerton, CA, U.S.A.). The remaining plasma was frozen at −20°C. Subsequently, the frozen plasma was thawed with 0.3 N perchloric acid, and after centrifugation the supernatant was neutralized with 10 N potassium hydroxide. After remaining at room temperature for 15 minutes and centrifugation, the supernatant was frozen in liquid N2. The frozen material was lyophilized and dissolved in 99.99% D2O (Behar et al., 1986).
The [1-13C] fractional enrichment of the α-anomer of glucose was determined using a 500-MHz vertical bore MR spectrometer (Bruker Instruments, Billerica, MA, U.S.A.). This was done using 1H MR spectroscopy by evaluating the ratio of the satellite 13C-C1 1H resonance areas to the total (12C + 13C) C1 1H resonances centered at 5.23 ppm. A 30° pulse angle with a 5-second repetition time was used to acquire spectra with 16,384 points and a 5-kHz sweep width. The number of acquisitions varied from 32 to 128 as needed to obtain adequate signal-to-noise ratios, depending on the quantity of glucose in the sample. The data were processed using 1-Hz exponential line broadening and zero-filling to 32,768 points. After Fourier transformation, a manual baseline fit with a 4th order polynomial was applied to remove the water baseline.
Principles of compartmentalized analysis
The flow of 13C through metabolic pathways can be expressed as a set of mass and isotopic balance equations. The total and isotopically labeled concentrations for a single tissue type are described according to the equations
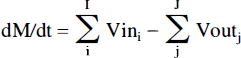
and
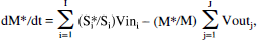
where M is the total (12C + 13C) concentration of a pool and M* is the concentration of labeled M, I and J are the respective number of inflows and outflows to and from M, Vini and Voutj are the rates of total (12C + 13C) flow in and out of the pool, and Si*/Si is the fractional 13C labeling of each substrate.
During this study, [1-13C]glucose was infused, and the time course of labeling of glutamate C4 was measured by MRS as a function of time. Because the sizes of the voxels used in the measurement contained mixtures of GM and WM, the observed glutamate C4 arose from glutamate located in the two different tissue types. It has been reported that GM and WM have different rates of glucose and oxygen utilization (Phelps et al., 1979; Lebrun-Grandié et al., 1983; Heiss et al., 1984) so the observed glutamate labeling arose from a volume containing predominantly two metabolic states. MRS does not distinguish glutamate in GM from glutamate in WM, so the observed 13C labeling time course results from a convolution of the labeling of GM and WM.
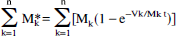
The observed time course of the percent enrichment of a compartmentalized metabolite has the form
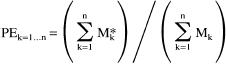
where Mk and Mk* are the total and labeled concentrations of M in a metabolic state k, and n is the number of metabolic compartments. At metabolic steady state, the denominator of Eq. 4 is constant, so that if there is a single substrate source whose enrichment S*/S is a step function rising from 0 to 100% at time t = 0,
Equation 5 shows that each part of an observed multicomponent time course is weighted by the concentration Mk of the observed metabolite in each compartment. Therefore, in an MRS study of glutamate in mixed volumes of GM and WM, the TCA cycle activity in GM is more heavily represented than would be expected from its fraction of the observed tissue. The same principle would be true for healthy tissue observed with diseased tissue in which the concentration of an observed metabolite is reduced.
Equation 5 also illustrates an effect of different metabolic rates on observed time courses of labeling. The exponential term in Eq. 5 reaches a steady state more quickly for large values of Vk/Mk, which means that differences in metabolic rates lead to nonlinear representation of metabolic components. The nonlinear behavior precludes the use of linear regression analysis to determine the metabolic rates of pure tissue compartments present in the voxels of interest.
Model and turnover analysis procedures
A schematic of the metabolic flows is shown in Fig. 1. To analyze the 13C labeling data, the schematic was expressed in mathematical form as a system of differential equations that described the mass and isotope balance of the system. The equations were generated by a user-friendly software package, CWave, and the equations are shown in Table 1. CWave provides a menu-driven interface that allows users to define metabolic pools, flows in and out of the pools, and the isotopic labeling patterns that result from labeled substrates. The software uses the definitions to create differential equations and solve them using a 4th/5th order Runge-Kutta algorithm with adaptive integral step size (Burden et al., 1981), given user-defined initial conditions and input functions for 13C-labeling time courses. Fitting is performed by adjusting user-designated parameters to perform a simplex search and obtain a least-squares fit to the data, with the parameters constrained to values greater than zero.
The form of the equations generated for the analysis of each experiment
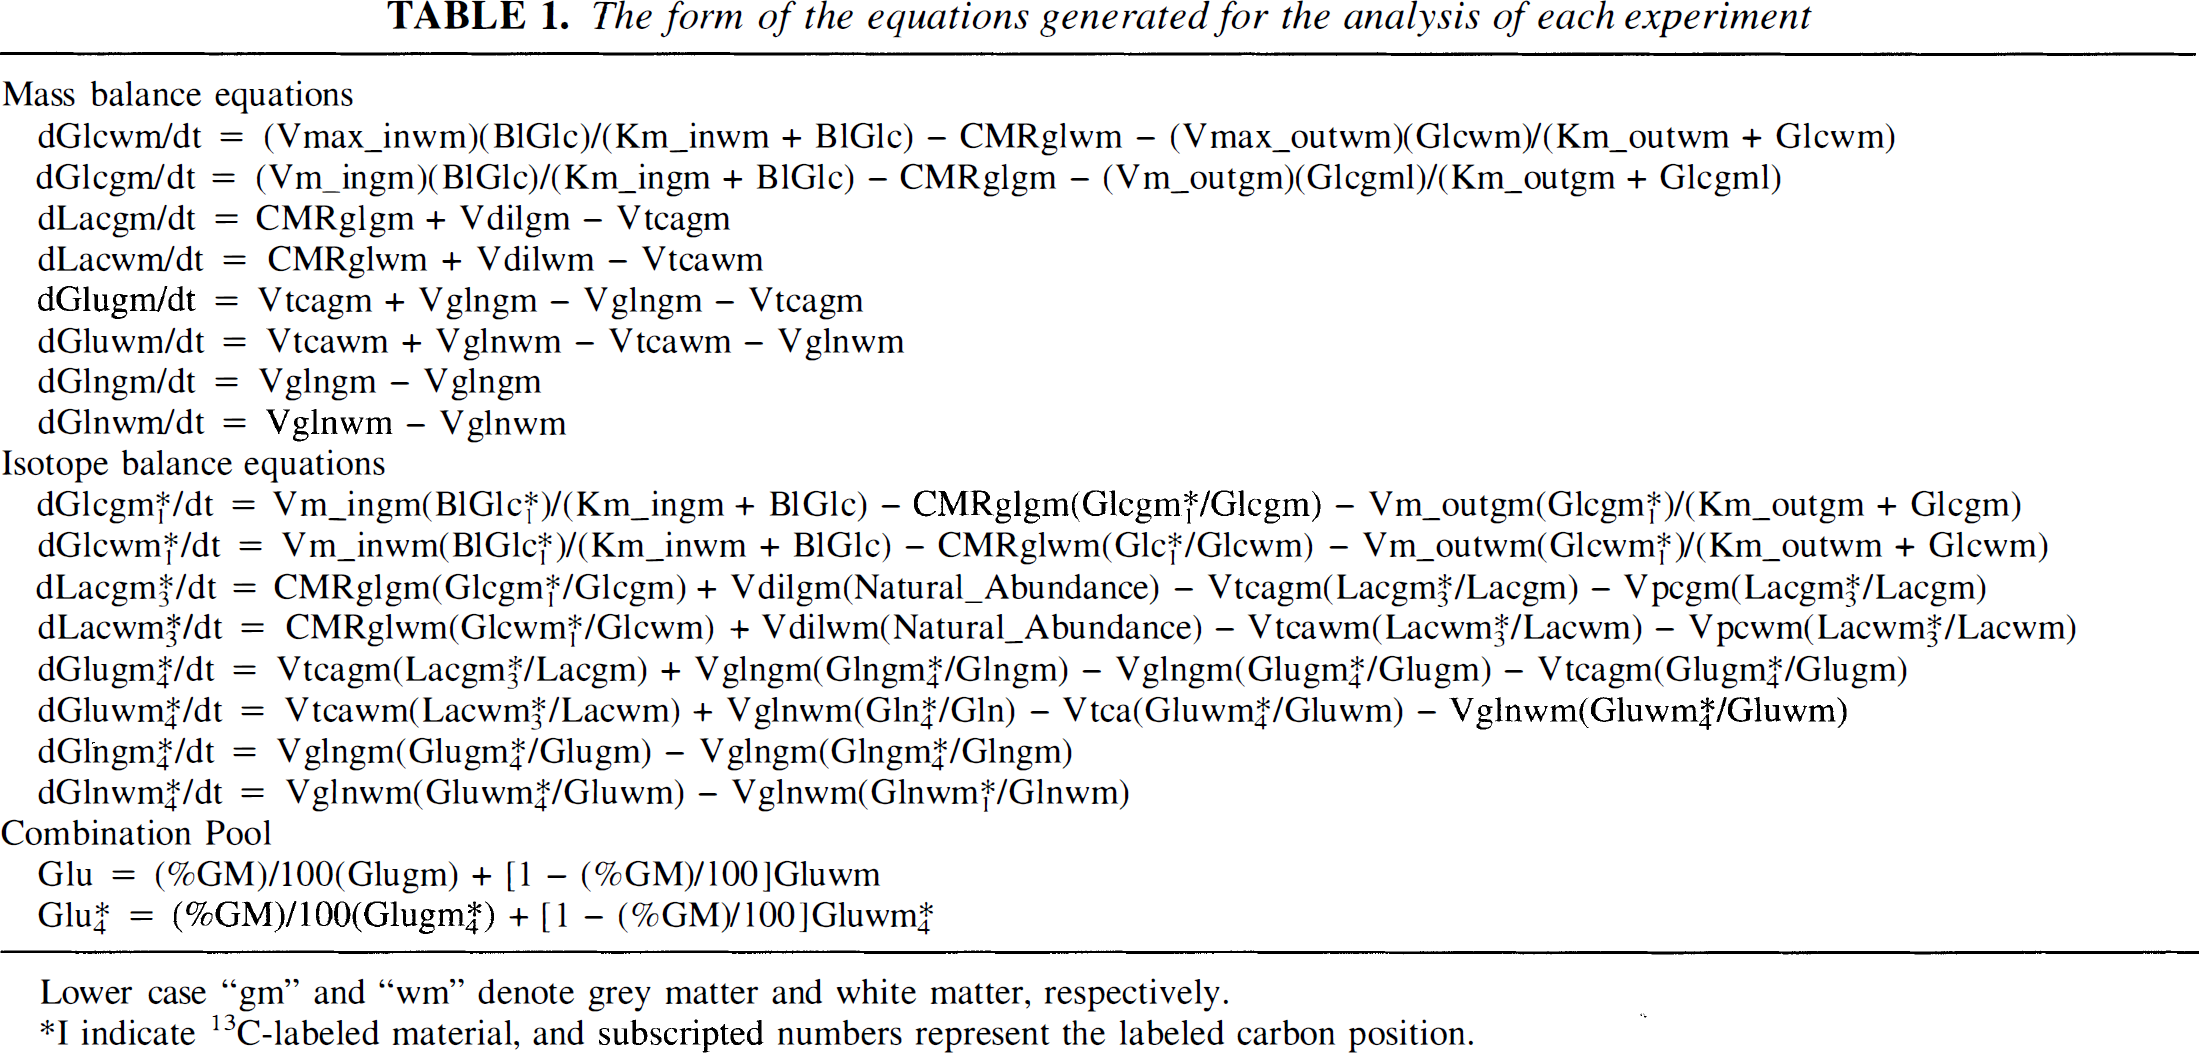
Lower case “gm” and “wm” denote grey matter and white matter, respectively.
I indicate 13C-Iabeled material, and subscripted numbers represent the labeled carbon position.
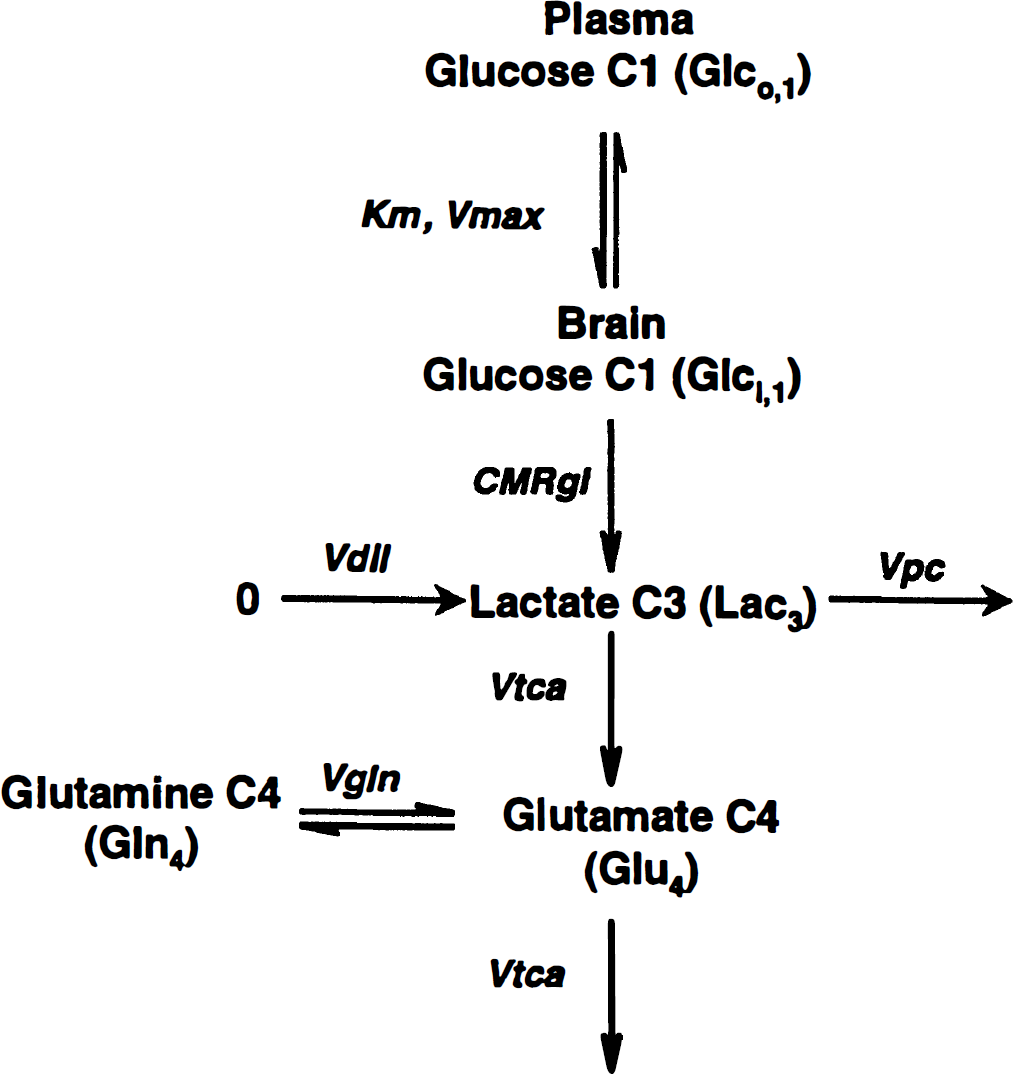
Schematic of 13C flow from [1-13C]glucose to glutamate in the brain. Glucose in the plasma (Glco) and the brain (Glci) exchange via the Michaelis-Menten kinetic parameters (4.9 mM) and Vmax (3.6 × CMRgl). Carbon flows at the rate 2CMRgl (ümol min–1 g–1) through the glycolytic intermediates, assumed to have negligible kinetic effect (Mason et al., 1992, 1995; Yu et al., 1997), and arrives at pyruvate; pyruvate and lactate are assumed to be in isotopic equilibrium and therefore comprise a single pool of C3-labeled lactate (Lac = 0.6 ümol min–1 g–1; Hanstock et al., 1988). Unlabeled carbon enters at lactate, pyruvate, and acetyl-CoA, all shown here entering at lactate. 13C enters the TCA cycle at this point and labels glutamate (Glu = 9.1 ümol min–1 g–1 in grey matter; Gruetter et al., 1994; 6 ümol min–1 g–1 in white matter; Perry et al., 1971). Glutamine (Gln = 4.1 ümol min–1 g–1) is synthesized from glutamate at a rate Vgln (0.47 ümol min–1 g–1 in grey matter; Mason et al., 1995; 0.17 ümol min–1 g–1 in white matter; calculated from Mason et al., 1995 and Berl, 1966). Subscripted numbers represent the position of carbon labeling.
The assumptions used in developing the model are as follows:
The kinetics of glucose transport obey Michaelis-Menten behavior; thus Km of the transporter = 4.9 mM and the transport Vmax/CMRgl = 3.6 (Gruetter et al., 1992). Because glucose uptake in rats has been reported to have an approximate proportionality with utilization (Hawkins et al., 1983), the ratio Vmax/CMRgl was used for WM as well as for GM. The fact that glucose transport is significantly more rapid than utilization combines with the influence of both concentration and isotopic gradients of glucose in such a way that significant variability can exist in Vmax/CMRgl and Km with negligible influence on the values determined for Vtca (Mason et al., 1992, 1995).
Small pools of glycolytic and TCA cycle intermediates can be neglected (Mason et al., 1992, 1995; Yu et al., 1997).
Exchange between α-ketoglutarate and glutamate is much faster than the TCA cycle rate (Mason et al., 1992, 1995).
To date, no chemical measurements of the rates of glutamate synthesis or breakdown exist for either human grey or WM. Therefore, it was necessary to obtain the most reasonable estimates possible from published data. In a study of primarily GM in human brain in vivo, the rate of glutamate-glutamine cycling, which is the rate of steady-state breakdown and synthesis of glutamine, in human GM was measured to have a value of 0.47 μmol min–1 g–1 (Mason et al., 1995). No measurements of glutamine synthesis have been reported for WM, so an assumption was made that the rate of synthesis was one third that of GM, as reported for adult cat brain (Berl, 1966). Potential limitations of these assumptions are addressed in the Discussion section.
The observed dilution of the glutamate C4 labeling is caused by ketone bodies and lactate, both of which are utilized by the brain. They have been observed to remain undetectably labeled during the conditions of the [1-13C]glucose clamp used in this study. Although the brain is a net producer of lactate (Gottstein et al., 1963), there is an exchange of lactate across the blood-brain barrier whose value has been measured in humans (Knudsen et al., 1991). Here, the two diluting fluxes are summed and directed into lactate as a single diluting flux variable. Because the lactate pool size is small compared to the concentration of glutamate, this step has the same kinetic effects on glutamate labeling as two separate diluting fluxes derived from blood lactate and acetyl-CoA.
The concentrations of lactate, glutamate, and glutamine in human brain were obtained from published values (Hanstock et al., 1988; Gruetter et al., 1994).
The turnover analysis was performed using a Pentium-II 233 MHz personal computer running CWave modeling software. The data were analyzed twice. First, the TCA cycle rate was calculated separately for each experiment to obtain the TCA cycle rate assuming a single tissue. The mean and standard deviation for GM and WM were calculated from the results obtained in each voxel.
To determine the value of the TCA cycle rate in pure GM and pure WM, all of the data were fitted simultaneously to obtain the expected value of the TCA cycle rate in GM and WM for the group. Specifically, the following procedure was followed:
For each subject time courses were calculated for pure GM and pure WM for “guessed” values of Vtca in each tissue type.
For each subject the calculated time courses for pure grey and pure WM were added together in proportion to the measured quantity of GM and WM in the MRS voxel to yield a calculated “combined” time course that was an approximation of the observed data.
The standard deviation of the observed data about the calculated “combined” time course from step 2 was calculated for each of the eight subjects, and the sum was used as a measure of the goodness of the fit for the group.
Steps 1 to 3 were repeated using a simplex algorithm to determine the values of Vtca in GM and WM that yielded the lowest standard deviation of data scatter about the time course.
The statistical distributions of the fitted parameters were evaluated numerically using a Monte-Carlo method of uncertainty analysis (Bevington and Robinson, 1992; Mason et al., 1992, 1995, 1997; Press et al., 1996).
RESULTS
Fasting plasma glucose concentrations were 4.8 ± 0.3 mM (mean ± SD, n = 8). The infusion maintained the concentrations and enrichments at 11.8 ± 0.4 mM and 59 ± 4% (mean ± SD, n = 8). The variability of the plateau period was measured as the average of the standard deviations of the plasma glucose concentration within each subject, which yielded values of 0.7 ± 0.3 mM and 4 ± 2% (mean ± SD, n = 8) for concentration and enrichment, respectively. There is potential for the rise in concentration to alter blood-brain glucose transport kinetics, although previous results demonstrate that the transport kinetics are rapid enough that variability causes a negligible effect on the measurement of the TCA cycle rate.
Figure 2 shows a 1H-observed/13C-edited spectrum with its constituent subspectra, obtained in predominantly OM. The top spectrum and center spectrum show prominent resonances of creatine, choline, N-acetyl-aspartate, and glutamate. Upon subtraction, only the 13C-labeled glutamate C4 peak remains at the 2.37 ppm position.
To convert spectra like the data in Fig. 2 to percent enrichment, it was necessary to measure the factors SF13C, SF12C, DE, and IE that are used in Eq. 1. The saturation factor for 13C-labeled glutamate, SF13C, was found to have a value of 1.01 ± 0.16 (mean ± SD, n = 5) for 13C-labeled glutamate C4, meaning that at a repetition time of 2 seconds, 13C-labeled glutamate C4 was fully relaxed. In contrast, SF12C, for unlabeled glutamate, had a value of 1.29 ± 0.07 (mean ± SD, n = 5). The decoupling efficiency, DE, was found to be 0.85 in solution and 0.9 in vivo, a difference which could be explained on the basis of higher sensitivity in vitro. Therefore, the value of 0.85 from the phantom was used for the value of DE. The inversion efficiency, IE, measured in the solution was 0.95.
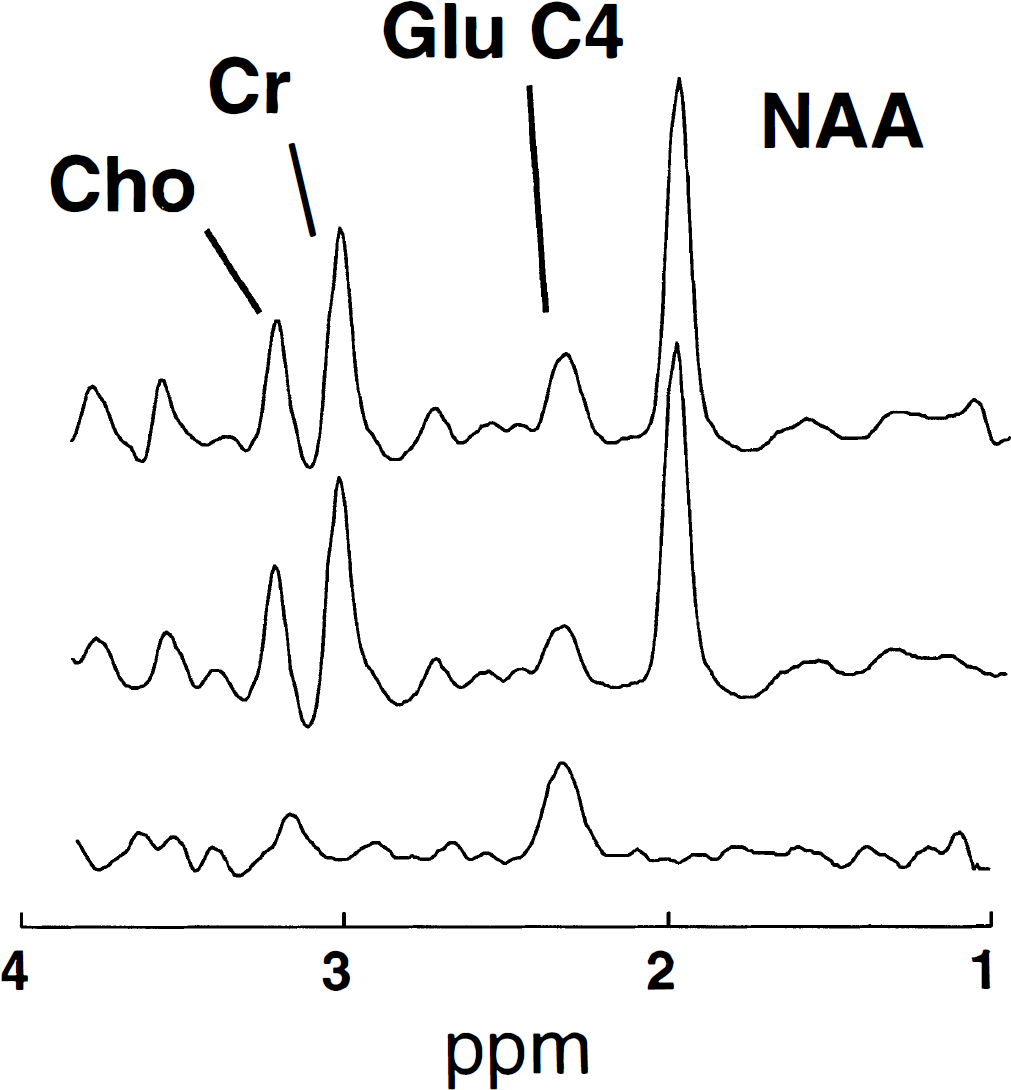
A 4-minute 13C-edited spectrum obtained after 60 minutes in predominantly grey matter in one of the subjects after a 60-minute infusion of [1-13C]glucose. (
Single-tissue compartment analysis
Time courses of 13C percent enrichment of the glutamate C4 resonance for predominantly GM and primarily WM are shown in Fig. 3. The time course in the voxel of WM has a slower rise than that obtained in GM. The individual TCA cycle rates and diluting flows obtained from the single-tissue compartment analysis are shown in the top portion of Table 2. Some variability occurred because of intersubject variability (Mason et al., 1995) and within-subject scatter of the data. The rate of dilution of glutamate labeling by nonglucose sources differed insignificantly between the OM and WM, with values of 26 ± 13% of Vtca (mean ± SD, n = 5) and 18 ± 13% of Vtca (mean ± SD, n = 3), respectively. In agreement with the more rapid labeling shown in Fig. 3, the time courses from predominantly GM yielded larger TCA cycle rates (0.72 ± 0.22 μmol min–1 g–l; mean ± SD, n = 5) than did WM (0.29 ± 0.09 μmol min–1 g–1; mean ± SD, n = 3).
Rate of the tricarboxylic acid cycle derived when each study was assumed to reflect purely the dominant tissue type within each voxel, compared to the values determined for pure GM and WM in the group
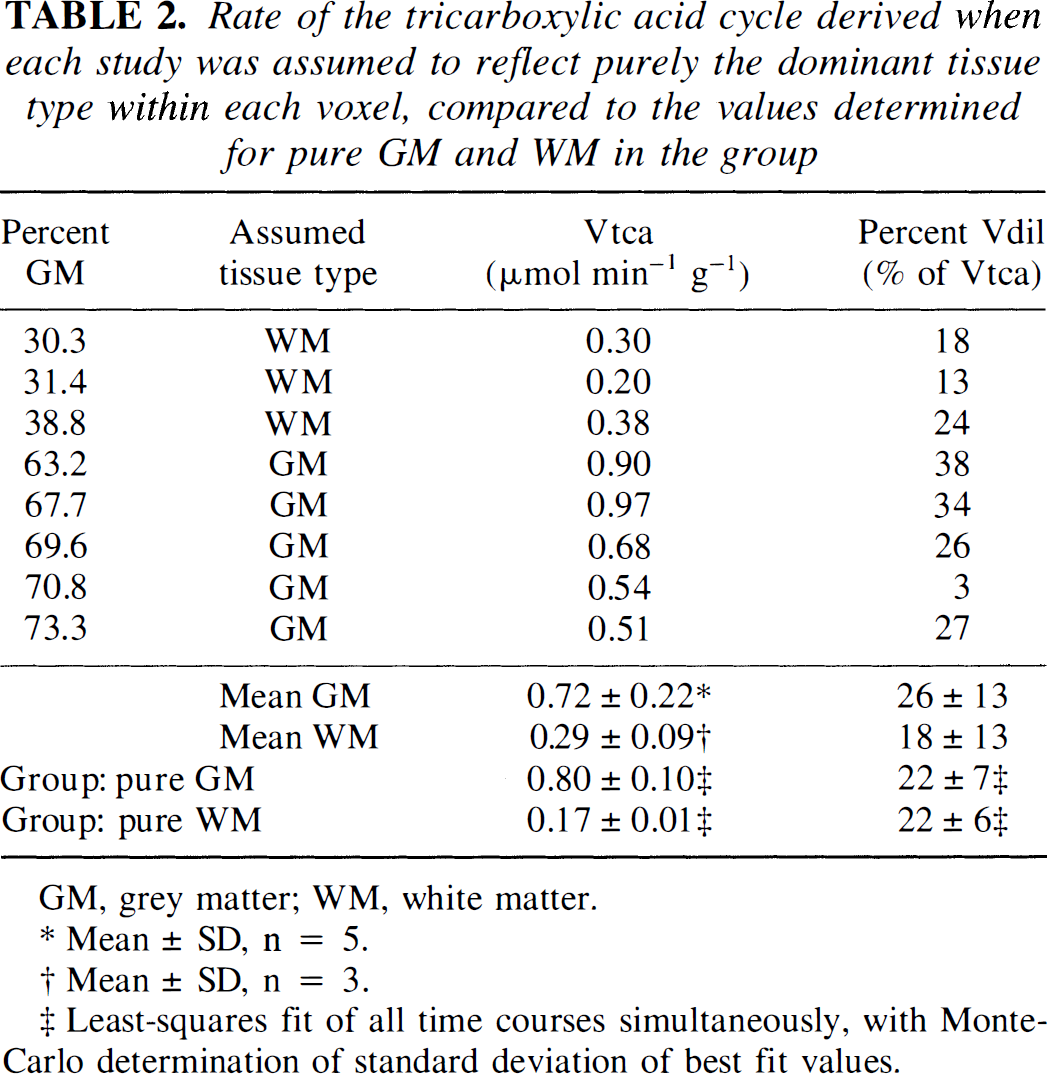
GM, grey matter; WM, white matter.
Mean ± SD, n = 5.
Mean ± SD, n = 3.
Least-squares fit of all time courses simultaneously, with Monte-Carlo determination of standard deviation of best fit values.
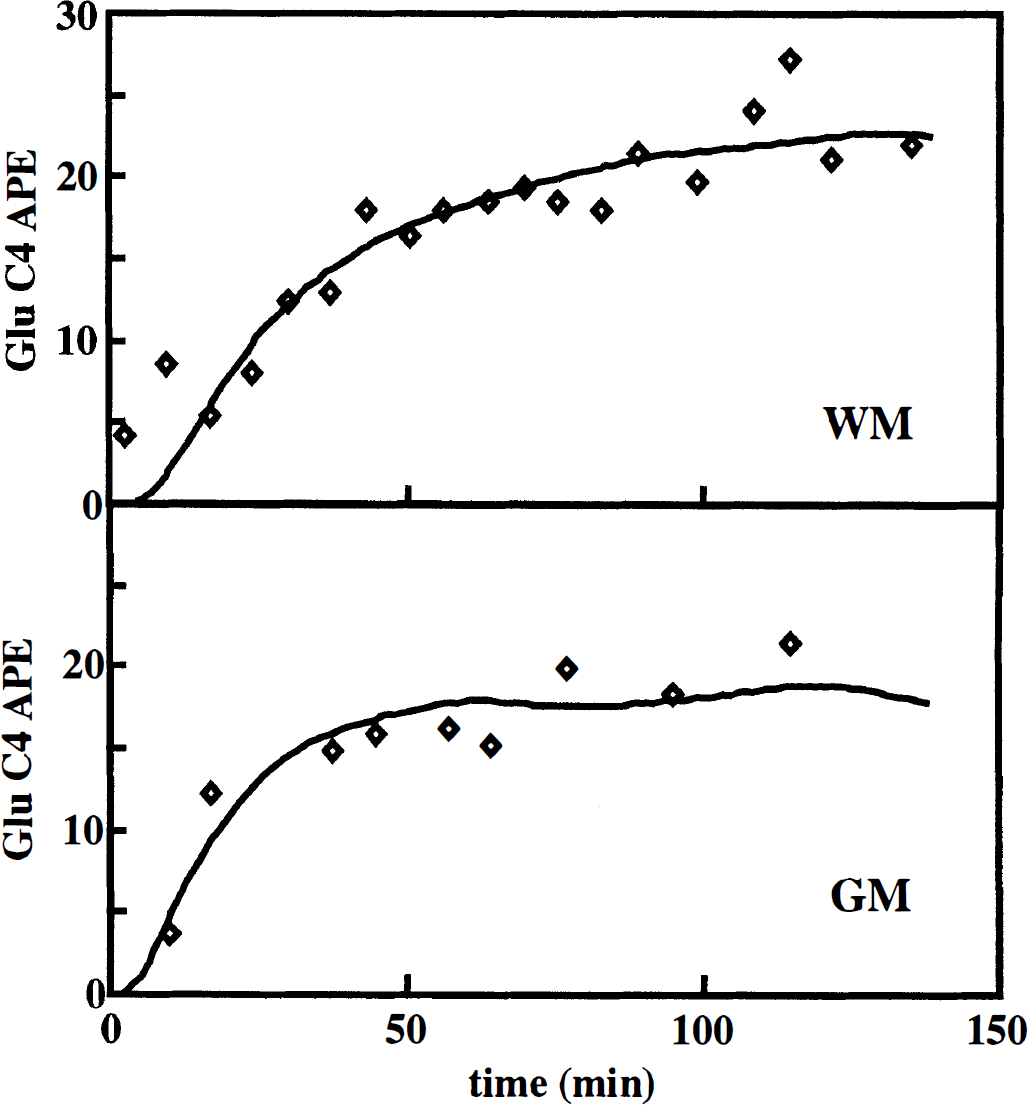
Time courses of glutamate C4 1abeling obtained in mostly grey matter (bottom) and mostly white matter (top). Fits were made to the metabolic model shown in Fig. 1 by solving the differential equations of Table 1, assuming only grey matter or only white matter for each time course, using a simplex algorithm to determine the values of the TCA cycle rate and the dilution that yielded the least-squares fit to the data. If partial volume effects are not considered, then the top figure is assumed to be entirely grey matter and the bottom figure entirely white matter. The time course in grey matter rises more quickly than the one in white matter because of the higher TCA cycle rate in grey matter.
However, each sample contained significant quantities of the less prevalent tissue. As discussed with Eq. 5, mixtures of tissue with different TCA cycle rates and concentrations of glutamate result in nonlinear effects on the observed 13C-labeling time course of glutamate C4. Therefore, a two-tissue compartment analysis was performed.
Two-tissue compartment analysis
Fitting the data from all of the subjects simultaneously yielded rates of 0.80 ± 0.10 and 0.17 ± 0.01 /μmol min–1 g–1 for the TCA cycle in pure GM and pure WM, respectively, shown in the bottom portion of Table 2. Fits are shown in Fig. 4 for voxels of primarily GM and mainly WM. Figure 4 shows that for a voxel of mainly WM, through the first hour of the infusion the labeling in the mixed voxel was dominated by the time course of labeling in the GM portion of the voxel, even though the OM comprised only 30% of the tissue in the voxel. The uneven weighting arises from the faster TCA cycle rate and higher concentration of glutamate in GM. For a mixture of primarily GM, the vast majority of the labeling is attributable to metabolism in GM. Figure 4 demonstrates that for a measurement of glutamate labeling in cortical GM, contamination of the volume by even 30% WM exerts a small influence on the labeling time course. However, even a small amount of GM can significantly alter a measurement conducted in primarily WM.
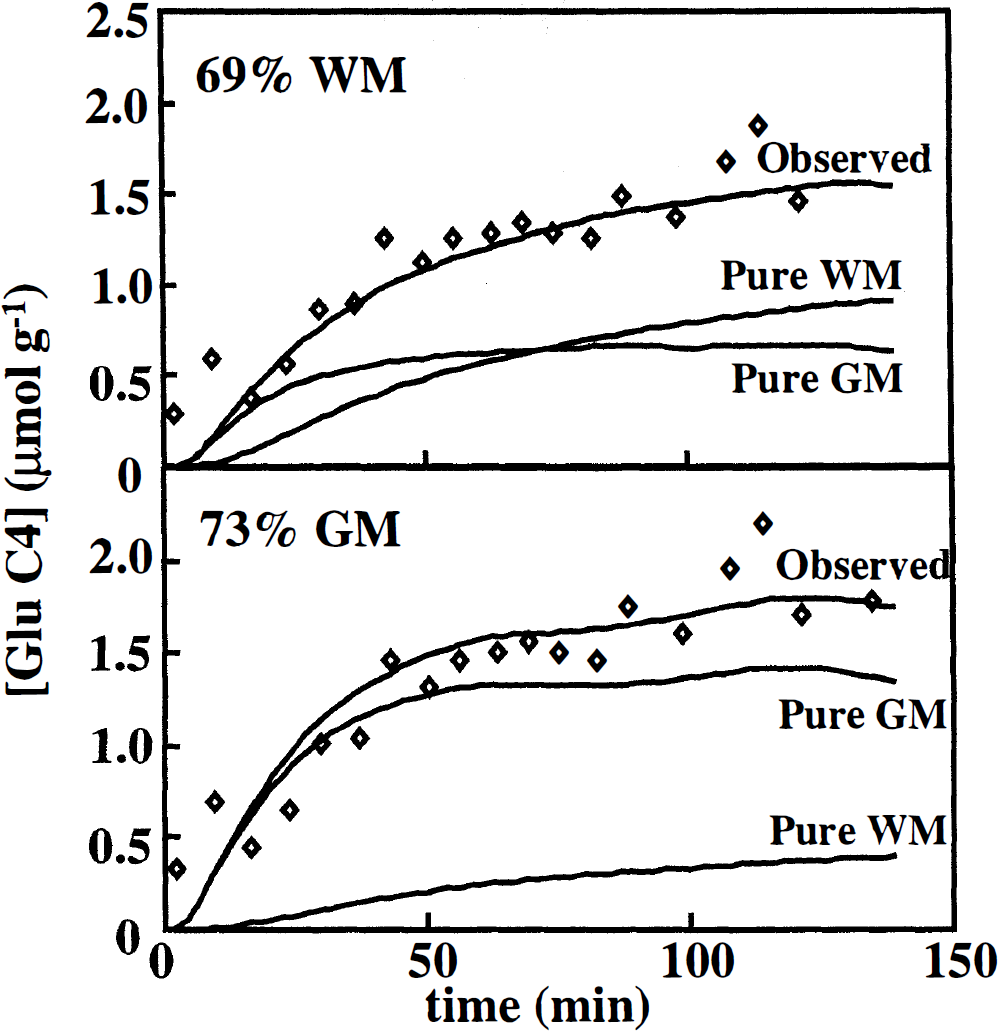
Time courses of the concentration of 13C-labeled glutamate C4 in volumes of primarily white matter and primarily grey matter. The top curves in each graph, passing through the data, are curves from the least-squares fit of the model of Fig. 1 to the data as determined from the simultaneous fits of all eight studies. The two lower curves in each graph correspond to the time courses of the concentrations of 13C-labeled glutamate in the voxel predicted from the group fit. The sum of the lower curves yields the top curves, which are fits to the data. The bottom graph shows that volumes of mainly grey matter reflect almost entirely the kinetics of pure grey matter. The top graph illustrates that volumes of primarily white matter reflect predominantly kinetic behavior of grey matter for the first 30 to 45 minutes. The data were fitted by calculating time courses of 13C-labeling for pure grey matter and pure white matter and mixing them according to the proportions of grey matter and white matter measured in each study, resulting in eight different mixed time courses corresponding to each of the eight different studies. This process was repeated using a simplex algorithm to vary the values of Vtca and the dilutions for grey matter and white matter to find the least-squares fit to the data.
Dilution rates of 22 ± 7% and 22 ± 6% of Vtca were obtained for pure GM and pure WM, respectively. Using the dilution rates, the value of CMRgl can be derived on the basis of mass balance (Mason et al., 1992, 1995), using the expression

where Vpc is the rate of flow through pyruvate carboxylase. Vpc is estimated to consume about 10% of brain glucose taken up from the blood. Table 3 contains the values of 0.35 ± 0.07 and 0.08 ± 0.01 μmol min–1 g–1 derived for CMRgl in pure GM and pure WM, respectively, using the model of Fig. 1. The dilution is attributed to a mixture of ketone bodies and lactate (Juhlin-Dannfelt, 1977; Knudsen et al., 1991) which remains unlabeled during the infusions (Mason et al., 1995). The value of CMRO2 can be calculated from the expression

where Vg; Vlac, Vβhb, and Vacac are the rates of carbon contribution from glucose, blood lactate, β-hydroxybutyrate, and acetoacetate, respectively. The highest and lowest extremes of CMRO2 occur for Vdil = Vlac and Vdil = Vacac, respectively, yielding the values shown in Table 3. The values lie in the range of 2.3 to 2.4 μmol min–1 g–1 for pure GM and 0.47 to 0.51 μmol min–1 g–1 for pure WM.
Rates of the tricarboxylic acid cycle, CMRgl, and CMRO2 determined for pure grey matter and pure white matter in the eight studies
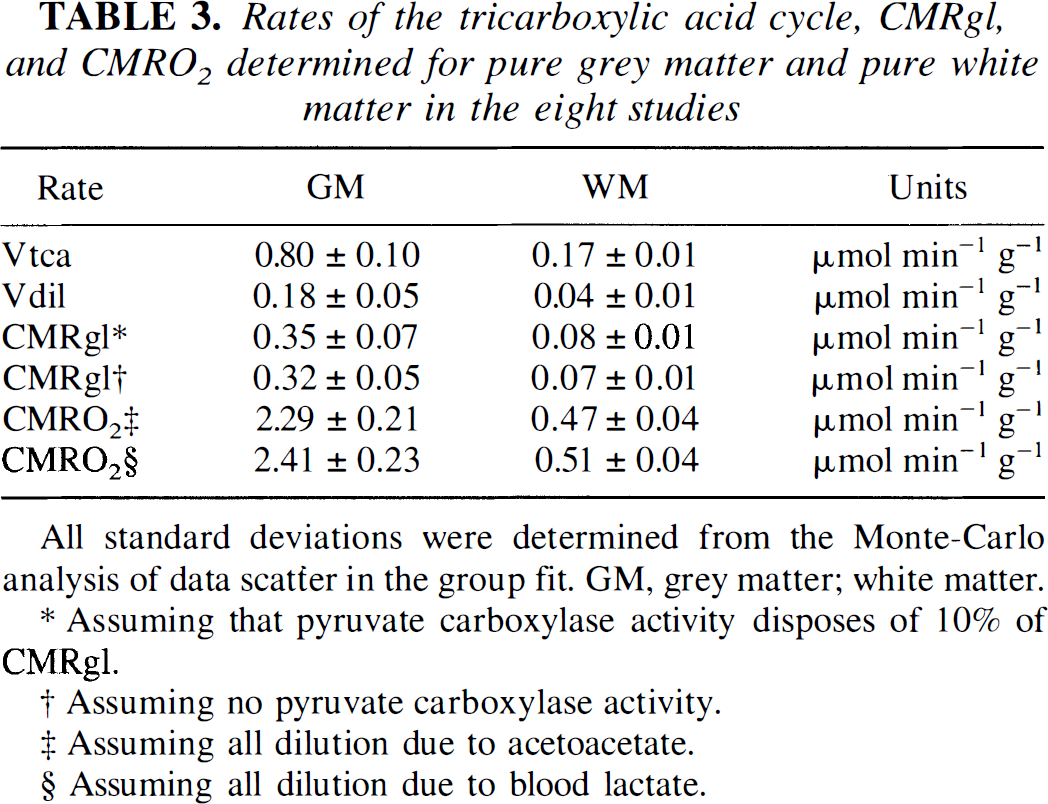
All standard deviations were determined from the Monte-Carlo analysis of data scatter in the group fit. GM, grey matter; white matter.
Assuming that pyruvate carboxylase activity disposes of 10% of CMRgl.
Assuming no pyruvate carboxylase activity.
Assuming all dilution due to acetoacetate.
Assuming all dilution due to blood lactate.
As shown in Table 3, the values of Vtca, Vdil, CMRgl, and CMRO2 in pure WM were approximately 20% of the respective values determined for pure GM.
DISCUSSION
Deconvolution of partial volume effects
Magnetic resonance spectroscopy allows the measurement of metabolic rates in the human brain in vivo (Rothman et al., 1992; Chen et al., 1994; Mason et al., 1995). At present, the measurements are made in the presence of partial volume effects, because the volumes of interest encompass both GM and WM. By the acquisition of multiple voxels and quantitative analysis of the extent of the volume mixing, the partial volume effects can be resolved, allowing the determination of metabolic rates in pure tissue types.
The treatment of the data is analogous in principle to the linear regression that has been used to measure levels of metabolites in pure GM and WM (Doyle et al., 1996; Hetherington et al., 1996; Mason et al., 1998). The treatment of the metabolite levels by linear regression was possible because the level of a metabolite in a volume of mixed tissue is a linear function of its level in the various tissues that comprise the volume. The time course of 13C-labeling of glutamate, however, is a function of glutamate levels in the contributing tissue types and the metabolic rate of each tissue type in the volume, which as shown in Eq. 5 yields nonlinear behavior.
For purposes of comparison with and without consideration of partial volume effects, the labeling time courses in mostly GM or primarily WM were evaluated first using the assumption that the volume consisted entirely of the predominant tissue type. By this method, values of 0.72 and 0.29 μmol min–1 g–1 were obtained for GM and WM, respectively. However, the presence of WM in the volumes of mostly GM slowed the observed time courses of glutamate labeling, whereas the presence of GM in the volumes of mostly WM had the opposite effect. Thus, when deconvolution was used, the rates of pure GM and pure WM increased and decreased, respectively, with values of 0.80 and 0.17 μmol min–1 g–1.
Deconvolution of metabolic rates will become increasingly useful as MR spectroscopic imaging of 13C-labeling is performed (van Zijl et al., 1993). MR spectroscopic imaging is ideal for the deconvolution because many adjacent voxels are acquired simultaneously. Deconvolution requires more than one mixture of particular tissue types or metabolic conditions. In the present study, for example, measurements of approximately 30% WM-70% GM were compared with measurements of 70% WM-30% GM to obtain estimates of Vtca in pure GM and pure WM. Therefore, in cases of functional activation or disease, in which a single volume of different metabolic state may be small enough to appear in only one voxel, it may be necessary to shift frames of reference so as to sample the partial volumes differently.
Accuracy of method under alternative conditions
In the case of resting, healthy subjects, the deconvolution of the values of Vtca in GM and WM is made clearer by the wide separation of the rates in the respective tissues. However, in cases of diseases that reduce the metabolic rates of the tissues, the value of Vtca in GM may approach that of WM, potentially reducing the ability of the method to discern the rates. Alternatively, in cases of stimulation, the labeling of glutamate may occur rapidly and reduce the precision of the measurement of the fast metabolic component.
This issue was examined using simulations of experimental data with noise levels identical to those obtained in the data sets of the present study (Fig. 5). Specifically, for values of Vtca ranging from 0.2 to 1.6 μmol min–1 g–1 for GM and fixed at 0.17 μmol min–1 g–1 for WM, eight data sets were simulated using the same mixtures of GM and WM and the same levels of noise that were obtained in the original data presented in this paper. For each value of Vtca in GM, a Monte-Carlo scatter analysis was performed to determine the mean and standard deviation of the values of Vtca that would be determined in GM and WM under those conditions. The precision remained good across the entire range, with the uncertainty in WM remaining constant and the uncertainty in the GM rate improved at low values of Vtca. Although it is true that the differentiation of Vtca in GM and WM becomes more difficult at low values, the uncertainty analysis shows that the method would permit the measurement of Vtca when the rate in GM is similar to that of WM.
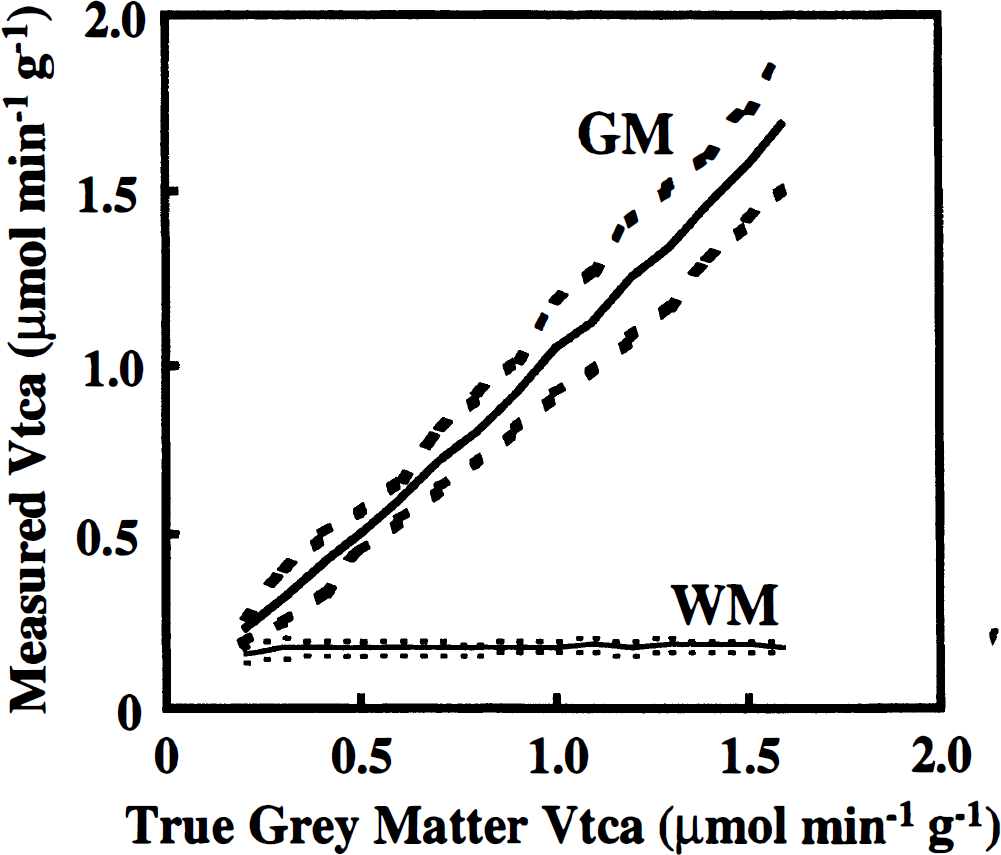
Precision of the value of Vtca measured in grey matter and white matter when Vtca in grey matter approaches the value in white matter. The dotted lines represent 1 SD about the mean. To estimate the rate dependence of the precision, time courses of 13C-labeling of glutamate were simulated using values of Vtca = 0.17 μmol min–1 g–1 for white matter and values of Vtca in grey matter ranging from Vtca = 0.2 to 1.6 μmol min–1 g–1. Noise with the same distribution as was obtained in the present study in vivo was added to the simulated data sets, and a Monte-Carlo analysis of the scatter was performed to determine the mean and standard deviation of the value of Vtca in grey matter and white matter.
Figure 5 also shows that lower values of Vtca in GM are determined with greater accuracy than higher values. The reason is that most of the information about Vtca is found in the labeling time course before isotopic steady state is achieved. When Vtca is slow, there is more time to acquire data during the non-steady-state portion of the time course. The reader may also note here and in the grouped analysis shown in Table 2 that the uncertainty in Vtca is much lower in WM than in GM. This is in part due to the slow metabolic rate of WM, and in part due to the fact that larger voxels were studied for the studies of primarily WM.
Sources of isotopic dilution
In the single-tissue analysis, unlabeled carbon was estimated to comprise 26 ± 13% and 18 ± 13% of the TCA cycle flow in GM and WM, respectively. The two-tissue compartment analysis yielded flow rates of unlabeled carbon equal to 22 ± 7% and 22 ± 6% of the TCA cycle rates in GM and WM, respectively. Unlabeled carbon could arise from protein degradation, removal of the labeled C1 of glucose via the pentose phosphate shunt, uptake of unlabeled lactate and pyruvate through exchange with the blood pool, and utilization of ketone bodies. The rate of protein degradation is about 0.3% of the TCA cycle in rats (calculated from Berl et al., 1961) and probably forms a similarly negligible contribution in humans. In rats, 1 to 3% of glucose utilization occurs via the pentose phosphate shunt (Gaitonde et al., 1983; Hawkins et al., 1985), and if the human brain maintains the same proportionality, in the present study the pentose phosphate shunt contributes a diluting flow of 0.00035 to 0.00105 μmol min–1 g–1. The rate of unidirectional influx of lactate into the human brain has been reported to be 0.08 ± 0.03 μmol min–1 g–1 (Knudsen et al., 1991). Although no measurements of unidirectional pyruvate influx were found for the human brain, it may be assumed to be slow relative to lactate influx and therefore to form a negligible component of the dilution. Assuming no ketone body production by the brain, the rate of utilization would be the same as the net rate of uptake from the blood, which is 0.86 ± 0.29 and 4.00 ± 1.57% of CMRgl for acetoacetate and β-hydroxybutyrate, respectively (Julhin-Dannfelt, 1977). When including the fact that each ketone body yields two units of acetyl-CoA, the percentages correspond to respective rates of 0.0060 ± 0.0020 and 0.0280 ± 0.0110 μmol min–1 g–1. The total anticipated dilution is predicted to be 0.125 ± 0.032 μmol min–1 g–1, which corresponds to 16 ± 4% of the TCA cycle flow. Given that the subjects were studied after an overnight fast, it is possible that the contribution from ketone bodies was even higher. Therefore, the values of 22 ± 7% and 22 ± 6% of the TCA cycle flux in GM and WM, respectively, lie within the range of what may be expected for diluting flows in this study.
Glutamate-glutamine cycling
Glutamate reaches an isotopic equilibrium with a significant pool of glutamine by means of glutamate-glutamine cycling (Erecinska and Silver, 1990; Erecinska et al., 1996; Sibson et al., 1997, 1998). The label flow between the two pools causes the glutamate pool to appear to be larger than its actual concentration, such that an infinitely fast exchange of label would cause the glutamate pool (9.1 μmol g–1 for GM) to be labeled with the kinetics of a pool whose concentration is the sum of glutamate and glutamine, or 13.1 μmol g–1. The TCA cycle rate is approximately proportionate to the kinetic pool size of glutamate, so if infinitely fast exchange were assumed, the value of Vtca would be 13.1:9.1 of the value determined if no exchange were assumed. Although this effect appears on first description to introduce a great deal of uncertainty, in fact the exchange-dependent increase in Vtca is asymptotic, with Vtca having reached 80% of its maximum value when Vgln = 0.125 μmol min–1 g–1 and 90% when Vgln = 004 μmol min–1 g–1 (Mason et al., 1995). The greatest uncertainty occurs when Vgln is slow.
The value of Vgln used for GM, 0047 μmol min–1 g–1, is potentially slower than the true value for GM, because the report from which the value was taken did not interpret the data in light of GM and WM differences. However because of the asymptotic behavior of the effects of Vgln, an underestimation of Vgln for GM should introduce an error of no more than 7.6% in the value of Vtca (Mason et al., 1995).
The value of Vgln = 0.16 μmol min–1 g–1 that was used for WM has greater potential for uncertainty in the result because the glutamate pool is smaller relative to glutamine and because the absolute rate is slower. The error introduced in Vtca of WM by assuming that Vgln = 0.16 μmol min–1 g–1 was calculated numerically. Briefly, a time course was fitted with Vgln = 0.16 μmol min–1 g–1 and the value of Vtca recorded. The same time course was fitted assuming Vgln = 0 and ∞, and the rates of Vtca were recorded in each case. It was found that if the true value of Vgln were 0, the value of Vtca obtained in this study would be an overestimate by 19%, whereas for Vgln = ∞, the value of Vtca in this report would be underestimated by 34%. Therefore, over the entire possible range of Vgln, the value of Vtca in WM could vary between 0.14 and 0.23 μmol min–1 g–1.
CMRgl and CMRO2 in grey matter
A value of 0.35 ± 0.07 μmol min–1 g–1 was obtained for CMRgl in pure GM, which is in agreement with the value of 0.37 ± 0.08 μmol min–1 g–1 previously reported from 13C-labeling data of a volume of primarily GM in the human occipital lobe (Mason et al., 1995). An extensive compilation of values of CMRgl for cortical GM (Wang et al., 1994) yielded a mean value of 0.34 ± 0.09 μmol min–1 g–1 in resting GM, which is also in agreement with the results reported here.
The value of 2.29 ± 0.21 μmol min–1 g–1 (5042 ± 0.51 mL 100 g–1 min–1) calculated for CMRO2 in GM is in agreement with the rate of 2.14 ± 0048 μmol min–1 g–1 (5.07 ± 1.14 mL 100 g–1 min–1) determined previously using 13C-labeling in predominantly GM (Mason et al., 1995). The value is also consistent with the reported value of 5.2 mL 100 g–1 min–1 for CMRO2 (Lebrun-Grandié et al., 1983) but is significantly higher than other values of 2.5 to 3.9 mL 100 g–1 min–1 (Baron et al., 1984; Perlmutter et al., 1987).
CMRgl and CMRO2 in white matter
The value determined for CMRgl in pure WM was 0.08 ± 0.01 μmol min–1 g–1, which is lower than rates of 0.19 and 0.18 μmol min–1 g–1 reported using PET (Phelps et al., 1977; Heiss et al., 1984). The value of 0.51 ± 0.04 μmol min–1 g–1 (1.2 ± 0.1 mL 100 g–1 min–1) that was determined for CMRO2 in WM is slightly lower than the value of 1.5 mL 100 g–1 min–1 reported using PET (Lebrun-Grandié, 1983). Given that even a small amount of contamination of WM by GM can raise a rate measurement significantly, a possible discrepancy arises from the presence of partial volume effects in the PET studies. Although the resolution of PET can range between 5 and 17 mm, even such high-resolution data are subject to significant partial volume effects from the spatial response function of the acquisition method and spatial filtering during the processing.
CONCLUSION
13C MRS has previously been used to measure metabolic rates in single voxels in vivo (Gruetter et al., 1994; Mason et al., 1995). The size of the single voxels that can currently be used entails partial volume effects between GM and WM. By acquiring multiple voxels, it is possible to deconvolve the contributions of GM and WM to the experimental observations and determine the TCA cycle rate in pure GM and pure WM. In principle, an analogous procedure could be used to evaluate rates in different brain regions or under different metabolic conditions. The deconvolution should prove especially useful for MR image data in which anatomic or even functional imaging maps can be generated in the same scan session.
Footnotes
Acknowledgments:
The authors thank Michael J. Vaughn for providing valuable support with electronics, and Charles Wyatt for developing the devices for subject placement and immobilization.