
Abstract
The brain is the most important organ in our body requiring its unique microenvironment. By the virtue of its function, the blood-brain barrier poses a significant hurdle in drug delivery for the treatment of neurological diseases. There are also different theories regarding how molecules are typically effluxed from the brain. In this review, we comprehensively discuss how the different pharmacokinetic techniques used for measuring brain uptake/permeability of small molecules have evolved with time. We also discuss the advantages and disadvantages associated with these different techniques as well as the importance to utilize the right method to properly assess CNS exposure to drug molecules. Even though very strong advances have been made we still have a long way to go to ensure a reduction in failures in central nervous system drug development programs.
Keywords
Introduction
Disorders related to the central nervous system (CNS) are the most prevalent, yet poorly understood and treated conditions of our time. 1 The rate of failure in the drug discovery phase as well as clinical trials are far higher for CNS diseases compared to other therapeutic areas. The challenges to successful clinical trials include the complexity of the brain architecture, the presence of the blood-brain barrier with low permeability, a lack of proper understanding of disease pathogenesis, poor understanding of the pharmacokinetics of the drug within the CNS as well as a poor understanding of interspecies scaling/extrapolations.2–4 Over the years there have been significant improvements in technology along with our understanding of the CNS. The pharmacokinetic techniques utilized for the measurements of brain uptake of drugs have improved significantly as well. Therefore, in this review, we comprehensively discuss the following issues: 1) Different routes of brain uptake and clearance of small molecules, 2) Different pharmacokinetic techniques used for measuring brain uptake/permeability of small molecules, 3) Advantages and disadvantages associated with different pharmacokinetic techniques as well as the importance to utilize the right method to properly assess CNS exposure to drug molecules.
The blood-brain barrier
The brain is the most important organ in our body requiring its unique microenvironment. The Blood-brain barrier (BBB) is located at the brain microvascular interface between the blood and the brain tissues. 5 As such, the BBB plays a very vital role in maintaining the optimal composition of the extracellular environment within the CNS which is necessary to support optimal neuronal functions. There are distinct differences in composition between the brain interstitial fluid and blood plasma, which is why the role of the BBB is critical in ensuring that unwanted solutes and potentially harmful substances do not enter the brain microenvironment. Although the BBB was discovered long before advancements in imaging and molecular biology, discoveries in the past few decades have enhanced our understanding of the BBB significantly. The unique and complex functional interaction between the BBB endothelium and its surrounding cellular components (neurons, astrocytes, microglia, pericytes as well as specialized cellular compartments such as endothelial glycocalyx6,7 has been termed neurovascular unit (NVU). Transmembrane inter-endothelial TJ proteins (e.g., occludin, claudins, etc.) act as a fence and restrict the paracellular flux of ions and hydrophilic solutes across the BBB8,9 resulting in high electrical resistance (≥1800 Ω.cm2) and corresponding low permeability to polar molecules; 10 that limits the paracellular trafficking of substances between the blood and the brain. Other prominent protein families, such as Adherens Junctions (AJ) and Gap Junctions (GJ), play significant roles in promoting intercellular adhesion and communication, respectively. Both AJ and GJ are integral to maintain BBB integrity.
The low pinocytic activity also ensures negligible transcellular trafficking while the presence of a plethora of transporters on the luminal and abluminal surface of the BBB endothelial cells also ensures that unwanted substances (both endogenous and xenobiotics) entering the brain are rapidly removed. 11 The transporters and enzymes expressed at the BBB include P-glycoprotein (P-gp), breast cancer resistance protein (BCRP), multidrug resistance-related proteins (MRPs) as well as cytochrome P450 (e.g., CYP3A4, NADPH-CYP P450 reductase, etc.) and Phase II detoxifying enzymes (UGT1A4). These active systems ensure that any unwanted molecule entering the BBB is rapidly cleared or metabolized.
Different mechanisms of brain uptake
By the virtue of its function, the BBB poses a significant hurdle in drug delivery for the treatment of neurological diseases. BBB permeability depends on molecular attributes (including molecular weight, substituent groups, polar surface area, hydrogen bond donor, and acceptor) as well as interactions of the concerned molecules with the transporters on the BBB.12–14 Depending on their molecular attributes, small molecules usually get transported through the BBB by simple diffusion (paracellular or transcellular). Some molecules require carrier-mediated transport in the form of facilitated diffusion (i.e. glucose transporters, organic anion transporters, etc.), while others depend on active transport using energy in the form of ATP. Active transport mechanisms can be divided into primary active transport and secondary active transport. Efflux transport by different ABC transporters such as P-gp is a good example of primary active transport. Secondary active transport typically couples the movement of an endogenous ion with another molecule that is transported against its concentration gradient. Macromolecules are typically transported via absorptive transcytosis (i.e. albumin) or receptor-mediated transcytosis (i.e. insulin and transferrin, etc.) These different routes of brain uptake have been illustrated in Figure 1.
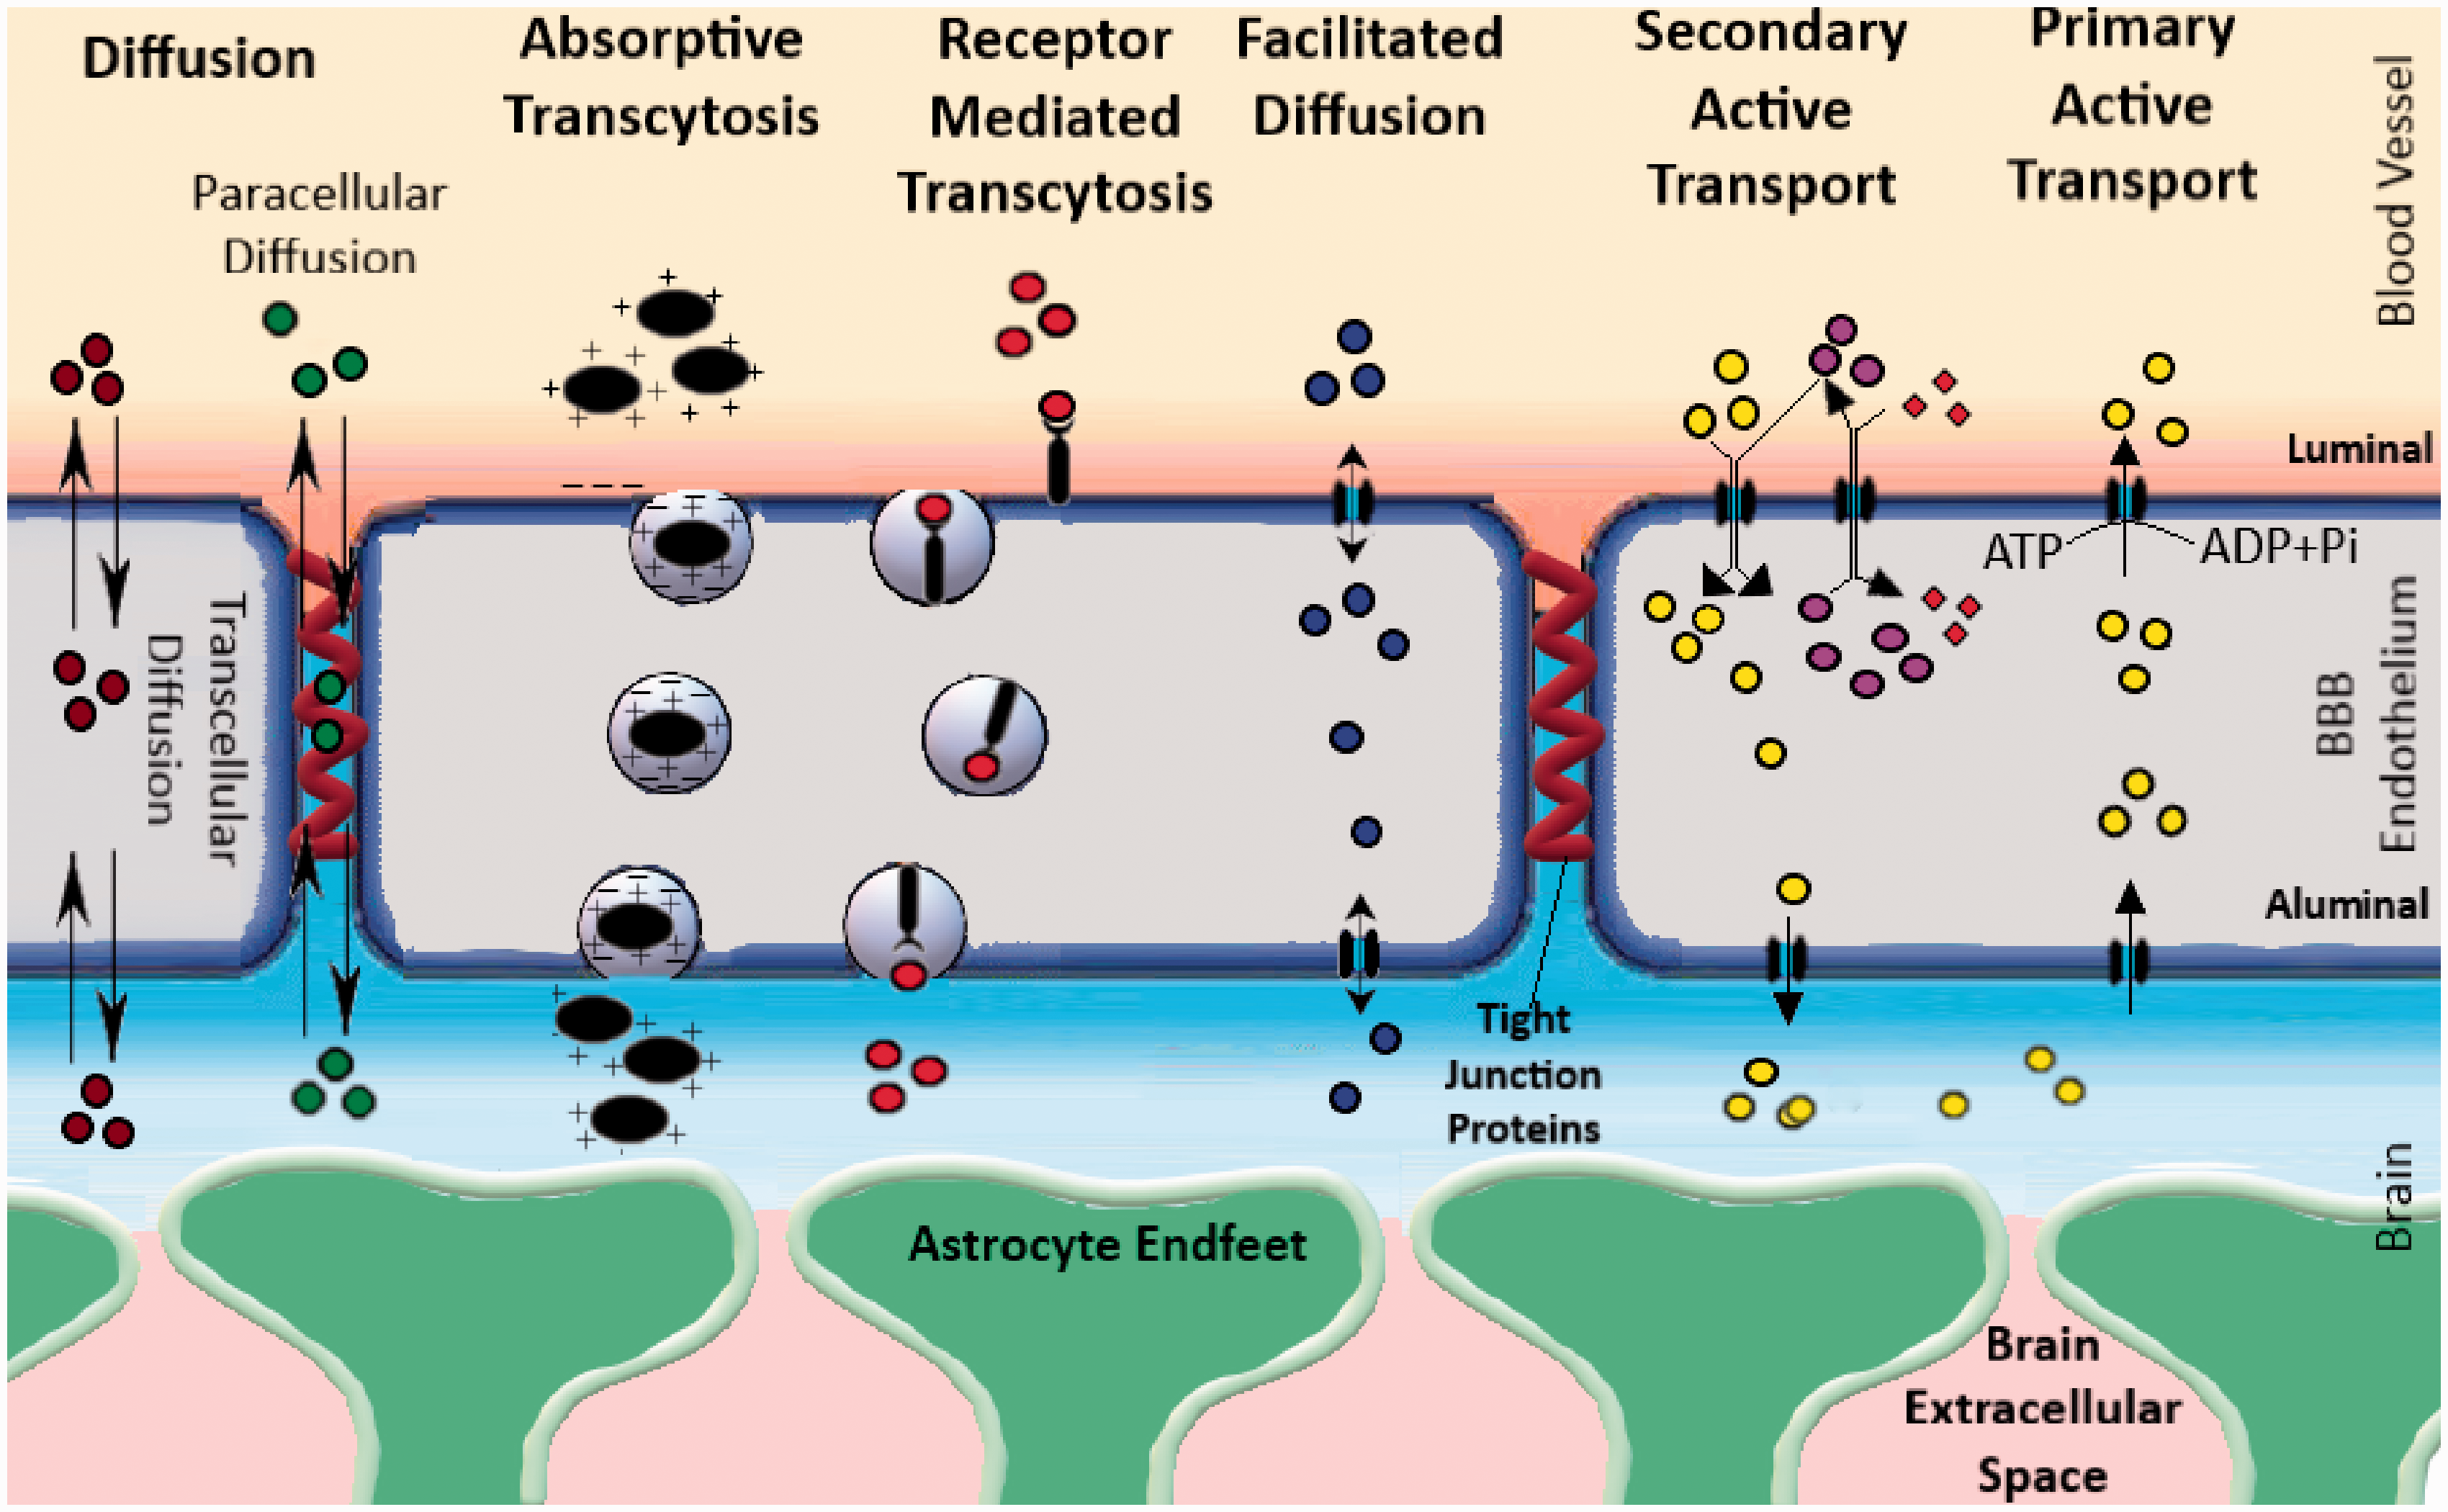
A schematic illustration of the different types of transport feasible across the BBB. The different modes of transport feasible across the BBB are as follows: 1) Simple diffusion, 2) Facilitated diffusion, 3) Absorptive Transcytosis, 4) Receptor-Mediated Transcytosis and 5) Active Transport (Primary and secondary). Typically, BBB permeable molecules can cross-diffusion (water-soluble molecules can diffusion paracellularly through the tight junction proteins, while lipophilic molecules take the transcellular route). There are numerous transporters present on the BBB that allow facilitated diffusion of different nutrients such as glucose, amino acids, nucleosides, and other molecules (i.e. Glut1, LAT1, etc.). Other than this, small molecules can also be transported by active transport, a process that uses energy in the form of ATP to transport molecules against a concentration gradient. Active transport mechanisms can be divided into primary active transport and secondary active transport. Efflux transport by different ABC transporters such as P-gp is a good example of primary active transport. Secondary active transport typically couples the movement of an ion-molecule with another molecule that is transported against its concentration gradient. Macromolecules are typically transported via absorptive transcytosis (i.e. albumin) or receptor-mediated transcytosis (i.e. insulin and transferrin, etc.).
Bulk flow-mediated clearance from the brain
Once inside the brain, typically, substances can be removed from the brain parenchyma through three possible pathways:
They are shuttled back into the blood flow across the BBB following a concentration gradient or through the action of active transporters (i.e. P-Glycoprotein- P-gp, multidrug resistance-related proteins-MRPs, and breast cancer resistant protein-BCRP). They may exit into the cerebrospinal fluid (CSF) or directly to the lymph and then transferred into the blood flow. Solutes might be metabolized into different molecules, which are then removed by the above-mentioned pathways.
The process by which molecules get transported and eliminated along the brain parenchyma via the second pathway is a matter of debate. The presence of a low level of bulk flow from the brain extracellular fluid has been known for decades.15,16 There have been several theories describing the mechanism of bulk flow over the past few decades. One of the earlier theories from the 1980s suggests that the secretion of fluid by the BBB may produce a small pressure gradient that could cause the movement of the interstitial fluid (ISF) along preferential routes.17,18 The flow could move through perivascular spaces in the grey matter or the extracellular spaces parallel to the axons in the nerve fiber tracts in the white matter. Initial estimations of bulk flow-mediated efflux from the brain were conducted by Helen Cserr’s group in the 1980s where the value for the bulk flow-mediated efflux was found to range between 0.1–0.3 uL.min−1.gm−1 for different compounds having different molecular weights.17,19 This technique was later modified by Kakee et al. 20 to be utilized as the brain efflux index. However, as pointed out later in a study by Groothuis et al., 21 these early studies were performed on animals that were anesthetized using barbiturates. Using either conscious animals or those anesthetized with ketamine/xylazine or halothane, bulk flow-mediated clearance is much faster with half-lives of ∼2–4 h. The study showed that the bulk flow-mediated efflux estimates range from 0.56 to 1.2 uL.min−1.gm−1 for different compounds having molecular weights from 182 Da to 70 kDa. Technically bulk flow-mediated clearance should be non-specific to the molecular weight of compounds and should be similar across all molecules. Groothuis et al. suggested potential errors associated with the technique of drilling into the skull and injecting small volumes of analyte into the brain which may have played a role in producing a range of different bulk flow results for different molecules.
Therefore, although with the data available in the 1980s, the hypothesis may have made sense, based on more recent measurements, the clearance estimates are too rapid to be explained by any fluid secretion rate. Furthermore, the proposed changes in pressure gradients could not be experimentally determined even with modern instruments. Additionally, the working hypothesis cannot explain the rapid influx of solutes into the parenchymal space after intrathecal or intracisternal injections.
The most recent theory (which is also known as the glymphatic hypothesis) assumes that the CSF flows inwards along with the periarterial spaces22,23 and moves into the parenchyma across the layer of astrocyte endfeet through water channels (such as Aquaporin4 – Aqp4) that are locally present. The flow is then assumed to propel the waste products of metabolism into the perivenous space by again crossing through the astrocyte endfeet via Aqp4. The flow then goes along the perivenous route and reaches lymphatic vessels in the neck. For this hypothesis to be true, a flow of ∼0.6 µL g−1min−1 or more would be needed to ensure the removal of the efflux markers at the observed rate. For a 1400 g human brain, this would be 1.2 L. day−1 which is roughly twice the generally accepted rate of production of CSF. Therefore, even if the rest of the assumptions are correct, either the glymphatic flow does not direct ISF out of the brain directly to the lymphatic vessels, or the rate of CSF production is greater than what is generally accepted. Further contradictions to the proposal are the observations of outward movements of solutes along arteries or the observed continuation of the rapid inward periarterial movement of large solutes when the proposed glymphatic circulation was interrupted at the level of the astrocyte endfeet in knockout Aqp4 in vivo models. Also, the space within AQP4 is just 4 nm which would be too narrow for large antibodies (∼10 nm) to cross.24–26
The most experimentally supported theory to date suggests that a convective mixing process is responsible for the movement of solutes across perivascular spaces, thus allowing rapid movements of solutes both inwards and outwards.24,27,28 An important part of the mechanism is that the dimensions of the perivascular spaces are modulated by periodic compression resulting from changes in blood pressure during the cardiac cycle. Similar effects have also been observed in the spinal cord where solutes were seen to move down their concentration gradients against the direction of CSF net flow.29,30 Bradbury et al. 28 suggested that periodic compression and expansion would cause a back-and-forth movement of solutes within the fluids which could form the basis of how the materials are moving in or out of the brain. The proposed movements have been experimentally observed in perivascular spaces close to the cortical surface using india ink 19 and microspheres. 23 This mechanism (illustrated in Figure 2) is relatively slow, (hours), but would still be much more rapid than diffusion over the large distances involved, thus suggesting that it would be mediated by some sort of “flow” (now referred to as the Bulk flow). So basically, unbound solutes in the brain parenchyma would move around through diffusion along a concentration gradient and convective transport at the perivascular space. The perivascular space acts as a highway to transport the solutes in or out of the brain parenchyma. The convective transport can allow the solute to diffuse from the ISF into the CSF at the subarachnoid space or vice versa. Solutes reaching the CSF can then drain into lymph through the cribriform plate, the blood through the arachnoid villi, or even travel to the cisterna magna17,28,31 (See also Figure 2). Other than this the perivascular spaces also contain resident macrophages (known as perivascular macrophages) that may be involved in the clearance of different endogenous molecules.32,33 CSF is constantly secreted by the choroid plexus which is present along the Blood-Cerebrospinal fluid barrier (BCSFB) in the lateral ventricles, the fourth ventricle as well as the arachnoid villi. The CSF fluid flows along the lateral ventricles, third-fourth ventricles, and then the cisterna magna where it mixes with fluid from the subarachnoid space. Therefore, any compound crossing the BCSFB would be diffusing along this fluid distribution pathway.
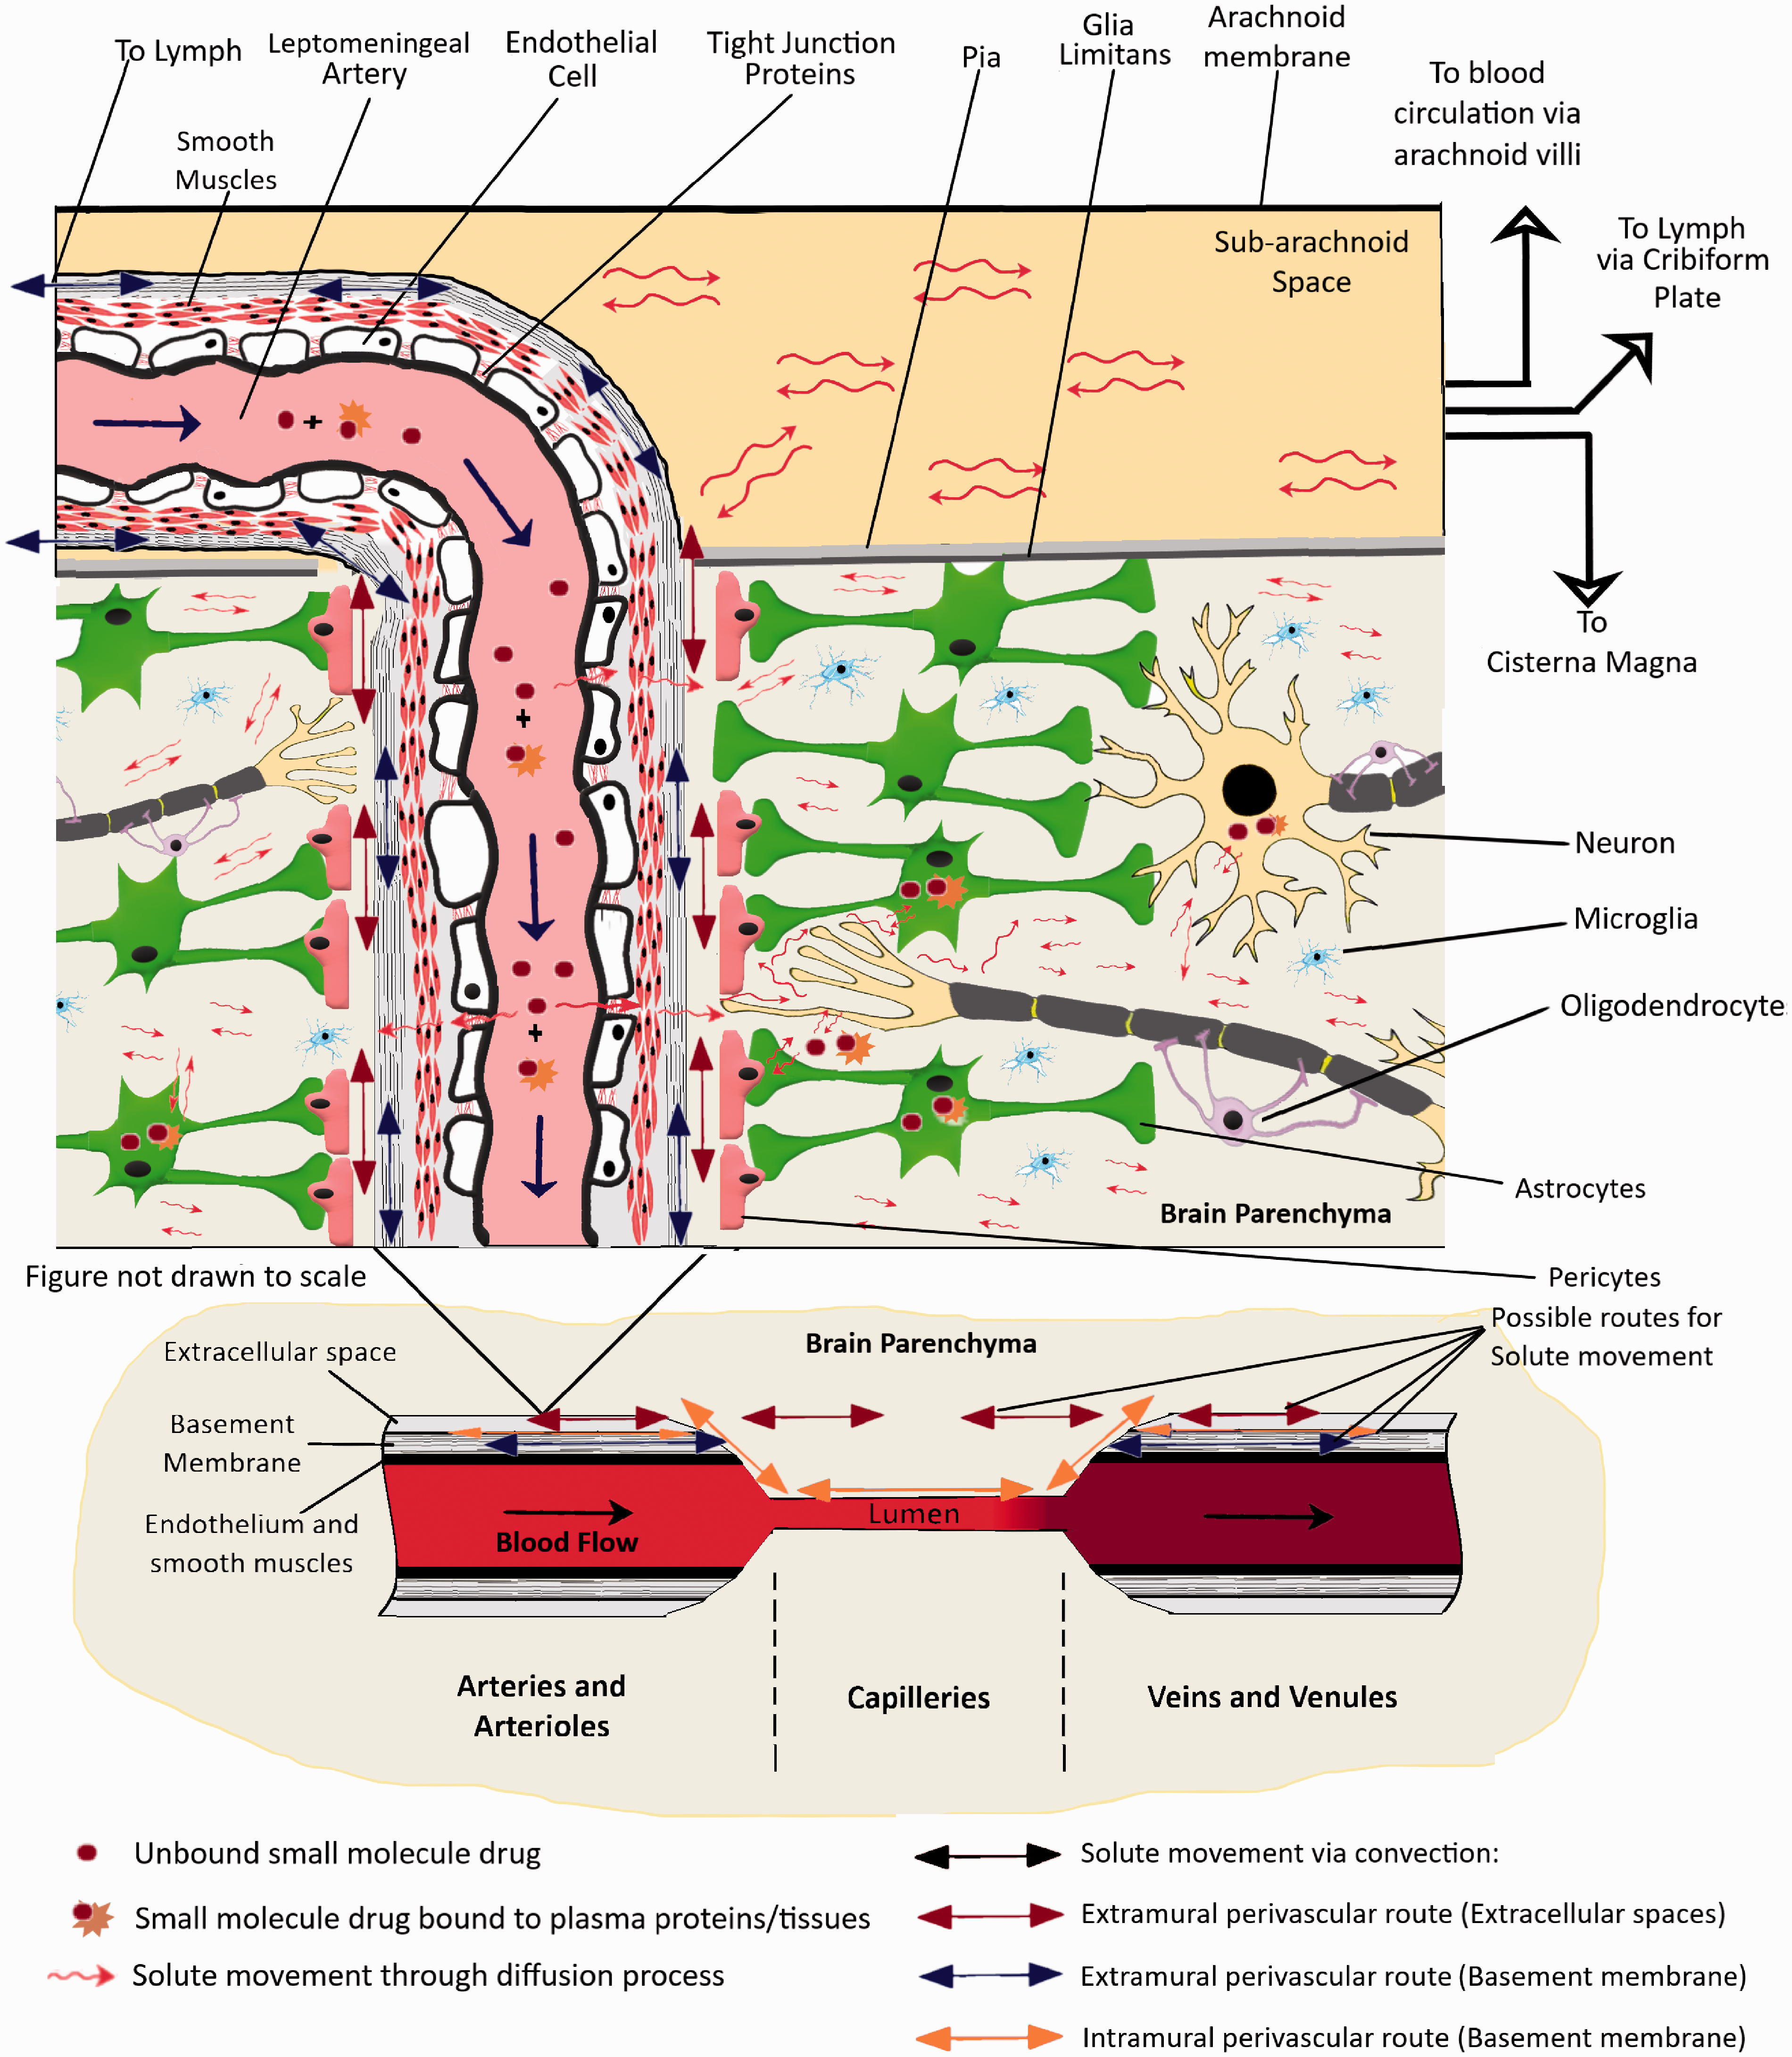
An illustration of the distribution of small molecule drugs within the CNS after entry into the brain through the BBB. Typically, molecules entering the brain through different transport mechanisms are subjected to diffusive transport in the brain parenchyma. However, this transport process is rather slow to allow rapid distribution in CNS since the brain extracellular space is very narrow and tortuous with a space of just ∼50 nm between cells. Molecules in the perivascular spaces are subject to convective transport and can be transported much faster via this mechanism. This phenomenon most probably contributes to the ease of transport of molecules from Brain Parenchyma to the CSF in subarachnoid space, the Cisterna Magna as well as the ventricles.
Pharmacokinetic techniques for measuring brain uptake and/or permeability of small molecules
As the field related to brain research has expanded exponentially over the decades, the concepts utilized for measuring the brain uptake and permeability of small molecules has also evolved. These different techniques have been described below:
Single time point analysis
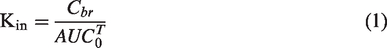
This technique is usually used for understanding brain uptake of molecules after intravenous bolus doses. The brain uptake clearance (Kin) values can be obtained from equation (1) (see below). The technique assumes that the blood concentration of the molecule will act as the driving force for the brain uptake. It is only useful for molecules following linear pharmacokinetics and at time points in which conditions of unidirectional uptake from blood to brain are prevalent. As a rule of thumb, the technique can be useful at time points where the blood concentrations are many folds higher than the brain concentrations. However, for compounds that have low permeability, the bulk flow-mediated efflux can lead to underestimating the brain uptake measurements at later time points. Other than that, if the molecule interacts with influx or efflux transporters, the paracellular brain uptake clearance values could be over or underestimated, respectively. Since the unbound fraction of the molecule produces the driving force for brain uptake, the plasma protein binding would also need to be taken into consideration.
The schematic illustration of the technique is demonstrated in Figure 3. Brain uptake using the single time point analysis technique can be studied in 2 ways. The first method utilizes the transcardial perfusion technique to clear the vascular volume from the brain tissue. In brief, blood samples (arterial or venous) are collected at different time points and a terminal blood and brain sample is collected. Before the collection of the brain sample, a transcardial perfusion procedure needs to be performed by inserting a cannula through the left ventricle and pumping saline with heparin through the ascending aorta after cutting the jugular veins to drain all the blood. The brain uptake for the compound, Kin, can then be calculated as follows:
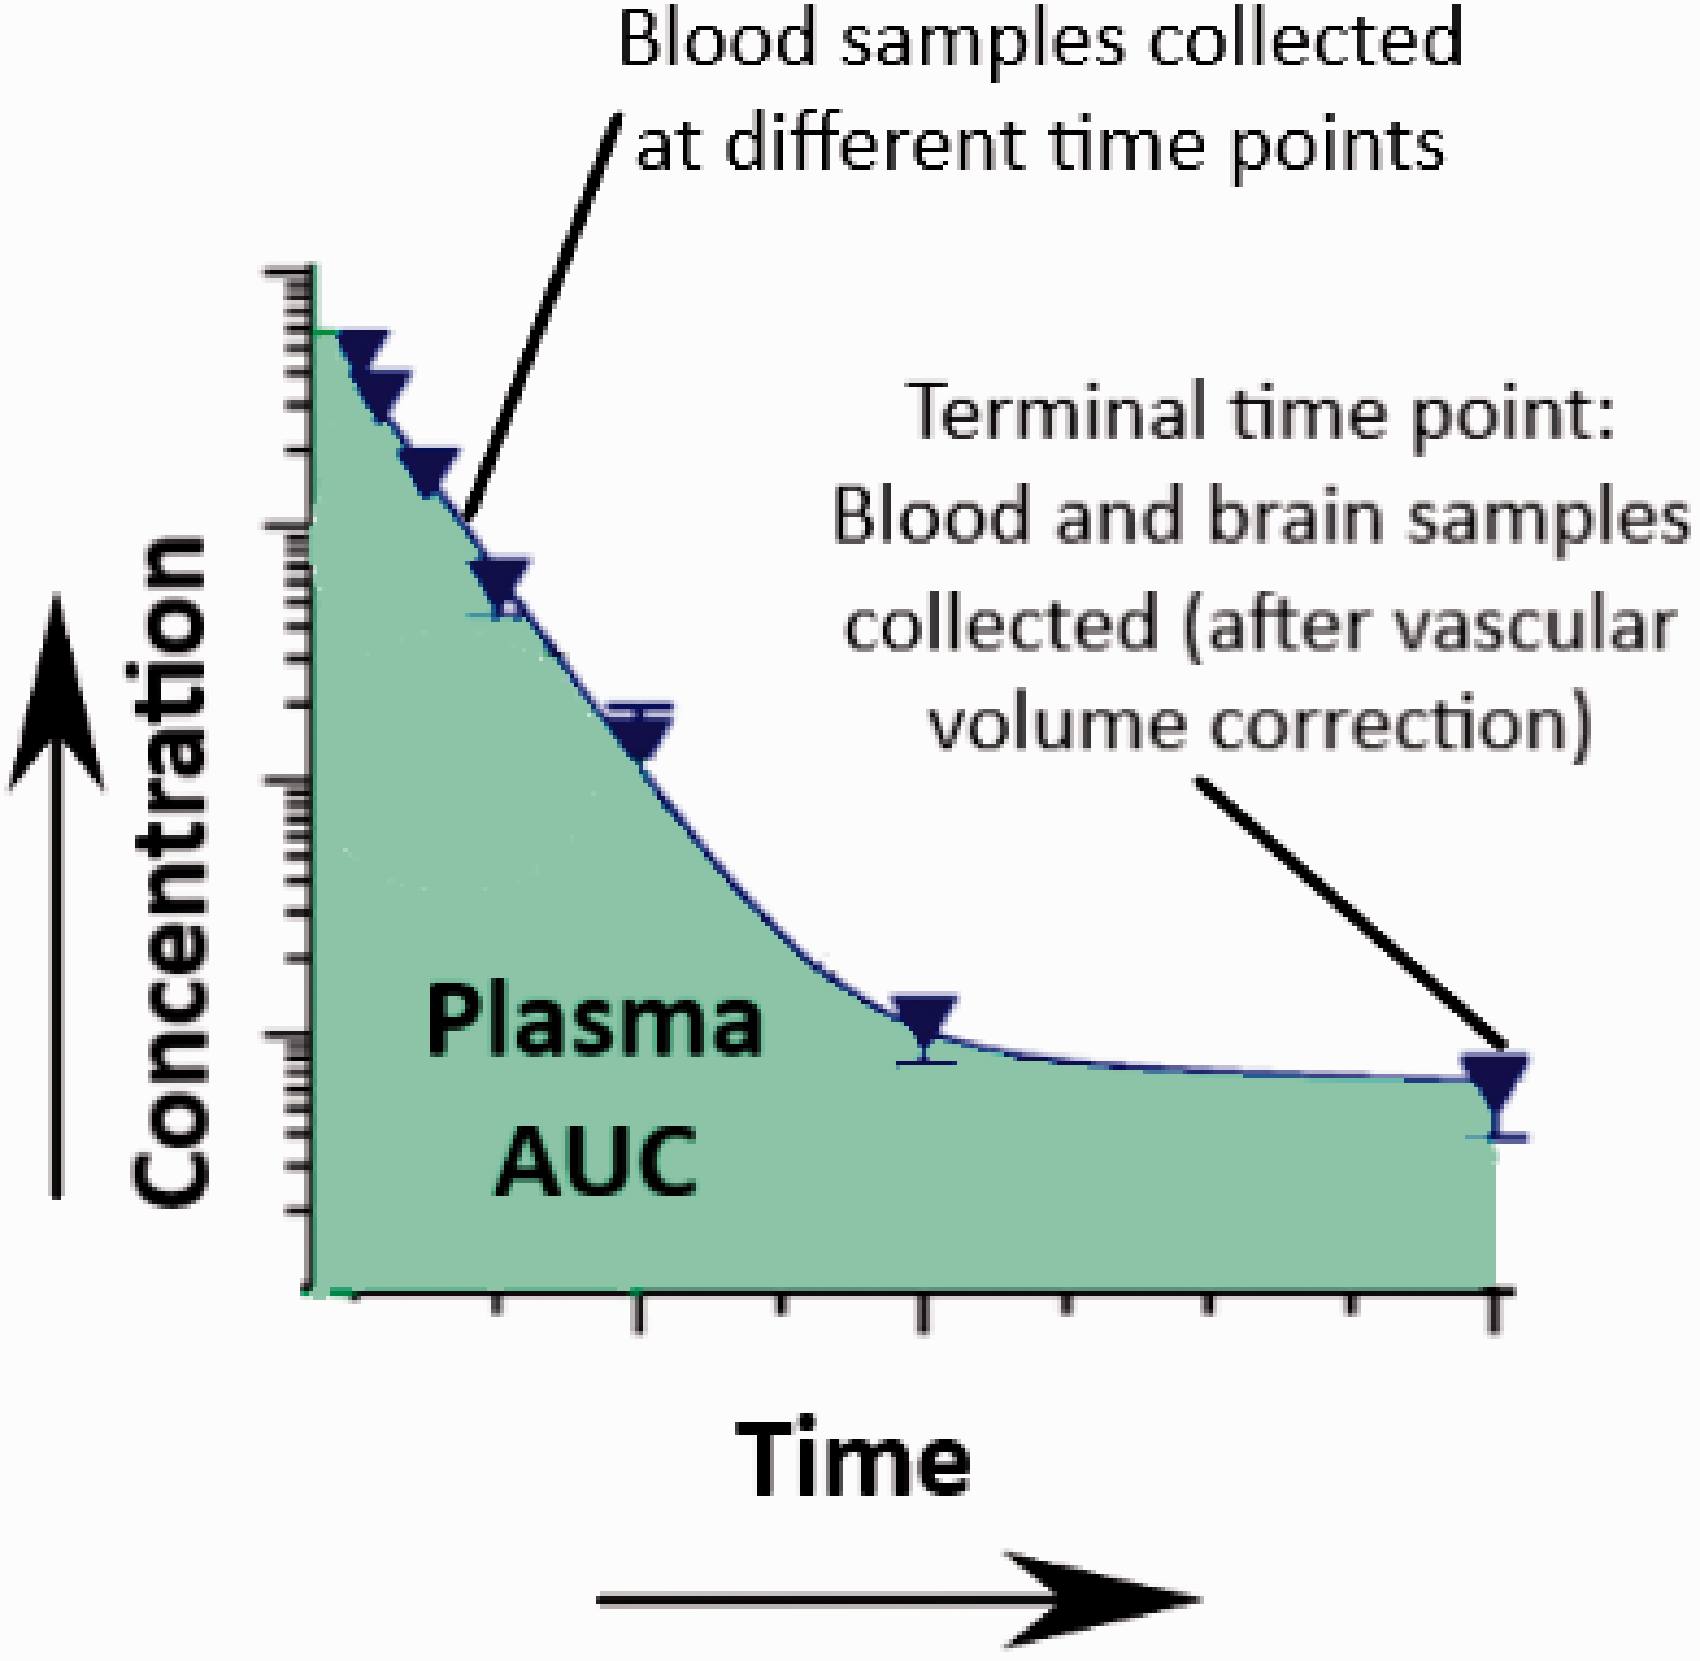
An illustration of the single time points analysis technique.
Where,
Kin = unidirectional influx constant from plasma to brain (uL.min−1.gm−1)
Alternatively, if transcardial perfusion is not desired, a vascular marker-based approach can be used to experimentally determine the intravascular volume. A vascular marker should be a compound that has a very low brain uptake. Typically, molecules used as permeability markers can also be used as a vascular marker. Historically, radiolabeled tracers such as [3H]albumin, [3H]inulin, [14C] sucrose, and even [51Cr] labeled red blood cells have been used as vascular markers.34–38 Recently, a stable labeled [13C] isotope of Sucrose has also been utilized as a vascular marker. 39
The corrected brain concentration of the analyte can then be calculated using the following equations:
39
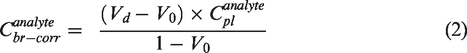


It is important to note that the Vd and Vo represent the volume of distribution of the analytes within the plasma component distributed within the brain tissue. These values do not represent the volume of distribution of the analyte within the whole brain. Therefore, multiplying the volume with the plasma concentrations provides us with the dose of the molecule reaching the brain from blood per gram of brain tissue in %ID/gm.
Similarly, Kin can then be calculated using the following equation:

Renkin & Crone proposed an equation for capillary transport which provides a relationship between the PS product (the product of permeability (P) and surface area (S)) and Kin40,41

Equation (6) has the following boundary conditions:
Kin = PS (with error ≤ 10%) for compounds having low brain uptake clearance values relative to blood flow, F (PS ≤ 0.2F). In the case of compounds having high brain uptake clearance, where values of Kin get closer to the cerebral blood flow, (F) where (PS ≫ 0.2F), the uptake is flow-limited and simultaneous measurement of blood flow is required using flow markers such as diazepam or butanol.
Multiple time point analysis using Patlak plot
Patlak and colleagues proposed a simple equation for determining Kin for brain samples taken at different time points.42,43 In brief, linear regression is performed on an X-Y scatter plot, where
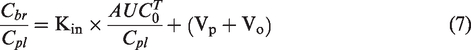
An illustration of the Patlak plot.
The slope of the linear regression is the Kin for the molecule being studied and the intercept is (Vp + Vo), where Vo is the value of the intravascular volume, and Vp represents a fast compartment within the vasculature that may get equilibrated rapidly. To date, the value for Vp has not been experimentally determined which might be difficult since most probably the values are very small. Theoretically, a vascular marker is not necessary, since the equation allows measurements for vascular space. Additionally, like single time point analysis, the equation assumes that unidirectional uptake is taking place throughout the study. If there is any efflux taking place, the results would be underestimating actual values for brain uptake clearance of the molecule being studied.
Brain uptake index (BUI)
The brain uptake index is a very simple and easy procedure to measure the uptake of compounds on to the brain in a single pass. Developed by Oldendorf,
44
this simple yet versatile method requires rapid bolus injection of radiolabeled test and reference substances through the carotid artery. 2 reference substances are injected, one which is highly permeable and the other which is not permeable for correcting the vascular component. Then the brain is collected after decapitation within 5–15 seconds. The BUI can then be calculated from the below equation:

In situ brain perfusion technique
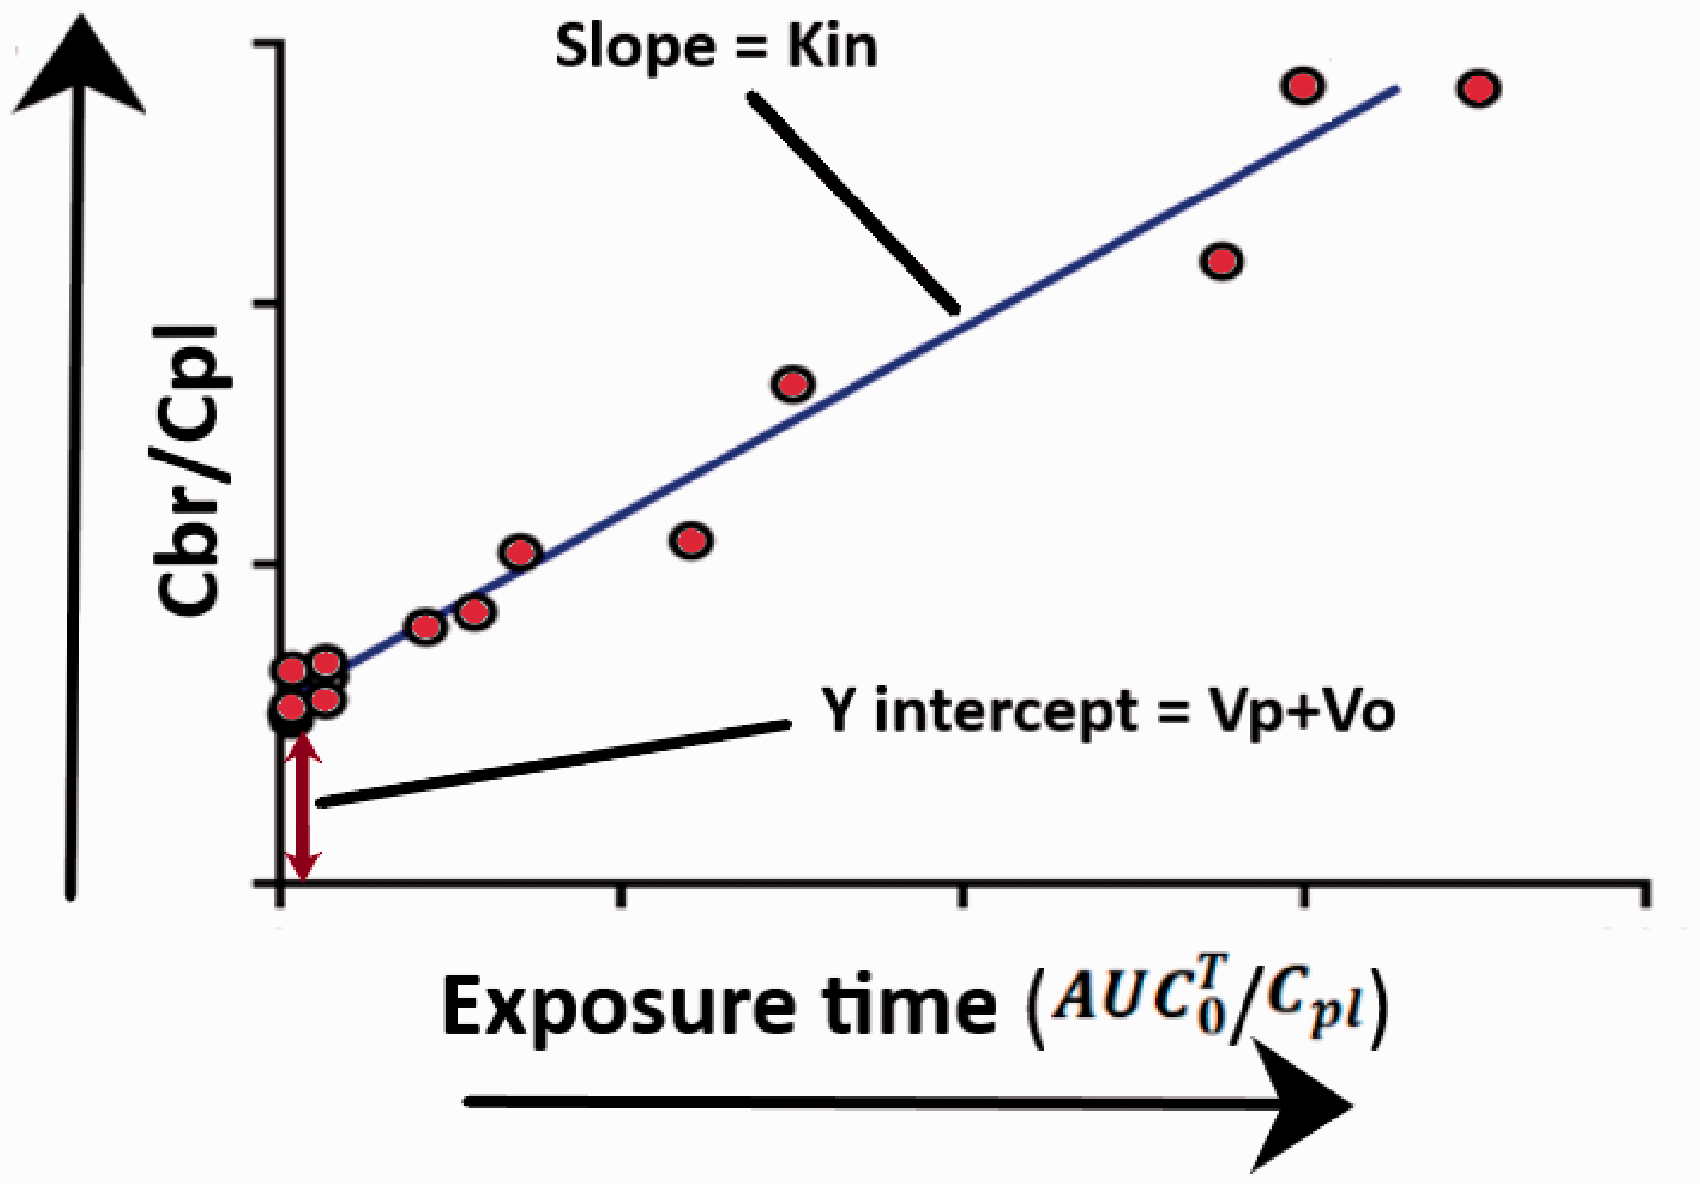
The brain perfusion method was developed to overcome the disadvantages associated with the BUI technique. 45 Takasato et al. used a catheter at the external carotid artery for perfusing the buffer containing the drug. To ensure that the perfusate does not mix with the endogenous blood, the superior thyroid artery, common carotid artery as well as the pterygopalatine artery were blocked with ligatures or cauterized. The ventricles were also severed before starting the perfusion. An illustration of the technique has been demonstrated in Figure 5. By manipulating the composition of the perfusate (i.e. (including washed erythrocytes), the perfusion time could be maintained up to 1 hour. The technique allows for the quantitative measurements of solutes that are within the range of Psucrose ≤ P ≤ Piodoantipyrine. [14C] Sucrose or [3H] Inulin can be used as the vascular marker for this procedure.
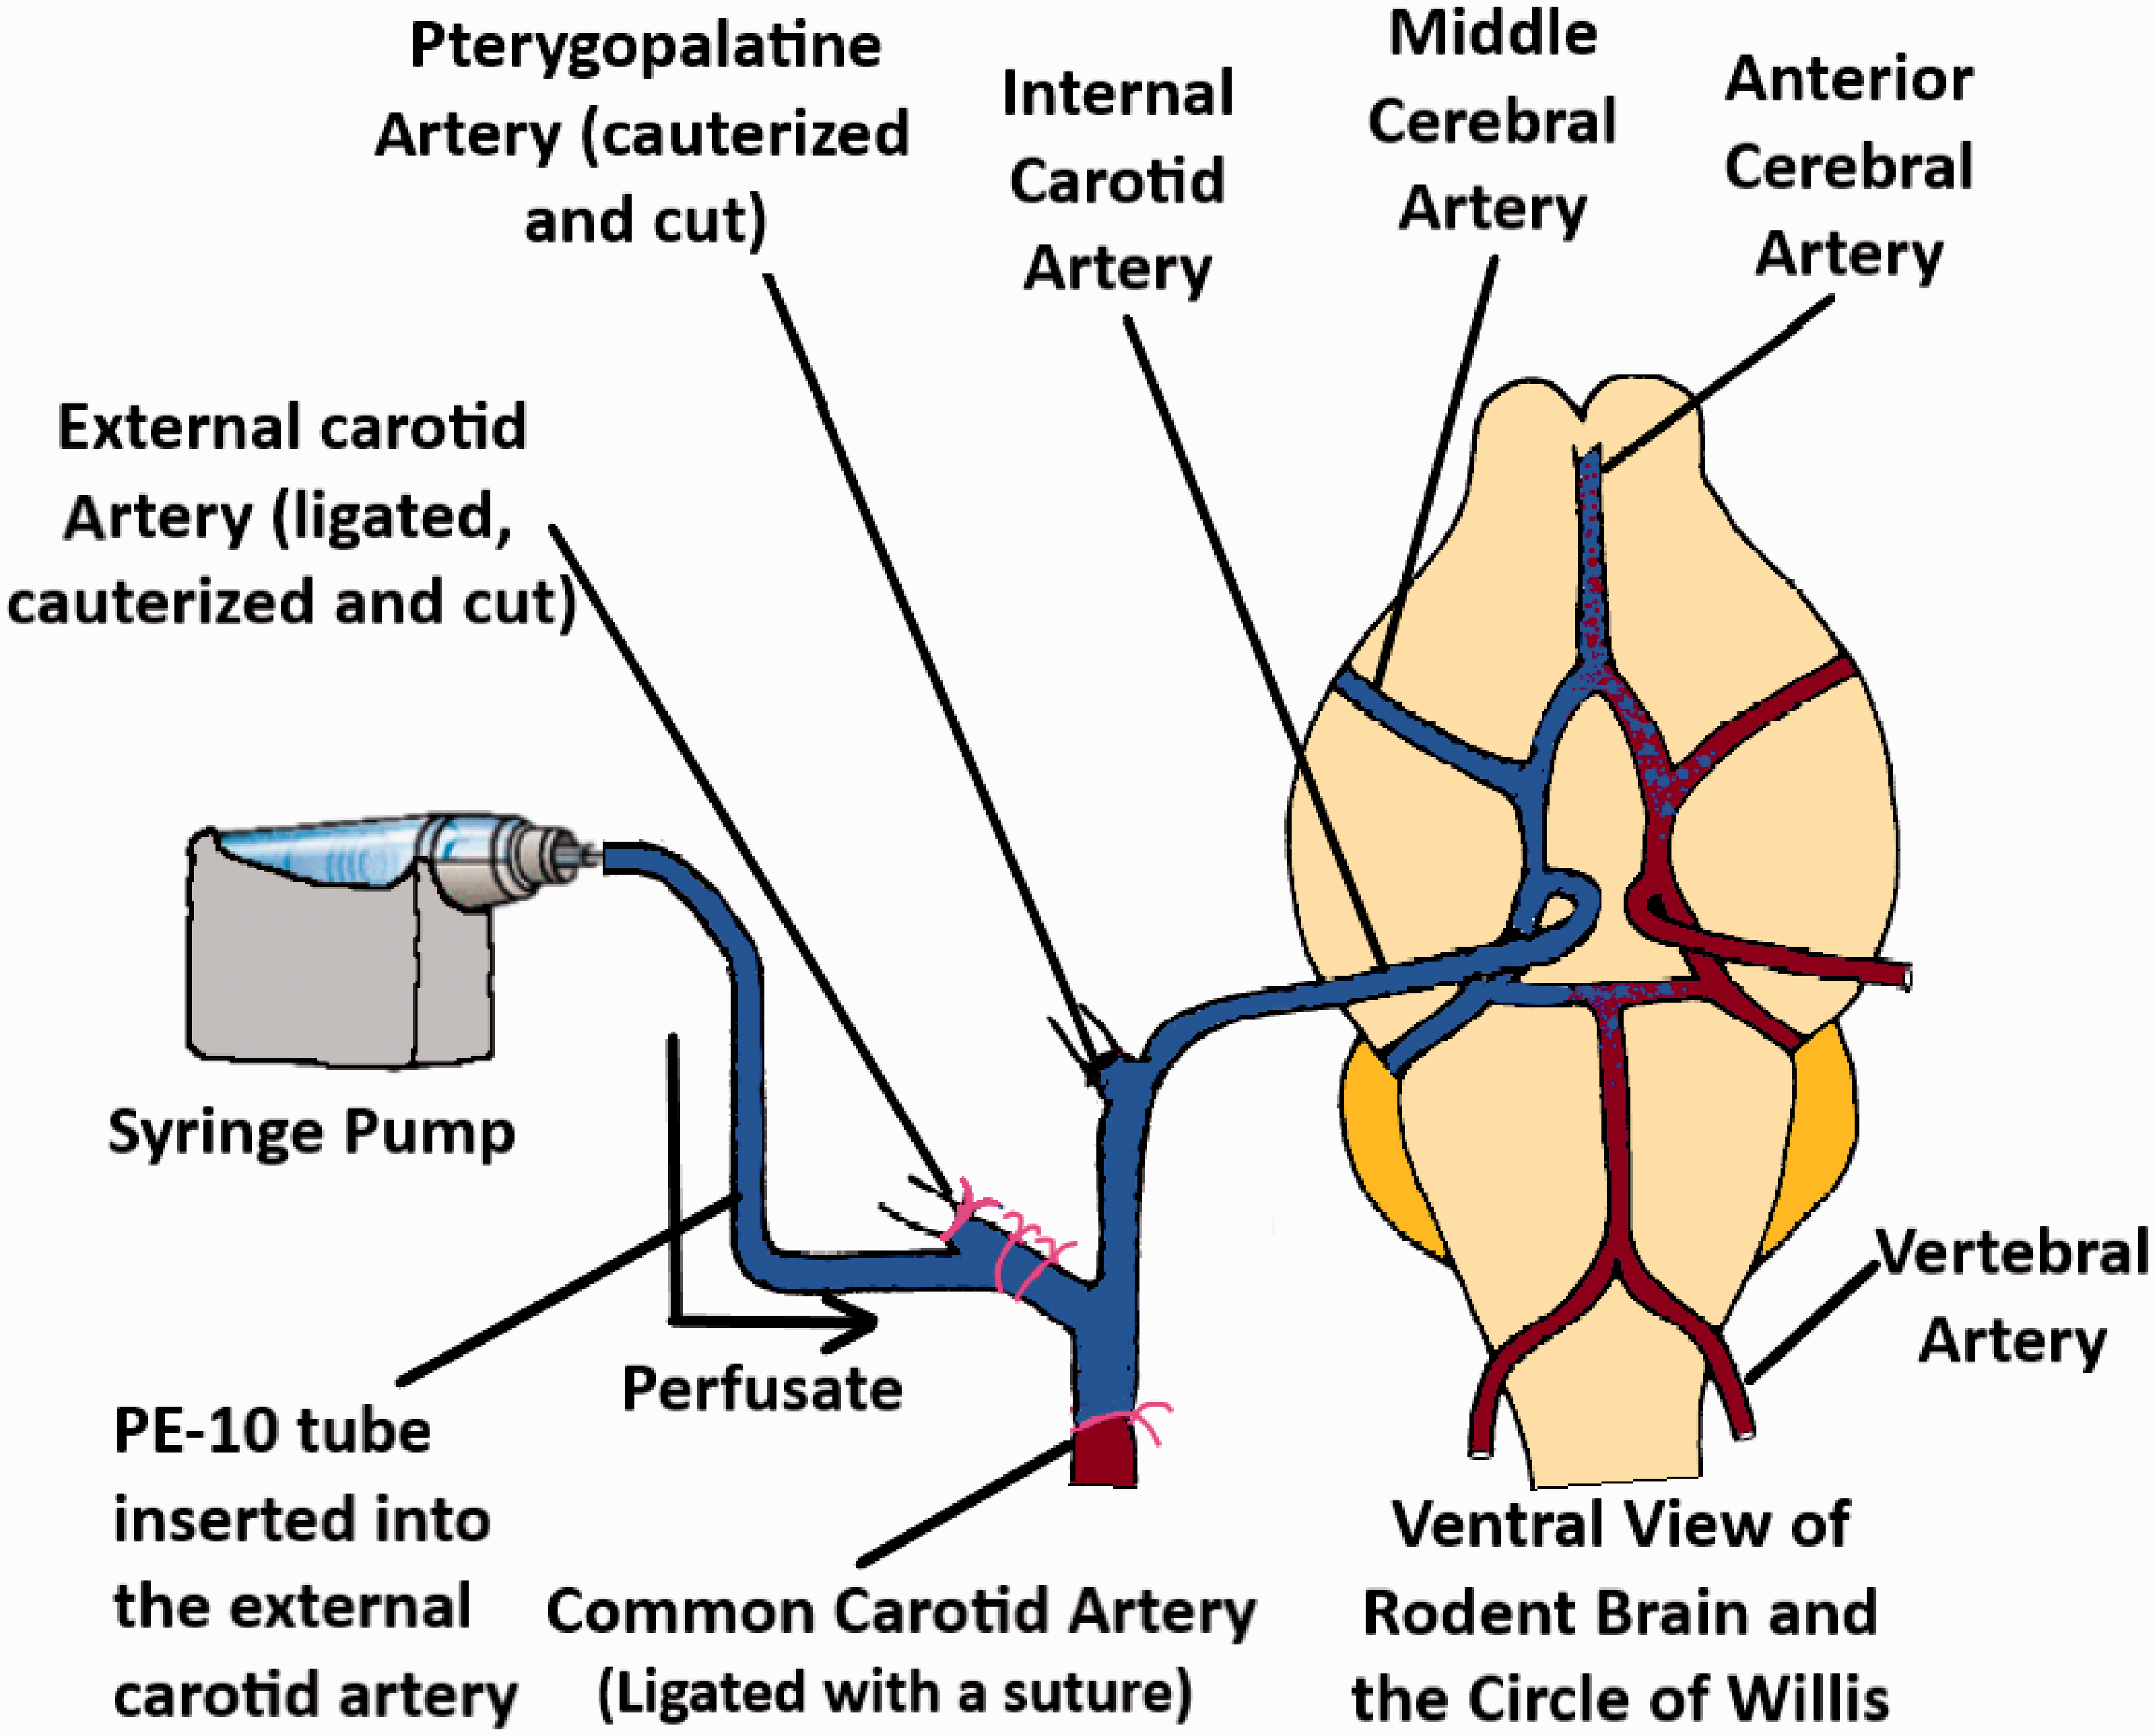
An illustration of the brain perfusion technique (adapted from Takasato et al. 45 ).
Separate brain hemispheres in rats are supplied by separate carotid arteries and the blood circulation across the two hemispheres are connected via the Circle of Willis. Hence, the perfusion through a single carotid artery would mean that only the ipsilateral hemisphere would be well perfused, while the contralateral hemisphere would have interfering blood circulation. This drawback was addressed by using bilateral perfusion, where catheters are placed on both arteries and perfused. 46 Since both hemispheres are perfused and systemic circulation is completely absent in the perfused tissue, the technique can be used to measure the whole brain uptake of different radiolabeled solutes into brain tissue as well as their diffusion into the CSF.47,48 The technique has also been widely used to study how different molecules may affect the function as well as the expression of different transporters present in the brain endothelium.48–52
Brain microdialysis
Compared to brain uptake measurements of compounds using brain homogenates, (which measures both extracellular and intracellular concentrations without any region-specific specificity), intracerebral microdialysis enables the measurements of unbound drug concentrations in specific areas of the brain, making it a very advantageous technique.
The method allows real-time sampling from the brain tissue of animals in awake conditions. A typical microdialysis setup has been depicted in Figure 6. In brief, intracerebral microdialysis involves the insertion of a dialysis probe into a specific area of the brain using a stereotaxic apparatus after drilling a small hole through the skull. The specific coordinates for doing so can be found from the mouse brain atlas. There are subtle differences in this initial procedure across different research groups, i.e. in some cases, a cannula along with a dummy probe is inserted first, while in others the actual probe is directly inserted. Microdialysis probes are commercially available or can be prepared in the lab using specific membranes, tubing, cannula, and glue.53–55 Afterward, a syringe pump/peristaltic pump is used to inject artificial CSF through the inlet tubing into the probe, while the solute from the specific region of the brain diffuses through the semipermeable membrane of the probe, and the dialysate is collected through the outlet tubing. Different molecules have different % recovery values through the probe, which needs to be tested first in vitro to assess the minimal dose that can be detected in vivo. To account for the probe to probe recovery variability, retrodialysis techniques have also been developed to assess in-vivo recovery.56,57 Microdialysis probes have membranes with 6–20 kDa molecular weight cutoff for small molecules and these cutoff sizes also determine the % recovery of analytes from sampling sites. Recently, probes having membranes with much bigger molecular weight cutoffs (500 kDa–2 MDa) have become commercially available for sampling antibodies from different brain regions.58–60
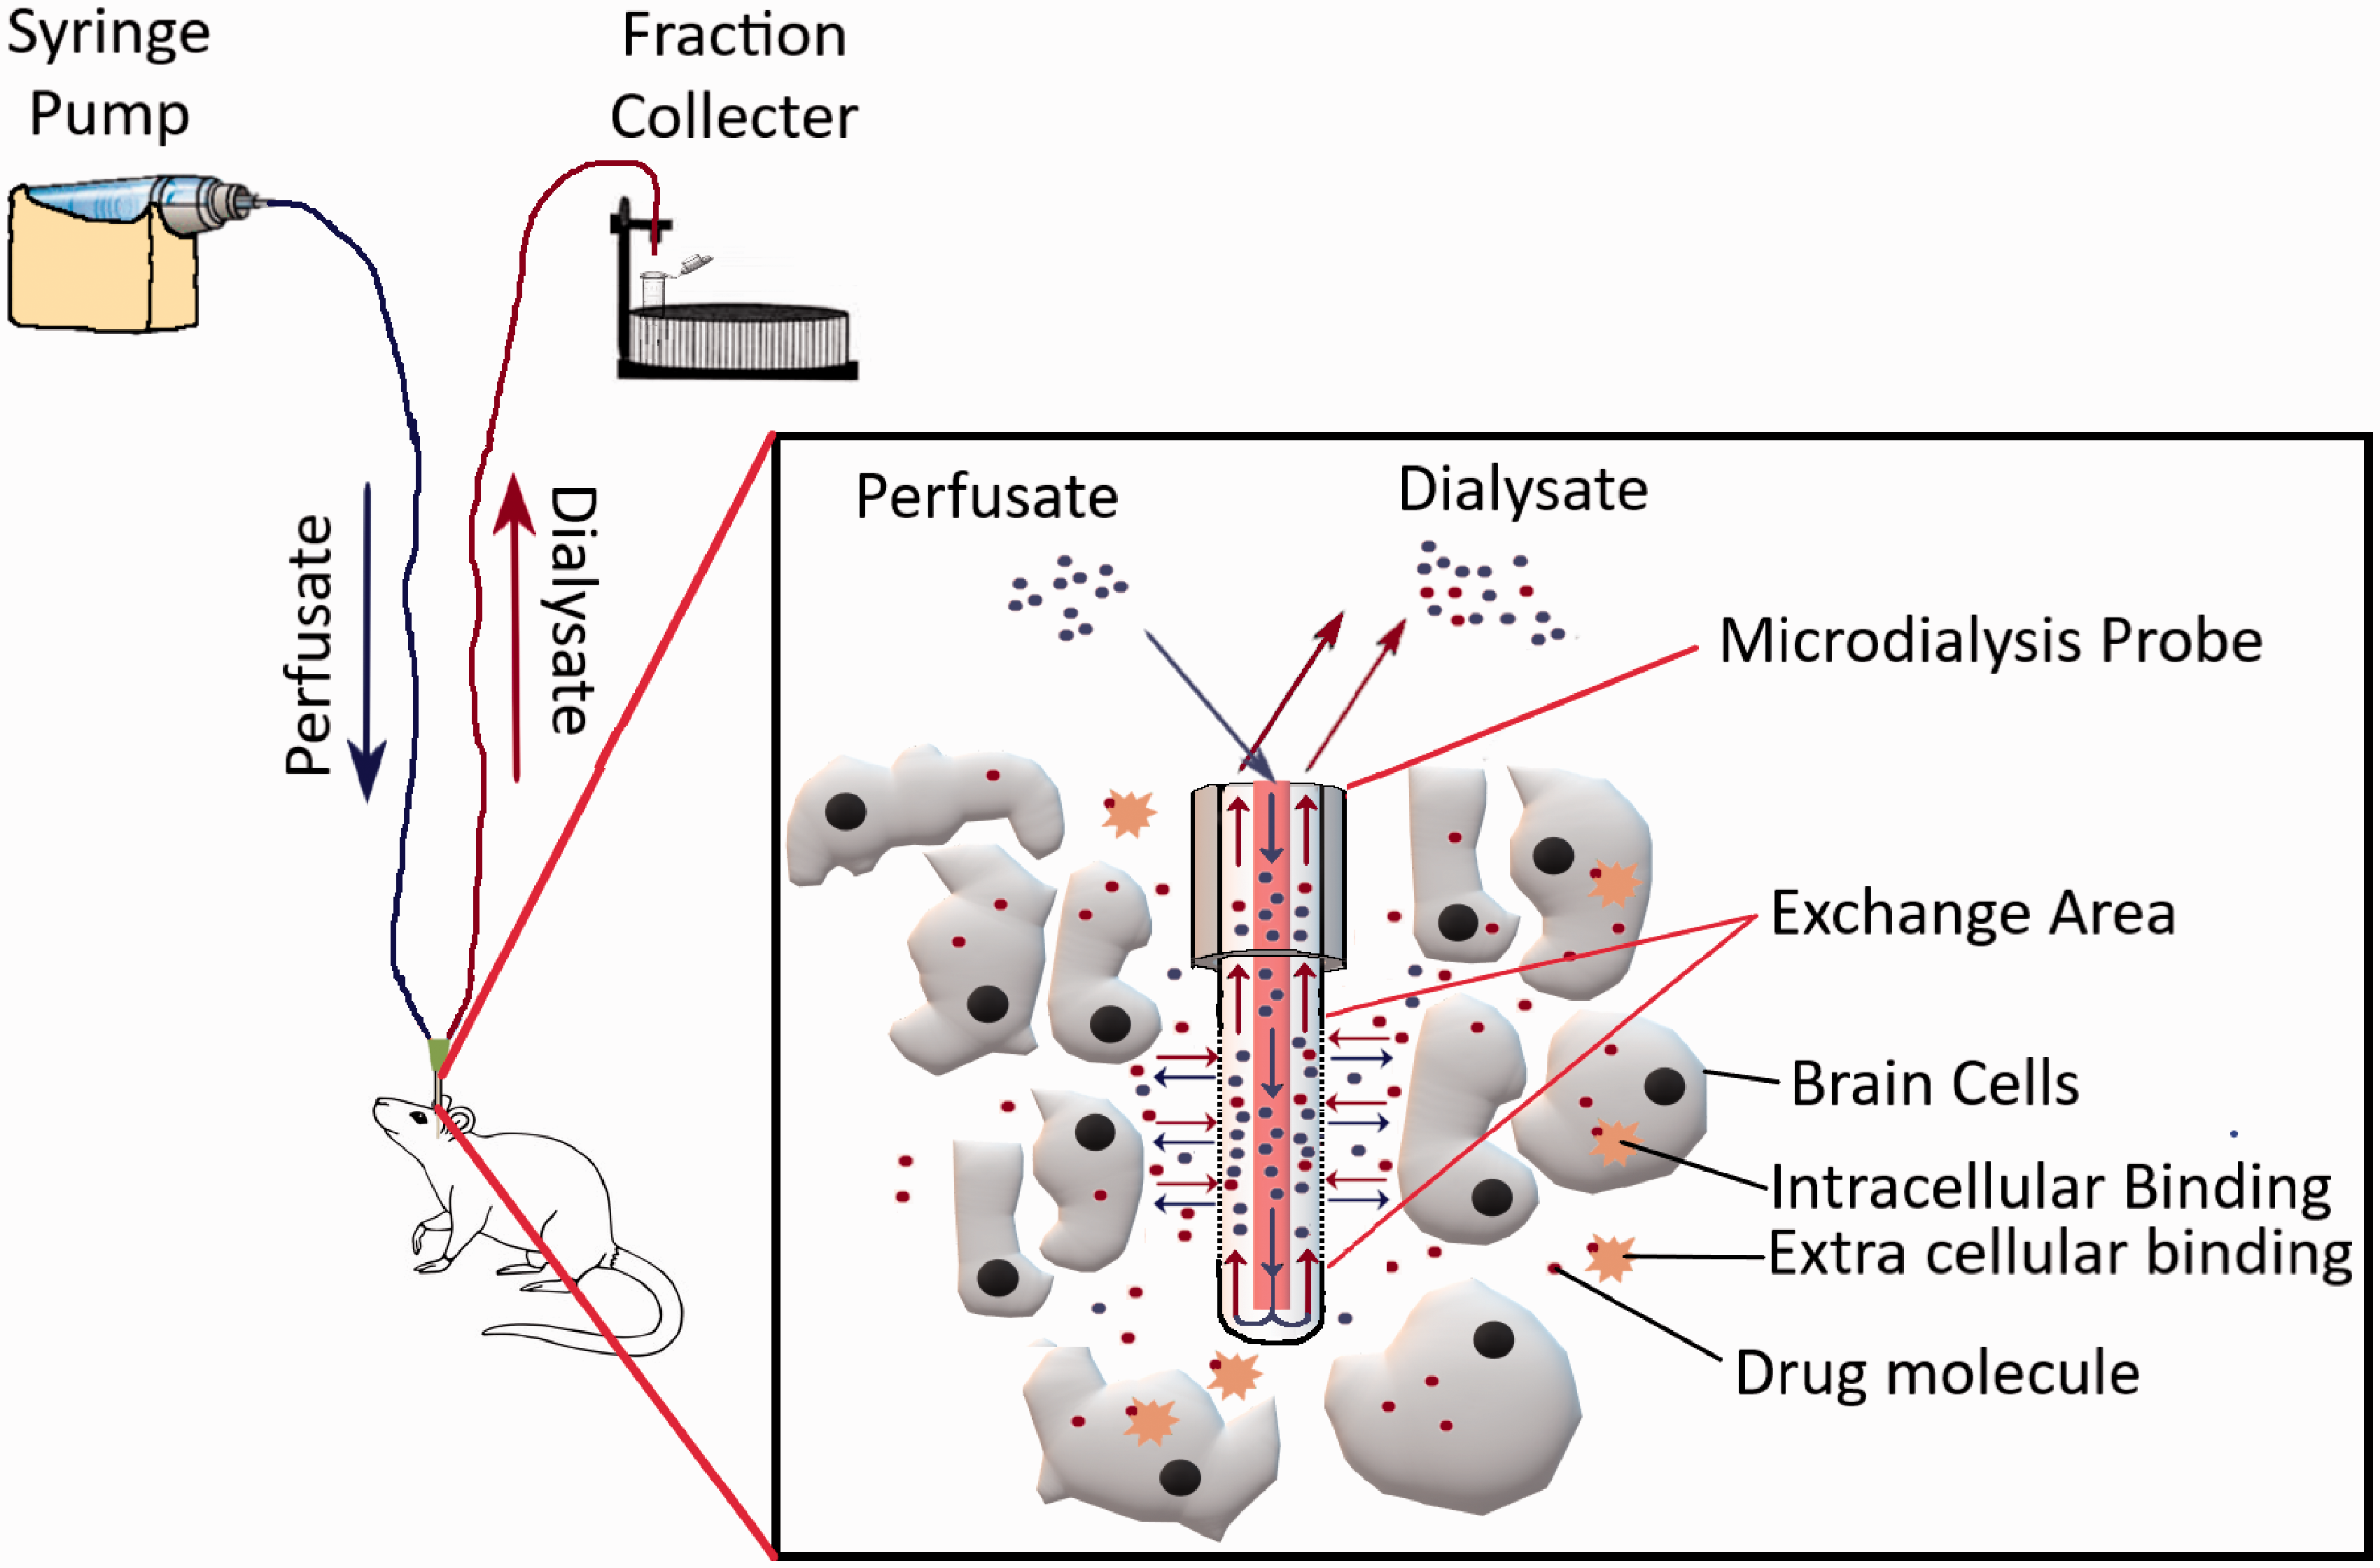
Illustration of a typical microdialysis apparatus for sampling small-molecule drugs from the brain parenchyma.
Brain Microdialysis can be considered the only technique that allows direct measurements of brain concentrations in humans. The technique has also been used clinically in traumatic brain injury patients as well as patients undergoing glioblastoma surgery. It also must be kept in mind that microdialysis is a labor-intensive and time-consuming process. One of the major problems with this procedure is that the initial cannula/probe implantation process may cause tissue injury which may lead to inflammation and changes in energy metabolism.61,62 Significant inflammatory changes in the region of implantation have been observed for up to 24 hours, after which it reverts to normal levels. Therefore, it would be prudent to perform any brain uptake measurements 24 hours after the probe/cannula implantation. Unfortunately, the brain uptake of highly lipophilic molecules cannot be deduced appropriately using this technique.
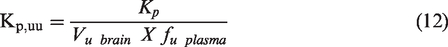
Brain uptake measurements using partition coefficients at steady state conditions
At steady-state concentrations, drug concentrations should be in equilibrium across all tissues. It is typically achieved through an intravenous bolus dose followed by an infusion. The blood to brain partition co-efficient Kp can be calculated as described in equation (9):
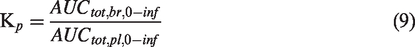
As can be understood from the equation, Kp considers total drug concentrations and does not take into account how much of the drug is binding to plasma proteins or brain tissue or any transporter-mediated flux across the BBB. This can be problematic since only the unbound fraction acts as the driving force for blood to brain uptake and can inadvertently produce inaccurate and misleading results. 63
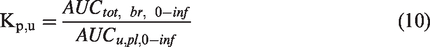
This phenomenon has been very nicely studied by Gupta et al. 64 where differences between Kp, Kp,u, and Kp,uu were compared for S and R enantiomers of cetirizine in guinea pigs. The study found significant differences in brain uptake between the R and S enantiomers using Kp and Kpu technique, while no difference in uptake was observed when using Kp,uu. This highlights the importance of using unbound drug concentrations in brain uptake measurements. Since Kp,uu is calculated from unbound concentrations in both brain and plasma, it describes transport across the BBB more consistently and is the perfect means of understanding differences in transport due to stereoselectivity. 65
Kp,u calculated using equation (10):
Kp,uu is calculated using the following equation:
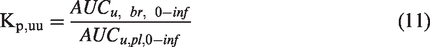
Equation (11) can be used if a microdialysis based procedure is used where both unbound brain and plasma concentrations can be readily measured. Alternatively, if a microdialysis based procedure is not used, Kpuu also can be calculated from the following equations:
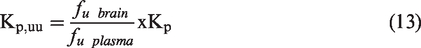
Kp,uu measurements allow understanding of whether or not molecules are subject to influx or efflux processes within the BBB. Typically, at steady-state concentrations the values for Kp,uu would be at unity. However, if the molecules are subjected to influx or efflux processes the values would be higher or lower than unity respectively.
Brain slice technique
The brain slice technique was initially developed by Kakee et al.
20
and then utilized by Friden et al.
68
after some modifications as a quick means for determining the volume of distribution of compounds ex-vivo in brain tissue. In brief, brains obtained from sacrificed animals were sliced into 300 uM coronal sections in the striatal areas. The slices were preincubated at 370C for 5 minutes in 10 ml ECF buffer in a vial. Then drug dissolved in ECF buffer was added to the vial. The buffer was constantly bubbled with 5% carbon dioxide in oxygen and at specific time points, the brain slices were removed from the solution, dried, weighed, and homogenized. Drug concentrations in the brain homogenate and ECF samples were then analyzed using a suitable analytical technique. Vu, the brain was then calculated using the equation below:
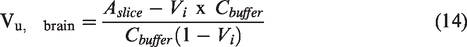
Where,
Vu, brain = Volume of distribution in the brain
Aslice = Amount of drug in brain slice
Cbuffer = Concentration of buffer in the ECF
Vi = Adherent water volume
Vi can be estimated using a specific vascular/extracellular space marker such as sucrose or inulin that does not get inside cells well or have any kind of tissue binding.
The volume of distribution predicted by this technique was found much more in line with the measurements obtained using the microdialysis technique compared to the brain homogenate technique.
Measurement of saturable uptake into the brain
Many compounds interact with influx and efflux transporters within the BBB. Since saturable uptake follows patterns like enzyme kinetics, a modified Michelis-Menten equation can be used to study transporter-based influx and efflux of compounds across the BBB using different analyte concentrations. The equation is as follows:
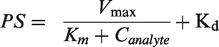
Km = analyte concentration at which half of the maximal transport takes place
Kd = non-saturable diffusion uptake clearance
PS = Permeability-surface area
The parameters Vmax and Km can be measured by regression analysis of an X-Y scatter plot of BBB PS products against different perfusate concentrations. This type of analysis has been extensively utilized to study carrier-mediated uptake of amino acids, glucose, and other metabolites.69,70
Quantitative autoradiography
This technique has been historically used for semiquantitative studies for drugs under development. The technique has a resolution within the micrometer range, allowing observation of differences in drug uptake in different regions of the brain. This is particularly important in studying drug effects on tumors and ischemia.71,72 Briefly, radiolabeled drugs are injected intravenously, and the brain uptake is then assessed by measuring the plasma profile and sectioning the brain tissue using a cryostat. The sectioned tissue is then exposed to X-ray films and analyzed with suitable software.
Positron emission tomography (PET)
Positron emission tomography (PET) is a powerful imaging technique used with radiolabeled analogs of drugs to quantify brain kinetics of drugs and their transfer across the BBB. 73 As a non-invasive technique PET imaging has been instrumental in understanding alterations in transporter function/expression in neurodegenerative disorders as well as understanding changes in the brain distribution of compounds in different disease conditions or the presence of transporter specific inhibitors.
Many CNS-targeting drugs, including antidepressants antipsychotics, and antiepileptic drugs are P-gp (ABCB1) substrates and are actively effluxed out of the brain.74–77 Changes in P-gp function/expression have also been associated with many neurodegenerative and psychiatric disorders.78–80 Therefore, it is necessary to measure the P-gp function quantitatively to increase understanding of how it may change the pharmacokinetics of different molecules. [11C] verapamil is the most studied radiotracer for this purpose and typically has low brain concentrations since it is extensively effluxed by P-gp.81,82
Tournier et al. 83 examined the possibility of improving the brain distribution of erlotinib after simultaneously inhibiting the ABCB1/ABCG2 transporters. The study used PET imaging to assess the brain distribution of [11C] erlotinib after a combined intravenous infusion of erlotinib and tariquidar in mice and rhesus macaques. A significant increase in brain exposure (AUCbrain) and VT of [11C] erlotinib were observed in the co-infusion group compared to animals receiving a single infusion of each drug. Interestingly, the increased VT of [11C] erlotinib in the wild-type animals receiving the co-infusion was equivalent to the knockout mice indicating the ABCB1/ABCG2 was completely inhibited. Therefore, as is evident from the above examples, PET-based imaging is an important non-invasive technique in understanding brain uptake of molecules.
Modeling and simulation approaches towards predicting drug concentrations in the CNS
With the current rate of failure in the development of drugs targeting the CNS, more and more emphasis is being given towards modeling and simulation techniques that would allow accurate predictions of target site drug concentrations within the CNS along with interspecies scaling. Although it is beyond the scope of this manuscript to discuss all the model equations, a brief overview is given below on how the modeling and simulation technique related to CNS drug discovery has been applied and evolved over the past few decades.
Although no model is perfect, the best model can be considered as the one that describes the pharmacokinetics of a compound using a minimal set of parameters to avoid unnecessary complexities. (we can add a figure from Peter Bonate’s book) Initial attempts at CNS modeling approaches began with compartmental modeling of drugs. In compartmental models, a separate compartment for the organ of interest is identified (which is usually sampled) such as the brain, CSF, plasma, and/or periphery.
The first example of compartmental modeling can be attributed to Ohno et al. 84 The authors utilized radiolabeled tracers of mannitol, sucrose, inulin, and glycerol to establish a correlation between the BBB permeability and octanol-water partition co-efficient for these molecules. Soon afterward, Rapoport et al. also utilized a similar approach with different permeability markers and drugs. 85 Collins et al. proposed the distributed model for simultaneous pharmacokinetic analysis of drugs in the blood, brain, and CSF utilizing parameters of hypothetical drugs. 86 Soon, with the advent of the microdialysis technique further expansion of the distributed model to differentiate between intracellular and extracellular compartments within the brain was feasible. Gabapentin pharmacokinetics was modeled in rats 87 using blood, ECF, and CSF concentrations to estimate influx and efflux clearances across the BBB as well as the BCSFB.88,89 Unfortunately, these compartments do not have any fixed physiological values but instead estimate parameters by fitting the model to data obtained from the in-vivo experiment. The limitations of these empirical models is that they are unable to predict interspecies variations in model parameters.90,91
Therefore, in recent years the concept of Physiologically based pharmacokinetic models (PBPK) has gained a lot of attention due to its ability to predict drug concentrations in specific tissues and translate the findings across different species and population subsets. 92 For a PBPK model to represent the CNS, it is important to keep all the structural components into consideration. For example, some of the structures that need to be considered include the brain intracellular component (ICF), the extracellular fluid (ECF), the cerebrospinal fluid (CSF), and the structures keeping the CNS microenvironment separate from the vasculature (the BBB and the BCSFB) as well as the flow of CSF through the different ventricles and the phenomenon of bulk flow. Along with these issue approximations of tissue bindings within these structural components would also be needed. It would also be prudent to consider CSF and ISF drug concentrations as separate entities. The drug permeation in these tissues can vary from drug to drug depending on the drugs’ inherent properties and interactions with receptors.93,94
Empirical PBPK models are almost similar in structure to compartmental PK models. The only exception between the 2 models is that the empirical model uses physiological values obtained from the literature. Most anatomical model parameters are fixed to their physiological values. Hence it provides an improved rationale for extrapolation between different species. Comparisons between physiological parameters within the CNS of humans, rats, mice, and dogs utilize literature reported data. Permeability across BBB and BSCFB are estimated from in-vivo data while considering the species differences in transporter-mediated uptake or efflux. The advantage of this approach is that the same model can be utilized across many different classes of drugs. It allows a more precise estimation of BBB, BCSFB permeability. Ooie et al. used this concept to characterize the efflux of 6 fluoroquinolones across the BBB in rats by fitting the distributed model containing fixed physiological parameters to total brain, CSF, and serum concentrations of the compounds being tested. 95 The total brain concentrations were then corrected to unbound ECF concentrations using values for brain unbound volume of distribution (Vubrain). Vu brain was calculated using microdialysis based measurements of brain ECF, the total concentrations in the brain homogenate at steady state, and then correcting for the amount of drug in the brain vasculature.
With improvements in software and computing power to code for full-body PBPK models, increasing influence in the pharmaceutical industry, as well as regulatory requirements (73–76), more complex models, are being developed for different groups of drugs. For example, Kielbasa et al. demonstrated the interspecies translation of BBB penetration to provide a prediction of unbound brain concentrations in humans using a model consisting of separate compartments for blood, brain ECF, brain intracellular space, and CSF. 96 The PBPK model was first used to estimate BBB and BCSFB permeability of CNS drugs atomoxetine and duloxetine using an approach similar to what was previously applied for atomoxetine. 97 The dataset contained in vivo unbound concentrations of brain ECF (measured by microdialysis), blood, and single time-point samples for CSF and brain homogenate at steady-state and allowed prediction of model parameters with a very good degree of precision.
The model parameters were then allometrically scaled to their corresponding human values based on simulated unbound brain concentration profiles of duloxetine and atomoxetine in humans. It has been acknowledged that this approach is not suitable for the high-throughput screening process in early drug development which involves thousands of compounds. However, this modeling approach nevertheless would provide a rationale to carry out human predictions for more promising CNS drug candidates before proceeding towards more expensive clinical trials on a larger group of patients.
One of the most structurally complex PBPK models for the CNS was developed by Westerhout et al. 98 The goal of the model was to investigate whether different CSF sampling sites produce comparable PK profiles in rats and whether the data from these locations can be scaled to humans. Along with blood samples, the Brain ISF was sampled from the striatum and the CSF from the lateral ventricles and/or cisterna magna using microdialysis probes. The proposed model contained separate compartments for blood, brain ECF, and four separate CSF compartments. A schematic illustration of the model is demonstrated in Figure 7. The four CSF compartments were organized in series using a transit compartment arrangement, where the drug passes through from brain ECF to the CSF in the lateral ventricle, the combination of 3rd and 4th ventricle, the cisterna magna, and the subarachnoid space.
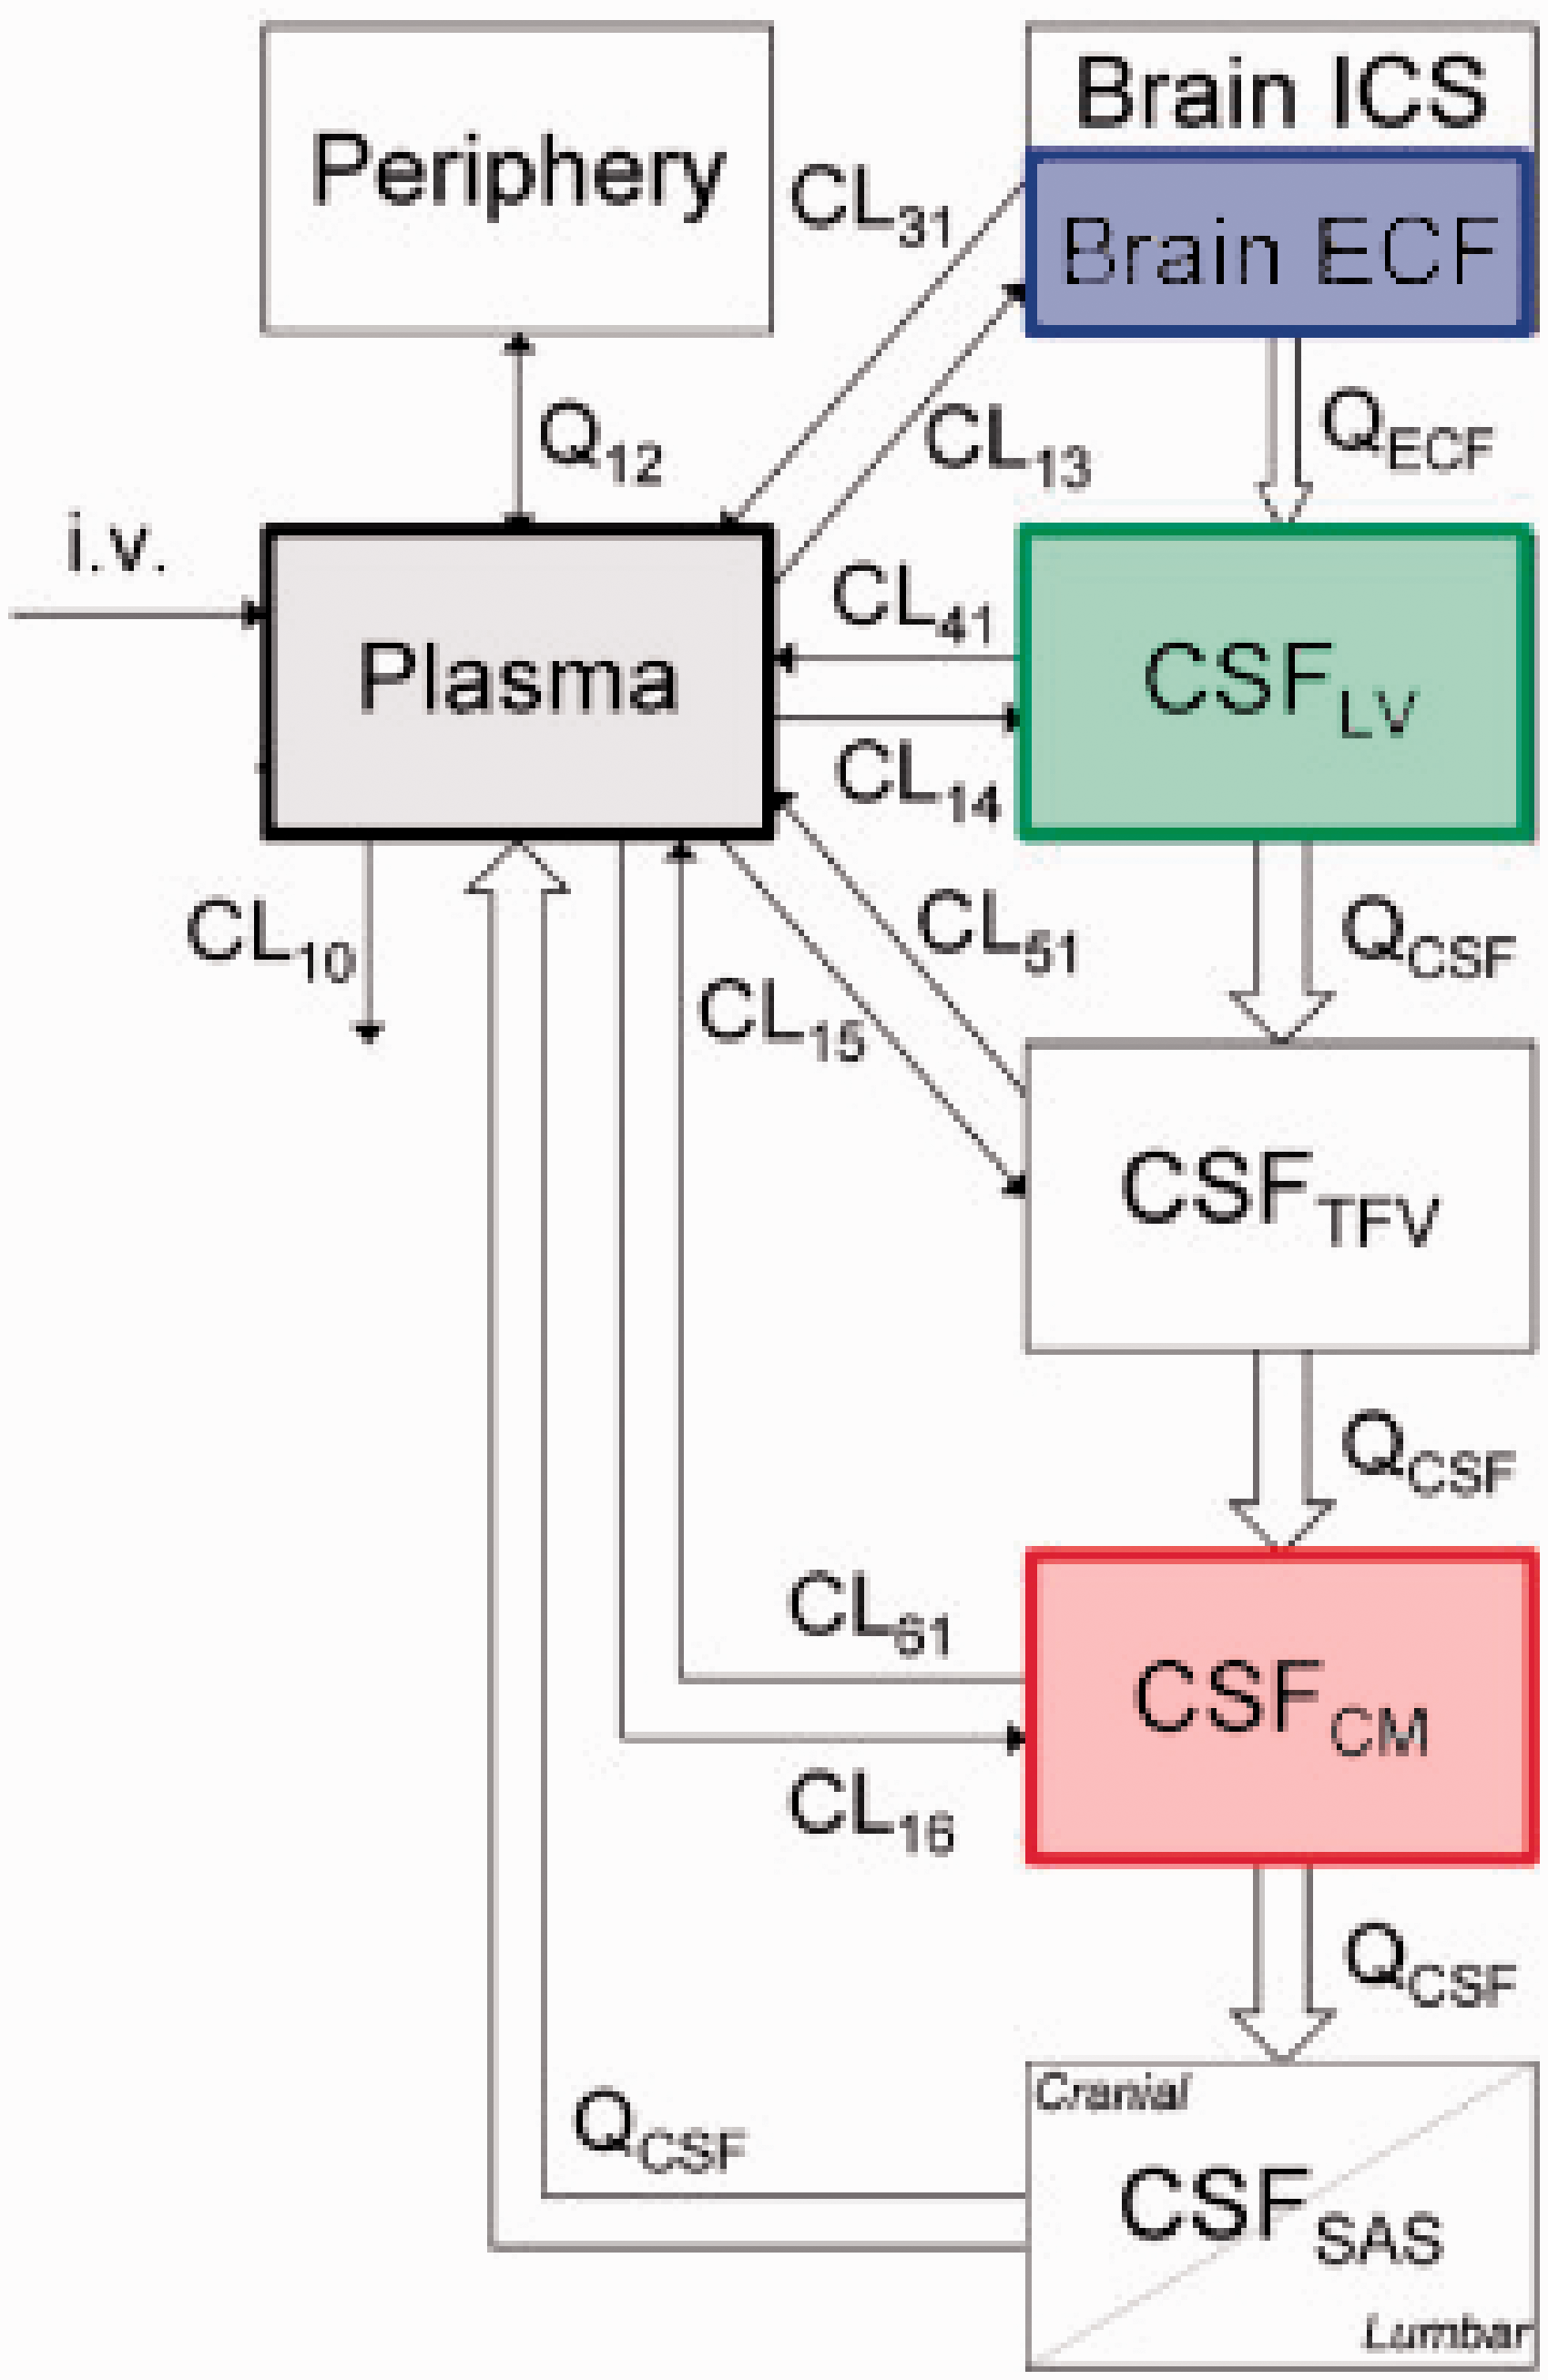
A schematic illustration of a translational brain PBPK model (adopted from de Lange 162 ).
A modified version of this model was then used to predict the brain distribution of 9 structurally diverse compounds. The model data was then successfully scaled to fit observed data from human patients. This showed that the technique was translatable from rats to humans. 99 Unfortunately, CSF samples can only be obtained from patients through a lumbar puncture and in a clinical setting. Direct sampling of brain tissue using the microdialysis based approach has only been utilized in critical cases (traumatic brain injury100,101 and glioblastoma patients102–104). Therefore, this model has been crucial in comparing CSF concentrations across species allowing a direct correlation between preclinical and clinical data.
With the ongoing debate about how to describe the process related to bulk flow adequately, it would be interesting to see how a PBPK model considering bulk flow evolves.23–25,105 Bulk flow-mediated efflux would have a negligible impact on highly permeable drugs. However, drugs having low permeability might be easily effluxed out of the brain, and hence without appropriate consideration, would result in the overestimations of brain concentrations. Therefore, how the drug molecules travel within the brain parenchyma and through the CSF is an important metric in the CNS PBPK model that would need to be perfected as our understanding of the process improves with further research. Possibly these important steps would help to reduce the high failure rates in CNS drug discovery programs.
Clinical techniques for measuring brain permeability
Magnetic resonance-based external detection methods such as dynamic contrast-enhanced magnetic resonance imaging (DCEMRI), and dynamic perfusion computerized tomography (PCT) are used in current clinical settings to detect BBB breakdown in humans. A contrasting agent i.e. gadolinium-DTPA (Gd-DTPA) which has low brain permeability is injected into the subject. Differences in brain permeability between control and diseased subjects are compared by checking pixel intensity changes for T1 and T2 weighted images a short time after injection.106–109 T1 and T2 weighting is defined by the timing of the radiofrequency pulse sequences, where T1 images highlight the fat tissues in the body while the T2 images highlight the fat and water in the body. The technique has been utilized to assess changes in brain permeability in multiple sclerosis, stroke, Alzheimer’s disease as well as brain tumors.106,109–111 The generated data is interpreted using the Patlak plot/graphical method as discussed earlier in the paper.42,43
The importance of appropriate brain vascular volumes corrections for getting accurate brain concentrations
It is essential to correct the drug content retained within the brain vasculature to ensure accurate quantitation of true brain uptake. There are 2 possible means by which brain vascular volumes can be corrected:
Transcardial perfusion Vascular marker-based corrections The transcardial perfusion method is performed by inserting a cannula through the left ventricle and pumping saline with heparin through the ascending aorta after severing the jugular veins to drain the blood out. This step ensures the entire vascular content is removed from the animal and does not require an additional vascular correction step. However, it is difficult to judge the completeness of vascular washout in an individual animal. Additionally, there are technical variations across research groups as to how these perfusions are performed. These include total volume, duration, flow rate, temperature, and composition of a perfusion fluid, which may add to experimental variability. The alternative method involves the inclusion of a vascular marker in the brain uptake experiments. This technique has been discussed in detail earlier in the manuscript. In many cases, radiolabeled vascular markers such as [14C] sucrose, [3H] inulin, [3H] albumin, etc. have been used to assess the vascular volume in a separate set of experiments and then an average vascular volume has been applied to all animals to get an estimate of brain uptake. The average vascular correction values typically range from 8–10 uL/gm across different studies. However, there are multiple problems with this approach and are usually overlooked until researchers start getting negative brain uptake values.
67
Friden et al.
68
proposed a comprehensive model that attempts to correct these issues by accounting for the apparent vascular spaces in the brain such as plasma water, plasma proteins, and the volume of erythrocytes. However, one of the problems still left to be addressed is the between-subject variability in vascular volumes observed after performing cervical dislocation in animals. Usually, there is variability in the blood content on the brain samples due to differences in pressure changes in the vasculature after this procedure is performed, necessitating the tissue to be properly wiped on a paper towel. This variability probably would not be a problem for most compounds that have a very high permeability. However, for compounds that have a low BBB permeability or associated with neurotoxicity, it is very important to get accurate estimates of brain concentrations.
The best way to mitigate this problem would be to simultaneously use a vascular marker along with the compounds being studied. Atenolol has been used previously as a permeability/vascular marker,112,113 however, a study by Chen et al.114 showed that the molecule is effluxed by the BBB. A recently developed LC-MS/MS-based analytical method for simultaneous measurements involves the use of stable labeled isotopes of sucrose which are used to measure brain permeability while simultaneously correcting for the brain vascular volume. 39 The results were found comparable to the transcardial perfusion technique. The technique can also be easily utilized for measuring brain uptake of drug compounds along with the simultaneous determination of the brain vascular volume. To determine the vascular volume in each animal an intravenous bolus dose of sucrose needs to be injected 30 seconds before the terminal time point. For each of those time points, the brain and plasma samples would simply need to be analyzed for sucrose concentrations in the LC-MS/MS to ascertain the vascular volumes by using equations described earlier in the manuscript. This technique has been further updated recently to allow simultaneous measurements of brain permeability to sucrose as well as mannitol. 115
The importance of BBB permeability measurements in different neurological disorders
Over the years numerous compounds and macromolecules have been utilized as markers for elucidating BBB integrity. BBB dysfunction is an important feature of the pathological cascades associated with different neurological disorders such as Alzheimer’s disease,116,117 stroke,118,119 traumatic brain injury,120,121 multiple sclerosis,122,123 and even while anesthetized with volatile anesthetics.124–126 Disruption of the BBB results in the infiltration of serum components and immune cells into the CNS parenchyma leading to the loss of CNS homeostasis, ultimately damaging the surrounding tissue. Even though BBB leakage is observed in most conditions, the degree of leakage has been found to vary from widespread leakage to localized small leaks in different brain regions. There are also cases where the leakage is size-specific. 127 For example, in traumatic brain injury, it was observed that the damaged BBB is permeable to both large and small molecules up to the first 4–5 hours after the injury. Afterward, for about 4 days, the BBB remains compromised but only permeable to small molecules. 128
Therefore, understanding the degree and extent of BBB opening is crucial in understanding disease progression (including secondary brain injury) as well as determining therapeutic outcomes. Understandably, these markers should have a set of ideal properties that would ensure accurate brain permeability. Ideally, these compounds should be non-toxic, metabolically stable in the circulation, should not be a substrate of any of the efflux and/or influx transporters present on the BBB endothelium, have no substantial plasma or tissue protein binding, and should not affect the integrity of the BBB by themselves. A list of BBB permeability markers and their characteristics have been summarized in Table 1.
A list of commonly used BBB permeability markers along with a summary of their attributes.

As shown in the table, the markers currently in use have all some form of disadvantage. Based on a recent review by Saunders et al., 129 two of the most widely used BBB permeability markers are Evans Blue and Sodium fluorescein. The main reason behind their widespread use is they are fluorescent and can be easily measured in a plate reader or viewed through a microscope.
Evans Blue is highly bound to albumin and unbound fractions are known to cross the BBB. It does not have a linear fluorescent response so plate reader-based measurements would not be accurate. Besides, since it is highly albumin-bound, the BBB integrity assessments would be that of a large molecule rather than a small molecule.129,130 So, assumptions based on a large molecule-based marker may not be enough to assess whether the treatment has been appropriate in restoring brain function, since the BBB may still be compromised and permeable to small molecules.
Sodium fluorescein is a very interesting molecule. It has a multiparameter optimization (MPO) score that is close to Naproxen. 131 However, it has low log P values and very low BBB permeability, which is why it is utilized as a BBB permeability marker. 132 It can exist in 6 different ionic states depending on the pH it is exposed to and is approximately 50% bound to plasma proteins. Studies using MRP inhibitor probenecid, MRP transfected cell lines, and MRP knockout mice have shown that fluorescein is a substrate of MRP transporters in the brain. Since MRP is present in both the BBB as well as the BCSFB it may play a critical role in the CNS distribution of the molecule.133,134 Different studies have also shown fluorescein to be an organic anion transporting polypeptides (OATP) substrate.135–137 OATPs are members of the solute-linked carrier superfamily and are ubiquitary expressed in many different epithelial membranes throughout the body. Genetic polymorphisms result in the variable expression of these transporters across the population. The expression was also seen to vary across males and females, hence there would difference in plasma kinetics that would need to be considered since the free fraction of fluorescein in plasma would act as the driving force for brain uptake. Sodium fluorescein is also metabolized in the liver to fluorescein glucuronide. Both the metabolite and the unmetabolized compound which have different degrees of fluorescence are cleared by the kidney. 138 Different disease conditions are known to change transporter expression levels 139 and so would need to be considered when using Sodium fluorescein as a passive marker in such situations. Therefore, it is understandable that both Evans blue and sodium fluorescein have numerous disadvantages in their use as passive permeability markers. Simply measuring in vivo brain samples on a plate reader would not yield acceptable data to properly assess the brain permeability.
Unfortunately, nowadays experiments related to measuring BBB permeability have moved on towards convenience over the quality of the data generated. Many manuscripts are found to drawing conclusions based on imaging studies rather than pharmacokinetic measurements to understand permeability. It is important to conduct both kinds of experiments to reach a meaningful conclusion.
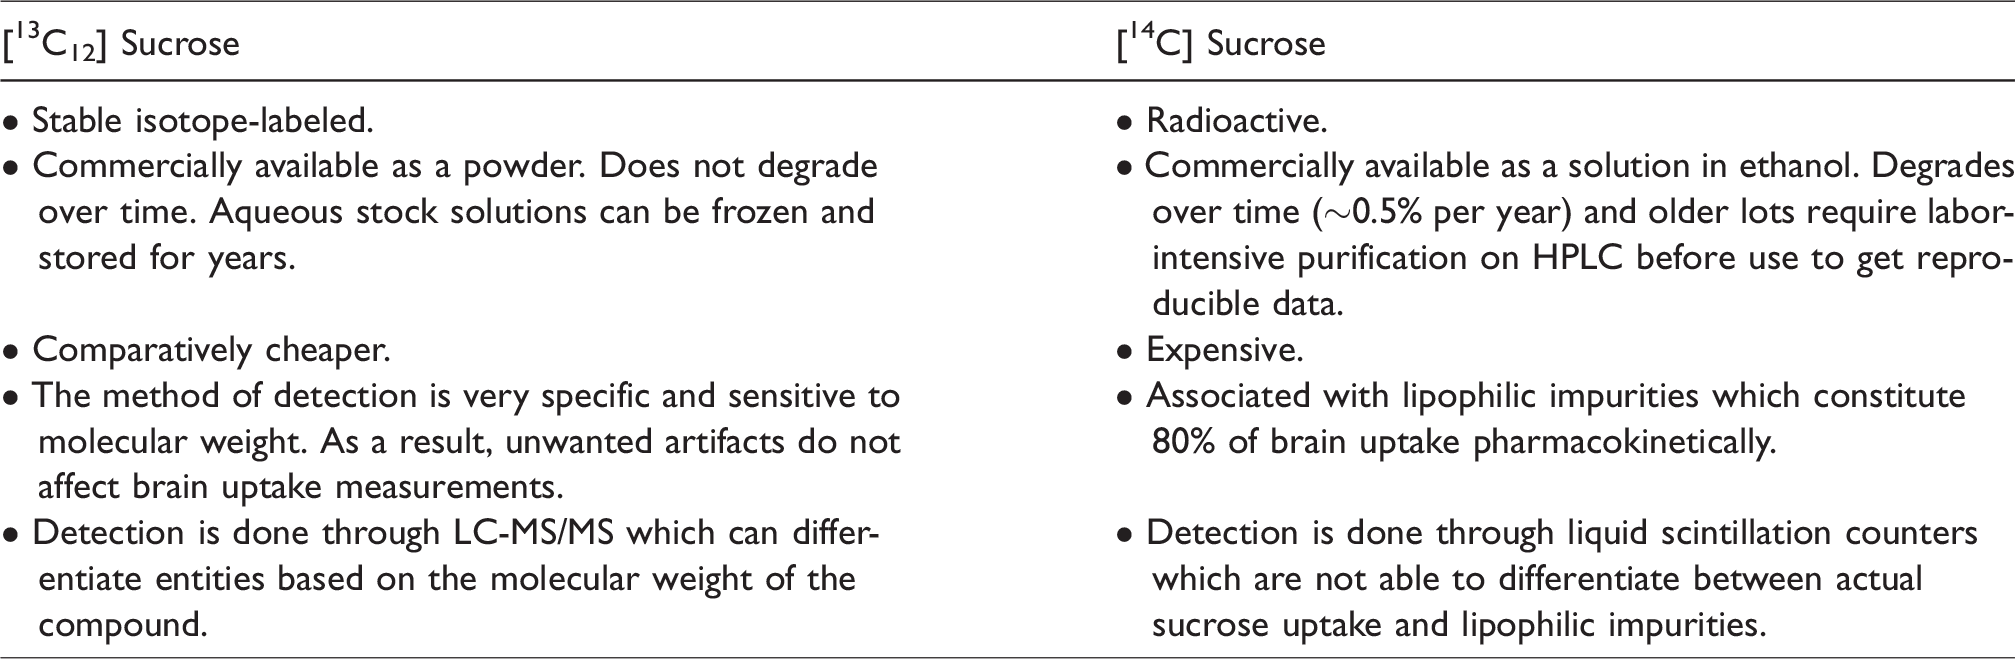
Amongst all the markers, the disaccharide sucrose comes closest to be an ideal marker based on its properties. It is not metabolized or bound to proteins after systemic administration. There is no evidence of sucrose being a substrate of any of the active or facilitative transporters at the mammalian BBB endothelium either. Therefore, for the past few decades the labeled radiotracers of [14C] Sucrose have been used to assess BBB integrity. Recent studies have shown that brain uptake measurements of [14C] Sucrose are error-prone due to the presence of low quantities of lipophilic impurities which easily permeate the BBB. These impurities constitute approximately 80% of the total radioactivity in the brain after IV bolus injections. Based on these findings, an LC-MS/MS-based method was developed for measuring brain uptake of the stable labeled [13C12] isotope of Sucrose which would not present the same problems as [14C] Sucrose and can very accurately quantify BBB permeability.39,55 The differences between [14C] sucrose and [13C12] sucrose have been highlighted in Table 2.
A comparison between the properties of stable labeled [13C12] Sucrose and radiolabeled [14C] Sucrose in measuring brain permeability.
Overcoming deficiencies of existing animal models by using in vitro brain-on-chip systems
Currently one of the troublesome areas related to neuroscience research and disease models is the inconsistencies across different studies as well as the translatability from animal models to humans for several neurological disorders. For example, close interactions of pericyte and brain endothelial cells are widely regarded as necessary for the optimal functioning of the BBB. 140 However, Mihajlica et al. recently observed pericyte deficient mice (Pdgfbret/ret) produced similar brain uptake clearance values for oxycodone, diazepam, and paliperidone compared to controls. There are also discrepancies concerning BBB disruptions in animal models related to different neurodegenerative and cerebrovascular disorders. For example, in some studies, no BBB disruptions were observed for certain neurological disorders, whereas other studies have shown BBB disruptions in those specific disease models. 141 Bien-Ly et al. recently reported no difference in BBB permeability across wildtype control and humanized Alzheimer’s disease animal models, 142 in net contrast to previous findings.116,143 Animal models of AD also had limited success in predicting clinical outcomes. Currently, it is being argued that these disease models are only reflective of the asymptomatic phase of the disease. 144 Clinically, increased gadolinium leakage through the BBB was observed in the hippocampus of patients with mild cognitive impairment (MCI) and several grey and white matter regions in early Alzheimer’s disease (AD) patients. However, the degree of disruption varied between patients with only 25% of MCI patients and 45–78% of early AD patients having brain microbleed related problems.145–147 In the case of amyotrophic lateral sclerosis (ALS), G39A mutant transgenic mice expressing a form of human superoxide dismutase (SOD1) showed no differences in permeability across the disease model compared to wild type control groups for both small and large molecule markers. 148 Current rodent models related to Huntington's disease (HD) also provide a poor representation of the disease course and outcomes.149,150 Therefore, studying brain uptake and/or permeability for drugs in these models may not be translatable to humans in all cases.
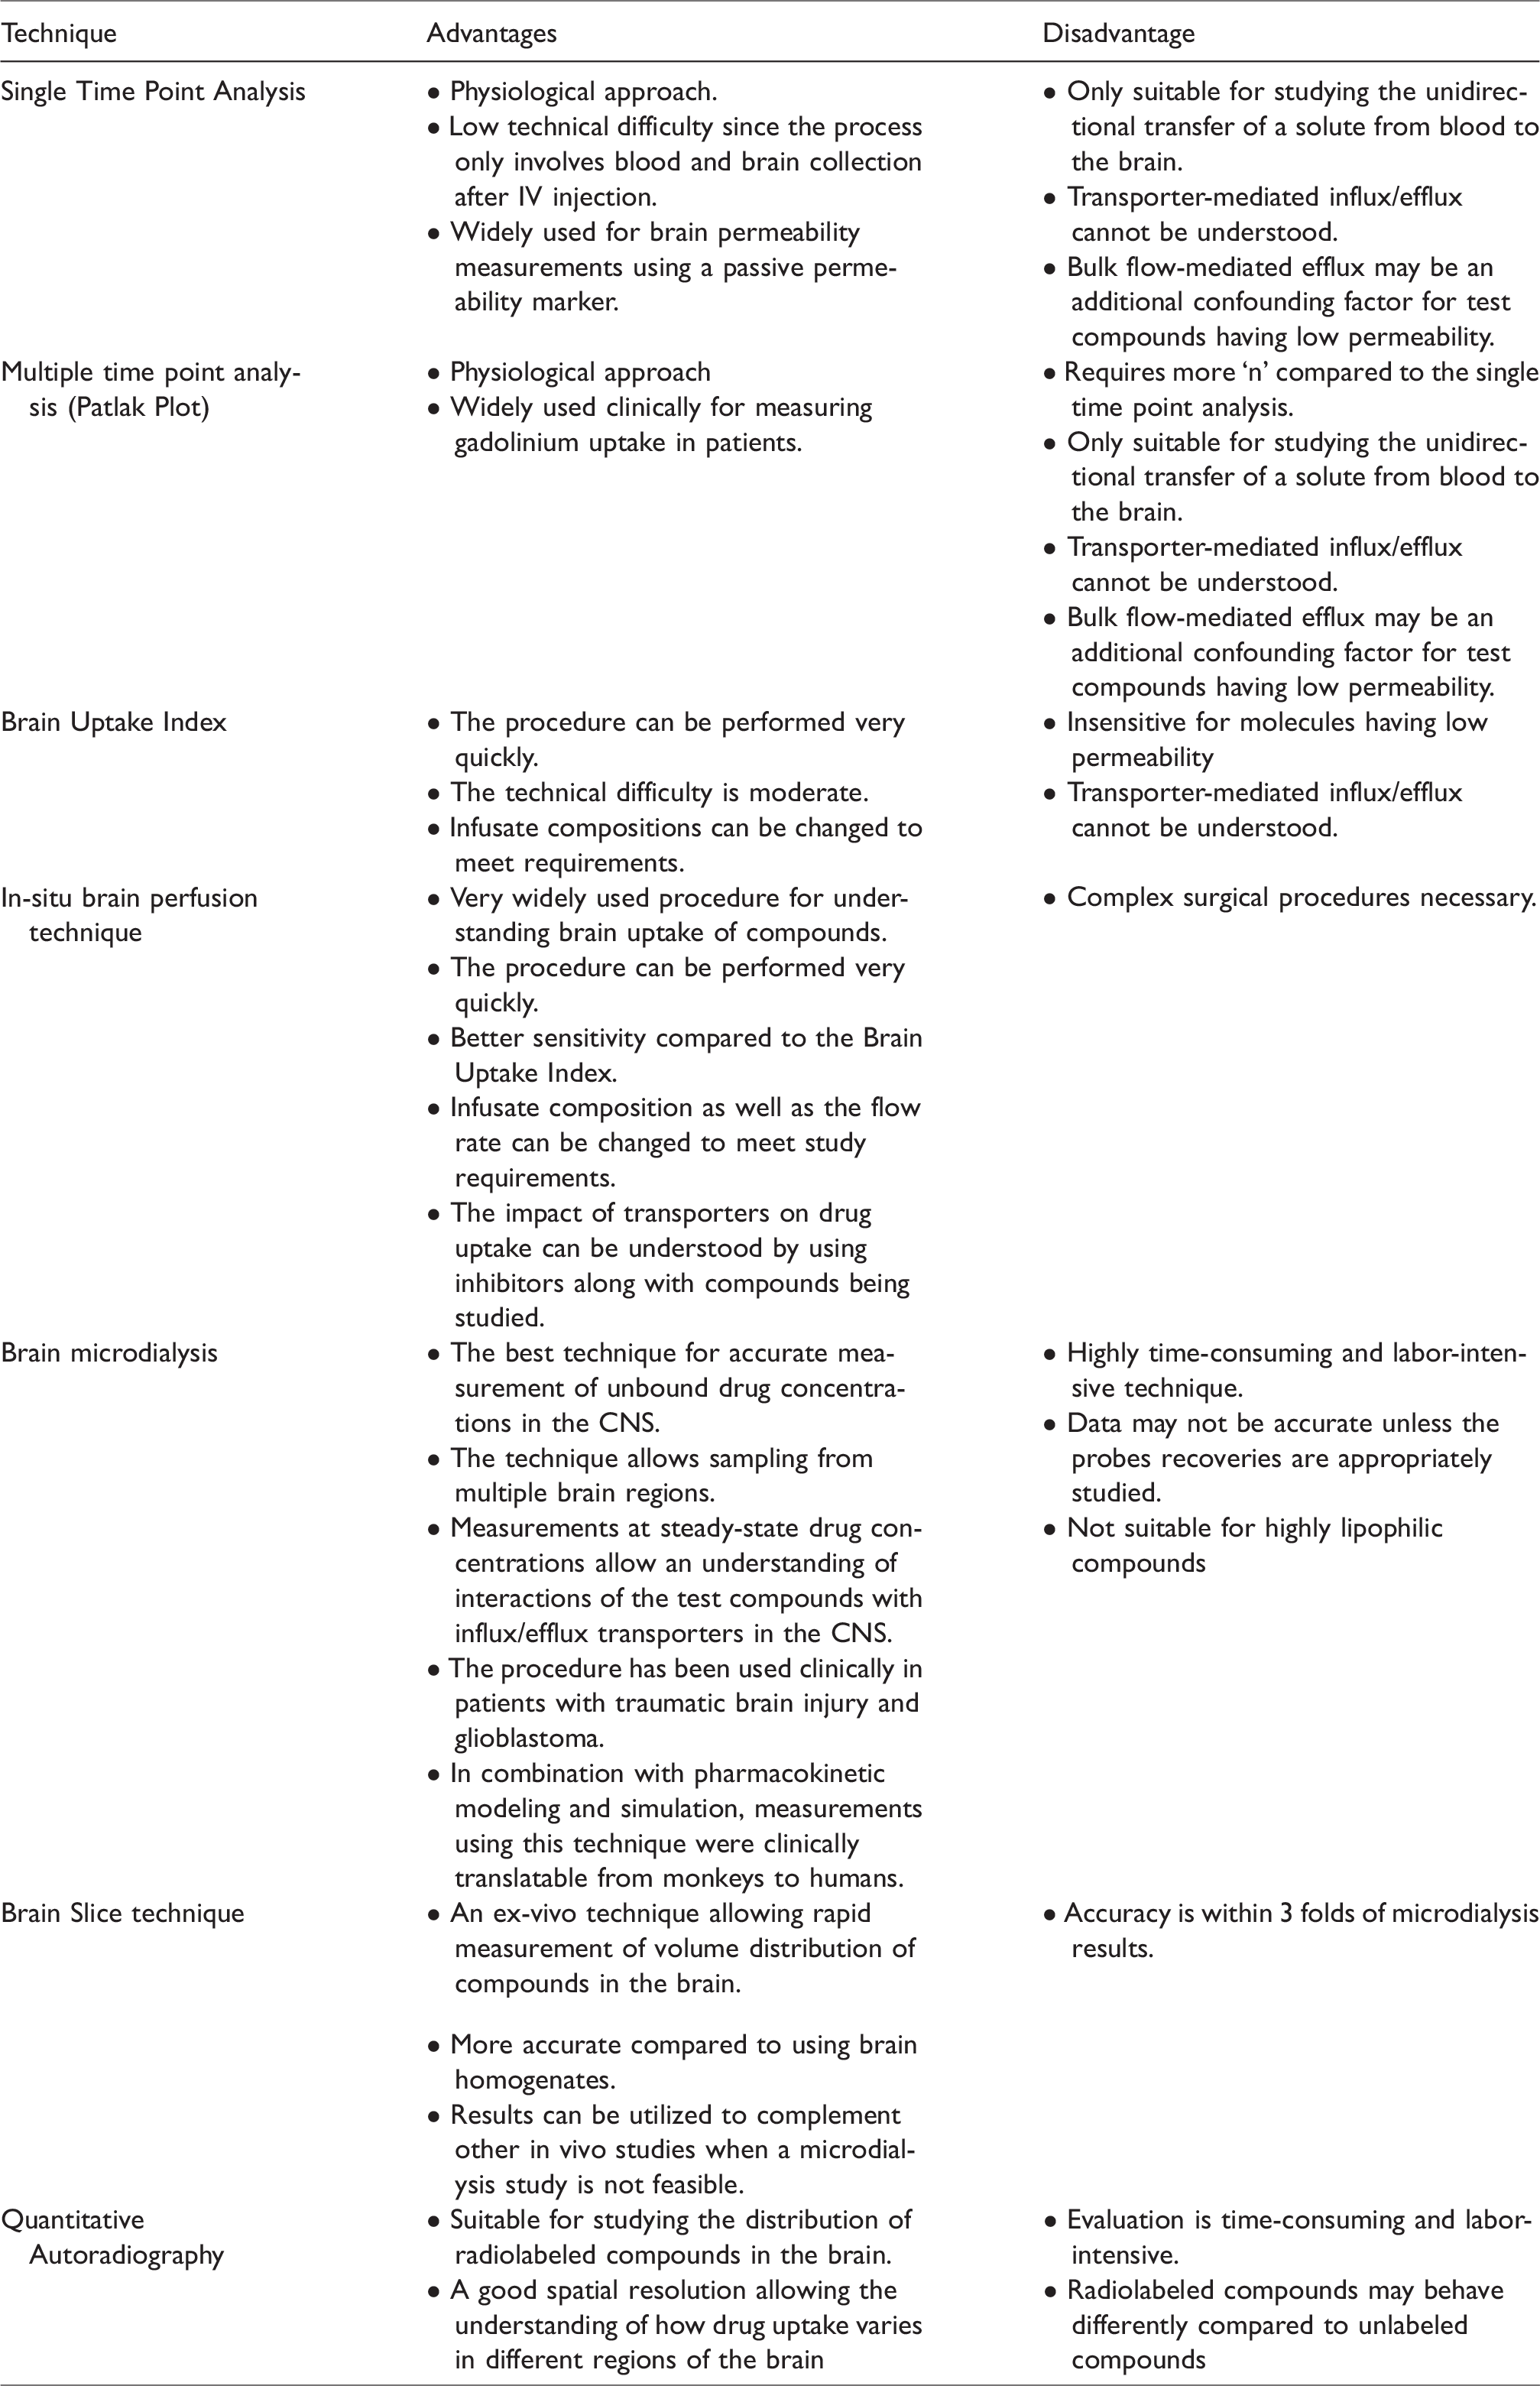
Since some of the animal models do not always recapitulate human BBB physiology or disease conditions, “humanizing” the in vitro BBB platforms may help circumvent these limitations and act as a complementary tool to support existing in vivo approaches. 151 Significant steps have been taken toward developing physiological BBB-on-chip models in recent years.152–154 These advanced microfluidic models provide 3 D structure, cell-cell interaction, and exposure to shear stress that results in better barrier function compared to conventional transwell models.155–158 Although most of the reported organ-on-chip models to date can recapitulate physiologically relevant conditions of BBB, some research groups have also succeeded in creating devices that more closely mimic the complexity of the neurovascular unit in diseased conditions.159–161 Further developments of these humanized models are paramount for the advancement of CNS drug discovery. These organ-on-chip models can easily be utilized for brain uptake and permeability studies and might be crucial in producing translationally relevant outcomes for disease conditions that have a poor animal to human scalability (see also Table 3 which summarizes the current techniques used to measuring brain uptake/permeability).
A summary of different techniques for measuring brain uptake of compounds along with their advantages and disadvantages.
Conclusion
In conclusion, we have comprehensively described how the techniques for measuring brain uptake/permeability of small molecules have evolved with time. Even though very strong advances have been made we still have a long way to go to ensure a reduction in failures in CNS drug development programs. It is also important to utilize the right techniques to understand CNS exposure to drug molecules. Techniques that yield quality data should be given preference over methods of convenience. With the ongoing advancements in this field, we probably are not far away from breakthrough treatments for common CNS disorders which have been widely studied and yet not curable.
Footnotes
Funding
This work was supported by the National Institutes of Health/National Institute on Drug Abuse 2R01-DA029121 and 1R01-DA049737 as well as the National Institute of Neurological Disorders and Stroke 1 R01NS117906 to Dr. Luca Cucullo.
Declaration of conflicting interests
The author(s) declared no potential conflicts of interest with respect to the research, authorship, and/or publication of this article.
Authors’ contributions
E.A Chowdhury conceived the study and prepared the drafting of the manuscript. BN, FA, AB, SR, and FS assisted with the drafting of the manuscript and preparation of the figures and tables. L.C. oversaw the study, made revisions, and provided the necessary funding. All authors reviewed the manuscript.