
Abstract
This study was performed to evaluate whether increasing the permeability of the blood–brain barrier by unilateral intracarotid injection of hyperosmolar mannitol would alter O2 consumption and the O2 supply/consumption balance in the ipsilateral cortex. Rats were anesthetized with 1.4% isoflurane using mechanical ventilation. Retrograde catheterization of a unilateral external carotid artery was performed to administer 25% mannitol at a rate of 0.25 ml/kg/s for 30 s. The blood–brain barrier transfer coefficient (K of 14C-α aminoisobutyric acid was measured in one group (N = 7) after administering mannitol. Regional cerebral blood flow (rCBF), regional arterial and venous O2 saturation and O2 consumption were measured in another group using a 14C-iodoantipyrine autoradiographic technique and micro-spectrophotometry (N = 7). Vital signs were similar before and after administering mannitol. K i was significantly higher in the ipsilateral cortex (IC) (22.3 ± 8.4 μl/g/min) than in the contralateral cortex (CC) (4.4 ± 1.1). rCBF was similar between the IC (105 ± 21 ml/g/min) and the CC (93 ± 20). Venous O2 saturation was lower in the IC (43 ± 7%) than in the CC (55 ± 4%). The coefficient of variation (100 × SD/mean) of venous O2 saturation was significantly elevated in the IC (32.3) compared with the CC (18.2), indicating increased heterogeneity of O2 supply/consumption balance. O2 consumption was higher in the IC (9.6 ± 3.0 ml O2/100 g/min) than in the CC (6.7 ± 1.5). Our data suggested that increasing permeability of the blood–brain barrier increased cerebral O2 consumption and the heterogeneity of local O2 supply/consumption balance.
Transient reversible disruption of the blood–brain barrier has been used to enhance the delivery of water-soluble chemotherapeutic drugs to the brain (Neuwelt et al., 1983; Gumerlock et al., 1992). This technique has generally been reported to be safe and effective with minimal side effects. However, it can cause transient behavioral and electrophysiological changes and may even cause structural brain damage (Salahuddin et al., 1988; Suzuki et al., 1988; Johansson et al., 1990; Lanier et al., 1990). There is evidence that capillary transport can affect metabolic rate, and that neuronal activity and metabolic rate can affect capillary transport (De Vivo et al., 1991; Lear and Kasliwal, 1991). Disruption of the blood–brain barrier could alter the internal milieu and may increase the release of excitatory amino acid neurotransmitters or catecholamines, which may affect metabolic rate or coupling (MacKenzie et al., 1976; Artru et al., 1981; Nishizaki and Okada, 1988; Simon and Shiraishi, 1990). Pappius et al. (1979) observed about a 100% average increase in local cerebral glucose uptake in the brain when the blood–brain barrier was opened with hyperosmolar mannitol in the ipsilateral cortex (IC). Rapoport et al. (1981) demonstrated an altered glucose utilization after opening of the blood–brain barrier by hypertonicity or hypertension. Not all studies have found such changes (Lanier et al., 1990; MacKenzie et al., 1976).
We have found significant venous O2 saturation inhomogeneity in the cerebral cortex, indicating local regional O2 supply/consumption variation. The degree of heterogeneity can be altered by anesthetics (Sinha et al., 1992). The peripheral sympathetic innervation of cerebral blood vessels can also affect cerebral O2 supply/consumption balance (Wei et al., 1993). The issue of whether disruption of the blood–brain barrier would alter venous O2 saturation heterogeneity and O2 supply/consumption balance has been studied. However, Pappius et al. (1979) reported an increase in glucose uptake, without increases in CBF. Blood–brain barrier-induced changes in neurotransmitter activity may disrupt the coupling of metabolism and blood flow (MacKenzie et al., 1976; Artru et al., 1981; Nishizaki and Okada, 1988; Simon and Shiraishi, 1990).
The purpose of this study was to test the hypothesis that increasing permeability of the blood–brain barrier would increase local O2 consumption, while reducing the local O2 supply/consumption balance. In this study, permeability of the blood–brain barrier was altered with unilateral intracarotid injection of hyperosmolar mannitol in isoflurane-anesthetized rats. Local O2 supply and O2 consumption were measured using autoradiography and micro-spectrophotometry, and blood–brain–barrier transport was determined using α-aminoisobutyric acid (AIB).
METHODS
This study was approved by our Institutional Animal Care and Use Committee. Fourteen adult male Long Evans rats weighing 350–400 g were anesthetized with 1.4% isoflurane in an air and oxygen mixture (FiO2 0.25–0.3), and they were mechanically ventilated. A femoral artery and vein were catheterized. The femoral arterial catheter was connected to a Statham P23AA transducer (Gould Instruments, Cleveland, OH, U.S.A.). Blood pressure was continuously monitored and it was recorded on a Beckman R-411 recorder (Fullerton, CA, U.S.A.). The right common carotid artery and the internal and external carotid arteries were exposed. The external carotid artery was catheterized with a polyethylene tube (PE-50) after its branches were ligated. The tip of the catheter was placed ∼1 mm distal to the carotid bifurcation. No arterial blood pressure changes were observed during this procedure. Before determining the rCBF, transfer coefficient (K, or O2 consumption, a 0.2-ml arterial blood sample was withdrawn anaerobically and analyzed for Pao2, Paco2, and pH, using a blood gas analyzer (ABL330, Radiometer America, Westlake, OH, U.S.A.). Hemoglobin was measured using spectrophotometry. The femoral venous catheter was used to administer radioactive tracers. Body temperature was maintained at 37°C with a heat lamp controlled by a servocontrolled rectal thermistor probe throughout the experimental period. To open the blood–brain barrier, a solution of 25% mannitol was warmed to 37°C and filtered immediately before use with Whatman (no. 1) filter paper. It was infused through the catheter in the carotid artery for 30 s at a rate of 0.25 ml/kg/s. The rate of infusion was set so that it was well below the rate that has been shown to cause a hypertensive opening of the blood–brain barrier in anesthetized rats (Rapoport, 1976) and would not cause immediate or delayed neurotoxicity (Cosolo et al., 1989). After the mannitol infusion, seven rats were used to measure rCBF and regional O2 consumption, and another seven rats were used to determine the Ki of AIB.
rCBF determination
Twelve minutes after administering mannitol, rCBF was measured using the [14C]iodoantipyrine quantitative autoradiographic technique modified from Sakurada et al. (1978). Briefly, 50 μCi of 14C-iodoantipyrine was infused intravenously. When the isotope entered the venous circulation, the arterial catheter was cut to a length of 20 mm to minimize smearing in the sampling catheter. Twenty-microliter blood samples were obtained from the arterial catheter approximately every 3 s during the next 40 s. At the moment the last sample was obtained, the animal's head was decapitated and frozen in liquid nitrogen. While frozen, the tissue was sampled from three brain regions: IC, contralateral cortex (CC), and pons. These tissue samples were mounted with an embedding medium in a microtome cryostat. Tissue slices (20-μm thickness) were obtained in a cryostat at −35°C under a nitrogen atmosphere. Autoradiograms were prepared from these sections by exposing them to x-ray film (Kodak SB-5) in x-ray cassettes for 5 days. The cerebral [14C]iodoantipyrine tissue concentrations were determined by using a computer-based microdensitometer system (Microcomp Image Analysis, Southern Micro Instruments), and by referring to eight precalibrated standards (range, 40–1,069 nCi/g, Amersham) that were processed with each x-ray film. For each brain region examined, a minimum of eight optical density measurements were made, each on different sections. Blood samples were placed in a tissue sol-ubilizer and 24 h later, they were put in a counting fluid. These samples were counted on a liquid scintillation counter. The isotope counts were quench corrected.
rCBF determinations were calculated using the equation
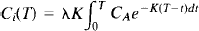
where Ci(T) equals the tissue concentration of [14C]iodoantipyrine at the time of decapitation; λ equals the tissue:blood partition coefficient; CA is the arterial concentration of the tracer; and t equals time. K is defined as follows: K = mF/W, where m is a constant related to diffusion; F/W equals the blood flow per unit mass of tissue. The λ value of 0.8 calculated by Sakurada et al. (1978) was used.
Regional oxygen consumption determination
Alternate slices of the tissue sections that were used to measure the rCBF were used to determine the arterial and venous O2 saturations. Details of this technique have been published previously (Buchweitz-Milton and Weiss, 1987). The tissue sections were transferred to precooled glass slides and covered with degassed silicone oil and a coverslip. These slides were placed on a Zeiss microspectrophotometer fitted with a N2-flushed cold stage to obtain readings of optical densities at 568, 560, and 523 nm. This three-wavelength method corrects for the light scattering in the frozen blood. Only vessels in the transverse section were studied so that the path of light only traversed the blood. The size of the measuring spot was 8 (Am in diameter. Readings were obtained to determine O2 saturation in the six arteries and eight veins (20–50 μm in diameter) found in each region.
The O2 content of blood was determined by multiplying the percent of O2 saturation by the hemoglobin concentration times 1.36. The difference between the average arterial and venous O2 contents (regional O2 extraction) was then obtained. Using the Fick principle, the paired product of O2 extraction and blood flow was obtained to determine the regional O2 consumption of the brain. The regional ratio of the O2 supply-to-consumption was determined by dividing the local O2 supply by the local O2 consumption, CaO2 × Q/Q (CaO2 − CvO2), where CaO2 and CvO2 are the arterial and venous O2 content, and Q is the flow. This reduces to Sao2/(Sao2 − Svo2), where Sao2 and Svo2 are the percent of oxyhemoglobin in the arterial and venous blood, respectively. This method has been validated in the brain (Buchweitz-Milton and Weiss, 1987).
Blood–brain transfer coefficient determination
Two minutes after mannitol infusion, 20 μCi of 14C-AIB (Amersham, Arlington Heights, IL, U.S.A.) was rapidly injected intravenously and flushed with 0.5 ml of normal saline. Blood samples were collected from the arterial catheter at 15-s intervals for the first 2 min and then every 1 min for the next 8 min. Five minutes after the injection of 14C-AIB, 20 μCi of 3H-dextran (MW 70,000) (Amersham) was injected intravenously and flushed with 0.5 ml of normal saline. After collecting the 10-min arterial blood sample, the animals were decapitated and the brains were quickly frozen in liquid nitrogen. The same brain regions as those used for blood flow measurements were dissected and solubilized in Soluene before they were counted for radioactivity. The arterial blood samples were centrifuged and the plasma was separated and processed for scintillation counting in the same way as the brain samples were. Plasma and brain samples were counted on a liquid scintillation counter that was equipped for dual-label counting. Quench curves were prepared using carbon tetrachloride and all samples were automatically corrected for quenching. The blood-to-tissue transfer coefficient for 14C-AIB was determined, assuming a unidirectional transfer of AIB during the 10-min period of the experiment, as described by Gross et al. (1987) using the following equation:
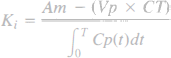
where Am is the amount of 14C-AIB radioactivity in the tissue per gram, Vp is the volume of plasma retained in the tissue determined from the 3H-dextran data, where Vp is obtained by dividing the amount of 3H-dextran radioactivity in the tissue per gram by the concentration of 3H-dextran in the plasma at the time of decapitation, Cp(t) is the arterial concentration of 14C-AIB over time t, and CT is the arterial plasma concentration of 14C-AIB at the time of decapitation. In the equation to determine Ki, Vp × CT is a correction term that accounts for the label retained in the vascular compartment of the tissue, Am. The extraction fraction (E) was calculated using the equation:

where F is the blood flow and Vf is the fraction of blood that contains AIB. Cerebral tissue hematocrit was assumed to be 30% (Cremer et al., 1983). A permeability-surface area (PS)-product for AIB was calculated by PS = − FVf ln (1 − E).
Analysis of data
The coefficient of variation (CV) of venous O2 saturation was used to compare changes in heterogeneity. The CV was calculated as (100 × standard deviation/mean). The proportion of low O2 saturation veins and the shape of the measured distributions were compared using the x2 test. A factorial analysis of variance was employed to assess the differences between the groups and between the various examined regions for cerebral blood flow, O2 extraction, O2 consumption, and the transfer coefficient. The statistical significance of difference was determined using Duncan's procedure. Student's t test was used to compare the systemic hemodynamic and blood gas parameters. All values are presented as mean ± SD. In all cases, significance was defined as p < 0.05.
RESULTS
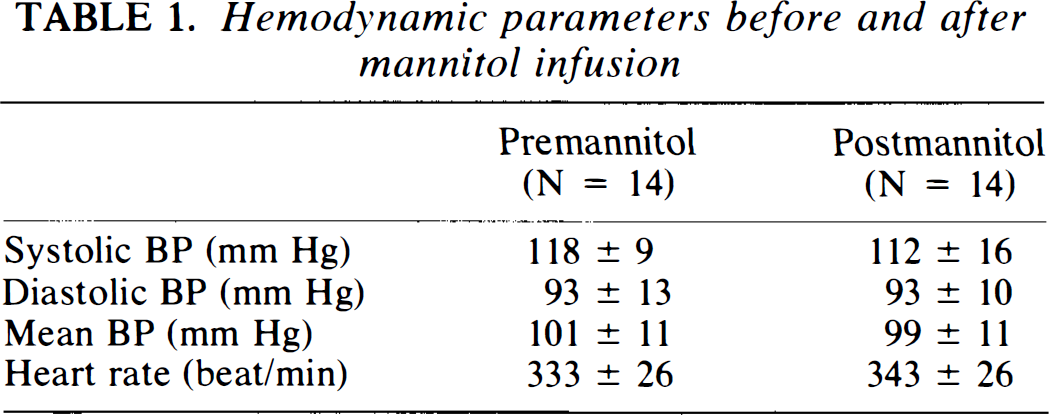
Hemodynamic parameters for the experimental animals are presented in Table 1. There was a small transient rise in blood pressure after mannitol administration that returned to control values within 1–2 min. Vital signs were similar before and 12 min after mannitol infusion. At the conclusion of the experiment, Pao2 averaged 105 ± 13 mm Hg, Paco2 was 39 ± 3 mm Hg, pH was 7.34 ± 0.06, and hemoglobin concentration was 13.8 ± 0.6 g/100 ml. Blood gas parameters were within the normal range for this preparation and were not affected by treatment.
Hemodynamic parameters before and after mannitol infusion
The blood–brain transfer coefficient (Ki) for AIB of the IC was about five times that of the CC or the pons (Fig. 1). This difference was statistically significant (p < 0.003). The calculated plasma volume in the brain tissue, estimated using 3H-dextran, was 2.1 ± 0.2% in the CC and 3.6 ± 0.7% in the IC (p < 0.003).
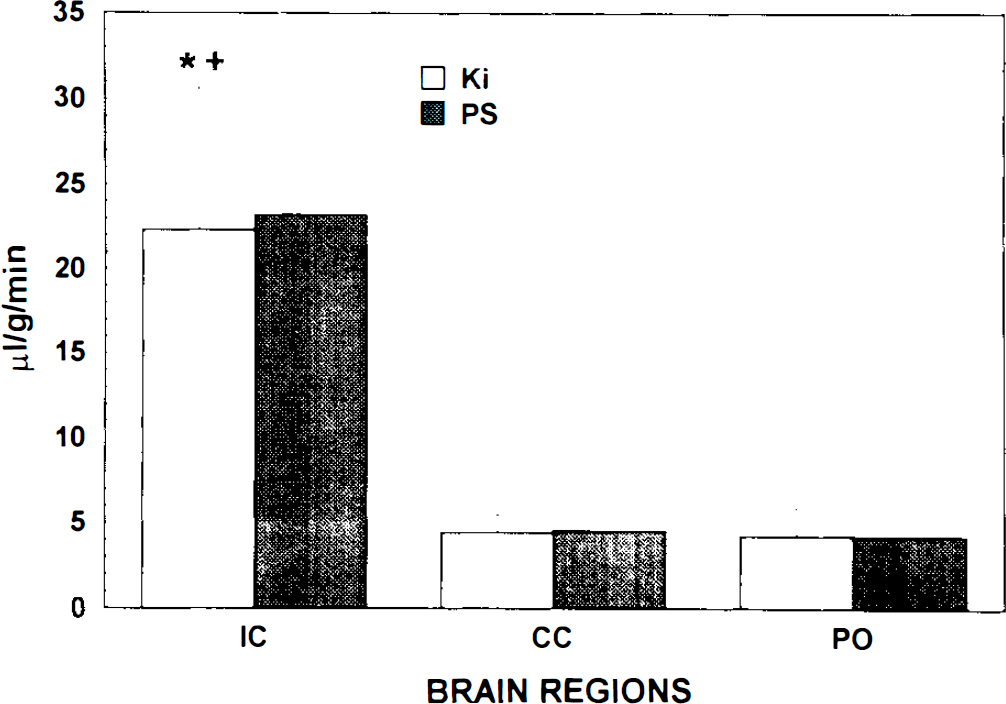
The regional blood–brain barrier transfer coefficient (Ki) for the ipsilateral cortex (IC), contralateral cortex (CC), and pons (PO) after unilateral intracarotid infusion of hyperosmolar mannitol solution. *Significantly different from the corresponding data for the contralateral cortex. †Significantly different from the corresponding data from the pons.
The infusion of mannitol did not cause any significant changes in local CBF or O2 supply, 12 min after administration. rCBF of the IC was lower than that of the pons (p < 0.002), but it was similar to that of the CC (Table 2). The average arterial O2 saturation (Sao2) was also similar among the three examined brain regions.
Regional O2 balance parameters 12 min after intracranial hyperosmolar mannitol infusion
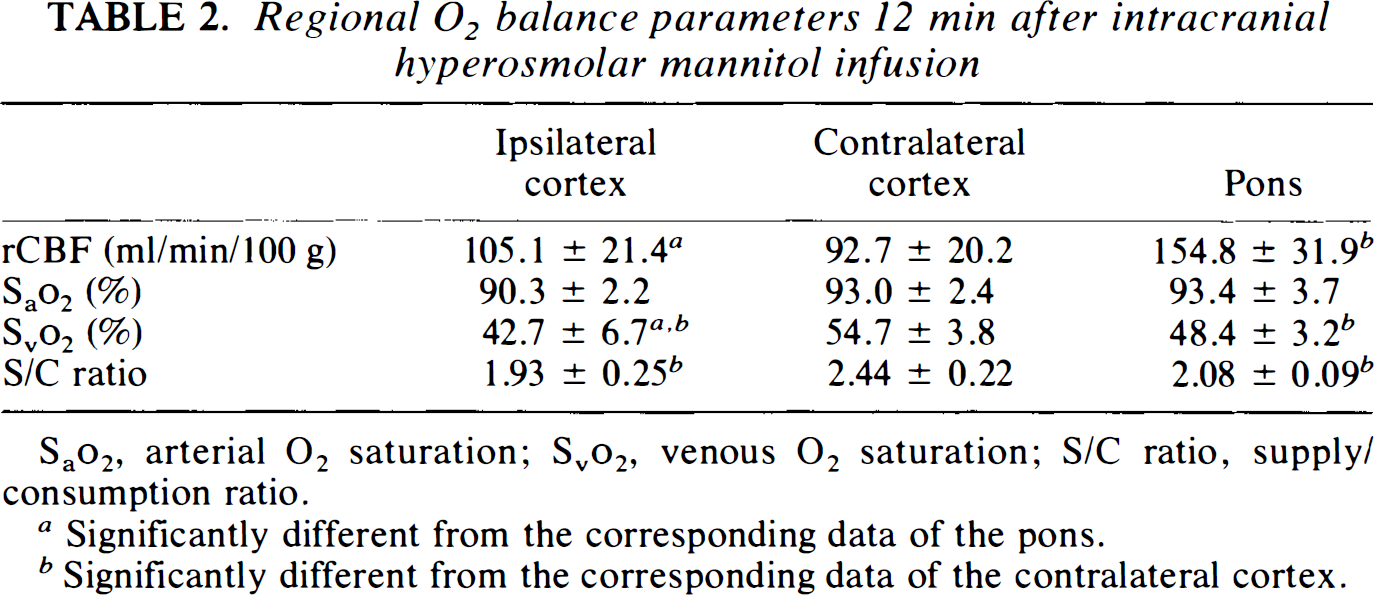
Sao2, arterial O2 saturation; Svo2 venous O2 saturation; S/C ratio, supply/consumption ratio.
Significantly different from the corresponding data of the pons.
Significantly different from the corresponding data of the contralateral cortex.
Venous O2 saturation (Svo2) of the IC was 22% lower than that of the CC, whereas the Svo2 of the pons was slightly lower than that of the CC (− 12%, p < 0.001) (Table 2). The O2 supply/consumption ratio of the IC was 21% lower than that of the CC (p < 0.001), whereas the O2 supply/consumption ratio of the pons was 15% lower (p < 0.002) than that of the CC (Table 2). The O2 extraction of the IC (9.0 ± 1.0 ml O2/100 ml) was 25% higher (p < 0.002) than that of the CC (7.2 ± 0.8), whereas the O2 extraction of the pons was 17% higher (p < 0.005) than that of the CC (Fig. 2). Thus, mannitol infusion significantly increased local cortical O2 extraction in comparison to the contralateral cortex.
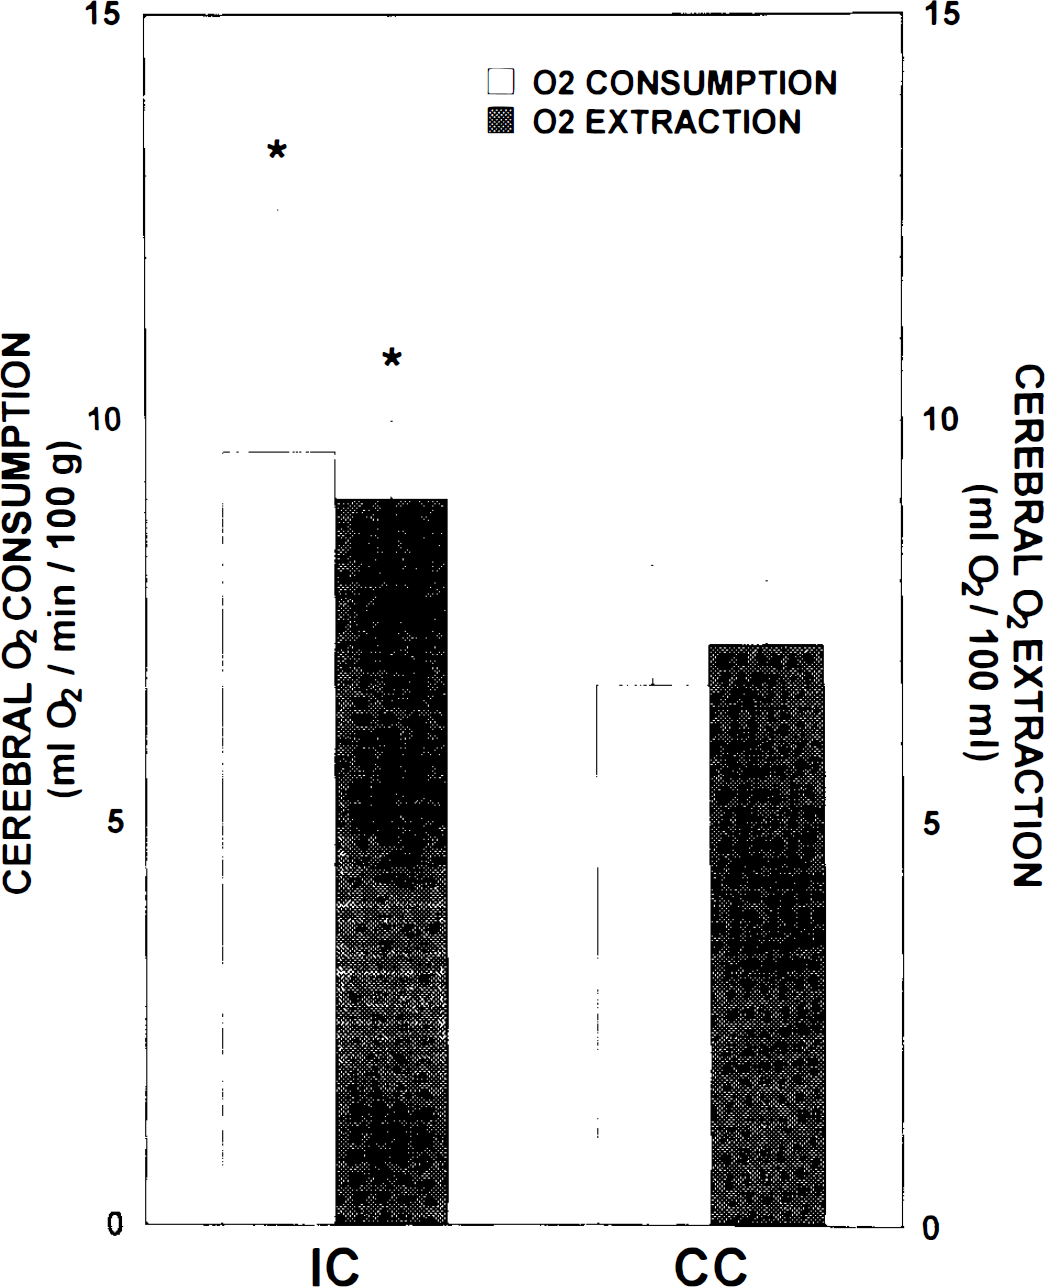
Regional cerebral O2 consumption and regional cerebral O2 extraction in the ipsilateral cortex (IC) and contralateral cortex (CC) after unilateral intracarotid infusion of hyperosmolar mannitol solution. *Significantly different from the corresponding data for the contralateral cortex.
The O2 consumption of the IC (9.6 ± 3.0 ml O2/min/100 g) was 43% higher than that of the CC (6.7 ± 1.5). This difference shown in Fig. 2 was statistically significant (p < 0.002). Values of O2 consumption in the pons were high, as had been previously reported with this model. The increased O2 consumption in the mannitol-treated cortex was present 12 min after mannitol infusion.
To examine changes in O2 supply/consumption balance resulting from mannitol, we examined the variability of venous O2 saturation. The heterogeneity of venous O2 saturation was expressed as the coefficient of variation (CV = 100 × SD/mean). The CV of the IC was 32.3, whereas that of the CC was 18.2. These values were significantly different. The CV of the pons was intermediate at 21.3. The distribution of measured venous O2 saturations in the IC and CC is shown in Fig. 3. The number of veins with low saturation (Svo2 < 45%) was 9 of 56 in the CC and 29 of 56 in the IC. These values were significantly different.
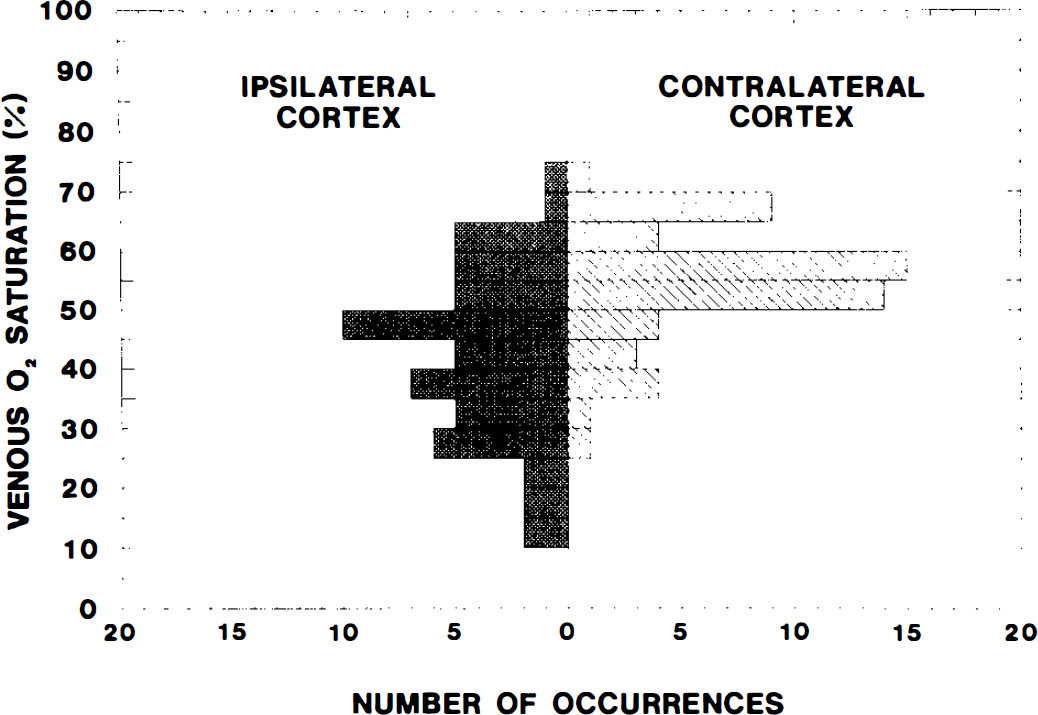
Distribution of measured venous O2 saturations in the ipsilateral cortex and contralateral cortex after unilateral intracarotid infusion of hyperosmolar mannitol solution.
DISCUSSION
Our data demonstrated that the intracarotid administration of hyperosmolar mannitol increased the blood–brain barrier transfer coefficient for AIB and the capillary permeability-surface area product by about fivefold. There was a 43% increase in O2 consumption of the ipsilateral compared with the contralateral cortex after the intracarotid administration of hyperosmolar mannitol. Local cerebral blood flow and O2 supply were not significantly changed. This greater O2 consumption in the mannitol-treated region was accompanied by increased O2 extraction. There was a significant increase in the number of veins with low O2 saturations after mannitol compared with the contralateral cortex. This indicated a local heterogeneous decline in local O2 supply/consumption balance after osmotic opening of the blood–brain barrier.
Osmolarity of a substance and duration of its intraarterial infusion, regions of the brain, anesthetic agents, Paco2, and steroids could all affect the degree of osmotic disruption of the blood–brain barrier (Neuwelt and Barnett, 1989). The K, of AIB of the ipsilateral cortex in this study is similar to that of Hiesiger et al. (1986), in which a similar dose and concentration of mannitol was used, and that of others in which arabinose of the same osmolarity was used (Nakagawa et al., 1984). In this study, the extraction fraction and permeability-surface area product were also calculated. The extraction fractions (E) of the IC, CC, and pons were 7.1, 1.6, and 0.9%, respectively. The calculated PS product was 23.3 μl/min/g in the IC, 4.5 μl/min/g in the CC and 4.2 μl/min/g in the pons. This value was similar to Ki. The fivefold increase in Ki and PS product must be related to increased capillary permeability, because perfused capillary surface area cannot increase this much. The rate of infusion that we used should not cause a retrograde flow to the common carotid artery or a hypertensive opening of the blood–brain barrier as was reported in other studies (Rapoport, 1976; Pappius et al., 1979; Nakagawa et al., 1984). The rate and time of infusion of mannitol resulted in an optimum disruption of the blood–brain barrier without serious immediate or delayed neurotoxicity (Cosolo et al., 1989). Because the mannitol solution that we used was filtered before use, the disruption of the blood–brain barrier is unlikely to be caused by microemboli (Tomiwa et al., 1982).
The calculated plasma volume of the brain tissue affected by the administration of mannitol almost doubled compared with the contralateral cortex in this study. The plasma volume measured with 3H-dextran should reflect the actual plasma volume and the amount of 3H-dextran that leaked into the brain tissue. This increase provides further evidence for disruption of the blood–brain barrier. Other studies showed extravasation of albumin into the brain tissue after an intracarotid administration of hyperosmolar mannitol (Salahuddin et al., 1988; Suzuki et al., 1988). It is unlikely that the true plasma volume of the treated region doubled, but we cannot quantitatively determine the amount of dextran that leaked from the vessels. Therefore, we used the plasma volume of the CC to calculate the Ki of the IC in this study to allow for the possibility of leakage of dextran into the extravascular space. However, alterations in plasma volume do not greatly affect the calculation of Ki. The reported increase in Ki provides a better estimate of the alteration in blood–brain barrier permeability.
Our data demonstrated that O2 consumption was increased in the IC compared with the CC after increasing blood–brain barrier permeability. It is possible that some of the effects in the ipsilateral cortex could indirectly affect O2 consumption in the CC (Meyer et al., 1993). However, the possibility of diaschisis is small, because both the Ki and O2 consumption of the CC are similar to those of our previous reports using this preparation (Chi et al., 1994; Wei et al., 1993).
Pappius et al. (1979) also reported increased local cerebral glucose uptake after blood–brain barrier disruption by hyperosmolar mannitol. They also reported that the glucose utilization returned to normal 2–3 h after intracarotid perfusion, when permeability of Evans blue returned to normal. However, using techniques to measure the difference in oxygen or glucose content between arterial and sagittal sinus or between arterial and venous blood, others reported that increases in blood–brain barrier permeability led to no change in oxygen or glucose metabolism (Lanier et al., 1990; MacKenzie et al., 1976). The reasons for our increased O2 consumption in the IC compared with the CC are not clear. Immunohistochemical and electron microscopic studies of hyperosmolar blood–brain barrier disruption have shown that structural neuronal changes may occur within areas with protein extravasation (Salahuddin et al., 1988; Suzuki et al., 1988; Johansson et al., 1990). Electroencephalographic alterations were noted with disruption of the blood–brain barrier using intracarotid injections (Lanier et al., 1990). In conscious rats, seizure may also occur during an acute hypertensive episode with blood–brain barrier disruption (Johansson and Henning, 1976). The internal milieu of the brain tissue is disturbed by disruption of the blood–brain barrier. Excitatory amino acid neurotransmitters, such as glutamate, could be released, which could increase neuronal activity and metabolism (Nishizaki and Okada, 1988; Simon and Shiraishi, 1990). Catecholamines could also be released and may also increase cerebral metabolism (Berntman et al., 1978). Changes in blood–brain barrier permeability may modify the neuroendocrine response to circulating substances (Ježovà, 1990). Several investigators observed that an intracarotid injection of norepinephrine or epinephrine exerted no effect on rCBF or on cerebral metabolic rate in animals with a normal blood–brain barrier. However, when the blood–brain barrier was disrupted, the injection led to an increase in rCBF and metabolic rate compared with the untreated cortex (MacKenzie et al., 1976; Artru et al., 1981).
The increase of O2 consumption was not accompanied by increased rCBF in our study. In the study by Pappius et al. (1979), the increase of glucose utilization after blood–brain barrier disruption was also not accompanied by a rise in rCBF. The time at which rCBF was measured after mannitol will affect rCBF values. Hiesiger et al. (1986) reported that there was an increase in rCBF 2 min after administering hyperosmolar mannitol. Another study reported that 6 min after an intracarotid injection of hyperosmolar solution, CBF returned to normal (Hardebo and Nilsson, 1980). We measured rCBF at 12 min after administration of hyperosmolar mannitol, and rCBF was not changed significantly. The reason for the lack of change in rCBF with increased O2 consumption in the IC is not clear. The production of vasodilating substances, e.g., nitric oxide, which couple CBF and metabolism, could be altered. Nitric oxide production may match cerebral metabolism and flow (Dirnagl et al., 1993). Because of the functional or morphologic changes of cerebral vasculature after administering hyperosmolar solution, the sensitivity of cerebral vessels to nitric oxide or other vasodilating substances could be decreased. Another possibility for the lack of change could be that the release of vasoconstrictors such as endothelin and norepinephrine from blood vessel walls and neurons is enhanced to overcome the vasodilation brought on by metabolic changes.
The mannitol infusion in the IC in our study was associated with an increased local cerebral O2 extraction (Fig. 2). Increased O2 extraction rather than blood flow is not the usual way in which additional oxygen is supplied to the brain. Average local venous O2 saturation fell in the area administered mannitol compared with the CC. This was associated with an increased heterogeneity of microregional venous O2 saturation (CV of 18.2 for CC, 32.3 for IC). The number of veins with low saturation (Svo2 < 45%) was 9 of 56 in the CC, and 29 of 56 in the IC. The difference in O2 extraction between IC and CC was not likely due to differences in hematocrit, 12 min after mannitol administration. These data could partially explain the reason why blood–brain barrier disruption by hyperosmolar agents could cause focal neuronal damage as reported by others (Salahuddin et al., 1988; Suzuki et al., 1988; Johansson et al., 1990). The increased heterogeneity of venous O2 saturation and the increase in the number of low O2 saturation veins after mannitol in the ipsilateral compared with the contralateral cortex may be related to the focal nature of opening the blood–brain barrier with hypertonic solution (Salahuddin et al., 1988; Suzuki et al., 1988).
In conclusion, our study demonstrated that the increased permeability of the blood–brain barrier was associated with an increased O2 consumption and an increased heterogeneity of O2 supply/consumption balance in the ipsilateral cortex after administering hyperosmolar mannitol. Local CBF and O2 supply were not significantly changed. This increased O2 consumption after mannitol in the ipsilateral compared with the contralateral cortex was accompanied by increased O2 extraction. There was a significant increase in the number of veins with low O2 saturations after mannitol in the ipsilateral compared with the contralateral cortex. This indicated a heterogeneous local decrease in local O2 supply/consumption balance after osmotic opening of the blood–brain barrier.
Footnotes
Acknowledgment:
This study was supported, in part, by a grant-in-aid from the State of New Jersey, Commission of Science and Technology.