
Abstract
Despite the potential to guide clinical management of spinal cord injury and disease, noninvasive methods of monitoring perfusion status of the spinal cord clinically remain an unmet need. In this study, we optimized pseudo-continuous arterial spin labeling (pCASL) for the rodent cervical spinal cord and demonstrate its utility in identifying perfusion deficits in an acute contusion injury model. High-resolution perfusion sagittal images with reduced imaging artifacts were obtained with optimized background suppression and imaging readout. Following moderate contusion injury, perfusion was clearly and reliably decreased at the site of injury. Implementation of time-encoded pCASL confirmed injury site perfusion deficits with blood flow measurements corrected for variability in arterial transit times. The noninvasive protocol of pCASL in the spinal cord can be utilized in future applications to examine perfusion changes after therapeutic interventions in the rat and translation to patients may offer critical implications for patient management.
Keywords
Introduction
Perfusion of the spinal cord is disrupted in many neurological insults, most notably traumatic spinal cord injury (SCI). The perfusion status of the spinal cord after SCI is identified as a prognostic marker of severity and a therapeutic target. Spinal cord perfusion pressure, measured with invasive intrathecal or subdural catheters, is predictive of neurological outcome following traumatic SCI.1,2 Current clinical management guidelines emphasize the importance of restoring normal perfusion to the cord, via decompression surgery or augmentation of mean arterial pressure (MAP) with vassopressors.3–6 Prevention of hypotension episodes is associated with better clinical outcome, and specifically, the duration of hypotension is correlated with worse outcome. 7 While this suggests a relationship between MAP and outcome, establishing a direct link will provide information critical to patient management or therapeutic targets. Noninvasive monitoring of spinal cord blood flow (SCBF) is a clinically unmet need to improve care in SCI patients and identify suitable interventions. However, it has not been widely employed and published work has been limited in the ability to provide quantitative maps 8 or reliably delineate spinal cord anatomy.9–11 Perfusion changes following traumatic SCI result from various mechanisms including vascular damage, neurogenic shock 12 and disruption to sympathetic tone, 13 which may lead to heterogeneity in perfusion patterns. 14 A robust method to spatially map quantitative SCBF could provide access to this potentially important biomarker for preclinical therapies.
Arterial spin labeling (ASL), an MRI technique that uses endogenous contrast to measure perfusion by magnetically labeling blood, is well established in the brain but its application to the spinal cord is limited to primarily animal models10,11,15 and only one report exists of ASL in SCI. 16 A variety of ASL methods have been demonstrated which are generally classified as either continuous or pulsed. The signal difference between pairs of images obtained under label and control conditions is proportional to blood flow, and quantitative estimates of perfusion are derived using appropriate kinetic models.17,18 In the brain, pseudo-continuous ASL (pCASL) is the preferred ASL method due to its superior sensitivity compared to pulsed ASL. Using a series of radiofrequency pulses, pCASL magnetically inverts protons in the blood as they pass through a discrete labeling plane perpendicular to the proximal feeding arteries. In the spinal cord, because of the complex blood delivery through multiple feeding arteries, identifying a suitable discrete labeling plane location can be a challenge. Therefore, global labeling strategies for ASL methods such as flow alternating inversion recovery (FAIR) have been preferred and there are currently no published reports of pCASL in the spinal cord. MRI of the spinal cord faces additional challenges of magnetic field inhomogeneity, which leads to substantial susceptibility and distortion artifacts, along with challenging respiratory and cardiac motion artifacts. Furthermore, both the distance from the labeling plane and the complex blood delivery contributes to variability in the arrival time of labeled water to the tissue, known as arterial transit time (ATT). ATT may be further altered after injury. Multi-delay pCASL, with a Hadamard-encoded labeling matrix,19–21 can estimate ATT directly 22 and account for these variable effects in perfusion estimates.21,23 Collectively, monitoring of perfusion and vascular dynamics using MRI is built on a robust set of methods and has been extensively evaluated in the brain, but these methods have not been suitably applied to the spinal cord despite potentially substantial utility for clinical care of spinal cord injuries and disorders.
Here, we report a systematic optimization of pCASL to measure SCBF in the rat cervical spinal cord at high field and demonstrate its utility in acute contusion injury. First, we established the optimal label plane position based on the vascular anatomy supplying the cord and characterized the efficiency of pCASL for spinal cord applications. We next optimized approaches to reduce artifacts including background suppression and imaging readouts. The optimized protocol was applied to the acutely injured spinal cord, revealing clear disruption of blood flow at the site of injury. Further, we demonstrate that both Hadamard-encoded pCASL and multi-delay pCASL angiography reveal the vascular dynamics unique to the spinal cord. We finally demonstrate in an acute contusion injury model that both SCBF and ATT are altered at the site of injury. The results advance the utility of ASL in the spinal cord and identify a suitable protocol for future animal studies and translation to humans, ultimately aiming to improve detection of perfusion deficits after traumatic SCI and chronic compressive disorders of the spinal cord.
Methods
Animals
All animal procedures were approved by the Institutional Animal Care and Use Committees (IACUC) at the Medical College of Wisconsin and the Clement J Zablocki VA Medical Center in accordance with the Animal Welfare Act and the Health Research Extension Act. MRI studies were performed with a total of 12 female and 6 male Sprague-Dawley adult rats (Charles River Laboratories, Wilmington, MA). The same healthy female animals were used for multiple experiments to optimize pCASL parameters over several months (8 weeks to 4 months). Feasibility in a rat model of spinal cord contusion was evaluated with single-delay pCASL after a C5 contusion (n = 5) in rats ranging 8–10-weeks and weighing 250–275-g. Finally, Hadamard-encoded pCASL was performed in healthy and injured rats (n = 6 each group, equal number male and female). Healthy animals were housed 2 per cage and injured animals were housed individually. All studies were conducted and reported in accordance with the Animal Research: Reporting in Vivo Experiments (ARRIVE) guidelines. 24
Spinal cord injury procedure
Spinal cord bilateral C5 contusion surgery was performed on 8 rats (250–275-g). Animals were anesthetized with 4–5% inhaled isoflurane and maintained at 2–3% for the duration of the surgery. The back was shaved and sterilized with Betadine and an incision was made over the lower cervical region. A dorsal laminectomy at C5 was preformed, leaving the dura intact. The New York University/Multicenter Animal Spinal Cord Injury Study (NYU/MASCIS) is a weight drop impactor device 25 that can produce multiple injury severities by varying the drop height. In this study, a single moderate bilateral contusion injury was produced by dropping the 10-g rod with 0.8-mm diameter tip from a height of 25-mm on the center of the cord. The incision sites were sutured, and animals recovered under supervision. Post-operative care of carprofen (5-mg/kg) and lactated Ringer's solution (5-ml) was administered twice a day for a minimum of 3 days or until the animal was euthanized. MRI was performed 24-hrs after surgery.
Image acquisition
MRI was performed using a 9.4 T Bruker Biospec (Paravision 6.0.1). Animals were placed in a prone position in a head holder fitted with a teeth bar, inside a 38-mm diameter Litz coil (Doty Scientific, Inc). Animals were anesthetized with 4–5% isoflurane and maintained at 2–2.5% for the duration of the MRI, adjusted for each animal to maintain a stable respiration rate of 30–50 breaths per minute. Body temperature was maintained within one degree of 37°C with heated air. Automated, fieldmap-based B0 shimming within a 14.5-mm cubic volume over the C6 spinal cord was performed to minimize magnetic field inhomogeneity.
Phase contrast angiography
Phase contrast angiography images were used to visualize the vascular anatomy of the neck to position the pCASL labeling plane perpendicular to the vertebral arteries. (TR/TE = 30/3.25 ms, resolution = 0.208 ×0.208 × 0.208-mm3, FOV = 20 × 20 × 13-mm3, slice thickness = 13-mm, flip angle = 20°, NEX = 2, velocity max = 100-cm/s).
Pseudo-continuous arterial spin labeling
The pCASL module consisted of a previously-demonstrated protocol 26 using a 400-µs Hanning pulse, 1-ms pulse repeat interval, 5-µT average B1 amplitude, and 45/5-mT/m Gmax/Gmean. The labeling plane was positioned perpendicularly to the spinal cord at the C6 level at the magnetic isocenter for the studies in the naive rat. The label duration (LD) and post-label delay (PLD) were varied for each acquisition as specified below. For measurements of inversion efficiency (IE), the pCASL module (LD = 200-ms; PLD =10-ms) was combined with a flow-compensated gradient-echo sequence (fcFLASH): TR/TE = 225/3.5-ms, resolution = 0.281 × 0.281-mm2, FOV = 36 × 36-mm2, slice-thickness = 1-mm, NEX = 4.
For measurements of SCBF, the pCASL module (LD = 1200-ms, PLD = 200-ms) was first combined with a four-shot spin-echo echo planar imaging (EPI) sequence (TR/TE = 4000/16-ms, resolution = 0.375 ×0.375-mm2, FOV = 36 × 36-mm2, slice-thickness =1-mm) in addition to a non-selective pre-saturation hyperbolic sech pulse immediately after image acquisition to reset the magnetization. For axial imaging, the gap between the label and image planes was 3.6-mm, and 10 pairs of label and control images were acquired. The effect of LD was separately evaluated with durations of 0.8, 1.4, 2, 2.6-s. Background suppression (BGS) was employed to null cerebrospinal fluid (CSF) based on Bloch simulations and the T1 of CSF (4200-ms). 27 A single selective inversion hyperbolic-sech pulse was positioned superior to the labeling plane and occurred before the pCASL labeling module, at 1550-ms before image acquisition. BGS experiments were performed with a LD of 1200-ms and PLD of 200-ms. Sagittal images used the same protocol with either EPI or 8-shot Rapid Acquisition with Refocused Echoes (RARE) readout with a center-out acquisition of k-space lines using identical resolutions and timing: TR/TE = 4050/6-ms, resolution =0.313 × 0.313-mm2, FOV = 40 × 30 mm2, slice thickness = 2-mm, LD = 1.2-s. For all subsequent experiments, sagittal RARE images used an 8-shot and higher resolution of 0.156 × 0.156-mm2 (FOV =30 × 30-mm2). To maintain similar acquisition times, 6 label-control pairs were acquired. The contusion injury was at cervical level 5 and a portion of the lesion extended into C6. Therefore, the labeling plane was moved slightly caudal yet maintained at isocenter. IE was measured for each scan and averaged 0.77 (0.73–0.81) for all SCI experiments (n = 8). Proton-density images (M0) were obtained for all animals as the final image with a long TR (6000-ms). For quantification of SCBF, T1 maps were also obtained after the M0 image using the same TR and a non-selective inversion recovery at TI values of 200, 1500, 3000, 6000-ms. The total acquisition time for pCASL RARE was 14-mins.
Hadamard-encoded pCASL used the same labeling module divided into sub-bolus blocks of equal duration (50-ms) and a Hadamard-16 matrix (LD = 800-ms) along with a minimal PLD (14-ms). The full matrix was duplicated (i.e. mirrored) 28 with 3 repetitions for a total of 96 images across 16 delays (PLD = 14–764-ms). To accommodate the increased number of images, TR was reduced to 2000-ms and the inversion time for BGS was adjusted to 835-ms, for a total scan time of 43-mins. pCASL angiography was performed using the identical fcFLASH sequence as for inversion efficiency estimation with a 2-mm thick coronal imaging slice positioned over the vertebral and anterior spinal arteries. Selected combinations of label durations between 50 and 200-ms were used with PLDs between 5.8 and 100-ms. Pre-saturation occurred just after the imaging module but no BGS was used.
Data analysis
Data analysis was conducted using custom routines in Matlab (The Mathworks, Inc., Natick, MA) unless otherwise specified. Phase contrast angiography images were processed using the vendor software to produce angiography maps and magnitude images. Both images were used to examine the vascular anatomy of the cervical spinal cord, in particular the relationships between spinal cord position and the vertebral arteries. The contours of the spinal cord and vertebral arteries were manually delineated on images in the axial plane. A smoothing spline was fit to the center points of each structure to obtain the 3 D spatial position along the axial direction. The angular deviation between each of the carotid and vertebral arteries compared to the spinal cord main axis were calculated for each segmental level between C2 and C8.
Inversion efficiency was calculated as IE = |(ML–MC)/2MC| where ML and MC are the complex label and control signal intensities, respectively. ROIs were manually drawn within each carotid artery from the control images, excluding the outermost 1–2 pixels to avoid partial volume effects. For use in subsequent SCBF estimation for each animal, IE was averaged across both carotids.
For initial optimization experiments, the perfusion contrast is reported as the normalized change in magnetization (ΔM/M0) for each pair of label-control images. For the LD experiment only, M0 was not collected so perfusion contrast is reported as ΔM/Mcontrol. The temporal signal to noise (tSNR) was calculated as the mean divided by the standard deviation across all repetitions. SCBF was quantified using the standard kinetic model
17

For Hadamard pCASL, the 3 repetitions were averaged and images were decoded
35
into perfusion-weighted
where SCBF, ATT, and T1app are estimated parameters, and M0 and IE were measured experimentally for each dataset. T1b and

Finally, a delay-insensitive method,
36
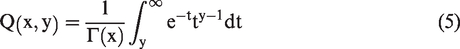
referred to as the summation method, estimates SCBF and ATT as the weighted summation of the individual delays without non-linear fitting. ATT is first estimated based on the weighted delay (WD) method described by Dai et al.
36
PCASL angiography images of the complex difference between the label and control were derived. For calculation of blood arrival times, simulations of the signal bolus were performed for a given LD and PLD across a range of arrival times including T1b, noting that a single line of k-space was acquired for each label or control preparation and presaturation was used, so the effects of RF excitation pulses were ignored. The minimum squared difference between the simulated and measured data was identified to find the most likely BAT for each voxel. 37 The estimated voxel-wise BATs were overlaid on the average ΔM image across all delays and durations.
Sagittal cord ROIs covered cervical levels 1–5. For healthy rats, ROIs were manually selected by anatomical segmental level determined by the intervertebral disks, avoiding the outermost 1–2 pixels. In the injured cords, the average cord T1 from was first measured from a subset of healthy animals (mean = 1.38-s, SD = 0.19-s, n = 3). Injury site ROIs included voxels greater than four standard deviations above the mean (T1 = 2.13-s). For direct comparison at the injury site, a ROI at C5 level was used in the healthy animals. To plot profiles of quantitative maps (Figure 7(b) and (c)), the spinal cords were straightened and aligned using the Spinal Cord Toolbox. 38 A whole-cord manual ROI was skeletonized to derive the centerline and was straightened. 39 Images were spatially aligned along the longitudinal axis using manually identified C2 and C5 midpoints. The straightened and aligned cord mask was used to obtain median values at each voxel along the longitudinal axis for each metric. Bootstrapped 95% confidence intervals were used to show the distributions.
Statistical analysis
All statistics were performed in GraphPad Prism v8.4. Comparisons of pCASL methodology including inversion efficiency, BGS, readout method, and comparisons of SCBF at different cervical levels were analyzed with two-tailed Wilcoxon matched-pairs rank tests. For comparisons of SCBF and ATT between healthy and spinal cord injured animals, two-tailed Wilcoxon matched-pairs, Mann-Whitney U and Cohen’s d effect sizes are reported. Contusion injury disclosed the animal’s group, therefore meaningful blinding was not possible. Significance was set at p < 0.05 and data is reported as median (interquartile range).
Results
Phase contrast angiography visualizes arterial anatomy
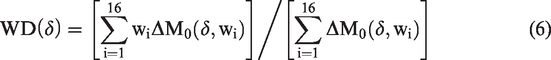
Phase-contrast angiography images were obtained to characterize the arterial anatomy and identify suitable labeling locations (n = 2). Both qualitative visual inspection and derived quantitative measures of angulation relative to the spinal cord axis (Figure 1(a) and (b)) demonstrate that at vertebral segment C6 and above, the vertebral arteries course through the vertebral foramen and are approximately aligned to the main cord axis. C6 is the most rostral level in which the vertebral arteries have only a minor deviation (8.4°) from the spinal cord main axis and from one another (11.4°). The labeling plane was positioned at C6 perpendicular to the spinal cord axis (Figure 1(c)) and could be positioned using anatomical reference images without the need for separate angiography.
Phase contrast angiography of feeding arteries in the rat cervical spine and pseudo-continuous arterial spin labeling (pCASL) set up and sequence. (a) The trajectory of the carotid and vertebral arteries is shown in magnitude (top) and maximum intensity projections (MIP) (bottom) The anterior (ASA) and posterior (PSA) spinal arteries are visible in the axial magnitude image, and the coronal MIP was pseudocolored for better visualization of each artery. (b) The deviation from the spinal cord main axis (top) and left-right deviation of the arteries (bottom) are shown by segmental level (n = 2). Data shown are mean ± SD. (c) pCASL label plane (green) oriented axially at C6 positioned at the magnet isocenter. The single-slice axial or sagittal image acquisition (blue) are shown along with optional background suppression (BGS; red). (d) Pulse sequence timing diagram with non-selective pre-saturation and selective inversion pulses 3950 ms and 1550 ms before imaging readout.
Optimized pseudo-continuous arterial spin labeling for the rat spinal cord
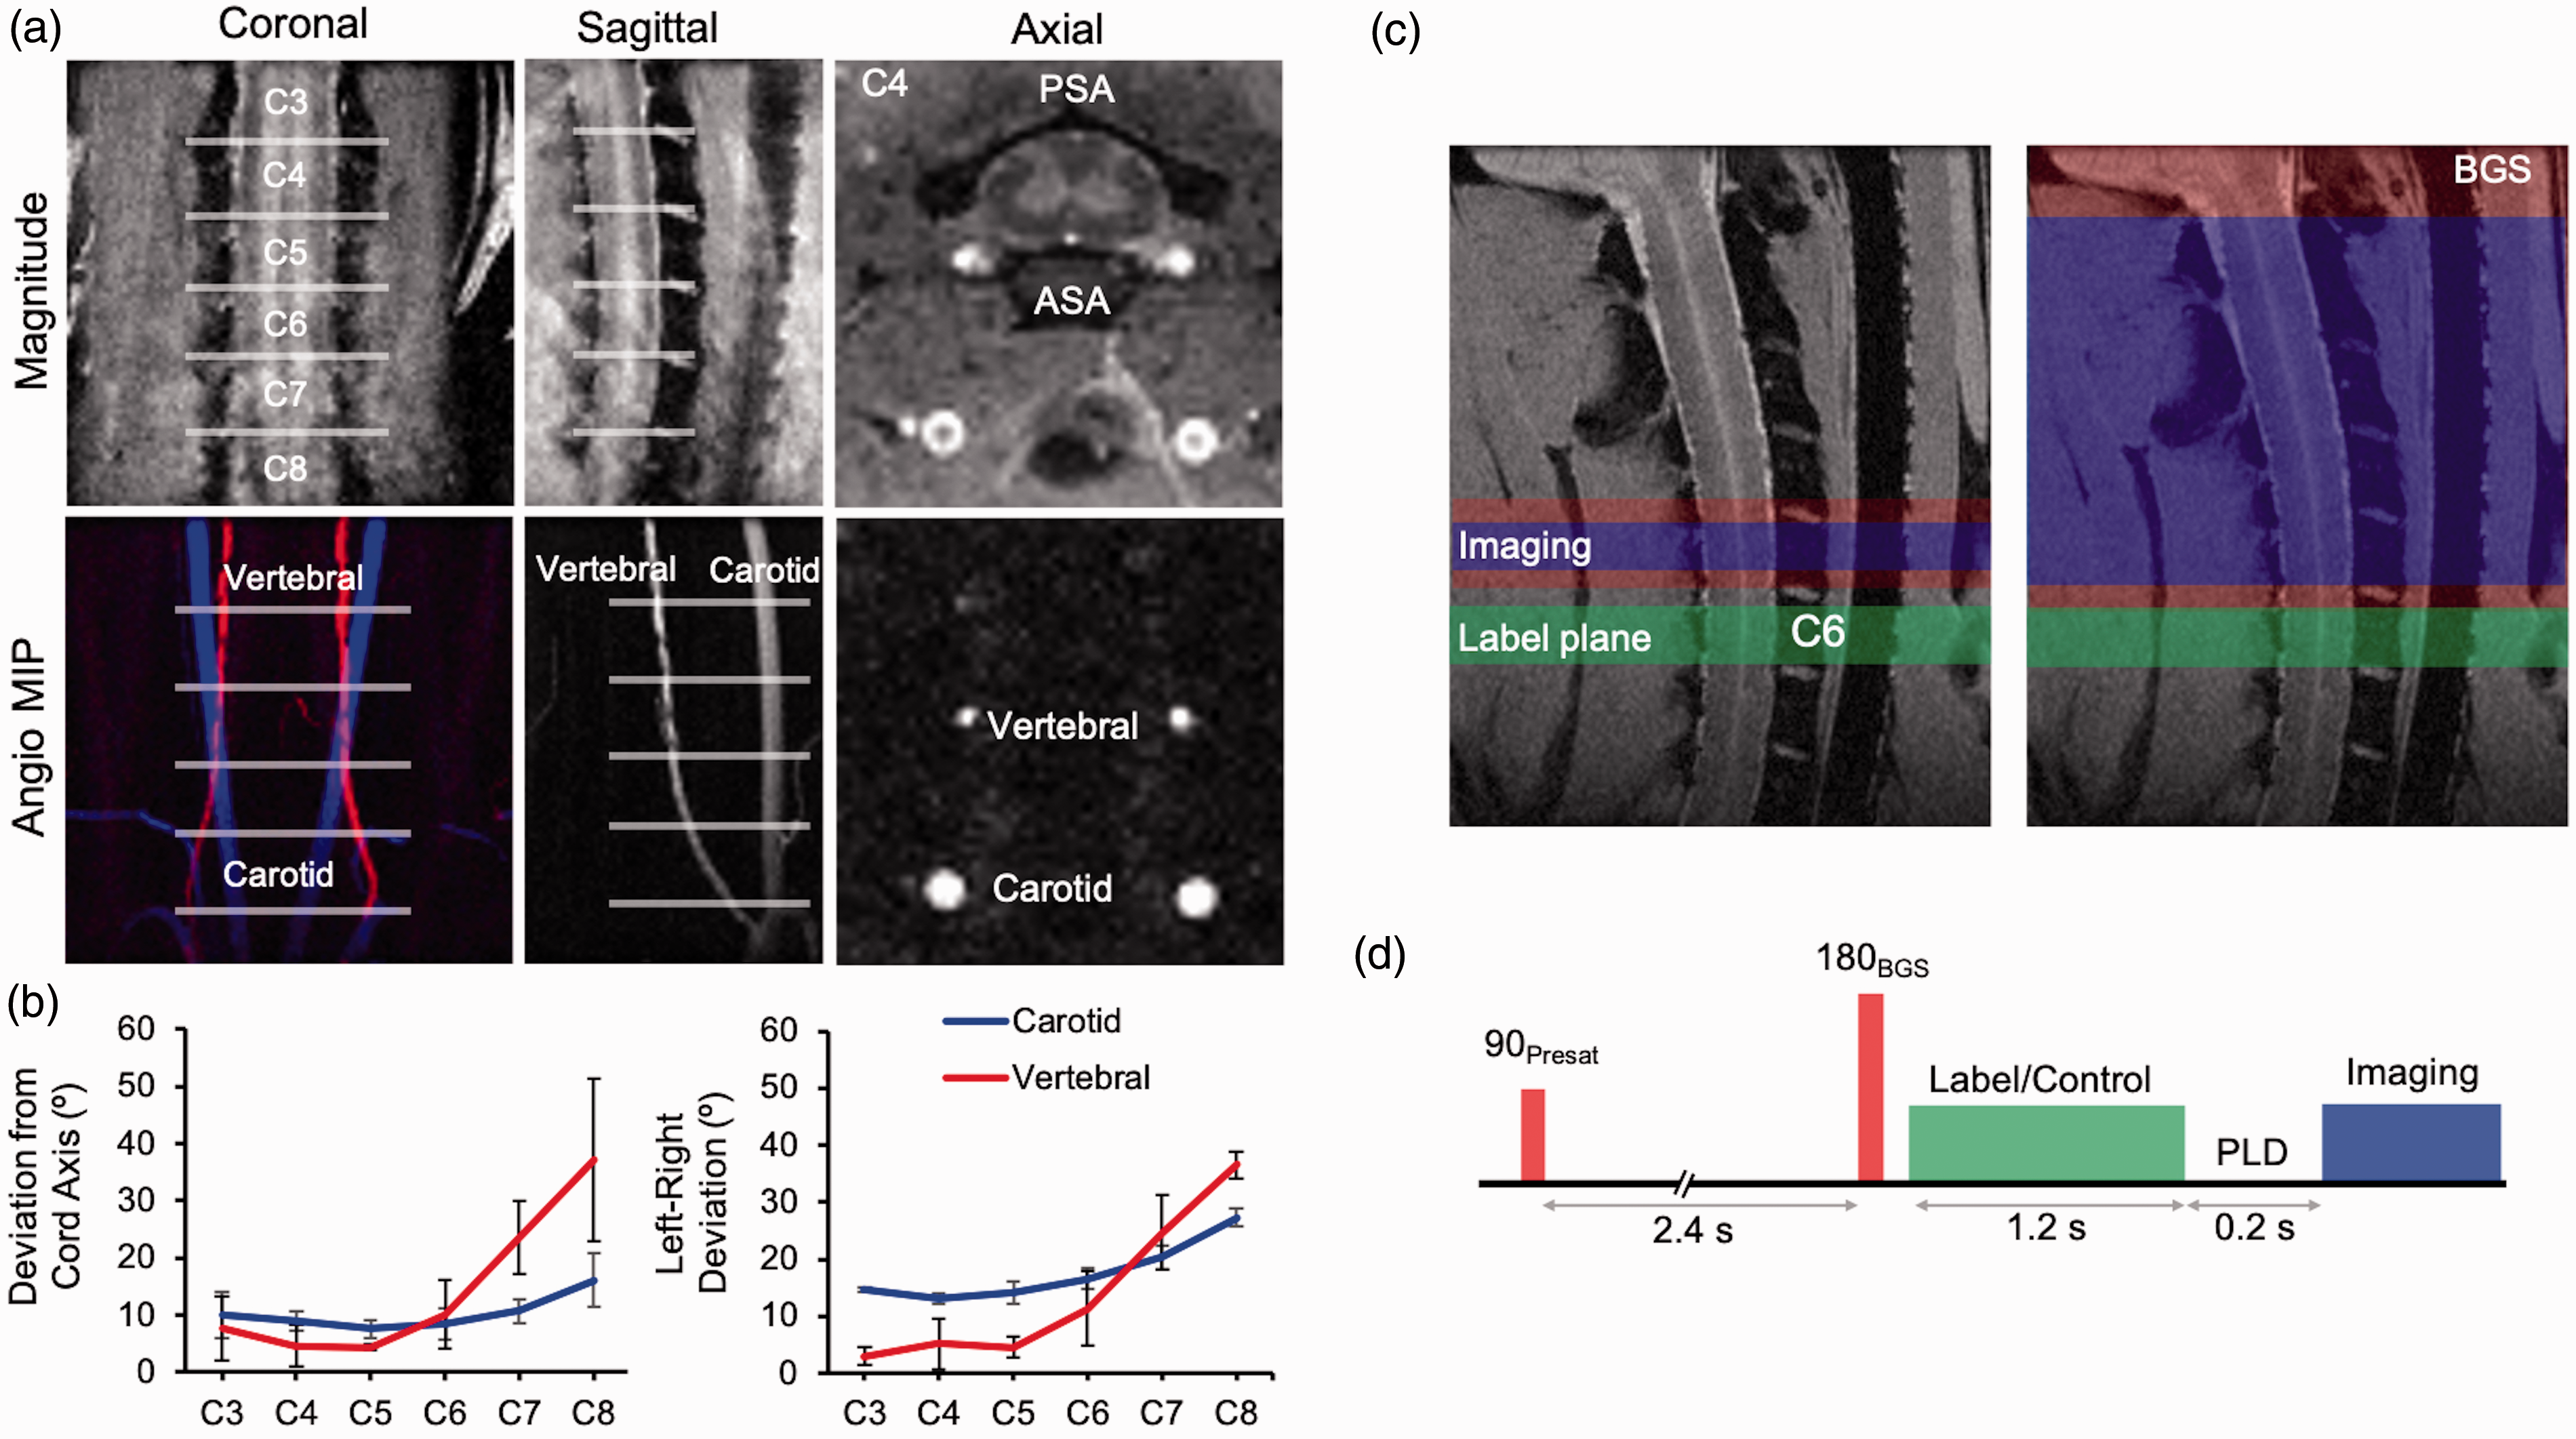
Initially, axial image readout was used, and further optimization was performed with sagittal imaging in later experiments. pCASL labeling combined with a gradient echo readout was used to assess inversion efficiency (IE) for all experiments. The differential contrast in complex-valued label and control images showed clear contrast in both the carotid and vertebral anterior arteries (Figure 2(a)). Measuring IE in the vertebral arteries was not possible due to limited resolution, therfore the carotid arteries allowed the most consistent IE measurements. Median IE was 0.80 (0.76-0.85) across all healthy scans (n = 17) in this study, which compares favorably with values of 0.85 found in brain applications. 40 No evidence of significant right-left asymmetry was found (Right = 0.80 (0.75–0.89), Left = 0.80 (0.74–0.84), W=–55, p = 0.20, Figure 2(b)). To account for possible variation between each animal (range = 0.62–0.91), IE was collected and used for subject specific SCBF quantification. LDs did not have appreciable effects on perfusion contrast (median =7.84, 9.10, 9.27, 8.99% for 0.8, 1.4, 2, 2.6 s respectively, n = 3). Background suppression (BGS) was evaluated to reduce artifacts due to motion or cerebral spinal fluid (CSF) pulsation with a single pre-labeling inversion pulse timed to null CSF (TI = 1550-ms). The BGS inversion pulse noticeably improved visualization of the gray matter and reduced pulsation artifacts (Figure 2(c)) without appreciable alteration of the perfusion contrast (no BGS = 3.40 (2.85-4.5), BGS = 3.60 (3.05–4.45)%, W = 8, p = 0.38) or temporal signal-to-noise (tSNR) (no BGS = 1.74 (1.34–2.63), BGS = 2.0 (1.46–2.52), W = 5, p = 0.63, n = 5) (Figure 2(d)). Normalizing perfusion contrast by IE did not change these results. Visual inspection of axial imaging showed higher perfusion in the gray matter, as expected.
pCASL sequence optimization: inversion efficiency (IE) and background suppression (BGS). (a) Real-valued label and control FLASH images show differential contrast in the vertebral and carotid arteries under label and control conditions and the calculated IE map. The image resolution was insufficient to obtain values from the vertebral arteries, and values were derived from the carotid ROIs. (b) Across all experiments with healthy animals in this study (n = 17), the median IE values were 0.80 and IQR (0.76-0.85), with no evidence of significant right-left asymmetry. (c) Maps of perfusion contrast (ΔM/M0) and temporal signal-to-noise (tSNR) for C5 axial EPI without (top) and with (bottom) BGS designed to null the cerebral spinal fluid (CSF). CSF nulling reduced artifacts and improved the appearance of the spinal cord gray matter in the original images and maps. (d) For n = 5, no differences in perfusion contrast or tSNR were evident between no BGS and BGS. Individual data points shown.
Sagittal imaging is more conventional for clinical applications of SCI, including better visualization of the longitudinal lesion location and extent. Sagittal imaging with an EPI readout also demonstrated perfusion contrast in the gray matter (Figure 3(a)) but was affected by prominent susceptibility artifacts caused by the surrounding vertebral column. As an alternative, a centric-readout fast spin-echo (rapid acquisition with relaxation enhancement; RARE) imaging readout minimized susceptibility artifacts while providing with high SNR. The two imaging readouts had similar perfusion contrast in the gray matter (EPI = 5.4 (4.1–6.03), RARE = 5.25 (4.33–7.08)%, W = 4, p = 0.63), n = 4) (Figure 3(b)). Sagittal imaging readouts had higher tSNR compared to axial, with RARE (6.72 (4.65–9.55)) having a distinct advantage over EPI (4.31 (3.13–4.74), W = 10, p = 0.13). The gray matter had clear perfusion throughout the C5 to C1 levels. Due to the gain in tSNR achieved with RARE, we increased the in-plane resolution from 0.313 x 0.313 (4-shot) to 0.156 x 0.156-mm2 (6-shot) for subsequent experiments while maintaining identical acquisition durations.
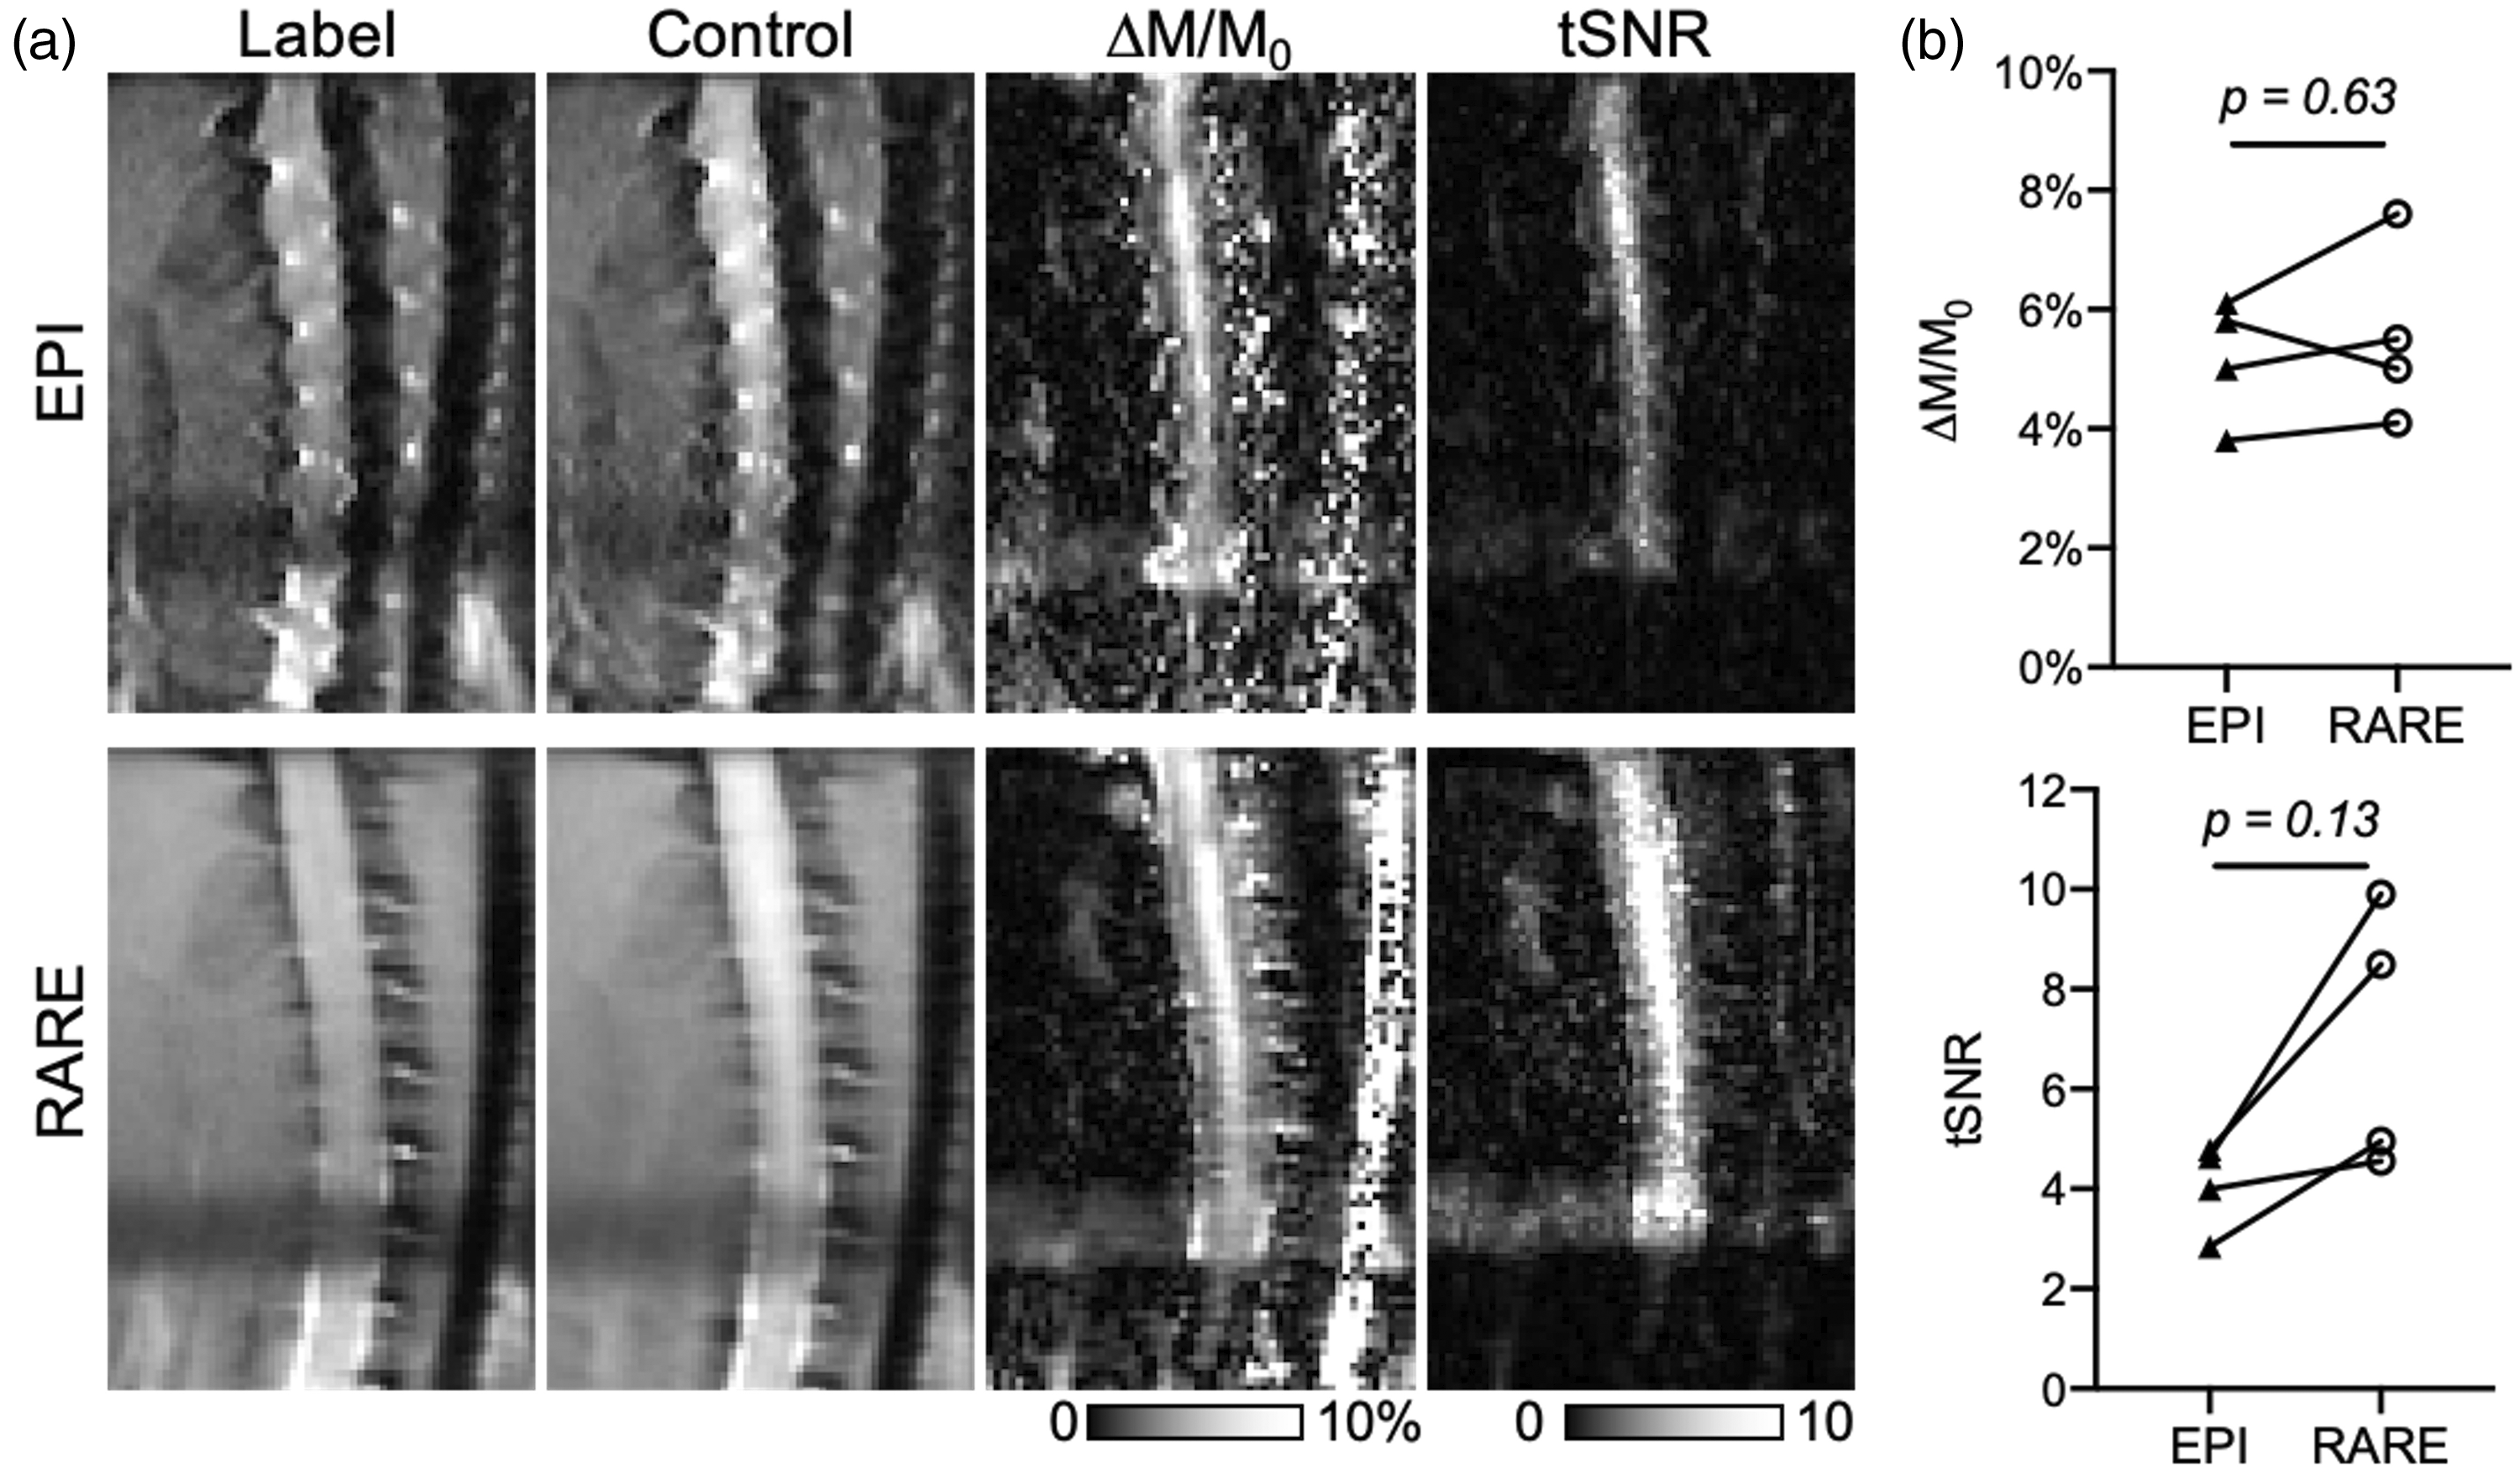
pCASL sequence optimization: sagittal imaging and readout. (a) In sagittal imaging with BGS, four-shot echo planar images (EPI) have prominent susceptibility artifacts, although perfusion contrast was evident in the spinal gray matter. Eight-shot centric spin-echo (RARE) images had reduced susceptibility artifacts and superior clarity in both perfusion contrast (ΔM/M0) and increased tSNR. (b) While perfusion contrast (ΔM/M0) was not different between EPI and RARE, tSNR was consistently greater with RARE imaging compared to EPI, although not statistically significant (n = 4). Individual data points shown.
Decreased SCBF identified with single-delay pCASL following contusion injury
The optimized pCASL labeling with centric-RARE readout including BGS was performed in five healthy control and five injured animals 24-hrs following an acute C5 contusion (Figure 4). At the injury epicenter, a clear decrease in SCBF was evident (56.17 (49.07–85.99)-mL/100g/min) compared to C5 in healthy animals (129.8 (97.91–152.4)-mL/100g/min, U = 2, p =0.032). SCBF was decreased at the injury site compared to C3 in the same injured animals but did not reach statistical significance (229.1 (195.5–289.4)) -mL/100g/min, W = 15, p = 0.063) (Figure 4(b)). Interestingly, the SCBF deficit appeared to be more focal than the edema seen on either inversion recovery images (TI = 1500-ms) or quantitative T1 maps (Figure 4(a)). Within the healthy cord, SCBF at C5 was decreased compared to C3 (194.9 (131.5-257.6)) -mL/100g/min, W = 15, p = 0.063) (Figure 4(b)) While not statistically significant, this indicated a possible relationship between estimated SCBF and the proximity to the labeling plane and prompted further investigation of arterial transit time (ATT).
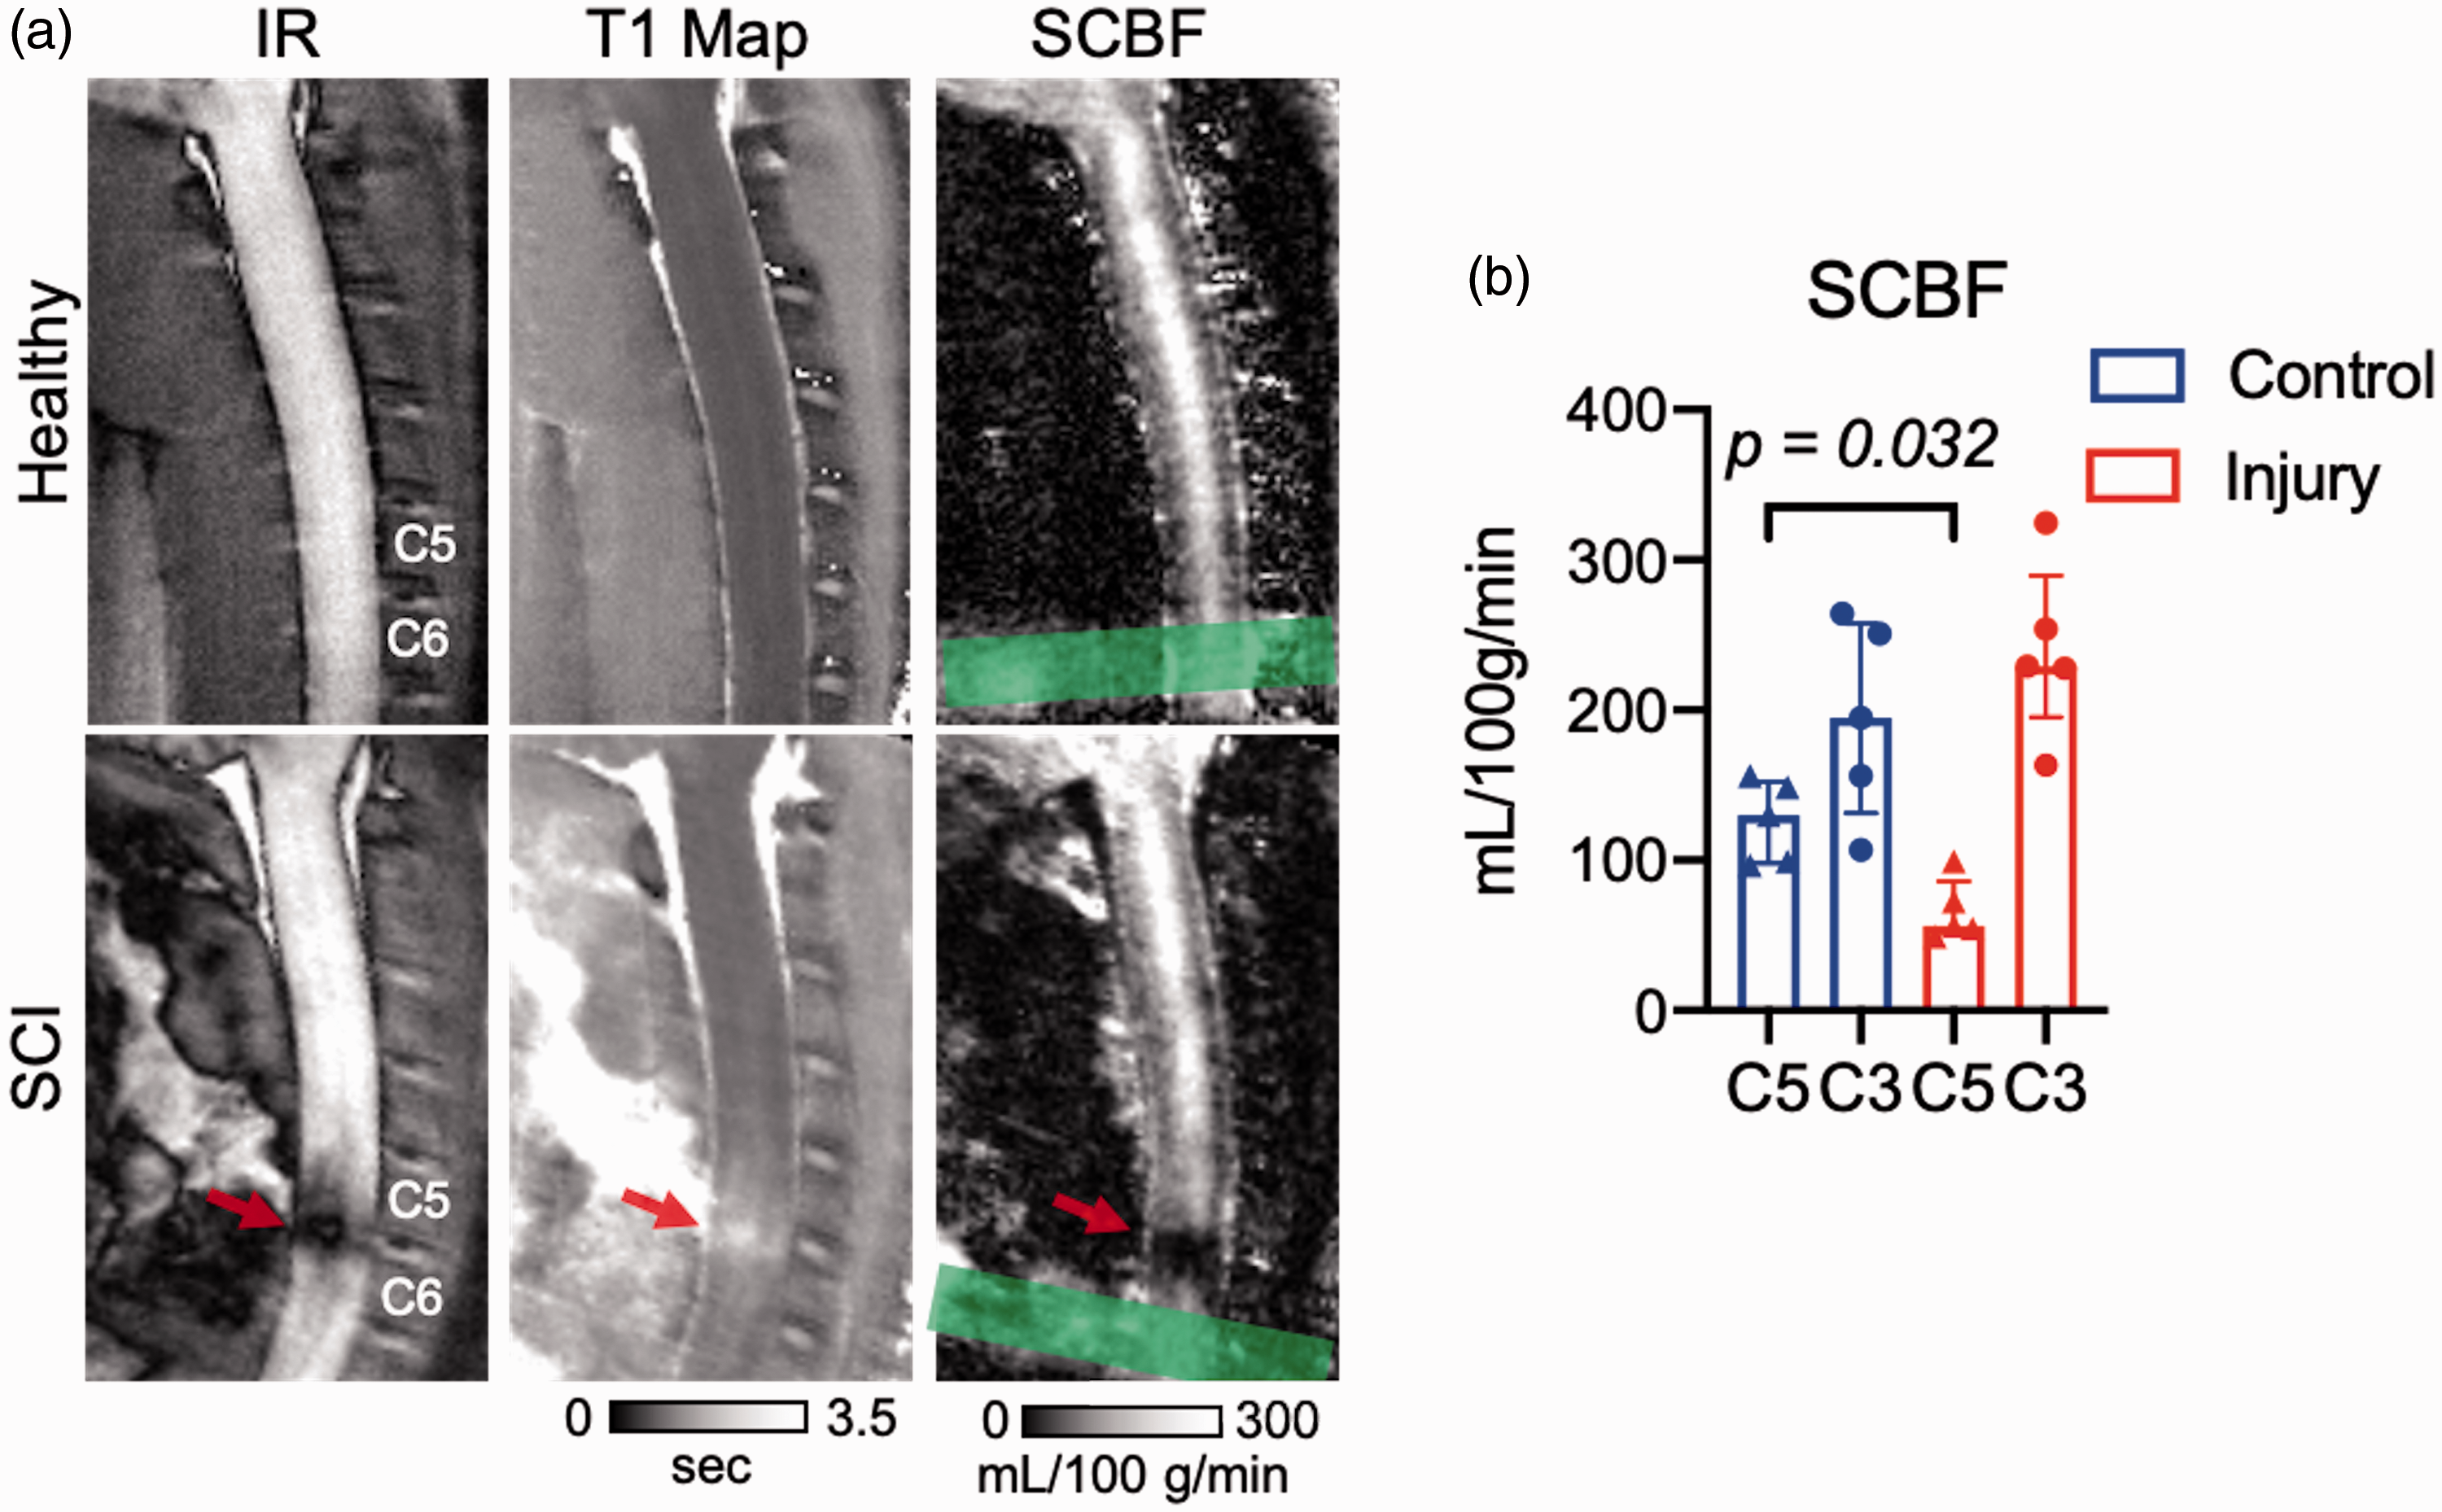
Decreased spinal cord blood flow following acute spinal cord contusion injury. (a) On inversion recovery images (TI = 1.5 s; left), the C5 contusion injury at 24 hours post injury appears dark due to its increased T1, also evident in the quantitative T1 maps (middle). Compared to the healthy spinal cord, which appears to have nearly uniform SCBF in the gray matter along C1 to C5 cord, the injury site has a markedly reduced SCBF in the epicenter of the injury (PLD = 300 ms). The location of the label plane is indicated (green). (b) n = 5 animals per group. SCBF was decreased at the site of injury (C5) in SCI animals compared to the same location in control animals. In both control and SCI, SCBF at C5 trended lower than SCBF at C3. Statistical significance *p < 0.05. Data shown are median (IQR).
Hadamard-encoded pCASL provides estimation of arterial transit time
To evaluate variability of ATT in the healthy cord and determine if ATT was prolonged in a contusion injury, time-encoded pCASL with a Hadamard labeling matrix was implemented. The decoded perfusion weighted images across multiple delays between 14–814-ms revealed the labeled water as it passed through the spinal cord tissue (Figure 5(a) Supplemental Movie 1). As expected, transit delays were generally a function of their distance from the labeling plane. Additionally, two regions with delays longer than the surrounding cord tissue were evident at vertebral segments C4 and C2, which appeared to be watershed areas.
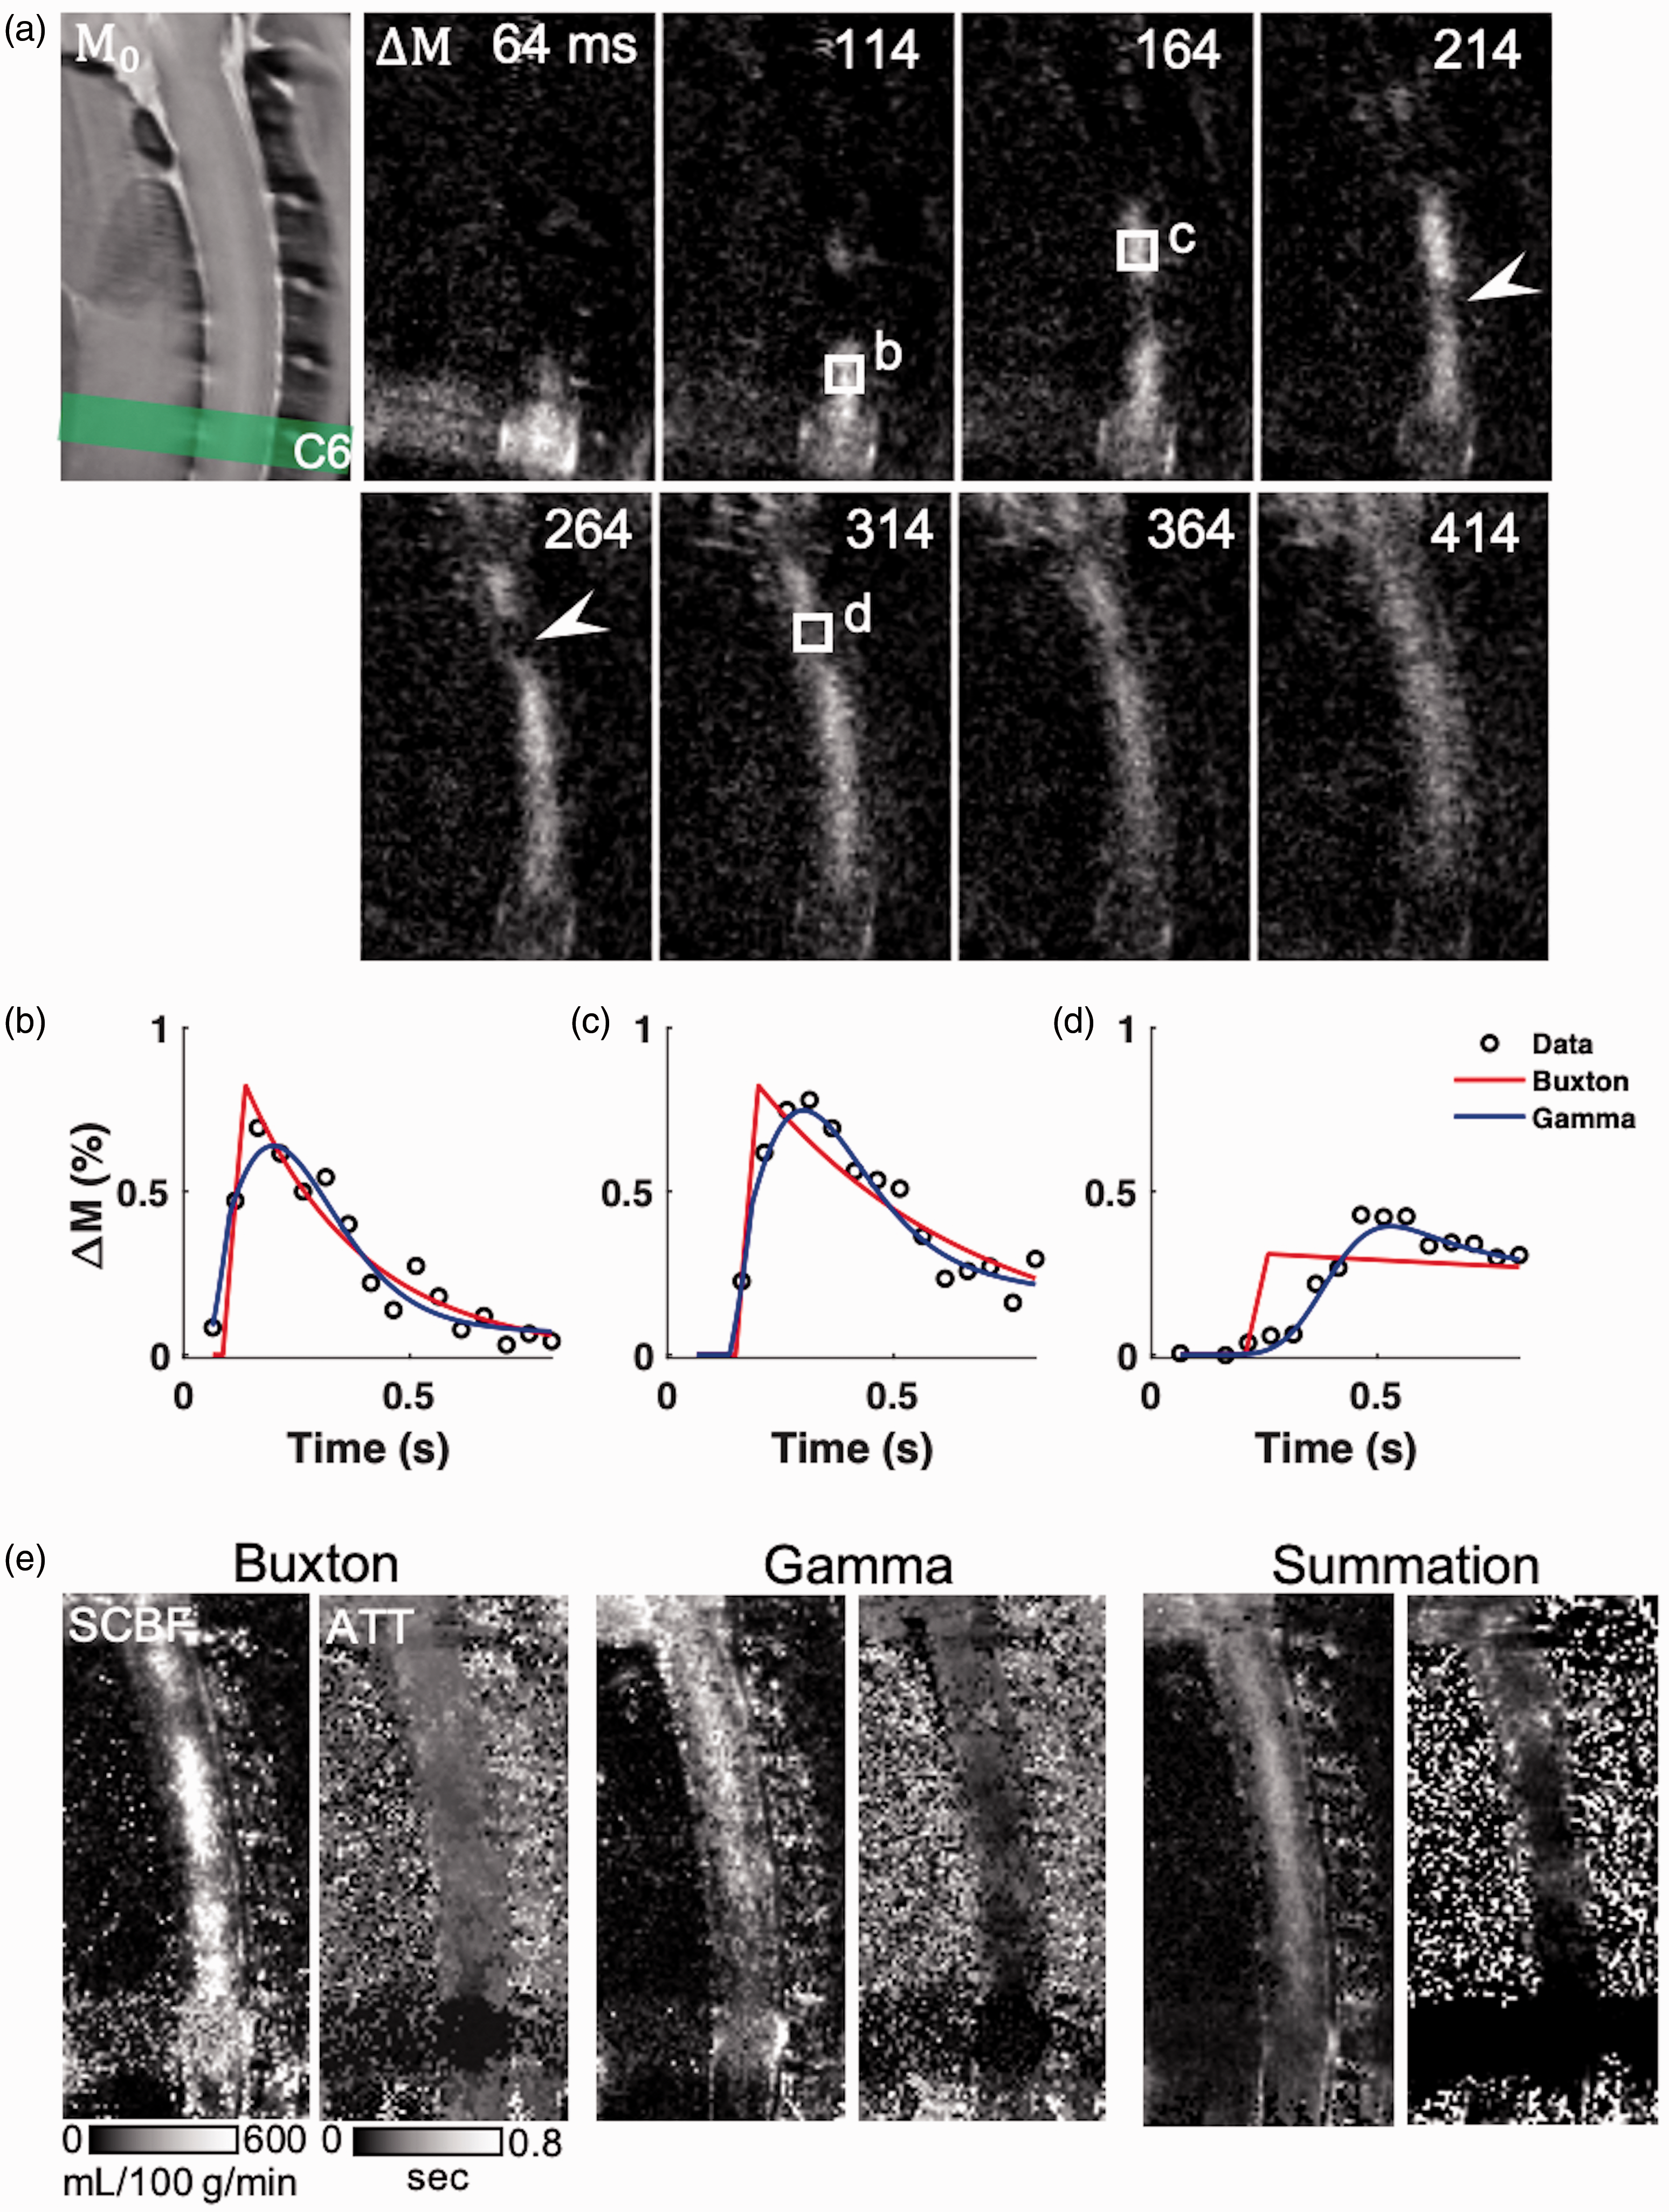
Transit delays in the healthy spinal cord with dynamic pCASL perfusion. (a) Representative ΔM Hadamard-encoded pCASL images for a subset of PLDs (64-414 ms, sub-bolus of 50 ms) in the healthy spinal cord. Labeled water exhibits transit delays related to both the distance from the label plane and the vascular anatomy. (b to d) In regions exhibiting watershed effects (arrowheads), the Buxton model (red) does not adequately capture the inflow, whereas a model including a gamma-dispersion bolus (blue) more reliably fits the measured data. (e) SCBF estimated from the Buxton model is reduced in watershed areas which is preserved in the Gamma-dispersion model. The summation algorithm has consistent SCBF throughout the cord. All three algorithms show longer transit times in the higher cord and watershed areas with differences in their estimated values.
To estimate ATT, quantitative modeling of the signal as a function of label delay was performed in the healthy cord (n = 6). The Buxton general kinetic model has a rising edge in the perfusion weighted signal intensity that begins at the ATT that blood first arrives in the voxel and increases with a duration equal to the bolus duration (i.e. LD). A variation of the model convolves the bolus with a gamma-variate function to model a spread in the arrival times (i.e. dispersion). Both models were estimated voxel-by-voxel with non-linear fitting. As evidenced in Figure 5(b) and (c), both models fit the data similarly. However, in regions with watershed effects (Figure 5(d)), the gamma model has a clear advantage. Compared to the Buxton model in which SCBF was variable throughout the cord and lower in the watershed regions (Figure 5(e)), the gamma model had a more uniform SCBF across the C5 to C1 spinal cord, although the non-linear fitting produced inconsistent fits as evidenced by the non-uniformity of the resulting maps. Across the cervical cord, goodness-of-fit measurements did not show appreciable differences between the models (Buxton R2adj = 0.48 (0.38–0.53) and gamma R2adj = 0.51 (0.45–0.55)). An alternative algorithm that uses a straightforward weighted sum of the signals to estimate both ATT and SCBF was also compared. This summation method avoids non-linear fitting and the SCBF and ATT maps appeared more uniform throughout the cord. The whole-cord gray matter mean SCBF from each of the models was 342.88 (260.39–405.40), 340.32 (292.42–358.88), and 219.58 (171.04–251.66)-mL/100g/min for the Buxton, gamma, and summation models respectively. ATT values for the three models were 0.27 (0.25–0.27), 0.17 (0.17–0.18), and 0.23 (0.18–0.26)-s.
Blood arrival times in vasculature are consistent with spinal cord perfusion patterns
The watershed effects, which were consistent across three healthy animals, prompted further investigation of the arterial anatomy. pCASL angiography (Figure 6) was performed with multiple, separate combinations of LD and PLDs using a gradient-echo readout of a thick slice positioned across the anterior spinal cord (Figure 6(a)) to capture the arterial vasculature supplying the cervical spinal cord. The raw images (Figure 6(b)) show the anatomical location of the slice, with the complex difference between label and control clearly revealing the vasculature. At short LDs and PLDs, the leading edge of labeling bolus was evident in the ascending vertebral arteries with more of the feeding vasculature evident with longer LDs and PLDs (Figure 6(c)). The blood arrival times (BATs) were estimated using Bloch simulations of the signal behavior across all durations and delays (Figure 6(d)). Branching off of the vertebral arteries were two anterior segmental medullary arteries at C5 and C3 that conjoin the anterior spinal artery (ASA). This vascular pattern was consistent across three separate animals, although not all animals were obtained with sufficient numbers of label duration/delay combinations to permit BAT mapping. With respect to the prior results, these segmental arteries were consistent with regional areas in the cord with short arrival times whereas the ASA at C4 and C2 has prolonged arrival times. Collectively, these angiography results demonstrate the regional blood arrival times at different levels of the cervical cord are consistent with delays in the feeding vasculature to the ASA.
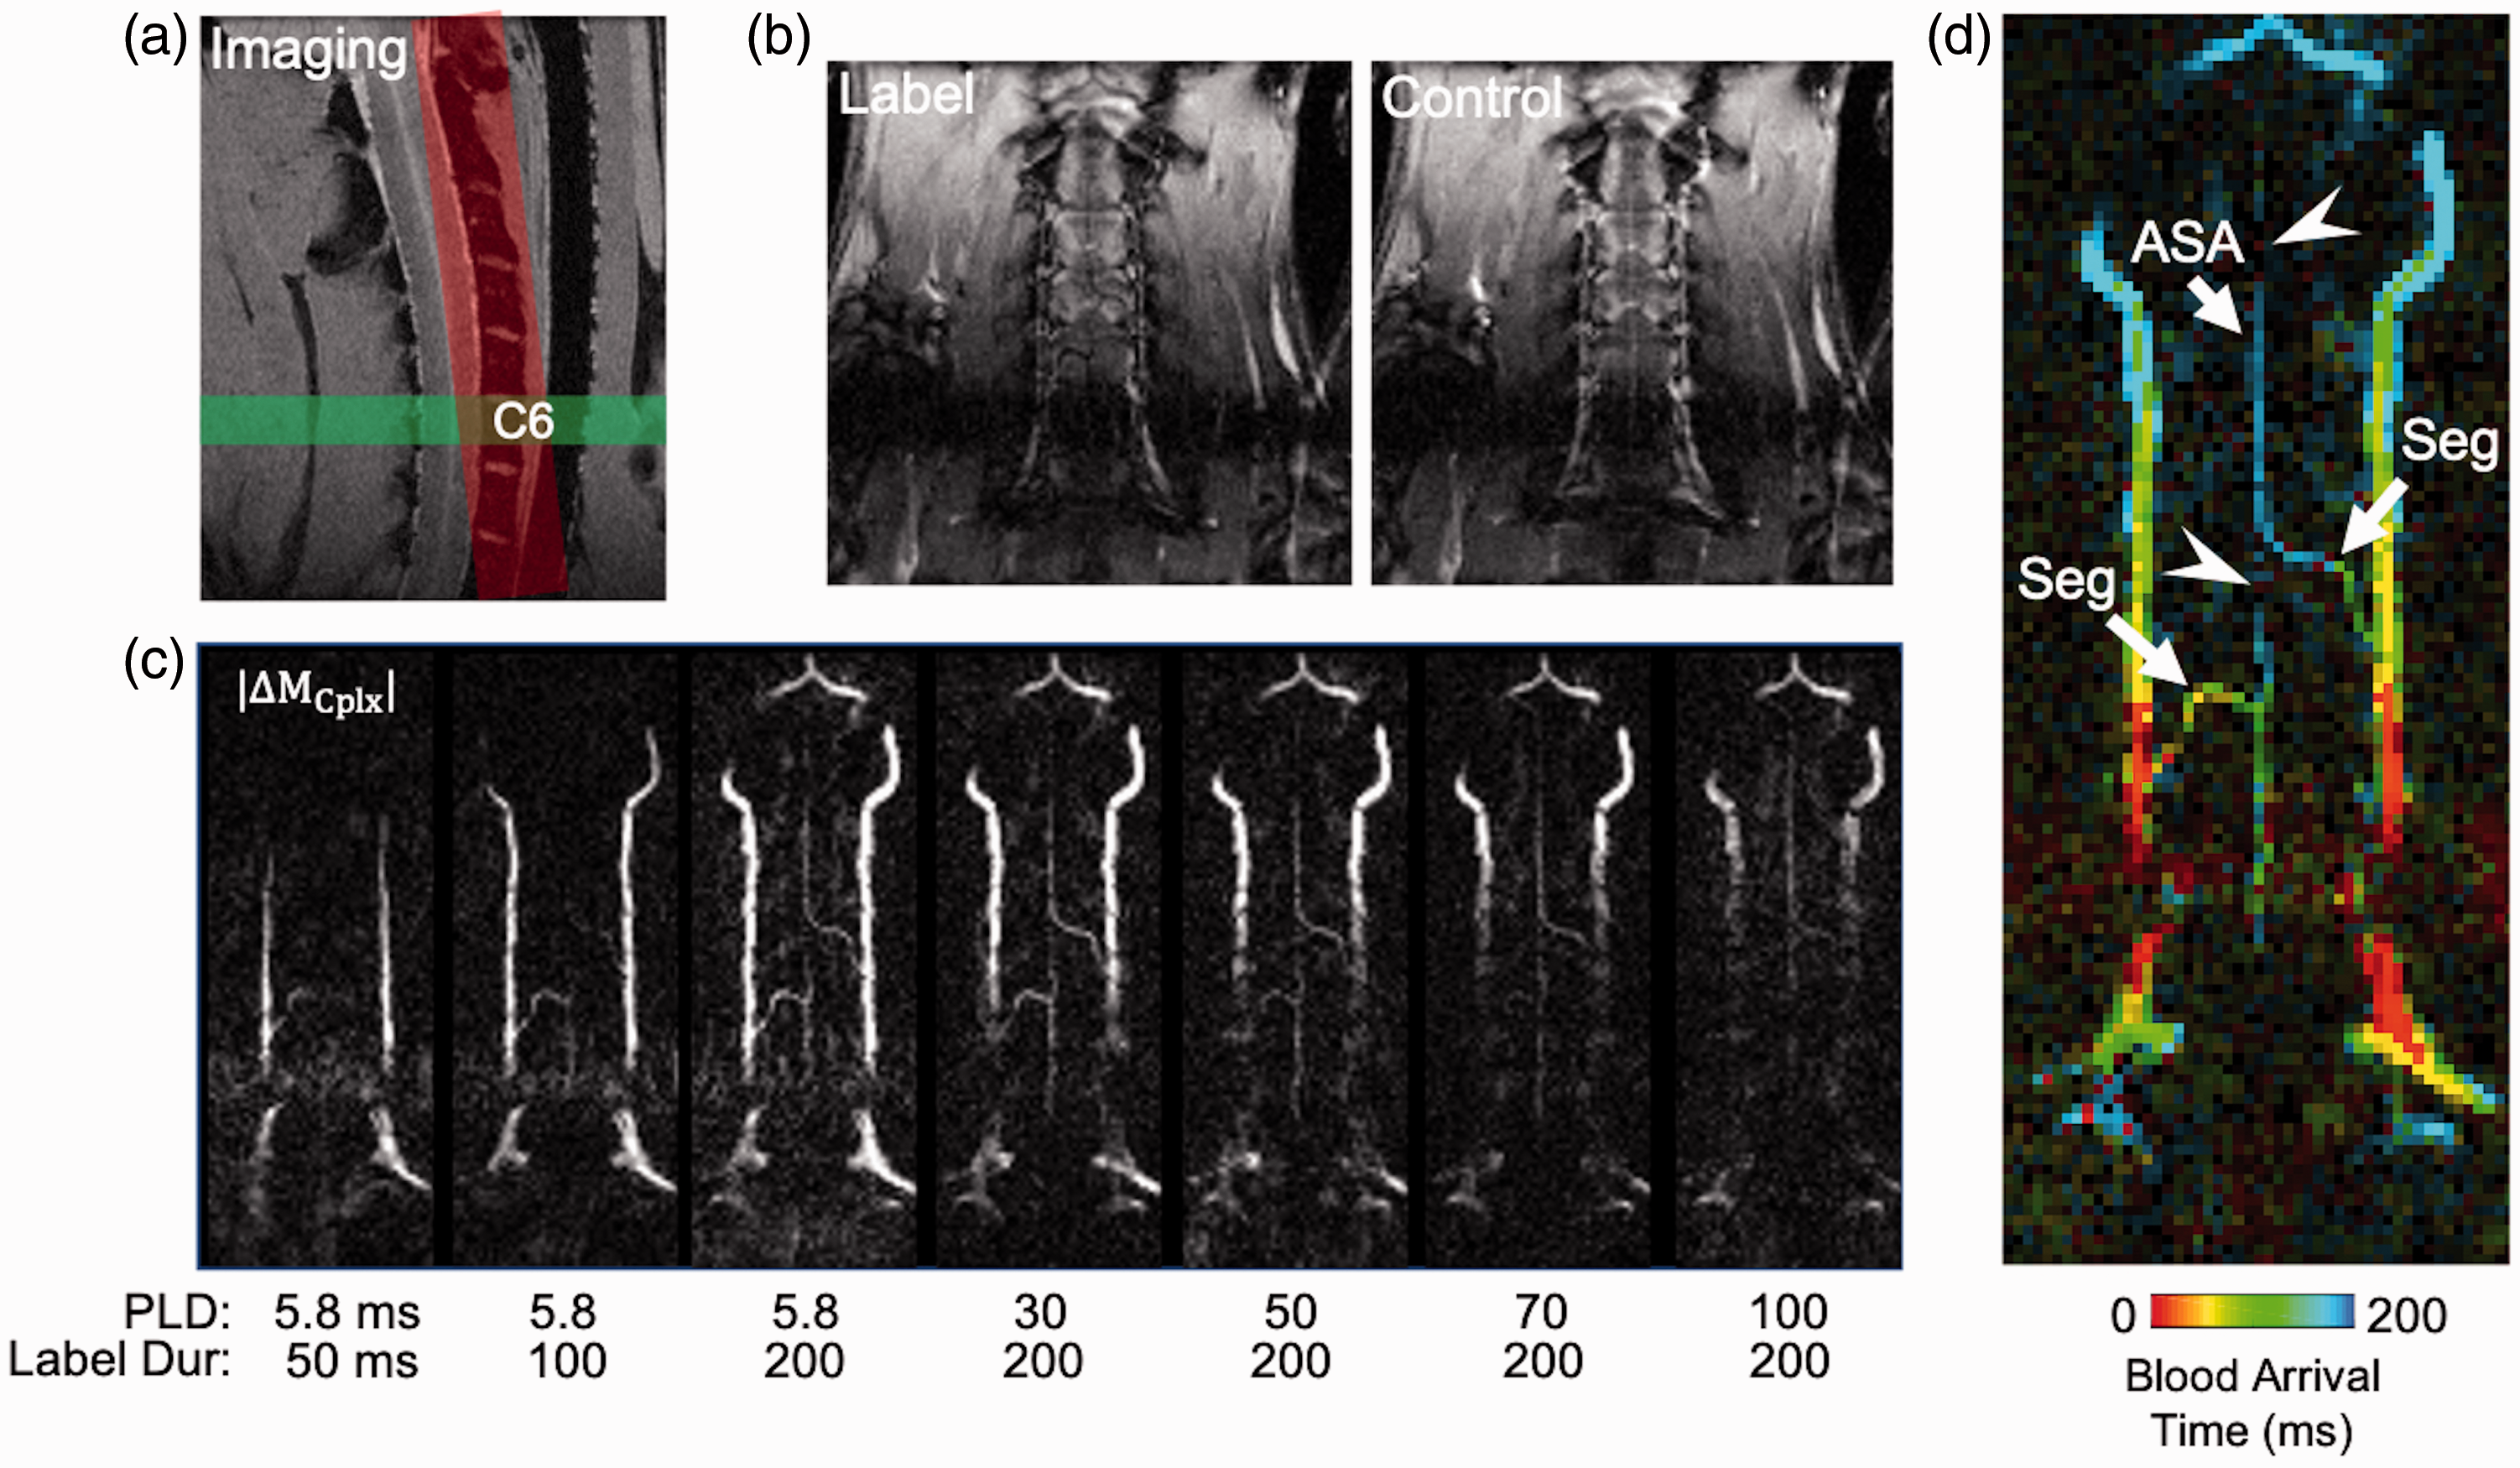
pCASL angiography of the feeding vasculature. (a) The C6 label plane was combined with a FLASH readout of an oblique coronal imaging plane positioned over the ventral cord. (b) Magnitude label and control images from a single delay depict the anatomy at the imaging slice. (c) The complex difference images at each combination of label durations and post-label delays reveal the transit of blood from the large vertebral arteries to the anterior segmental medullary arteries (Seg) into the anterior spinal artery (ASA). (d) Quantitative maps of blood arrival time show the delays at each level of the feeding vasculature, also revealing watershed area consistent with the previous perfusion results (arrowheads).
ATT-corrected SCBF achieved with dynamic pCASL in healthy and injured animals
The Hadamard-encoded pCASL was performed in 6 animals with an acute contusion injury to estimate and account for ATT. Equal numbers of male and females were used and there were no significant sex differences in either healthy or injured animals for measures of SCBF or ATT. All further results are pooled. Supplemental Movie 2 shows the perfusion contrast at varying PLDs in a representative injury. Tissue T1 measured by inversion recovery was increased at the C5 level of injury and above the injury site (Figure 7(a)). Across cervical levels, SCBF was more consistent after ATT correction (Figure 7(b)) suggesting that differences between segments C3 and C5 in the single delay experiments were due to differences in arrival times. Confirming prior results, SCBF was decreased at the C5 injury compared to the same anatomical region in the healthy cord (Figure 7(b) and (d)) for both gamma (injury = 120.3 (81.62–127.9), control = 226.7 (169.5–333.8)-mL/100g/min, U = 0, p = 0.002) and summation (injury = 74.17 (63.95–87.53), control = 201.0 (186.1–260.8)-mL/100g/min, U = 0, p = 0.002). ATT was slightly elevated at the injury site compared to the same region of the cord in healthy animals (Figure 7(c) and (d)) for both gamma (injury = 0.20 (0.14–0.22), control = 0.10 (0.09–0.12)-s, U = 2, p = 0.009) and summation (injury = 0.21 (0.07–0.25), control = 0.04 (0.03–0.11)-s, U = 5, p = 0.04). In consideration of the performance of the algorithms to detect injury changes, the effect size of SCBF estimates between the injured and healthy spinal cord was greater for summation model (Cohen’s d = 4.7), than the gamma model (Cohen’s d = 2.4), whereas for ATT, the gamma model had a larger effect size (2.2) than the summation method (1.5), highlighting their differential sensitivity and stability to SCBF or ATT.
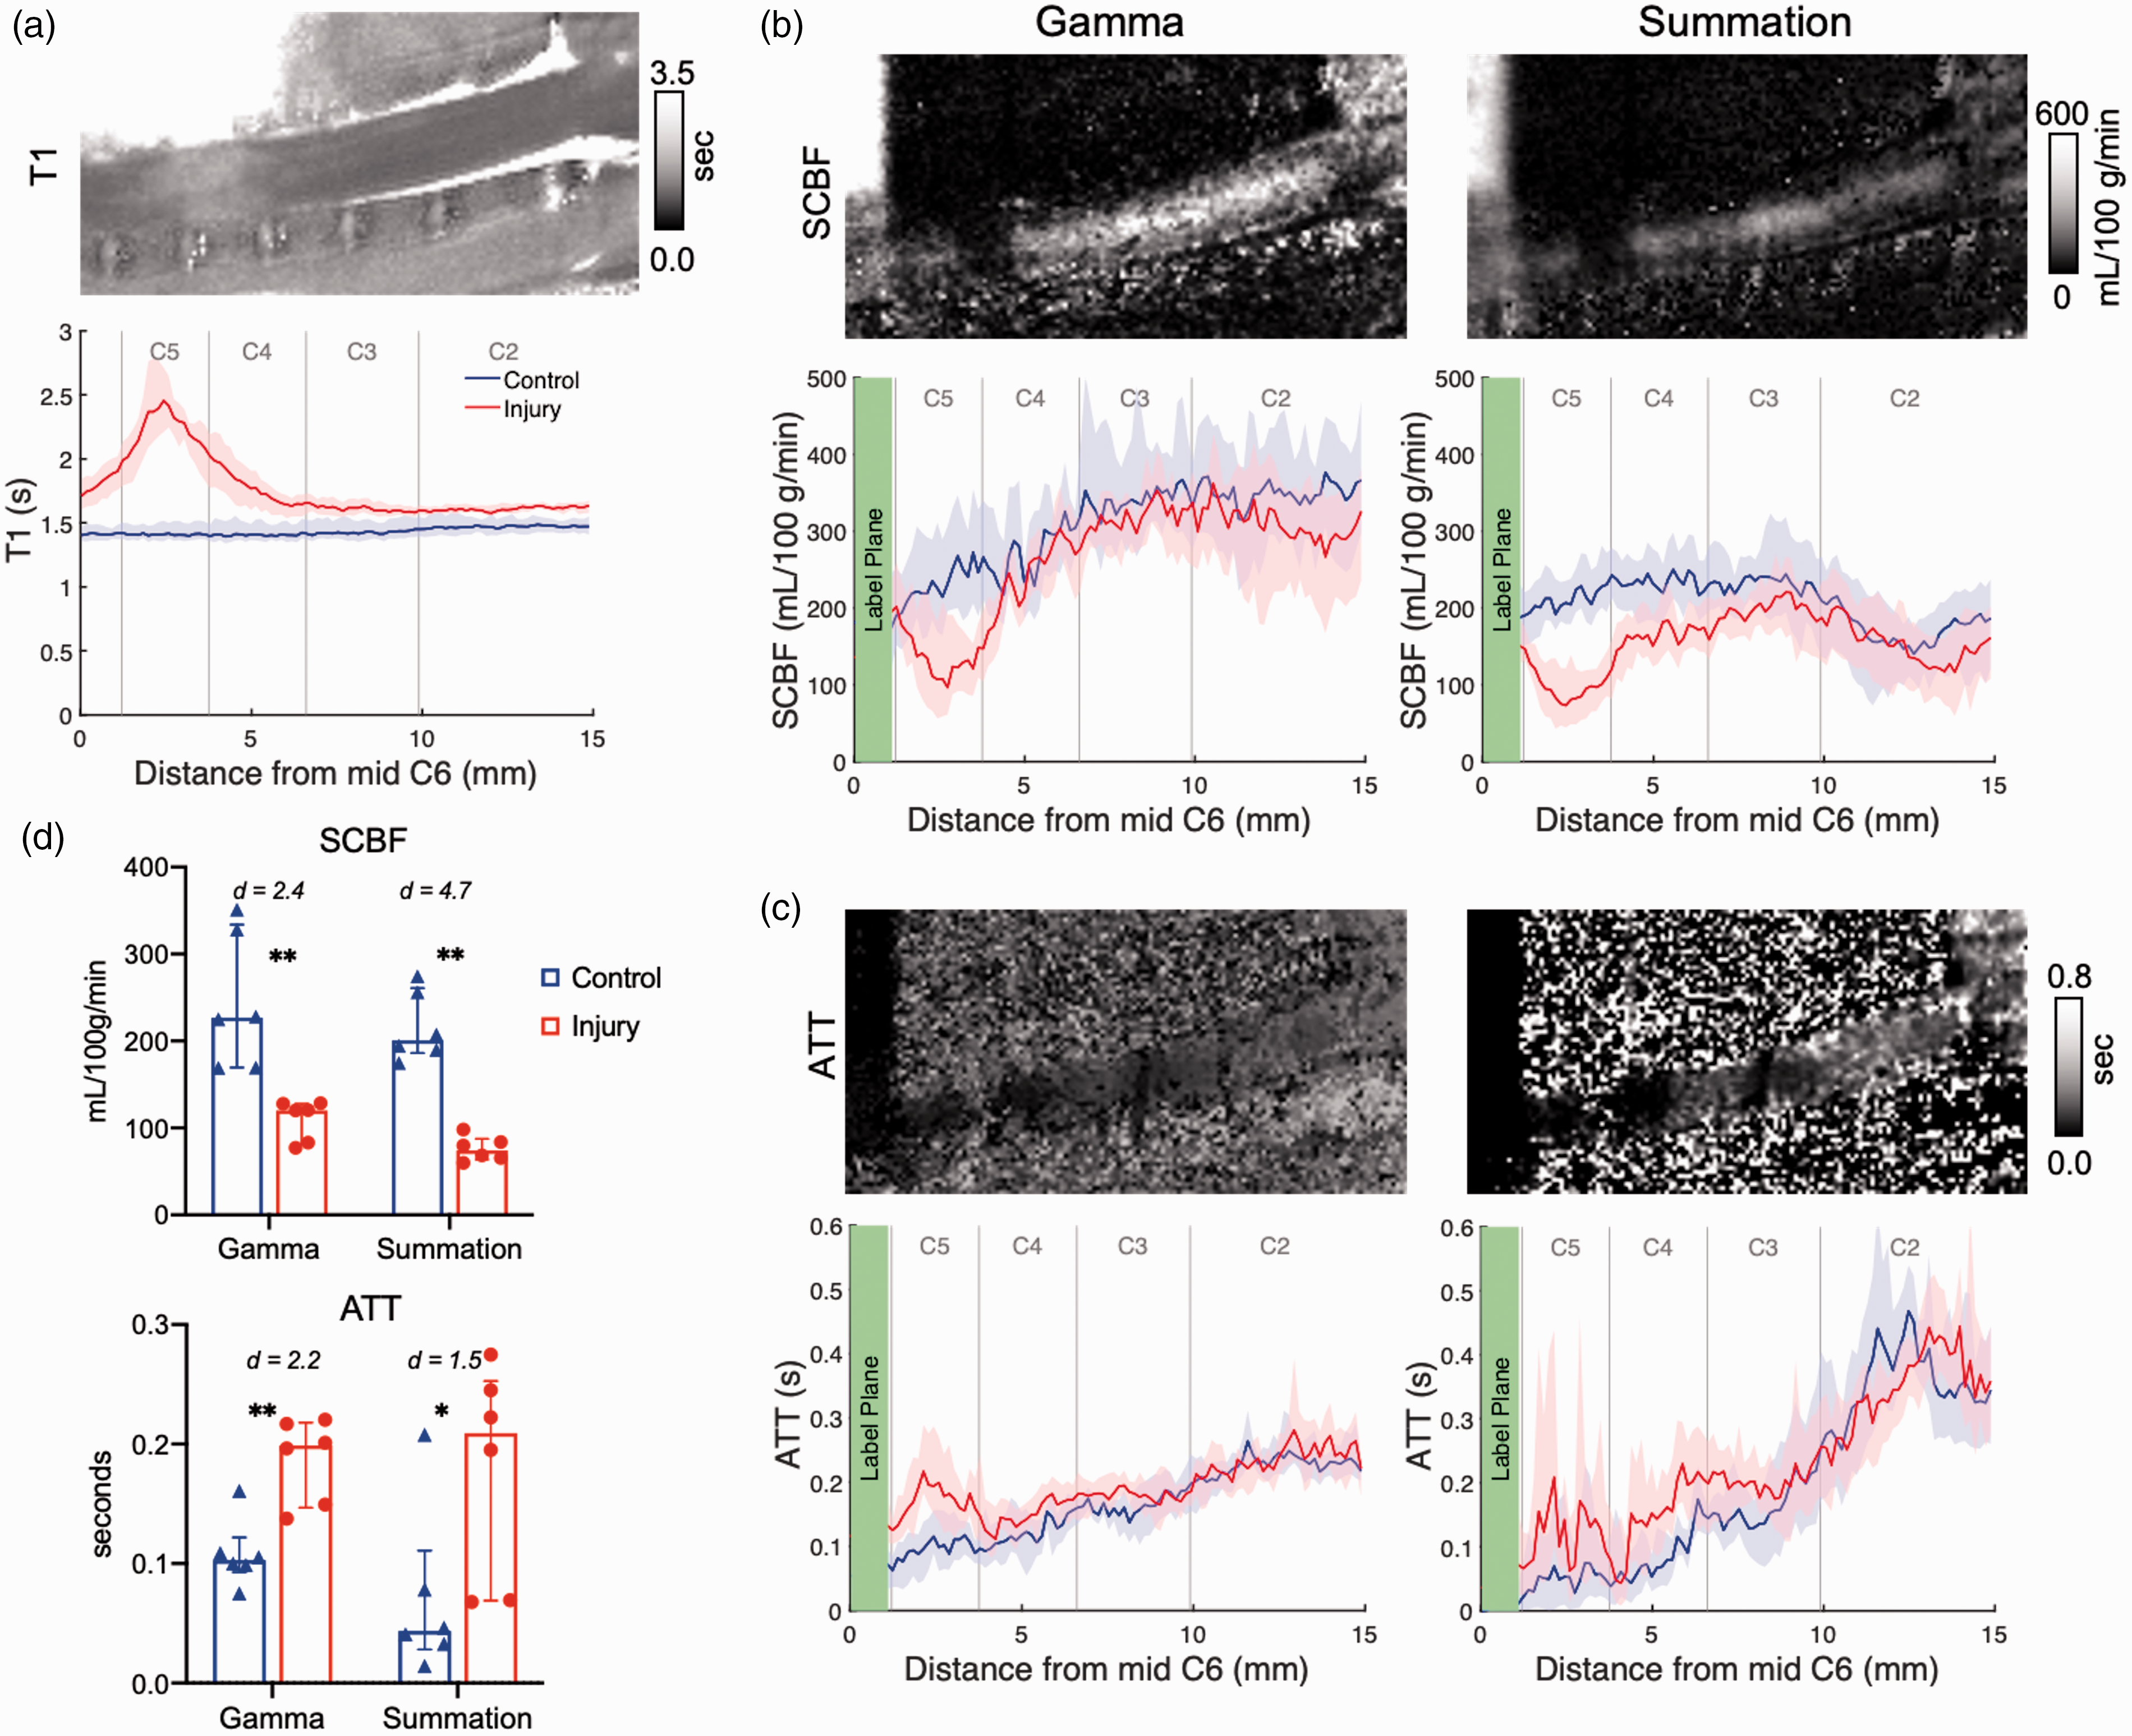
Quantitative T1, SCBF, and ATT in the acutely contused spinal cord. (a) T1 is consistently elevated at the injury epicenter and ascends away from the injury (red) compared to the control cord (blue) (n = 6 each). (b) Spinal cord blood flow (SCBF) is consistently decreased at the injury site in both the Gamma and Summation-estimated maps. (c) Arterial transit time (ATT) is slightly elevated in the injury site. (d) For n = 6 per group, differences in SCBF between the C5 injury site (red) and corresponding control cord (blue) are similar for two algorithms, which are consistently greater than those for ATT. Statistical significance *p < 0.05, **p < 0.01. Data shown are median (IQR) and bootstrapped 95% confidence intervals.
Discussion
Here, we systematically optimized pCASL to non-invasively monitor perfusion of the cervical spinal cord in healthy animals and in an animal model of contusion injury. Reports of ASL in the human or animal spinal cord are considerably lacking compared to the well-established utility in the brain, with only a small number of reports published.10,15,16 Collectively, our results highlight a protocol that includes labeling at the C6 vertebral arteries, a spin-echo readout and CSF-nulling background suppression to provided clear depiction and quantification of SCBF without prominent artifacts. The combined perfusion and angiography in the healthy cord demonstrated watershed areas with prolonged and dispersed transit times driven by the segmental arterial supply to the anterior spinal cord. Finally, application to an acute, moderate contusion injury reveals prominent reductions in blood flow at the site of injury with lesser increases in transit times compared to the surrounding healthy tissues.
The efficiency of labeling is critical for success in pCASL applications. In this work, the labeling plane was positioned at the C6 level where the vertebral arteries are within the spinal foramen and perpendicular to the spinal cord. While this places practical constraints, particularly with injuries occurring at or near this level, labeling planes positioned lower in the cord could diminish labeling efficiency40,41 although this has not been investigated systematically. In the human cervical cord, the vertebral arteries have a similar path and similar considerations of label plane positioning are expected. Moreover, the labeling plane was always located at the magnet isocenter in these studies to reduce magnetic field (B0) complications and related RF phase inconsistencies that may reduce labeling efficiency or increase variability. 42 It is anticipated that these constraints can all be relaxed in future applications with appropriate technical corrections including calibration 26 or multi-phase labeling.41,43 This work was limited to the cervical spinal cord, the most prevalent injury location worldwide. 44 Optimization of the labeling plane location will be necessary for thoracic and lumbar levels with consideration of the unique spinal cord blood supply to these areas. 45
Minimization of artifacts in spinal cord MRI is a challenge that often requires methods specifically optimized to the cord. Background suppression in ASL has been widely adopted and is recommended to diminish signal from tissues and CSF that cause motion artifacts. The short transit delays in the rodent restrict BGS schemes in which multiple post-label inversion pulses are used to minimize signals across a range of T1 values. A straightforward solution to null CSF improved image quality without effects on quantitative SCBF values. Susceptibility artifacts are also a particular challenge, and while multi-shot EPI provides suitable images in the axial plane in rodents, 46 prominent and regular artifacts were evident in the sagittal plane that cannot be compensated with magnetic field shimming. A fast spin-echo (RARE) readout improved image quality and substantially improved tSNR which further allowed acquisition of high-resolution sagittal images in both the healthy rat and a cervical cord contusion model. In the human cervical cord, ATT values are expected to be shorter than those current brain pCASL protocols are optimized for, which will necessitate optimized BGS.
A notable limitation of this study is the use of a single slice. This removed slice-timing delays, which could have major effects on the ASL signal in the rat, since total image readout time (96-ms) is on a similar time scale as the range in transit times (>200-ms). In a clinical setting, the multi-shot readout has the potential negatively affect signal due to motion that is not as controlled for as in the rat. 3 D acquisitions are recommended for brain applications 40 and a fast spin-echo based 3 D readout may be necessary to improve spatial coverage and overcome the slice-delay effects, although this could increase the scan times and may not be suitable for direct translation to human studies. In human applications and at lower field strengths, single-shot or limited multi-shot readouts may be more efficacious. On the other hand, in human SCI, mid-sagittal T2-weighted fast spin-echo imaging is the preferred MRI diagnostic method and is robust to susceptibility artifacts. This may support translation compared to EPI or gradient echo methods that are even more problematic after injuries where the vertebral column abuts the cord in cases of compression, dislocation, or fracture and can encounter artifacts due to hemorrhage in the cord.
The time-encoded pCASL and related angiography reveal watershed areas and feeding vasculature that are unique to the cervical cord. The single compartment Buxton model insufficiently described the data where perfusion exhibited delayed or broadened arrival compared to the canonical model, and the gamma variate model consistently fit the measured ΔM0 values better. It is not clear whether the segmental artery anatomy is strain or animal specific. In the human, the anterior and posterior spinal arteries are fed by the vertebral arteries in the cranial cavity. 47 Additionally, it is reported that segmental medullary arteries feed the spinal arteries at C3, branching from the vertebral artery, and at C6 or C7, from the ascending cervical artery. 48 The number and precise position of segmental arteries can vary between individuals47,49 and may contribute to variation in ATT and watershed areas. Optimization of a pCASL protocol for human translation will require consideration of individual variation in the vascular anatomy.
Based on our results, a contusion injury caused greater changes in SCBF than in ATT, indicating that controlling for the ATT is likely more important than measuring it as a biomarker of injury. Consequently, two strategies are recommended. In the rat, a long labeling duration 50 appears to provide the least sensitivity to transit delays for perfusion estimation. In our results (Figure 6), single delay pCASL provided clear SCBF decrease at the injury site compared to both rostral regions in the injured animals and healthy controls, however, SCBF was related to the proximity of the labeling plane. This may be due to vascular signal contributions and additional strategies like vascular crushing gradients 22 should be considered. Alternatively, an optimized multi-delay design with a limited number of PLD times combined with the summation algorithm to remove the effects of ATT (Figure 7) may be similarly useful, although this required a longer scan time and greater complexity in the acquisition. These alternatives will need to be evaluated in the human spinal cord with these trade-offs in mind.
Our quantitative SCBF values in the healthy cord are in the ranges reported by other ASL methods for the rodent spinal cord and brain. These values are consistently larger than reported by other invasive methods, including hydrogen clearance and radioactive microspheres, with values ranging from 20-60-mL/100g/min.51–53 Literature pCASL values in the rodent brain are also shown to be higher than those obtained by radiotracer,21,26,54,55 although one report of a multiphase-pCASL technique that corrects for off-resonance effects showed significant correlation between autoradiography and pCASL. 41 Residual labeled blood in the vasculature is a likely contributor to overestimated perfusion measurements due to contributions from intravascular signal.23,40 In this work, we did not use vascular crushing to minimize signal from labeled water still residing in the vasculature, although this may also obscure relevant information about delayed flow. 56 Additionally, isoflurane anesthetic is known to impact blood flow55,57–60 and may contribute to the differences in quantitative SCBF between pCASL and gold standard methods.
The results of acute traumatic injury show clearly decreased SCBF at the site of injury. The perfusion deficits observed are consistent with prior results in a hemi-section mouse model. 16 Interestingly, quantitative T1 mapping showed an increased area of edema compared to the perfusion deficits at the injury site. Metrics of edema measured with T2-weighted images are diagnostic of injury severity after human SCI, but are not accurate prognostic markers of outcome. 61 Thus, perfusion MRI provides unique information that supplements more conventional clinical MRI markers. Further preclinical studies to characterize spinal cord perfusion after varying SCI severities and its temporal relationship to other MR metrics are needed to establish its role as a preclinical biomarker of therapies.
Despite routine use of ASL for animal and human subjects at a variety of field strengths, this protocol for the rodent spinal cord offers insights that may translate to human systems although adaptation will require further optimization. First, the vascular anatomy of the vertebral arteries is similar in the rodent and human, with C6 and above being intra-foraminal, which might allow similar labeling locations. Second, we show that at high-field RARE or FSE methods are superior to EPI for the spinal cord image quality, and FSE readouts might be more appropriate for the human cord, although noting that EPI readouts can offer suitable image quality even the sagittal plane with appropriate mitigation strategies. 62 Compared to the human spinal cord, the rodent has shorter transit times. Shorter T1 relaxation time constants at 3 T and below compared to high-field strengths will require LD and PLDs more appropriate for the physiology of the human spinal cord and field strengths, and these are currently not well established. Additional optimizations and demonstrations of robustness in a variety of human conditions and pathologies are required.
Conclusion
Through systematic investigation culminating in an optimized MRI protocol, we demonstrated that pCASL is a viable method to non-invasively monitor perfusion of the cervical spinal cord in an animal model with high sensitivity and reproducibility. Importantly, perfusion maps clearly reveal greater blood flow in the spinal cord gray matter, as expected, and reveal reduced blood flow at the injury epicenter. Continued applications to animal models of traumatic injury or compression will identify the pattern and evolution of perfusion deficits. These features, along with technical translation to patients with SCI, are likely to have significant implications for patient management or identify putative therapeutic targets since abnormal perfusion is believed to have a critical role in patient outcomes.
Supplemental Material
sj-pdf-1-jcb-10.1177_0271678X20982396 - Supplemental material for Optimized cervical spinal cord perfusion MRI after traumatic injury in the rat
Supplemental material, sj-pdf-1-jcb-10.1177_0271678X20982396 for Optimized cervical spinal cord perfusion MRI after traumatic injury in the rat by Briana P Meyer, Lydiane Hirschler, Seongtaek Lee, Shekar N Kurpad, Jan M Warnking, Emmanuel L Barbier and Matthew D Budde in Journal of Cerebral Blood Flow & Metabolism
Footnotes
Funding
The author(s) disclosed receipt of the following financial support for the research, authorship, and/or publication of this article: This work was supported by funding from the National Institutes of Neurological Disorders and Stroke [R01NS109090].
Acknowledgements
The authors thank Matthew Runquist and Qian (Kathleen) Yin (Medical College of Wisconsin) for experimental assistance and Luis Hernandez-Garcia (University of Michigan) and Nathan Skinner (Medical College of Wisconsin) for helpful discussions.
Declaration of conflicting interests
The author(s) declared no potential conflicts of interest with respect to the research, authorship, and/or publication of this article.
Authors’ contribution
B.P.M., S.L., S.N.K. and M.D.B. conceived and designed this work. L.H, E.L.B, J.M.W., and M.D.B, developed the pulse sequences. B.P.M., S.L. and M.D.B. preformed experiments, data analysis, and interpretation. B.P.M and M.D.B drafted the manuscript and all authors contributed to discussion and revision.
Supplemental material
Supplemental material for this article is available online.
References
Supplementary Material
Please find the following supplemental material available below.
For Open Access articles published under a Creative Commons License, all supplemental material carries the same license as the article it is associated with.
For non-Open Access articles published, all supplemental material carries a non-exclusive license, and permission requests for re-use of supplemental material or any part of supplemental material shall be sent directly to the copyright owner as specified in the copyright notice associated with the article.