
Abstract
A number of two-compartment models have been developed for the analysis of arterial spin labeling (ASL) data, from which both cerebral blood flow (CBF) and capillary permeability-surface product (PS) can be estimated. To derive values of PS, the volume fraction of the ASL signal arising from the intravascular space (vbw) must be known a priori. We examined the use of diffusion-weighted imaging (DWI) and subsequent analysis using the intravoxel incoherent motion model to determine vbw in the human brain. These data were then used in a two-compartment ASL model to estimate PS. Imaging was performed in 10 healthy adult subjects, and repeated in five subjects to test reproducibility. In gray matter (excluding large arteries), mean voxel-wise vbw was 2.3 ± 0.2 mL blood/100 g tissue (all subjects mean ± s.d.), and CBF and PS were 44 ± 5 and 108 ± 2 mL per 100 g per minute, respectively. After spatial smoothing using a 6-mm full width at half maximum Gaussian kernel, the coefficient of repeatability of CBF, vbw and PS were 8 mL per 100 g per minute, 0.4 mL blood/100 g tissue, and 13 mL per 100 g per minute, respectively. Our results show that the combined use of ASL and DWI can provide a new, noninvasive methodology for estimating vbw and PS directly, with reproducibility that is sufficient for clinical use.
Keywords
INTRODUCTION
Arterial spin labeling (ASL) is a noninvasive technique, which can be used to measure cerebral blood flow (CBF), by magnetically labeling water molecules in the arterial blood supply.1,2 In contrast to perfusion measurements acquired using either gadolinium bolus tracking approaches, such as dynamic susceptibility contrast magnetic resonance imaging (DSC-MRI), or PET (positron emission tomography), ASL utilizes a purely endogenous tracer (blood water molecules), and as such is well suited for repeated measurements in longitudinal studies, or in patients where exogenous contrast agents can be problematic (such as renal pathologies or pediatrics).
Early ASL models assumed that magnetically labeled water molecules act as a freely diffusible tracer. 1 However, both radiolabeling 3 and magnetic resonance4–6 experiments have demonstrated that this is not the case, particularly in the central nervous system, where the blood–brain barrier (BBB) reduces water permeability by an order of magnitude compared with systemic circulation. A number of ‘two-compartment’ ASL models have been developed to account for this,5,6 in which the permeability-surface product (PS) of the capillary wall is included as a fitted parameter when analyzing data acquired at multiple inflow times. These models provide a means to obtain localized measurements of water permeability, which could provide a surrogate index of the integrity of the BBB throughout the brain. This is a potentially clinically useful biomarker, as the permeability of the BBB can be altered in brain tumors and in neurodegenerative diseases such as multiple sclerosis.
To derive PS values from two-compartment ASL models, the fraction of the ASL signal that arises from intravascular ‘blood–water’ and extravascular ‘tissue–water’ compartments must be known (vbw and vex, respectively). Because local values of vbw are usually not known a priori, rather than deriving a value of PS from a two-compartment model, only the ratio of PS/vbw can be obtained (see Model Fitting). Following this, a number of previous studies 5 have assumed a fixed, global value for vbw to estimate voxel-wise values of PS in the brain. However, PS values obtained using this method are prone to errors introduced by both regional variations in vbw, as well as dynamic changes brought about by neuronal activation. Furthermore, vbw itself is a clinically useful biomarker in pathologies such as brain tumors, in which tumor-induced neoangiogenesis may lead to localized changes in the microvascular volume fraction. In such cases assumed values of vbw, based on measurements made in healthy tissue, are likely to be incorrect, which will lead to inaccuracies in estimates of PS. Therefore, significant advantages can be gained from decoupling the PS and vbw parameters in a two-compartment analysis of ASL data.
Traditionally, vbw measurements have been made using MR-based methods combined with exogenous contrast agents, or non-MR-based techniques such as computed tomography, single photon emission computed tomography, and PET. However, as these techniques are all invasive, they are not well suited for intrasubject longitudinal studies or pediatric patients. Alternatively, a number of noninvasive spin labeling approaches for measuring arterial cerebral blood volume (aCBV) have been developed over recent years, such as the VASO (vascular space occupancy) technique, 7 which has been extended to provide quantification of aCBV in units of mL blood/100 mL parenchyma.8,9 However, as shown by Donahue et al, the VASO technique predominantly measures vasculature at the precapillary level.
Here, we introduce an alternative, noninvasive methodology for incorporating measured values of vbw into a two-compartment ASL model, using data derived from diffusion-weighted imaging (DWI). This method utilizes an adapted version of the intravoxel incoherent motion (IVIM) model, introduced by Le Bihan et al,10–12 which states that two diffusing species give rise to the observed signal during in vivo DWI. These are the incoherent flow of blood–water in the randomly orientated microvascular network (referred to as microcirculation driven pseudo-diffusion), and molecular, thermally driven diffusion of water molecules in the extravascular space. Provided a suitable range of b values are applied (including a number of measurements at low b values, < ~200 s/mm2), a deviation from mono-exponential signal attenuation with increasing b value will be observed. By fitting measured data to the IVIM model (see Model Fitting), the volume fraction of water molecules contributing to the microvascular pseudo-diffusion signal can be estimated. This parameter will be sensitive to changes in the local capillary density, and therefore provides important information when modeling kinetic ASL data using a two-compartment model.
The combined use of ASL and the IVIM model has previously been suggested.13,14 However, in these studies diffusion-weighting gradients were applied to the ASL signal itself, to separate the fast flowing (vascular) and slow (tissue) contributions. Although promising, the applied diffusion gradients spoil a considerable portion of the ASL signal using these techniques, and the eddy-currents induced at higher b values significantly increase the temporal fluctuations in the raw data. As ASL suffers from intrinsically low SNR (signal-to-noise ratio), analysis is therefore limited to large ROIs, which constitutes a limitation when localized values of PS and vbw are required. Also, although physiologically sensible values of PS have been measured, 15 assumed rather than measured values of vbw were used in the analysis, which may not be physiologically accurate, particularly in pathologies.
The purpose of this study was to demonstrate a new methodology for localized, ASL-derived measurement of PS, which incorporates measured values of vbw in the analysis, utilizes pulse sequences that are widely clinically available, and does not further attenuate the low-SNR ASL signal. Both multi-inversion-time pulsed-ASL and multi-b value DWI measurements were obtained in 10 healthy adult subjects (and repeated in five subjects for the assessment of reproducibility), and voxel-wise values of vbw, derived from an IVIM analysis of the DWI data, were substituted into a two-compartment ASL model to measure local values of both CBF and PS. Previously, the majority of two-compartment ASL studies have reported results from whole-gray matter ROIs. However, there is evidence to suggest that the analysis of ASL data based on large ROIs may suffer from inaccuracies due to a wide distribution of bolus transit times, and averaging of kinetic ASL data over such a large region should be avoided. 16 Furthermore, the advantage gained from incorporating local, measured values of vbw would be lost if such large ROIs were used. We therefore performed our analysis on a voxel-by-voxel basis, and performed analysis on both raw data, and spatially smoothed data, to increase the effective region of interest beyond the single voxel level. Spatial smoothing also helps to correct for subject motion and imperfections in coregistration of DWI and ASL data.
MATERIALS AND METHODS
Magnetic Resonance Experiments
All experiments were performed on a 1.5-T Siemens Magnetom Avanto scanner (Siemens, Erlangen, Germany), equipped with 40 mT/m gradients and a 12-channel head receive coil. Ten healthy subjects (age 22 to 32 years, mean age 27 years, four females), who provided informed written consent in accordance with the guidelines and approval of the institutional ethical review board, were scanned, and all data were acquired in the brain, using the protocols described below. Imaging was repeated in five of the subjects, ~30 minutes after the initial scan, without repositioning inside the magnet, to test intrasubject reproducibility.
Diffusion-Weighted Imaging Protocol
Diffusion-weighted imaging data were acquired using a diffusion-sensitized axial 2D single shot spin-echo sequence (with echo planar imaging (EPI) readout), with the following imaging parameters: TR/TE = 3,800/120 milliseconds, field of view = 230 mm, matrix size = 64 × 64, 20 contiguous slices with 5 mm thickness, NSA (number of averages) = 3. Diffusion sensitizing gradients were applied in three orthogonal directions with b values of 0, 20, 40, 80, 120, 160, 200, 300, 500, and 1000 s/mm2. In-plane resolution was 3.6 × 3.6 mm2, and total acquisition time was 11 minutes. As it has been shown that partial volume effects between cerebrospinal fluid (CSF) and tissue will contribute to the biexponential behavior observed in DWI of the brain, 17 all DWI acquisitions were performed with CSF suppression (prior inversion pulse, TI = 2,200 milliseconds).
Arterial Spin Labeling protocol
Arterial spin labeling data were acquired using a flow-sensitive alternating inversion recovery (FAIR) pulsed-ASL sequence, with 3D single shot gradient and spin echo (GRASE) data acquisition, 18 with the following imaging parameters: TR = 3.0seconds, TE = 31.6 milliseconds, and NSA = 8. The field of view and resolution were identical to the diffusion-weighted scan, and measurements were made at 12 inflow times (TI), ranging from 0.2 to 2.4 seconds in 0.2-second intervals, with total scan time = 9.6 minutes. Arterial spin labeling measurements were made twice, once with background suppression of static tissue, 18 and once without (for quantification of voxel-wise T1 and M0 values, see Preprocessing). The use of background suppression allowed the scanner gain to be increased by a factor of 10 to maximize the signal from the inflowing blood.
Preprocessing
All DWI data were corrected for eddy-current distortions using FSL (FMRIB's Software Library, Oxford University, www.fmrib.ox.ac.uk/fsl), and the mean of the signal intensity values from the three diffusion encoding directions was used for analysis. Signal intensity values from the multi-TI non-background suppressed ASL acquisition were used to fit a T1 inversion recovery curve in each voxel, to obtain maps of T1 and M0. The T1 maps from each subject were then used to register all DWI and ASL raw data to the MNI template (Montreal Neurological Institute), using an affine 12-parameter model provided by the FLIRT algorithm in FSL. 19 Intravoxel incoherent motion and ASL model fitting was then performed on the raw, registered data (see Model Fitting). Voxel-wise analysis of fitted parameters was performed on unsmoothed data, as well as spatially smoothed data after application of Gaussian kernels of 2, 4, and 6 mm full width at half maximum (FWHM).
Model Fitting
All postprocessing and analysis was performed using Matlab (MathWorks, Natick, MA, USA).
Intravoxel Incoherent Motion Model Fitting
The original IVIM model stated that the relationship between signal intensity, S, and the applied diffusion-weighting (b value) is given by:
A further limitation of the original IVIM model was demonstrated by Lemke et al,
23
in which it was shown that, because equation (1) does not account for the different relaxation times of tissue and blood, values of vbw will vary as a function of TE. As transverse relaxation times in tissue are generally shorter than that of blood, when TE is not accounted for, blood volume fractions will be overestimated. Furthermore, as an inversion pulse was applied at the start of our DWI sequence, differences in longitudinal magnetization relaxation times of blood and tissue should also be accounted for. Therefore, a modified IVIM equation, similar to the one presented in reference
23
but adapted to include the effect of our prior inversion pulse, was used:
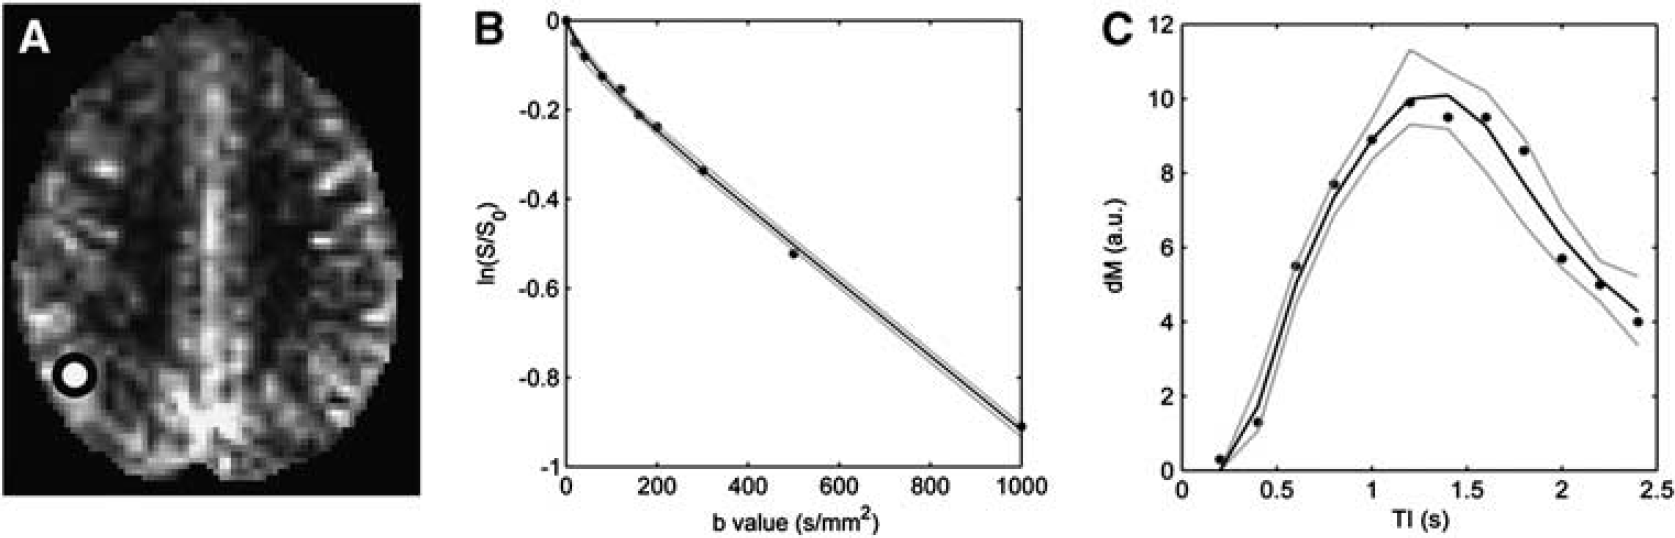
Example of model fitting in a single voxel. (
Arterial Spin Labeling Model Fitting
As the aim of this study was to investigate microvasculature, we attempted to segment voxels in which the ASL signal arises predominantly from large arteries (see Data Segmentation). However, signal from smaller arteries and arterioles will remain after segmentation, and therefore a model that describes the passage of the labeled bolus through both small arteries and the capillary bed is needed. The four-phase single capillary stepwise model 4 is suitable for this. This methodology models the contribution to the total ASL signal, dM(t) (the difference in signal intensity between control and labeled acquisitions) from labeled water in arterial (dMa(t)), capillary (dMc(t)), and tissue (dMt(t)) compartments. The contributions are calculated over four phases, with respect to the temporal position of the labeled slab of water as it travels from the tag region to the capillary bed. The details of the equations governing the four phases are given below, and all parameters used in the model are defined in Table 1. 4
Definition of parameters in the ASL modela
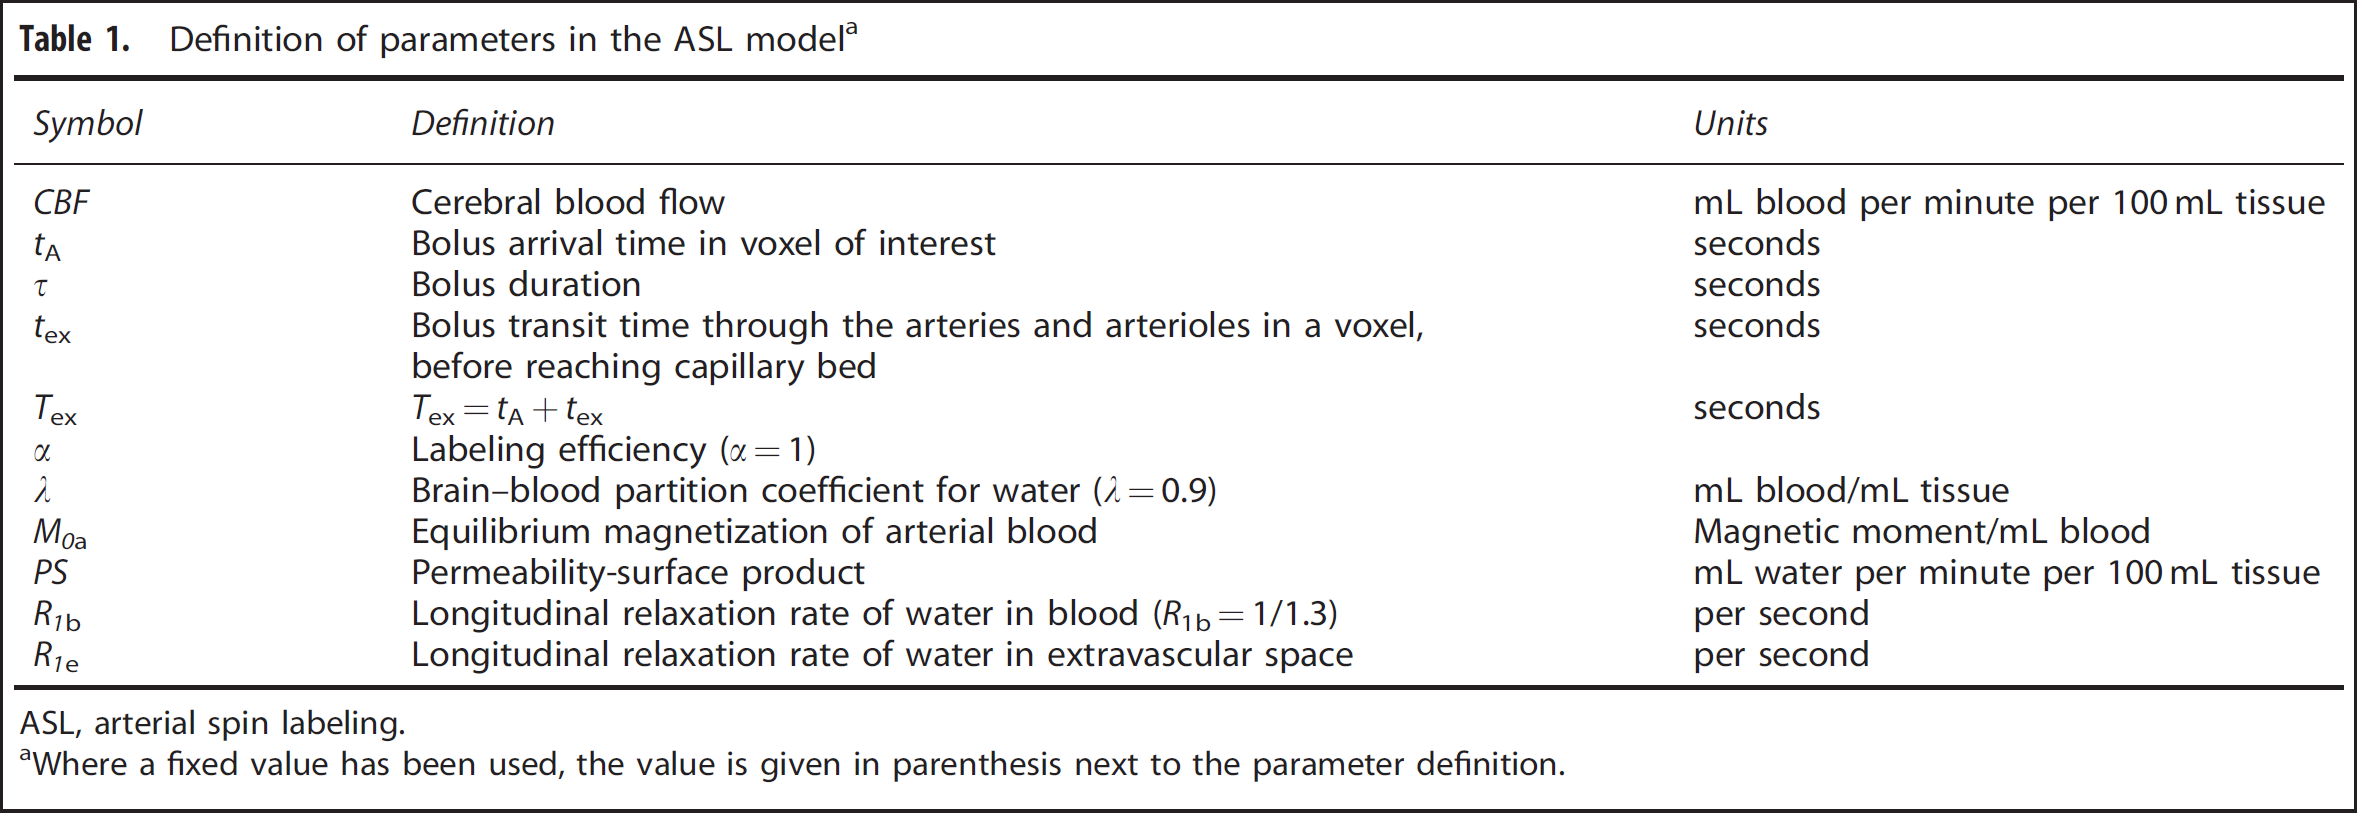
ASL, arterial spin labeling.
Where a fixed value has been used, the value is given in parenthesis next to the parameter definition.
Transit phase (0 < t ≤ tA):


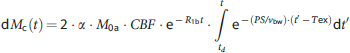
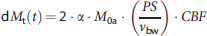
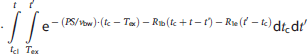
Capillary phase (t > Tex + τ): Here dMa(t) = 0, and equations (6) and (7) further describe dMc(t) and dMt(t), respectively, with tcl = max(Tex, t – τ) = t – τ.
To estimate the equilibrium longitudinal magnetization of blood (M0a), a voxel containing only CSF was identified in each subject, and, similar to the method described in reference, 27 an estimate of M0a was made using the fitted value of M0 in the CSF (see Preprocessing), and assuming a proton density ratio of blood to that of CSF of 0.72. 28 The fitted parameters in the four-phase model were then tA, CBF, tex, PS, and τ. Before fitting the two-compartment model, the single-compartment Buxton model 29 was fit in each voxel, to provide starting guesses for tA, CBF, and τ. The starting guesses of PS and tex were 150 mL per 100 g per minute and 0.5 seconds, respectively. Values of all fixed parameters used in our analysis are given in Table 1. An iterative Nelder–Mead nonlinear least squares algorithm was used for model fitting (see Figure 1). Note the ratio of PS/vbw would usually be modeled as a single parameter, rather than PS itself. However, in our analysis, measured values of vbw, derived from the IVIM analysis, were used.
Data Segmentation
As mentioned previously, we attempted to segment voxels that contained large arteries, before analysis. We were unable to use previously published techniques, such as QUASAR,
30
to eliminate macro-vascular ASL signal during acquisition, as these involve the application of bipolar crusher gradients, which are incompatible with the GRASE readout module.
31
Instead, we first identified a voxel that was primarily filled with blood: this was chosen by automatically selecting the voxel with the greatest peak in dM(t). The variation of dM(t) as a function of TI within this voxel was chosen as a rough estimation of the ‘global’ AIF (arterial input function). Note, the AIF determined using this technique will suffer from inaccuracies due to the low resolution of our data and local bolus dispersion; it will however suffice here as it is simply used to facilitate the segmentation process. The approximate range of capillary arrival times (Tex) in the healthy adult brain is in the region of 839 < TI < 1,064 milliseconds,
9
and the dM(t) time series for TI < Tex should represent the passage of labeled blood at the precapillary level, and will not be influenced by bolus exchange with surrounding tissue. Therefore, for our segmentation process we set Tex = 800 milliseconds, and integrated the area under the dM(t) curve between 0 < t < Tex in each voxel. We then normalized to the area under the global AIF curve over the same time period, to estimate local values of relative arterial volume fraction (rVa), i.e.,
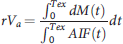
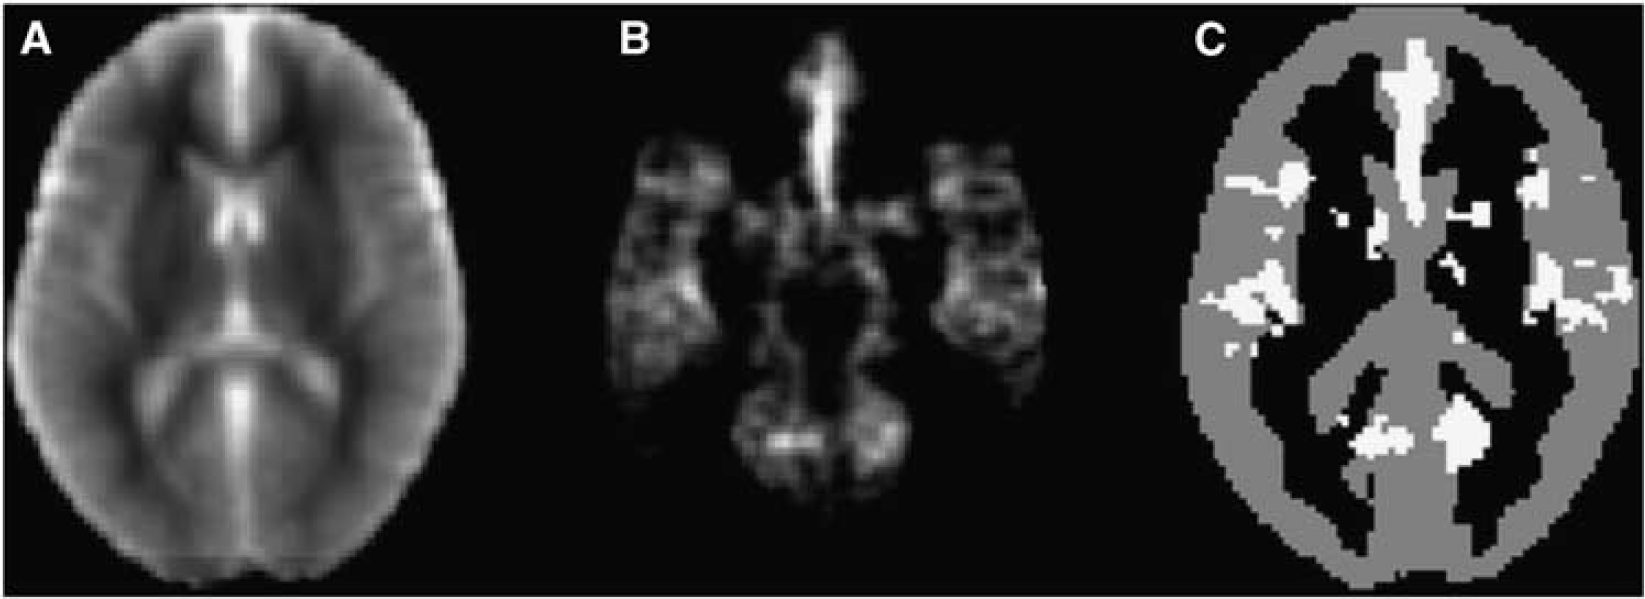
Overview of the segmentation process. (
Because the difference between the control and label ASL acquisition (dM) is very small (typically of the order 1% to 2% without background suppression 30 ), the inherent low SNR of ASL data can lead to large uncertainties in modeled parameters, particularly in two-compartment models. 32 As white matter regions suffer from both intrinsically low perfusion and long transit delays, which further reduces the SNR of the ASL signal, additional segmentation was applied to restrict our analysis to gray matter regions. T1 maps were used to segment the gray matter regions using the Fast module within FSL (Figure 2).
Error Analysis
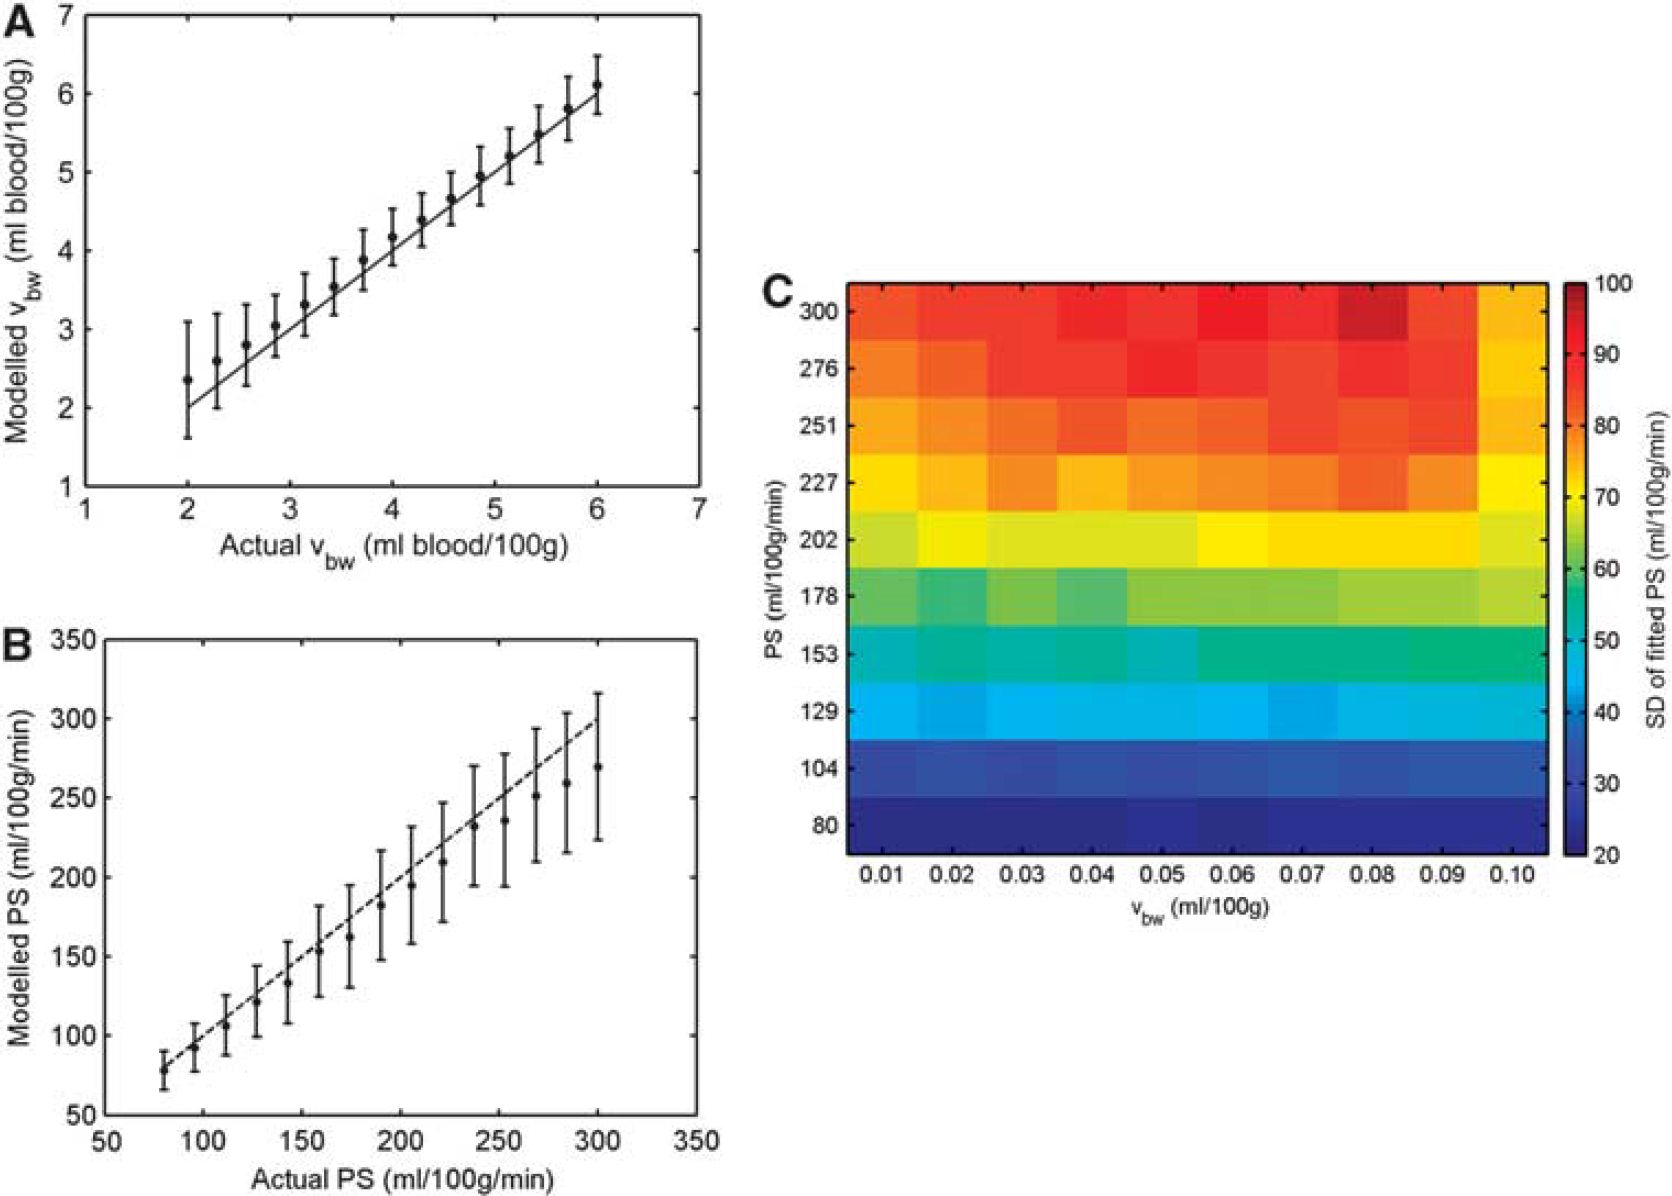
Monte Carlo simulations were conducted to assess the accuracy and precision of fitted PS and vbw values. Synthetic ASL and DWI data were generated using the two-compartment ASL model (equations 3–7) and the extended IVIM model (equation (2)), using typical human gray matter tissue parameters (Table 2). Based on SNR levels measured in the experimental data (Table 2), appropriate levels of random noise (Gaussian for ASL, Rician for DWI) were then added to the synthetic data. This process was repeated to produce 1,000 sets of synthetic raw data, sampled at the same TI/b values acquired in the experimental protocol. The IVIM and ASL model fitting was performed for each synthetic data set, to generate 1,000 samples of all fitted parameters. The mean values of the samples of each fitted parameter were used to determine accuracy, and the standard deviation was used to determine precision. The above process was repeated for input PS values between 80 and 300 mL per 100 g per minute, and input vbw values between 2 and 6 mL/100 g tissue, chosen to extend beyond the typical values observed in healthy human GM, and cover elevated values which may be encountered in pathology (see Discussion). A one-way analysis of variance followed by a post hoc Tukey–Kramer analysis, with a significance level of P < 0.05, was used to test differences between group means in the Monte Carlo simulations.
Typical ASL and DWI parameters in human brain gray matter at 1.5 T, used in the Monte Carlo simulations
ASL, arterial spin labeling; DWI, diffusion-weighted imaging.
Mean gray matter values from experimental data measured in 10 subjects.
Data from Buxton et al. 29
Data from Steinhoff et al. 40
Derived from value of tA and data in Donahue et al. 9
Data from Zhon et al. 6
Data from Pekar et al. 26
Reproducibility Analysis
To assess intrasubject reproducibility, fitted parameters were analyzed from the test–retest data collected in five of the subjects, after registration into standard space. The within-subject standard deviation (SDw) was calculated on a voxel-wise basis, using the following formula:
33
RESULTS
Model Sensitivity and Error Analysis
Figure 3 shows the mean fitted values of vbw and PS derived from the Monte Carlo simulations, plotted against the input value used to generate the data. For vbw > 3 mL blood/100 g tissue, fitted values showed a very small positive bias. However, below this, the bias increased with decreasing values of vbw, with the mean fitted value being overestimated by 19% at vbw = 2 mL blood/100 g tissue. Precision also decreased at lower values of vbw, with the COV (coefficient of variation) in fitted values of vbw increasing from 14% at vbw = 6 mL blood/100 g tissue, to 60% at vbw = 2 mL blood/100 g tissue.
(
The mean fitted value of PS was also sensitive to changes in the input value, but showed an increasing negative bias as PS increased, with fitted values being underestimated by 10% at the maximum input PS value of 300 mL per 100 g per minute. The COV of fitted PS values increased from 31% at PS = 80 mL per 100 g per minute, to 34% at PS = 300 mL per 100 g per minute.
Experimental Data
An example of IVIM and ASL model fitting in one voxel is shown in Figure 1. A wild bootstrap technique 34 was used to estimate the uncertainty on the fitted values in this example; after initial model fitting, the polarity of the residuals at each data point was either unperturbed or inverted with a 50% probability. New data sets were created by adding the adjusted residuals to the fitted data, after which model fitting was repeated. This process was repeated over 5,000 iterations, after which the distribution of fitted parameters was used to estimate uncertainty. In the example shown in Figure 1, the (2.5 percentile, < mean >, 97.5 percentile) values of the IVIM fitted parameters were: vbw = (4.4, < 6.0 >, 7.5) mL blood/100 g tissue, D = (0.80, < 0.83 4, 8.6) × 10−3 mm2/s, and D* = (10.0, < 19.1 >, 50.0) × 10−3 mm2/s. The corresponding uncertainty estimates on the ASL fitted parameters were: tA = (0.28, < 0.32 >, 0.35) seconds, CBF = (85.9, < 88.0 >, 102.5) mL per 100 g per minute, PS = (87.5, < 133.9 >, 164.5) mL per 100 g per minute, τ = (0.89, < 1.25 >, 1.51) seconds, and Tex = (0.75, < 1.08 >, 1.31) seconds.
Example maps of CBF, vbw, and PS from one representative subject are shown in Figure 4, along with voxel-wise values of RI at the same location. After coregistration into standard space and segmentation of the white matter and large arteries, the mean value of CBF, vbw, and PS in the gray matter across all subjects was 44 ± 5 mL per 100 g per minute, 2.3 ± 0.2 mL blood/100 g tissue, and 108 ± 2 mL per 100 g per minute, respectively. For comparison, the mean gray matter CBF in all subjects obtained using the single-compartment Buxton general kinetic model 29 was 48 ± 6 mL per 100 g per minute. Data from the Monte Carlo simulations suggest that statistically significant changes in these mean fitted values could be observed for an underlying change in PS beyond the range 96 < PSmean(108) < 143 mL per 100 g per minute, and vbw beyond the range 2.0 < vbw,mean(2.3) < 2.6 mL blood/100 g tissue (P < 0.05).
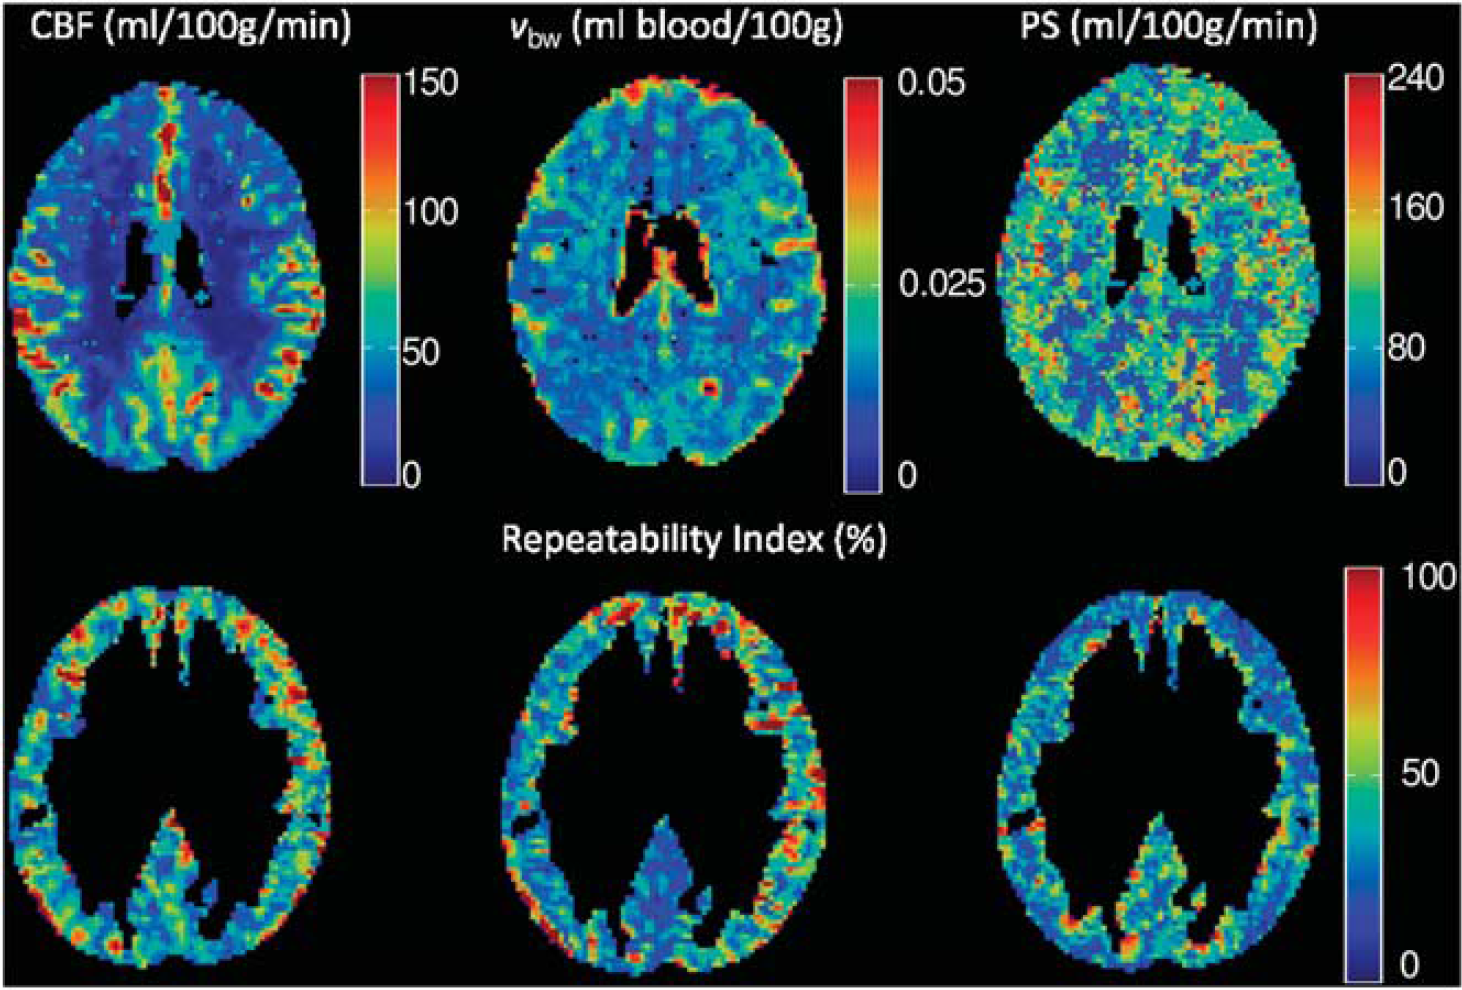
(Top row) Maps of fitted cerebral blood flow (CBF) (left), blood volume fraction (vbw) (middle), and permeability-surface product (PS) (right) in a representative subject, before segmentation and spatial smoothing. (Bottom row) Voxel-wise repeatability index (RI) across five subjects in the same slice, after segmentation of white matter and large arteries.
Mean voxel-wise values of SDw and RI, for unsmoothed and smoothed data, are given in Table 3. Without spatial smoothing, poor intrasubject reproducibility was observed, with COR values of 29 mL per 100 g per minute, 1.6 mL/100 g tissue, and 80 mL per 100 g per minute for CBF, vbw, and PS, respectively. However, spatial smoothing improved reproducibility considerably, with COR values for CBF, vbw, and PS of 8 mL per 100 g per minute, 0.4 mL/100 g tissue, and 13 mL per 100 g per minute, respectively, when a 6-mm FWHM Gaussian kernel was applied.
Within-subject standard deviation (SDw) and repeatability index (RI) for fitted values of cerebral blood flow (CBF), microvascular volume fraction (vbw), and permeability-surface product (PS)
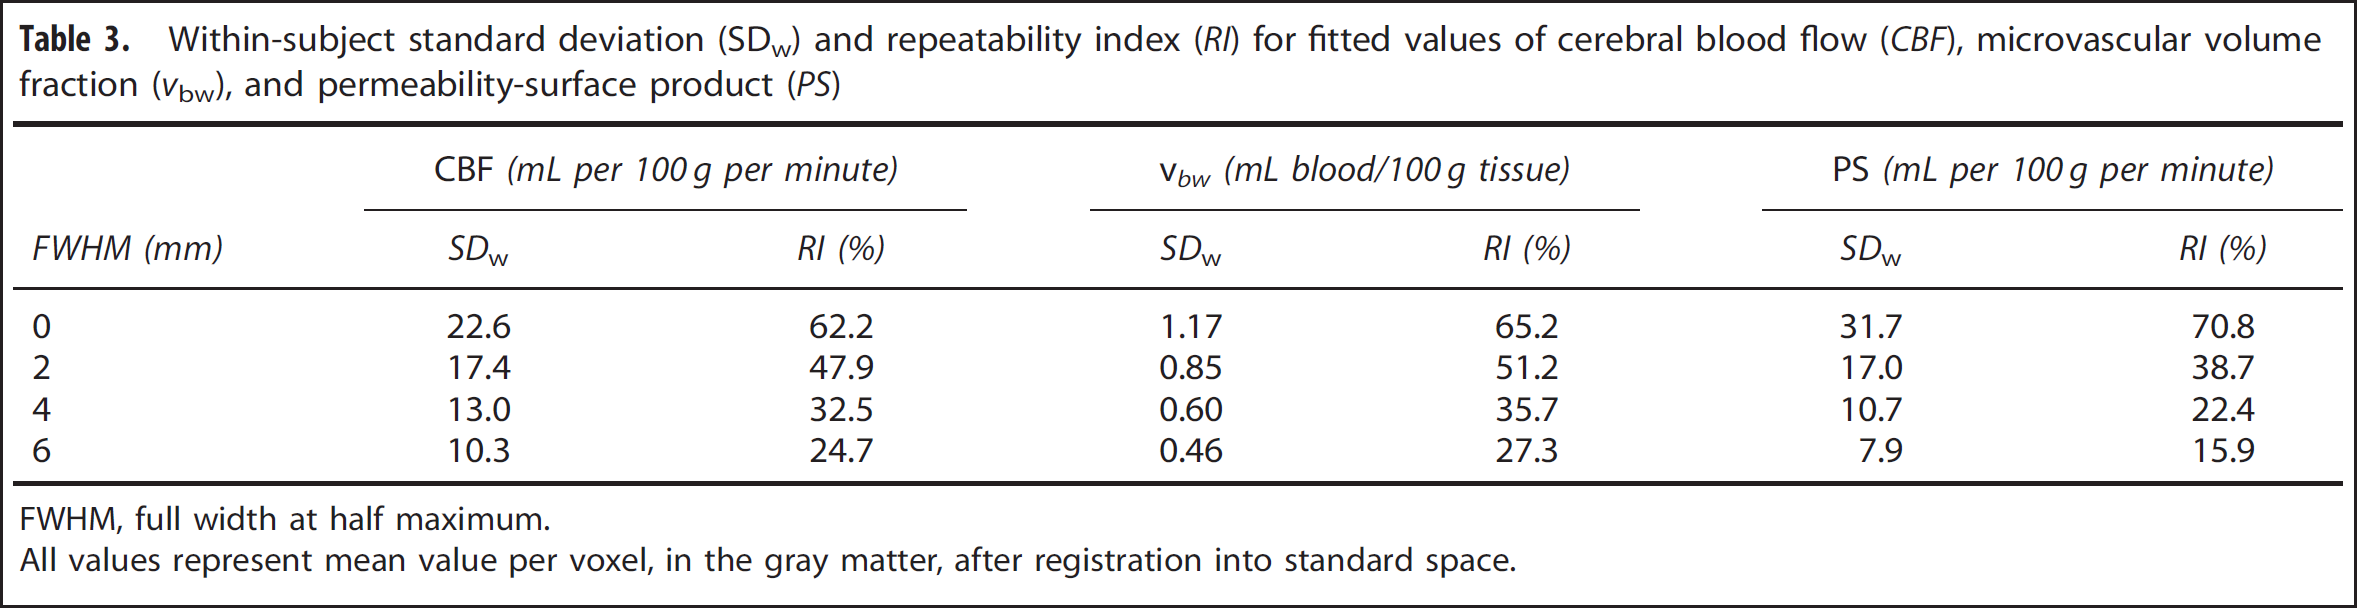
FWHM, full width at half maximum.
All values represent mean value per voxel, in the gray matter, after registration into standard space.
DISCUSSION
The mean CBF in the gray matter in our subjects is slightly lower than previously reported values. 35 However, our values were calculated after the segmentation of large arteries, and are therefore not contaminated by high signal from labeled blood in large vessels, which is destined to perfuse tissue in more distal regions. Furthermore, most previous ASL-based CBF measurements have used a single-compartment model. It has been shown that this tends to overestimate the true value of CBF, by ~17% in human gray matter at 1.5 T, 5 although in our case, analysis with the single-compartment Buxton model produced CBF values which were ~9% higher.
Our mean rVa maps (Figure 2) are visually similar to the arterial blood volume maps produced using the QUASAR method, 30 and it would appear that our methodology provides an effective means of identifying and segmenting large feeding arteries in the brain. This could be beneficial when it is not possible to apply bipolar crusher gradients during the ASL acquisition protocol.
The expected value of vbw in healthy gray matter is difficult to predict without a comprehensive understanding of the source of the fast diffusing signal in DWI data. The mean, total CBV in human gray matter in subjects aged ~30 years has been measured as 5.2 mL blood/100 g tissue. 36 As mentioned earlier, the IVIM effect arises predominantly from blood in the arterial/capillary compartments of the vascular network. Arterial blood has been shown to contribute ~30% of total CBV, 22 which would suggest an expected vbw value in the region of 1.6 mL blood/100 g tissue in our subjects. However, this neglects the contributions from blood in the capillary bed, and is therefore likely to represent the lower limit on the expected vbw value. Also, as our mean measured value of vbw was 2.3 mL blood/100 g, and our Monte Carlo simulations show that modeled vbw values at this level will be overestimated by ~18%, the corrected mean vbw value in our subjects is ~1.9 mL blood/100 g tissue, which shows good agreement with expected vbw values in healthy GM.
When measured values of vbw are used to obtain PS values from the two-compartment ASL model, estimated values also show good agreement with previous studies: our mean PS was 108 mL per 100 g per minute; previously reported values in healthy human gray matter range from 80 to 169 mL per 100 g per minute. 6 After accounting for the known bias in fitted PS values, our PS data remain within the range of previously reported values, suggesting that physiologically sensible estimates of PS in the gray matter can be obtained using a combined DWI/ASL methodology. However, it should be noted that because IVIM-derived vbw values are likely to represent the sum of the arteriole and capillary volume fractions, the vbw value will be an overestimate of the compartment size involved in the extravasation of labeled water in the ASL model, which may lead to an underestimation of PS. Nonetheless, vbw will be sensitive to an underlying change in capillary volume fraction, and as such it should be possible to decouple local changes in vbw and PS using our methodology.
If the combined IVIM-ASL methodology is to be clinically useful, it is important to quantify the precision and reproducibility of the technique, and to assess whether it would be sensitive to pathologically induced changes. For instance, in pathologies such as brain tumors, which induce angiogenesis and increase BBB permeability, we would expect increases in vbw by a factor of ~3, 37 and increases in PS by up to a factor of ~20. 38 Our sensitivity analysis suggests that underlying changes in PS and vbw of this magnitude would lead to significant changes in the corresponding fitted values from the two-compartment ASL and IVIM models. However, it should be noted that in pathologies, a wider range of ASL and DWI parameters may change in parallel, which would be difficult to model accurately using simulated data. Also, our Monte Carlo simulations represent the ‘best-case scenario’, in which the model used to generate the data is the same as that used to fit the data.
The COR values in our experimental data define the largest difference between measurements that is likely to be caused by the combined effect of model fitting and measurement error (patient movement, eddy-currents, etc). Without spatial smoothing, our COR values suggests that within-subject voxel-wise reproducibility of PS and vbw measurements is inadequate for clinical use. However, given the low SNR of ASL data, registration inaccuracies (see below), and subject motion between scans, this is perhaps not surprising. The improved reproducibility at increased levels of spatial smoothing suggests that measurement of vbw and PS with a reasonable reproducibility would be possible, at the cost of slightly reduced spatial resolution. However, as the majority of previous ASL-derived PS measurements have been performed using large, often whole-gray matter ROIs, our methodology offers an alternative approach, providing PS measurements on a more localized scale.
Study Limitations
A limitation of two-compartment ASL models is that they are typically two orders of magnitude less sensitive to changes in PS than CBF, 32 which, combined with the typically low SNR of ASL data, makes PS a difficult parameter to fit. Our ASL protocol was designed to counteract this as far as possible. For instance, we employed a 3D GRASE pulse sequence for data acquisition, rather than 2D EPI sequences as used in previous two-compartment ASL studies.5,6 This has the advantage that the entire imaging volume is acquired at a single TI time, and 3D acquisition has an inherently higher SNR than 2D multislice (it has been shown that the 3D GRASE technique yields a 2.8-fold increase in SNR compared with 2D EPI at the same nominal resolution 18 ). This is improved further by our use of background suppression of the static tissue signal, which has not been applied in previous two-compartment studies.
Because the signal differences between the label and control experiments are of the order of a few percent, scanner gain adjustment is usually ineffective for extracting the labeled blood signal. However, when background suppression is applied, scanner gain can be increased (in our case by a factor of 10), to improve the dynamic range of the labeled blood signal without risking saturation from the static tissue signal. The noise added to the labeled bolus signal from instabilities in the static tissue will also be reduced. However, despite these SNR gains, the point spread function in the second phase encoding direction (inferior–superior in our case) is very different compared with the EPI sequence used for DWI acquisition, therefore differences in image distortion and point spread function between the 3D GRASE and 2D EPI sequences may lead to inaccuracies when coregistering raw data into standard space. More advanced registration algorithms (unwarping with field maps, nonlinear normalization, etc) may reduce this source of error. However, a previous study has compared CBF values acquired in healthy humans using our GRASE sequence with those obtained in the same subjects, using identical parameters and a 2D EPI readout, 18 and found no significant difference in CBF.
A further limitation is that, because a multislice DWI acquisition was used, each slice will have a slightly different TI following the initial inversion pulse, which will compromise the accuracy of vbw values obtained using equation (2) in some slices. We used interleaved slices to reduce the effect of a systematic bias in vbw as a function of slice position in the stack; however, variations in TI may have led to inaccuracies in modeled vbw values in some locations. Furthermore, as subjects were not repositioned between scans, it should be noted that the COR values quoted here represent within-session reproducibility rather than between session reproducibility. Lastly, while our segmentation process appears to be effective at excluding large arterial signals, it will not exclude small arterial/arteriole signals. The Bayesian model presented in 39 may help with this, and is an area that warrants further investigation.
Given the significant changes in vbw and PS that neurological pathologies, such as brain tumors, can induce as a result of angiogenesis and disruption to the BBB, the data shown in Table 3 suggest that pathologically induced changes should exceed the COR of the technique, and the methodology should be adequate for clinical use. Furthermore, we have demonstrated this technique at 1.5 T; given the potential for increased SNR at higher field strengths, further improvements to both the precision and spatial resolution of the technique could be realized once ASL becomes generally clinically available at 3 T and beyond.
In conclusion, we present a new, noninvasive methodology for MR-derived measurement of PS in the human brain, which incorporates IVIM-derived estimates of vbw into a two-compartment ASL model. The additional vbw measurements can be made using standard DWI protocols that are widely clinically available, and provide a mechanism by which fitted values of PS would not be corrupted by pathologically induced changes in vbw. By measuring PS, CBF, and vbw directly using noninvasive MRI techniques such as this, a ‘suite’ of biomarkers become available, which in the future could be used to characterize pathologies and treatment response, and will be particularly well suited for repeated measurements in longitudinal studies, or for use in pediatric patients.
DISCLOSURE/CONFLICT OF INTEREST
The authors declare no conflict of interest.
Footnotes
ACKNOWLEDGEMENTS
The authors thank Tina Banks and the subjects scanned in this study for their assistance, and the reviewers for their helpful suggestions while producing this manuscript.