
Abstract
The classic definition of the ischemic penumbra is a hypoperfused region in which metabolism is impaired, but still sufficient to maintain cellular polarization. Perfusion- and diffusion-weighted MRI (PWI, DWI) can identify regions of reduced perfusion and cellular depolarization, respectively, but it often remains unclear whether a PWI—DWI mismatch corresponds to benign oligemia or a true penumbra. We hypothesized that pH-weighted MRI (pHWI) can subdivide the PWI—DWI mismatch into these regions. Twenty-one rats underwent permanent middle cerebral artery occlusion and ischemic evolution over the first 3.5 h post-occlusion was studied using multiparametric MRI. End point was the stroke area defined by T2-hyperintensity at 24 h. In the acute phase, areas of reduced pH were always larger than or equal to DWI deficits and smaller than or equal to PWI deficits. Group analysis showed that pHWI deficits during this phase coincided with the resulting infarct area at endpoint. Final infarcts were smaller than PWI deficits (range 65% to 90%, depending on the severity of the occlusion) and much larger than acute DWI deficits. These data suggest that the outer boundary of the hypoperfused area showing a decrease in pH without DWI abnormality may correspond to the outer boundary of the ischemic penumbra, while the hypoperfused region at normal pH may correspond to benign oligemia. These first results show that pHWI can provide information complementary to PWI and DWI in the delineation of ischemic tissue.
Introduction
Recent progress in the field of ischemic stroke has shown that thrombolysis treatment increases survival and reduces disability, but that early intervention is the key to successful therapeutic outcome. Thus, availability of noninvasive imaging technologies to rapidly and specifically evaluate areas of likely damage and the potential for recovery is an important factor for progress in the field of acute stroke. The goal is identification of the ischemic penumbra, the hypoperfused region that is still viable but at risk of infarction. Classically (Astrup, 1976; Hossmann, 1994), the penumbra has been defined as an area in which metabolism is impaired, but still sufficient to maintain cellular polarization, which restricts this definition to a lower range of flow values within a large area of perfusion deficits. In the recent two decades, many novel MRI technologies have been developed that shed light on this evolution, and much has been learned from their application in animal stroke models (Dijkhuizen and Nicolay, 2003; Hoehn et al., 2001; Weber et al., 2006). Diffusion-weighted MRI (DWI, Minematsu et al., 1992; Moseley< et al., 1990a, b; Sotak, 2002) and perfusion-weighted MRI (PWI, Minematsu et al., 1993; Moseley et al., 1990b) can detect regions of cellular membrane depolarization and cerebral blood flow (CBF) reduction, respectively, and the PWI—DWI mismatch gives the maximum area of abnormal hemodynamic supply. However, this mismatch is often only an approximation of the ischemic penumbra because it may contain regions of benign oligemia as well. This is reflected in clinical results, where the area of ultimate infarction is generally smaller than the maximum perfusion deficit from PWI. The use of the DWI boundary for the irreversible ischemic core has also been under scrutiny. Diffusion abnormalities sometimes partially reverse and the DWI abnormality may be energetically heterogeneous (Fiehler et al., 2002b; Kidwell et al., 2004; Nicoli et al., 2003). Thus, although being the most readily available and practical method at present, the PWI—DWI mismatch approach is not a complete approach for imaging the penumbra. Because treatment poses risks of hemmorhage, it is useful to develop complementary imaging modalities that can subdivide and/or better evaluate the character of the perfusion deficit. PET is an excellent method to quantitatively assess flow and metabolic deficits (Guadagno et al., 2005; Heiss, 2001), but it is not a readily available methodology. Mean transit times measured with MRI provide semiquantitative information on flow deficits, but this assessment is not trivial because of a large variability in input function to the hypoperfused region (Wu et al., 2003a, b ). Blood-oxygenation-level-dependent MRI has the potential to also provide information on oxygen extraction fraction (An and Lin, 2002; Lee et al., 2003; Lu and van Zijl, 2005; Oja et al., 1999), but these methods are still being optimized.
The classic definition of the penumbra (Astrup, 1976; Hossmann, 1994) is based on impaired metabolism that can sustain still-viable tissue for a limited period of time. Anaerobic metabolism and the formation of lactate lead to a decrease in pH in this area. Recently, we developed a new MRI approach that was shown to be predominantly sensitive to tissue pH changes (Zhou et al., 2003) during the initial hours post mortem or postischemia. In this so-called amide proton transfer (APT) imaging, the exchange between amide protons of tissue mobile proteins and water protons is monitored indirectly through the water signal. During acute ischemia, pH reduction slows down the above exchange process, and, when imaging this process, it could be shown that areas of reduced diffusion and reduced pH (Zhou et al., 2003) coincided. Based on the existing knowledge of ischemic thresholds (Hossmann, 1994), such a pH decrease should be visible before cellular depolarization occurs and we hypothesized that pH-weighted imaging (pHWI) may better predict the outer edges of the ischemic penumbra and, ultimately, areas headed towards infarction. As an initial step in the investigation of this possibility of distinguishable diffusion and pH zones and their relationship to ischemic evolution and irreversible damage, we evaluated the evolution of pHWI, DWI, and flow deficits during the first 24 h in a permanent middle cerebral artery occlusion model in the rat.
Materials and methods
Animal Model
The study was approved by the institutional animal care and use committee. Adult male Wister rats weighting 280 to 320 g were anesthetized (induction: 5% isoflurane in a 75%/25% air/oxygen mixture; maintenance 2% to 2.5% isoflurane) and immobilized using a custom-designed MRI-compatible cradle. Permanent middle cerebral artery occlusion (MCAO) was induced by inserting a 4-0 nylon suture into the lumen of internal carotid artery to block the origin of the MCA. Respiratory rate was monitored online using a small-animal monitoring and gating system (SA Instruments, Inc.). Using a femoral arterial line, mean blood pressure (Welch Allyn ProPac, Model 204 EC) and blood gases (pO2, pCO2, Chiron Diagnostics Model-248) were sampled. Typical respiratory rate was approximately 70 breaths/min; mean blood pressure was around 90 mm Hg. Before suture insertion, the isoflurane level was adjusted such that pO2 and pCO2 were within 100 to 170 and 35 to 50 mm Hg, respectively. After MRI of the acute ischemia period, animals were revived and allowed to have free access to food and water. The same anesthesia procedure was repeated at the 24 h follow-up MRI. T2-hyperintensity was used to quantify infarction, which has been shown to be a reliable approach (Neumann-Haefelin et al., 2000; Palmer et al., 2001; van Dorsten et al., 2002).
Rats (n = 31) underwent MCAO in which the depth of insertion of the suture was varied slightly to achieve different levels of perfusion reduction (within the same hypoperfusion area), leading to different perfusion/diffusion mismatches in the first hours. Rats were imaged every half hour from 0.5 or 1 h up to 3.5 h post-MCAO, as well as at 24 h. Most animals could be imaged at 0.5 h, but in some animals there was a small delay and the first images were acquired at 1 h. Ten animals were excluded. Six died before follow-up. In two rats, no pH and ADC abnormalities were detected during the hyperacute stage and follow-up. For two others, the coil-decoupler malfunctioned.
MRI
pH-weighted MRI: The pHWI is based on a magnetization transfer (MT) experiment in which the exchangeable amide protons of mobile tissue proteins and peptides are selectively irradiated using radiofrequency. This causes saturation of these protons, which is subsequently transferred to the water protons. Even though the concentration of such cellular proteins and peptides is in the micro- to millimolar range, these effects can be detected as a few percent signal change in the water line through a sensitivity enhancement mechanism (Goffeney et al., 2001; Ward et al., 2000; Wolff and Balaban, 1990).
In MT experiments (Balaban and Ceckler, 1992; Ward et al., 2000; Ward and Balaban, 2000), signal intensities in images with pre-irradiation (S) and without pre-irradiation (S0) are acquired, and a magnetization transfer ratio (MTR = 10–S/S0) can be determined. The so-called amide proton transfer (APT) effect can be detected by performing these irradiations at the resonance frequency of the amide protons as well as at a reference frequency on the opposite side of the water resonance. The APT image is obtained by calculating the MTR difference between images irradiated at ±3.5 ppm from water (Zhou et al., 2003). This MTR-asymmetry (MTRasym) map depends on two contributions: a constant one due to asymmetry in the conventional MT process for the semisolid cell fraction,

Many factors contribute to the APT process, including proton exchange rate, k (pH-dependent term), concentration of amide protons and water protons, T1 of water, and the duration of saturation, tsat (Zhou et al., 2004):
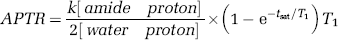
The amide proton exchange is base-catalyzed for pH > 5, and the exchange directly depends on pH according to

The calibration value for kbase was determined by performing the APT approach both in vivo and post mortem in a rat model. It could be shown (Zhou et al., 2003) that, during the first few hours post mortem, the predominant contribution to the APT signal change was because of pH effects, giving a 1.9% reduction in MTRasym for a pH decrease from 7.1 to 6.7, as measured by phosphorus MRI. Using pKw = 15.4 at 37°C, kbase was found to be 5.57 × 10⁹s−1 (Zhou et al., 2003). Similar signal reductions were found during the initial hours of focal permanent ischemia, and we therefore feel confident to call these MTRasym maps pH-weighted (pHWI) images. When referencing the ischemic zone with contralateral normal brain, the
Multimodality MRI: Images were acquired using a 4.7T imager (Bruker Biospin, Billerica, MA, USA). Cross coils (volume-coil excitation, surface-coil detection) with active decoupling were utilized to obtain both homogeneous excitation and high signal-to-noise ratio. A single coronal slice was positioned around the Bregma region. Single-shot echo-planar imaging was used for all MRI modalities (field of view: 32 × 32 mm, matrix: 64 × 64, slice: 2 mm, bandwidth 200 kHz).
Parametric T1 images were acquired using adiabatic inversion and seven inversion-recovery intervals (50, 300, 600, 1200, 1800, 2500, and 3500 ms); relaxation delay after acquisition was 3 secs; echo time (TE) was 28.6 msecs. Parametric T2 images were obtained using a spin-echo sequence with seven TE-values equally spaced from 30 to 90 msecs and a repetition time (TR) of 3 secs. Average apparent diffusion constants, ADCave = (ADCxx + ADCyy + ADCzz)/3, were measured using seven b-values (0–1000 sec/mm2) and Pattern III of a single-scan trace-diffusion sequence (Mori and van Zijl, 1995) (TR = 3 secs, TE = 58.6 msecs). This pattern employs four units of three simultaneous bipolar gradients in three directions, two before and two after the spin-echo refocusing pulse. Perfusion imaging was performed using continuous arterial spin labeling (CASL, Williams et al., 1992) with 3 secs labeling at a distance 20 mm away from the imaging slice (TR/TE = 6 secs/28.6 msecs). For pHWI (Zhou et al., 2003), selective MT irradiation pulses of 1.5 μT lasting 4 secs (tsat) were applied consecutively at offsets ±3.5 ppm from the water resonance (TR/TE = 10 secs/28.6 msecs). A signal intensity normalization image (S0) without pre-irradiation was also acquired, and the magnetization transfer ratio (MTR = 1–S/S0) was determined. Subsequently, MTR was determined at +3.5 ppm and -3.5 ppm from water (reference image). Lipid artefacts were avoided as described previously (Sun et al., 2005). Relaxation and diffusion images were signal-averaged four times; perfusion and pHW images were averaged 16 times.
Data Analysis
All images were processed using Matlab (Mathworks, Natick, MA, USA). T1, T2, and ADCave maps were obtained using least-squares mono-exponential fitting of signal intensities as a function of inversion time, TE, and b-value, respectively. Perfusion maps were reconstructed from images with and without labeling using equation (9) of Williams et al. (1992), a brain partition coefficient of 0.9 ml/g, and the average T1 over normal brain (1.50 secs, in agreement with literature for 4.7 T). The pH-weighted image was obtained by calculating the MTRasym between images irradiated at ±3.5 ppm from water (Zhou et al., 2003). This MTRasym may vary because of small frequency shifts and power variation (e.g. because of coil loading). We found a range of values for individual MTRasym in normal contralateral brain, giving a large variation in the average: 1.2% ± 1.2%. However, when comparing contralateral and ipsilateral results, these effects are removed, and the MTRasym ipsi-contralateral difference because of ischemia was more accurate (see results). To compare images of different animals at the same windowing and to be able to set threshold levels for automated image analysis for all animals, normalization in relation to the contralateral hemisphere was performed such that the mean MTRasym over the normalized area was 0.0294, the value found as normal in previous work (Zhou et al., 2003).
For DWI, a mask was chosen based on the diffusion images at the highest b-value to remove background and extra-cranial signal. Ventricle (hyperintense on ADCave) and corpus callosum (hypointense on T1) were manually removed. Deficit areas were automatically detected using thresholds of 30%, 30%, 15% lower, and 15% higher than contralateral for CBF, MTRasym, ADCave, and T2, respectively. In absolute value, these were 80.5 ml/100g/min, 0.021, 0.69 μm2/msecs and 68.4 msecs, respectively. Owing to low signal-to-noise ratio of the CASL images, an averaged CBF map was used to characterize CBF during the acute period. The deficit areas of the other parameters were normalized in relation to the CBF lesion volume for the acute period and at 24 h, respectively. This area is constant in a permanent occlusion model. The time dependencies of the ischemic evolution of the pHWI and ADC deficits were subsequently plotted for two different groups, depending on the relationship between the perfusion and diffusion deficits (see Results). A paired two-tailed t-test was used to investigate the ability of pHWI, PWI, and ADC at 3 h to predict the ultimate 24 h infarction as indicated by T2 hyperintensity.
Results
All 21 animals analyzed showed the expected maximum perfusion deficit on PWI, but with variable deficits on pHWI and ADCave. To compare evolutions of pHWI and ADCave maps within this flow deficit, animals were assigned to two groups based on flow/diffusion mismatch at 2 h from MCAO:
Group I (n = 3, negligible mismatch): CBF deficit-~ADCave deficit (within 20%),
Group II (n = 18, mismatch): CBF deficit > ADCave deficit (beyond 20%).
(Figure 1A) shows a typical example of Group I, with deficits from all three imaging types matching very well, and with changes on T1 and T2 images becoming visible within the first 2 to 3.5 h. This close match of PWI, pHWI, and ADCave lesions during the hyperacute period indicates severe energy breakdown and concomitant cell depolarization in this severe ischemia group, and all hypoperfused regions progressed to complete infarction, as confirmed by the 24 h follow-up MRI. For animals in Group II (Figure 1B–Figure 1D), several types of situations occurred. In some animals, the ADC deficit was smaller than the PWI and pHWI deficits during the first hours, but, by 3.5 h, evolved to the area of the full pH deficit that ultimately corresponded to the infarct area at 24 h (Figure 1B). In other animals (e.g. Figure 1C), both pHWI and ADC deficits were much smaller than the perfusion deficit, with the ADC deficit remaining confined to an area within, but corresponding closely to the pHWI deficit. Interestingly, in this particular animal, the pHWI lesion evolved only marginally throughout the hyperacute period. The follow-up MRI showed a very small infarct, in close resemblance to the confined pHWI and ADC deficits at 3.5 h. Several animals within Group II showed minimal ADC effects in the hyperacute period, despite the presence of perfusion and pH effects (Figure 1D). This representative animal showed no detectable diffusion deficit, while the pHWI deficit initially fluctuated in size but ended up to be a large fraction of the hypoperfusion region at 3.5 h. At the 24 h end point, a small infarct was visible within the area of the 3.5 h pHWI deficit. This animal also showed a significant T2-hypointensity within the PWI deficit. We tentatively explain this T2 reduction as a blood-oxygenation-level-dependent effect consequential to an initial small flow reduction that increases the oxygen extraction fraction (Grohn et al., 1998; Oja et al., 1999).
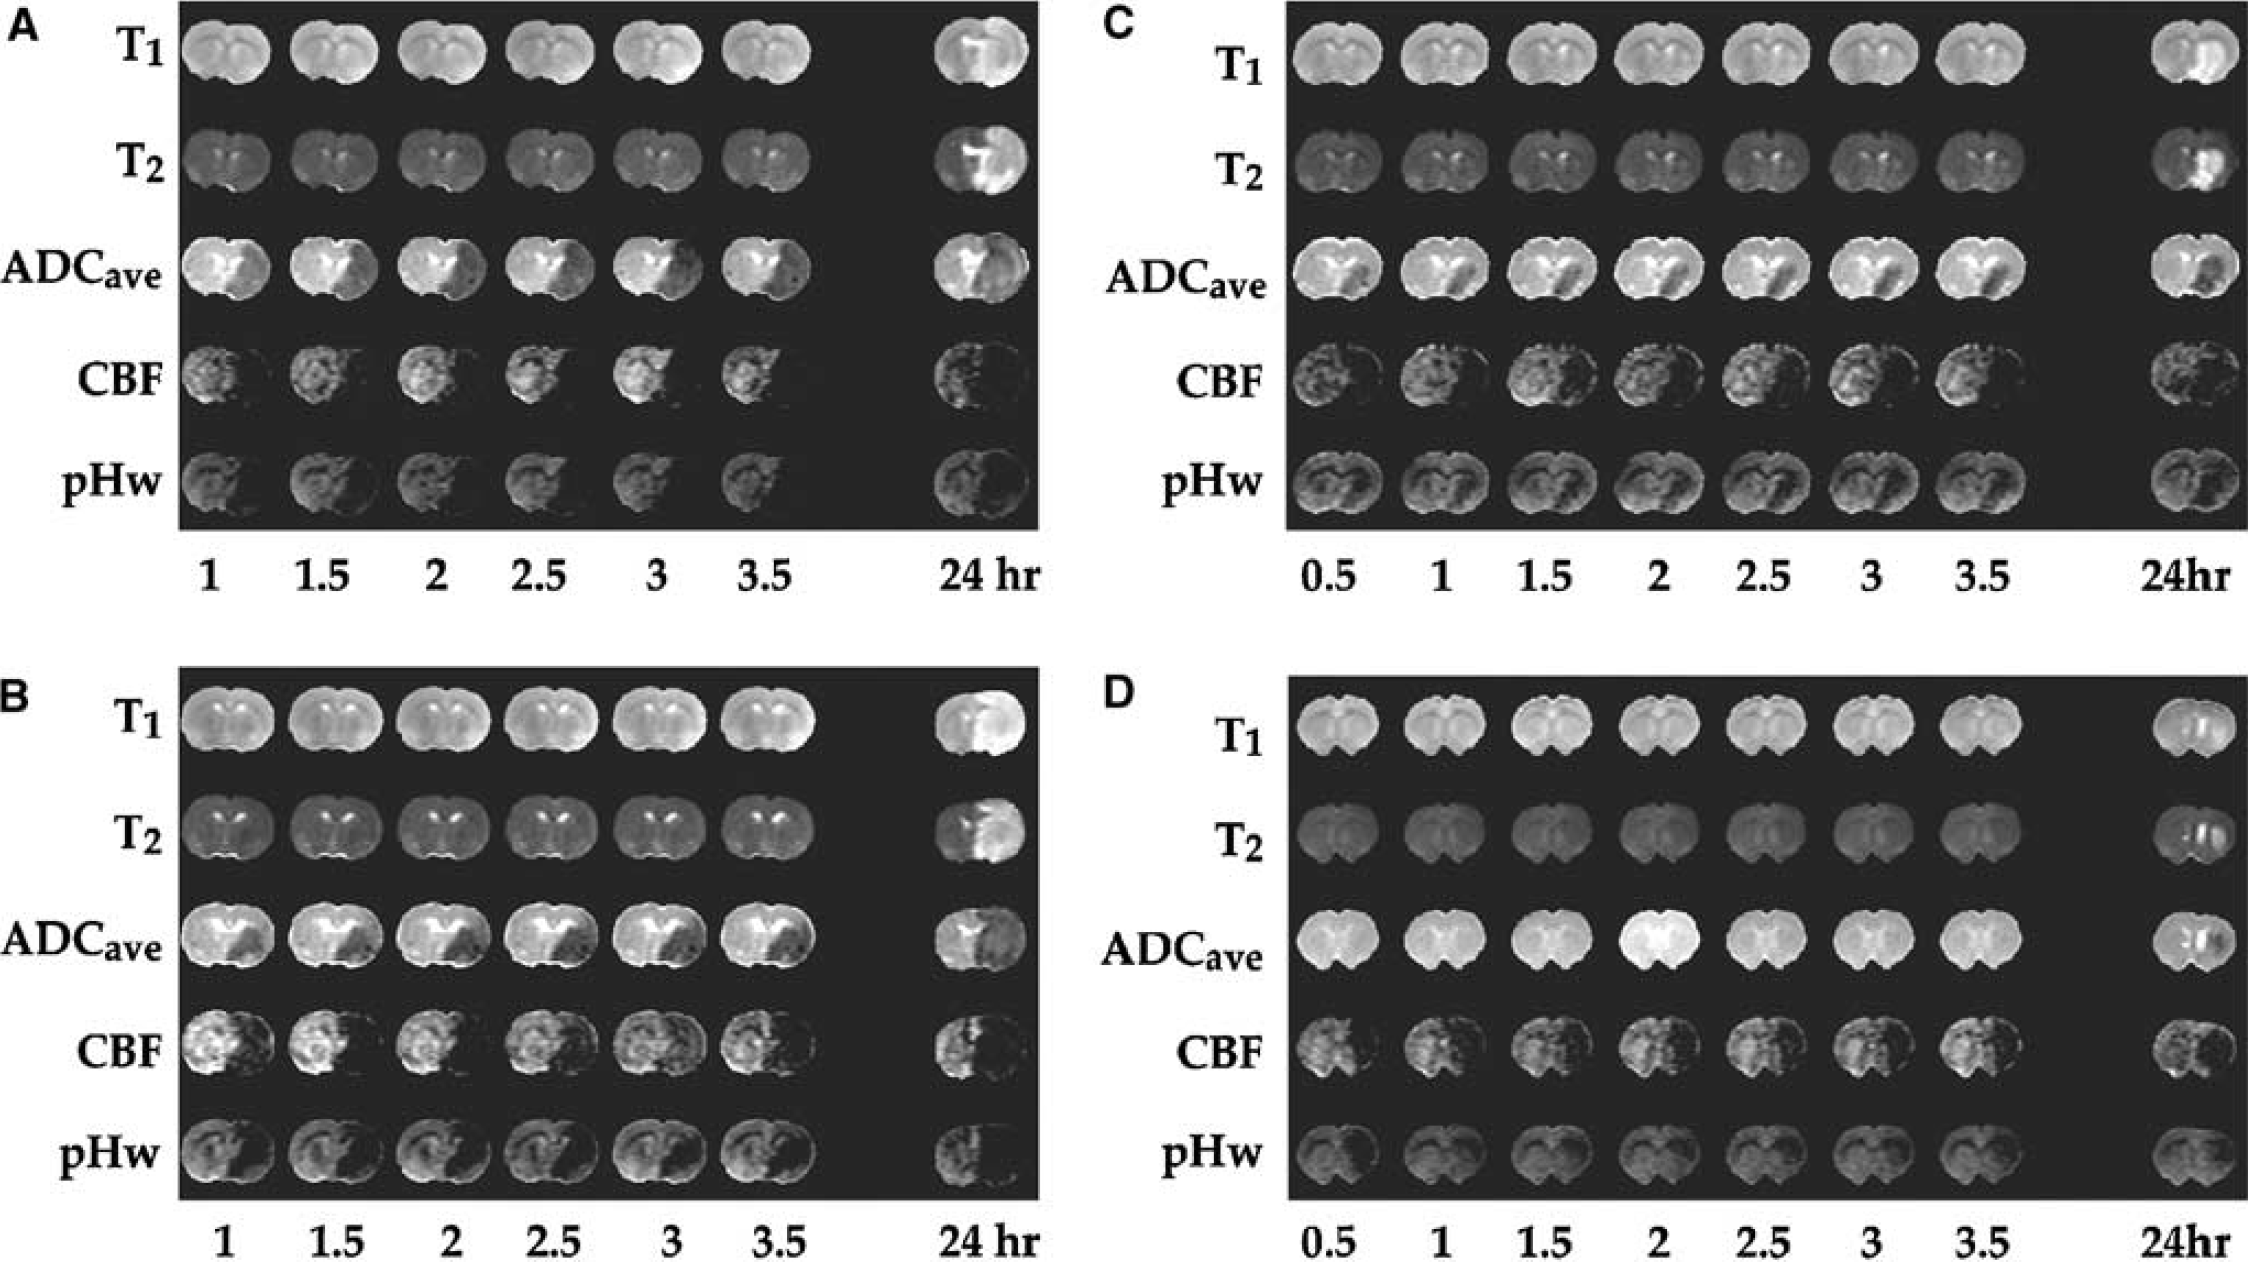
Example images of ischemic animals in Groups I—II. (
Group analysis (n = 21) provided the following absolute values (±s.d.) for the different physiological and physical parameters: CBF (113 ± 33 ml/100g/min) in the normal hemisphere; ADCave (0.80 ± 0.04 μm2/msecs); T2 = 59.5 ± 1.2 msecs; T1 = 1.47 ± 0.07 secs, as mentioned in the data processing, the MTRasym, being a small effect, varied more and gave a result of 1.2% ± 1.2%. However, when comparing ipsilateral with contralateral, the MTRasym difference was more constant and found to be 2.6% ± 0.9% within the diffusion lesion at 2 h post-occlusion (n = 15; other animals had minimal diffusion lesion, e.g. as in Figure 1D, and were not included).
Group analysis for the ischemic lesion evolution is shown in Figure 2. As mentioned above, in this initial study of this new method, the depth of insertion of the suture was purposely varied to achieve different levels of perfusion reduction (within the same hypoperfusion area), so that the same volume of tissue was affected but to a different degree. The goal was to achieve different perfusion/diffusion mismatches in the first hours and study the original deficits and spatial evolution of the different parameters. When performing a group analysis on such a range of ischemic lesions, the variation is quite large. However, when following the mean of the ADC and pHWI deficits, a clear pattern emerges. In Group I, normalized pHWI and ADC deficits at 2 to 3.5 h ranged from 90.1% to 92.8% and 81.4% to 86.6% of the PWI deficit during the acute stage, respectively, showing little evolution. Final infarction ranged from 92.4% to 95.1% of the CBF deficit. In Group II, pHWI deficits remained quite stable (75.7% to 80.4%) during the 2 to 3.5 h hyperacute period. Final infarction was 78.2% ± 5.9% (n = 18, s.e.), coinciding well with the pHWI deficit at 3 to 3.5 h. The ADCave deficit remained small (30.7% to 42.1%) in the acute period, but grew over the following day to match the pHWI deficit.
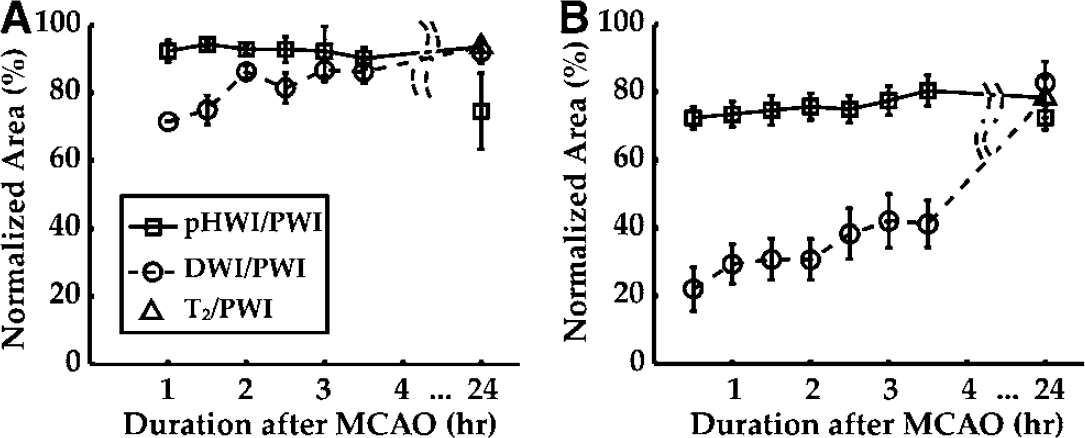
Temporal evolutions of pHWI (squares) and ADC deficits (circles) normalized by the PWI deficit: (
The final infarction area was not different from the pHWI deficit (P = 0.84) at 3 h, but significantly different from the ADC deficit (P < 0.00001) and from the PWI deficit (P < 0.001).
Discussion
The results show multiple types of ischemic evolution after permanent ischemia that could be captured using CBF imaging (the deficits in which are presumed to correspond to PWI deficits in the clinic), pH-weighted imaging, and measurement of ADCave. Average pHWI deficits were always smaller than the PWI deficits and always equal to or larger than the ADC deficits. Overall, the pHWI deficit correctly predicted progression to infarction and outlined the approximate size of infarction. The mean end point lesion in all animals was always smaller than the original perfusion deficit (Figure 2), in line with the understanding that part of the perfusion deficit is due to benign oligemia. For this permanent occlusion model, early focal ADC deficits identified the stroke core, within which cellular depolarization was fast and could generally be captured within 30 to 60 mins. However, the absence of ADCave reduction in a large fraction of the pHWI-deficit region appears to be in line with the notion of a classic penumbra. Within such a pH-impaired region, it is likely that metabolism is initially sustained by anaerobic glycolysis, the lactic acid byproduct of which reduces intracellular pH, as indicated by the hypointensity in pHWI. Anaerobic glycolysis is not efficient in energy production and cannot sustain cellular metabolism over an extended period of time. Thus, without timely reperfusion, cells will ultimately depolarize, as measured by a reduced ADCave. Over time therefore, in this permanent occlusion model, the ADC deficit expanded and matched the pHWI deficit. The absence of a pHWI deficit in certain areas of PWI hypoperfusion indicates that the energy requirement for normal aerobic metabolism was maintained there. Such a pHWI—PWI mismatch area is therefore interpreted to represent a benign oligemia area not at any immediate risk of progression to infarct. These findings are in line with our original hypothesis that pHWI should be able to separate benign oligemia from an area of impaired metabolism that is still viable (the classic penumbra).
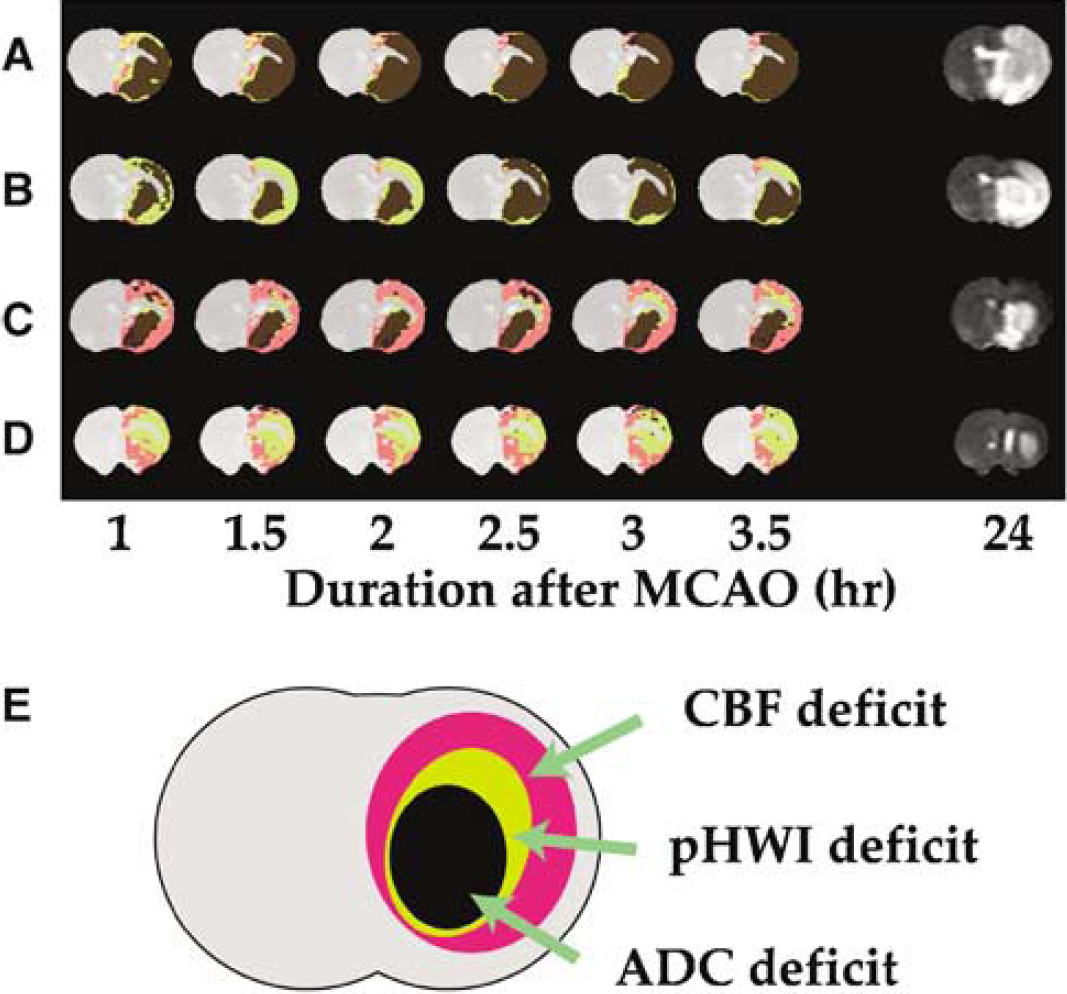
To illustrate the subdivision between areas of ischemic core with depolarization, pHWI deficit, and maximum flow deficit, the multimodality imaging results of the animals in Figure 1A–Figure 1D were combined into single maps in Figure 3A–Figure 3D with the subdivisions outlined in Figure 3E. If these results can be confirmed in the clinic, such multimodality maps may be useful as guidelines for reperfusion therapy, with a large mismatch between pHWI and DWI deficits indicating need for recanalization. Matching pHWI and DWI deficits within a large PWI deficit would indicate reduced likelihood of core expansion (e.g. Figure 1C and Figure 3C). Obviously, such suggestions would have to be evaluated post hoc in clinical populations and their results compared with more conventional approaches such as PWI, blood volume, and mean transit times imaging before being implemented. In addition, several potentially constraining issues need to be kept in mind. First of all, as recently shown in humans (Fiehler et al., 2002a; Guadagno et al., 2005; Kidwell et al., 2004; Nicoli et al., 2003), the DWI deficit may be metabolically heterogeneous and may partially resolve, for example, on spontaneous partial reperfusion. We speculate that two situations may occur when information on pHWI would be available. If reperfusion successfully normalizes aerobic metabolism, no pHWI/DWI deficit would occur, indicating no urgent need for treatment. If spontaneous flow recovery is insufficient or absent, a PWI deficit would be visible that would outline oligamia as well as the maximum area at risk of infarction (penumbral outer boundary). Even though the penumbral inner boundary is unclear, treatment should be initiated if a large pHWI/DWI deficit is present. If the pHWI/DWI mismatch is small, the situation would be more complex as multimodality images are only one point within the ischemic evolution and prediction outcomes are difficult to assess. Thus, even though the application of PWI, pHWI, and DWI may help to delineate the tissue into ischemic core, classic penumbra, and regions of benign oligamia, the dynamic nature of ischemic thresholds may lead to complex and heterogeneous evolutions. Within the region of benign oligemia, the balance between energy requirement and supply may be delicate and minor changes in perfusion may change the tissue status. For prolonged occlusions, the remaining flow and residual cerebral energy reserve may no longer be able to sustain aerobic tissue metabolism. However, the initial results for Group II show that even for this permanent occlusion model, areas of pHWI-CBF mismatch did not proceed to pH reduction in a period of 24 h.
(
Finally, it is important to discuss the technical limitations of the new pHWI technology. The present results were obtained using a single slice approach in animal models at high magnetic field strength (4.7 T). The methodology used for pHWI is relatively novel and depends not only on tissue pH but also on water content, content of small mobile proteins and peptides, and temperature. A temperature decrease during ischemia may potentially introduce a minor overestimation of the pH reduction, but should actually benefit deficit detection. However, prolonged ischemia and the occurrence of edema may affect the pH-deficit region in a presently unknown manner. Even though this is not always the case, some pH-weighted images at the 24 h end point showed a region somewhat smaller than the ADC deficit, which may be related to this issue. Another important point that needs to be realized is that the pHWI contrast is based on performing an asymmetry measurement that is very sensitive to experimental conditions such as magnetic field inhomogeneity. In addition, even though absolute pH measurements are possible using the APT approach (Zhou et al., 2003), this is not trivial. To allow comparisons between groups, we, therefore, needed to normalize the measured asymmetries in relation to contralateral brain, which was presumed normal. The pHWI approach outlined here will work better at higher magnetic fields. However, it requires more radiofrequency power than typical MRI acquisitions, and power deposition scales with the square of the magnetic field strength. Thus, some specific absorption rate issues may become an issue when going to very high fields. We expect that it will take at least several years to establish this technology for fast reliable and reproducible multislice imaging on clinical scanners. However, recent availability of clinical MRI scanners at 3T will allow increased speed for multimodality exams and should ultimately allow inclusion of pHWI.
The fact that there are many factors contributing to the pH-weighted images may reduce enthusiasm for this new approach, However, it is important to point out that, during very acute ischemia, the pH change is the predominant effect (90% or higher). The acuteness of ischemia can be easily judged by comparison with T1 and T2 images, which will not show contrast yet. So, as long as these relaxation-based images remain unchanged, the method will be reliable. A second cause for concern may be the small size of the effect (~ 1.9%) on the water intensity. However, it has to be realized that this is a very large relative effect that can be easily detected in the pH-weighted (MTRasym (3.5 ppm)) images, which itself are only a few percent in intensity.
Conclusions
We demonstrated the use of amide proton transfer imaging to acquire pH-weighted images during acute ischemia. The addition of this modality allowed us to subdivide the PWI—DWI mismatch area into regions with and without tissue acidosis. Based on the fact that the pHWI-deficit area at 3 h was not significantly different from the 24 h end point, while the PWI and ADC deficits were, we suggest that the outer boundary of the hypoperfused area that shows a decrease in pH without DWI abnormality may better correspond to the classic ischemic penumbra border than the PWI deficit. The pHWI—PWI mismatch would then relate to benign oligemia, and the pHWI-DWI mismatch to the minimal penumbral area. These first results show that pHWI can provide information complementary to PWI and DWI in the delineation of very acute ischemic tissue, when T1 and T2 changes are not yet visible. Studies employing reperfusion animal models and clinical pilot studies comparing this approach with established measures based on PWI, blood volume, and mean transit times measures will have to be performed to further confirm whether this approach will be suitable as an addition to current multimodality acute stroke protocols and their parametric evaluation (Wu et al., 2001, 2003a).
Footnotes
Acknowledgements
We are grateful to Dr Ona Wu (MGH) for very helpful comments with the manuscript and to Dr Asif Mahmood and Seth Smith for discussions.