
Abstract
Although chronic arterial hypertension (CAH) increases the risk of stroke and the severity of the resultant lesion, it is rarely integrated in preclinical studies. Here, we analyzed the impact of CAH on the acute spatiotemporal evolution of the ischemic penumbra as defined by the perfusion-weighted imaging/diffusion-weighted imaging mismatch. Sequential 7T-MRI examinations were performed from 30 minutes up to 4 hours after permanent cerebral ischemia in genetically hypertensive rats (spontaneously hypertensive rats, SHR), renovascular-hypertensive rats (RH-WKY), and their normotensive controls (Wistar-Kyoto rats, WKY). The apparent diffusion coefficient (ADC)-defined lesion was larger in hypertensive rats than in normotensive animals as early as 30 minutes after the ischemia. The ischemic penumbra was smaller in both genetically and renovascular-hypertensive rats (at 30 minutes; SHR = 66 ± 25 mm3, RH-WKY = 55 ± 17 mm3 versus WKY = 117 ± 14 mm3;
Keywords
Introduction
The global burden of stroke is a major health issue because of its incidence and its morbid consequences. Even if many pharmacological treatments of ischemic stroke have been proven efficient in animal studies, none could be transferred to the clinical situation with the same efficiency (O'Collins et al, 2006). One of the issues that has been put forward to explain this failure of translation of the bench results to the bed side is the inadequacy of the animal models of stroke (Durukan et al, 2008). Indeed, most of the available preclinical studies rely on the use of young and healthy animals devoid of concomitant pathologies such as chronic arterial hypertension (CAH), which is often associated with stroke in humans (Lawes et al, 2008).
The CAH is a frequent pathology with > 25% of the worldwide population hypertensive and the incidence of this disease still increasing (29% predicted by 2025) (Kearney et al, 2005). The CAH is the major risk factor for stroke as > 50% of strokes are attributable to high blood pressure and more than two thirds of patients suffering from stroke are hypertensive. Lowering blood pressure reduces stroke incidence; however, even if antihypertensive treatments are widely available, efficient control of hypertension is poorly achieved in the adult population. Furthermore, CAH is also an aggravating factor of the ischemic lesion (Takaba et al, 2004). Indeed, it is well known that this insidious pathology alters the structure and the function of cerebral arteries, which renders the brain more susceptible to severe diminution of arterial perfusion pressure (Iadecola and Davisson, 2008). Despite these facts, few experimental studies of ischemic stroke pathophysiology and treatment take CAH into account.
The influence of CAH on the ischemic penumbra, a brain region that represents the target of any acute therapeutic intervention, and on its kinetics, which by definition, determines the window of therapeutic opportunity has not been fully characterized. On the basis of perfusion-weighted imaging (PWI) and diffusion-weighted imaging (DWI), the ischemic penumbra is now widely defined as the mismatch between the volume of perfusion deficit and the volume of tissue with decreased diffusion of water molecules (Schlaug et al, 1999; Lövblad et al, 2003). Although this index has been criticized as perfusion deficit may encompass both penumbral and oligemic tissues (Sobesky et al, 2005; Takasawa et al, 2008), PWI/DWI mismatch provides an interesting approximation of the ischemic penumbra and has a major clinical application in the identification of patients able to respond to acute treatment (Olivot and Marks, 2008; Albers et al, 2006).
On the basis of the mismatch between PWI and DWI magnetic resonance imaging (MRI), we sought to further characterize the impact of CAH on the acute spatiotemporal evolution of the ischemic penumbra through the use of two well-characterized models of rat CAH (e.g., genetic and renovascular-induced hypertension compared with normotensive controls).
Materials and methods
Animals
Genetic-hypertensive rats (spontaneously hypertensive rats, SHR) and normotensive rats (WKY rats) were purchased from the R Janvier Breeding center, le Genest Saint-Isle, France. All rats were housed in a temperature-controlled room with 12 hours day/night cycle with food and water access
Two-Kidney One-Clip Renovascular Hypertension
To induce renovascular hypertension, 10 5-week-old WKY rats underwent renal artery constriction according to the two-kidney one-clip model (Del Bigio et al, 1999). Rats were anesthetized with isoflurane (2% to 3% in 70/30 N2O/O2) and a median longitudinal incision was performed on the abdominal skin and muscle. Then, the left kidney was exposed, the renal artery and vein were isolated and a silver clip with an inner diameter of 0.20 mm was placed around the renal artery to induce stenosis. Abdominal muscle and skin were sutured, and the rats received an analgesic (Tolfédine 4%, 4 mg/kg intramuscularly) and thereafter were allowed to recover from anesthesia. Two rats died ~2 months after the surgery probably because of renal insufficiency. The surviving rats were subjected to focal ischemia 3 months after the induction of renal artery stenosis.
Blood Pressure Measurements in Awake Animals
Arterial blood pressure (ABP) was measured in awake RH-WKY rats by the tail-cuff method (storage pressure meter-5002 Letica, Barcelona, Spain) before and fortnightly over the 3 months after stenosis. In SHR and WKY, ABP was measured weekly during the month preceding the induction of ischemia. To ensure correct ABP assessments, rats were prewarmed at 35°C and the measures were repeated five times for each session.
Cerebral Ischemia
The SHR, WKY, and RH-WKY rats were anesthetized with isoflurane (1.9% to 2.3%) and were intubated and artificially ventilated (Rodent Ventilation-683 Harvard, Holliston, MA, USA). End tidal CO2 was continuously measured (Micro-capnograph CI240 Colombus Instruments, Columbus, OH, USA) and corrected if necessary. Polyethylene tubings were inserted into the femoral vein for injections and into the femoral artery for monitoring of ABP, heart rate and to withdraw samples of arterial blood. Blood samples were taken once before ischemia and three times during MRI acquisitions, to measure blood gases, pH, and base deficit (Bayer-860, Bohemia, NY, USA). Rectal temperature was monitored and maintained around 37.5°C, with a thermostatically controlled heating pad (Homeothermic Blanket, Harvard, Holliston, MA, USA) during the whole period of anesthesia.
Permanent focal cerebral ischemia was induced using the intraluminal approach (Lecrux et al, 2007). The rat was placed into a stereotaxic frame (Kopf Instruments, Tujunga, CA, USA) and a laser-Doppler flowmetry probe (FloLab Moor Instruments, Millwey, UK) was positioned on the right parietal bone, corresponding to the middle cerebral artery territory (coordinates 1.5 mm posterior, 5.5 mm lateral to the bregma), previously thinned by a saline-cooled dental drill. Then the animal was placed in the supine position and a 0.18-mm diameter nylon thread coated with a thermofusible glue to form a distal cylinder of 0.380 mm diameter and 2.5 mm length was introduced into the internal carotid,
Magnetic Resonance Imaging
The MRI was performed on a Bruker Pharmascan 7-Tesla horizontal magnet (Ettlingen, Germany). Rats were placed in a stereotaxic head holder in the magnet and physiologic parameters were monitored as described above. The animals underwent MRI acquisitions over the 4 hours after ischemia. For all imaging modalities, seven slices, 1.5 mm thick with a 0.5-mm interslice gap were acquired (except for angiography) with a 38.4 × 38.4 mm2 field of view (FOV) (except for angiography and T2* EPI). The DWI was acquired at 30, 90, 120, 150, 180, and 240 minutes after occlusion with the following parameters: two-shot spin echo echo-planar images, 128 × 128 matrix, TR/TE = 3500/41.04 milliseconds,
At the end of MRI acquisitions, the catheters were removed and the skin sutured, local anesthetic was applied to surgical wounds and the rats were allowed to recover from anesthesia.
Post Mortem Evaluation
The animals were euthanized 24 hours after ischemia. Coronal brain slices (20 μm) were cryostat-cut and stained with thionin. The stained sections were then photographed and infarct volumes were calculated, with oedema correction according to the following equation: infarct volume = contralateral hemisphere volume minus ipsilateral noninfarcted tissue volume (Lin et al, 1993).
Data Analysis
The MR images were analyzed in a masked manner using the image processing Paravision and in-house macros using ImageJ software. For all MRI modalities, the images were analyzed through the use of normalized thresholds to take into account any interindividual or global time-related variation of the parameter analyzed. This approach also allows each animal to be used as its own control at all time points. Abnormal ADC was defined by thresholding the images at the mean minus 2 s.d. of the values of the contralateral (nonischemic) hemisphere with the exclusion of the ventricles. Regarding the PWI, time to peak and maximal signal drop maps were calculated from the first pass of gadolinium chelate information. The time to peak is calculated as the time taken for the curve to peak from the last baseline period. The maximal signal drop illustrates the degree of signal drop and infers severely hypoperfused pixels. Pixels were considered abnormally perfused when either the time to peak was longer than that of the contralateral tissue plus 2 s.d. or when the maximal signal drop was < 3 s.d. of the basal signal. The volume of PWI–DWI mismatch was calculated by subtracting the volume of tissue with significant reduction in ADC from that with significant perfusion deficit. Given the kinetics of gadolinium chelate in the plasma, the PWI acquired at 30, 150, and 240 minutes were used to calculate the mismatch at 30 and 90 minutes, 120 and 150 minutes, and 180 and 240 minutes, respectively.
Incidence maps of the ADC-defined lesion and the hypoperfused area were generated. Images were first coregistered based on the ImageJ plugin turboReg (Thévenaz et al, 1998). The coregistration was performed on masks of the whole brain and then applied to both the lesion masks and the ADC maps. The incidence map was generated by summing all lesion masks from the same slice and applying a color look-up table. This map was then overlayed on averaged coregistered ADC maps. The same procedure was performed to generate hypoperfusion incidence maps. Furthermore and to illustrate the mismatch, DWI were resized and coregistered to PWI.
Statistical Analyses
Data are represented as mean ± s.e.m. Statistical analysis was performed with analysis of variance (ANOVA) or two-way repeated measures ANOVA followed, where appropriate, by Fisher's protected least significant difference or by paired
Results
Physiologic Parameters
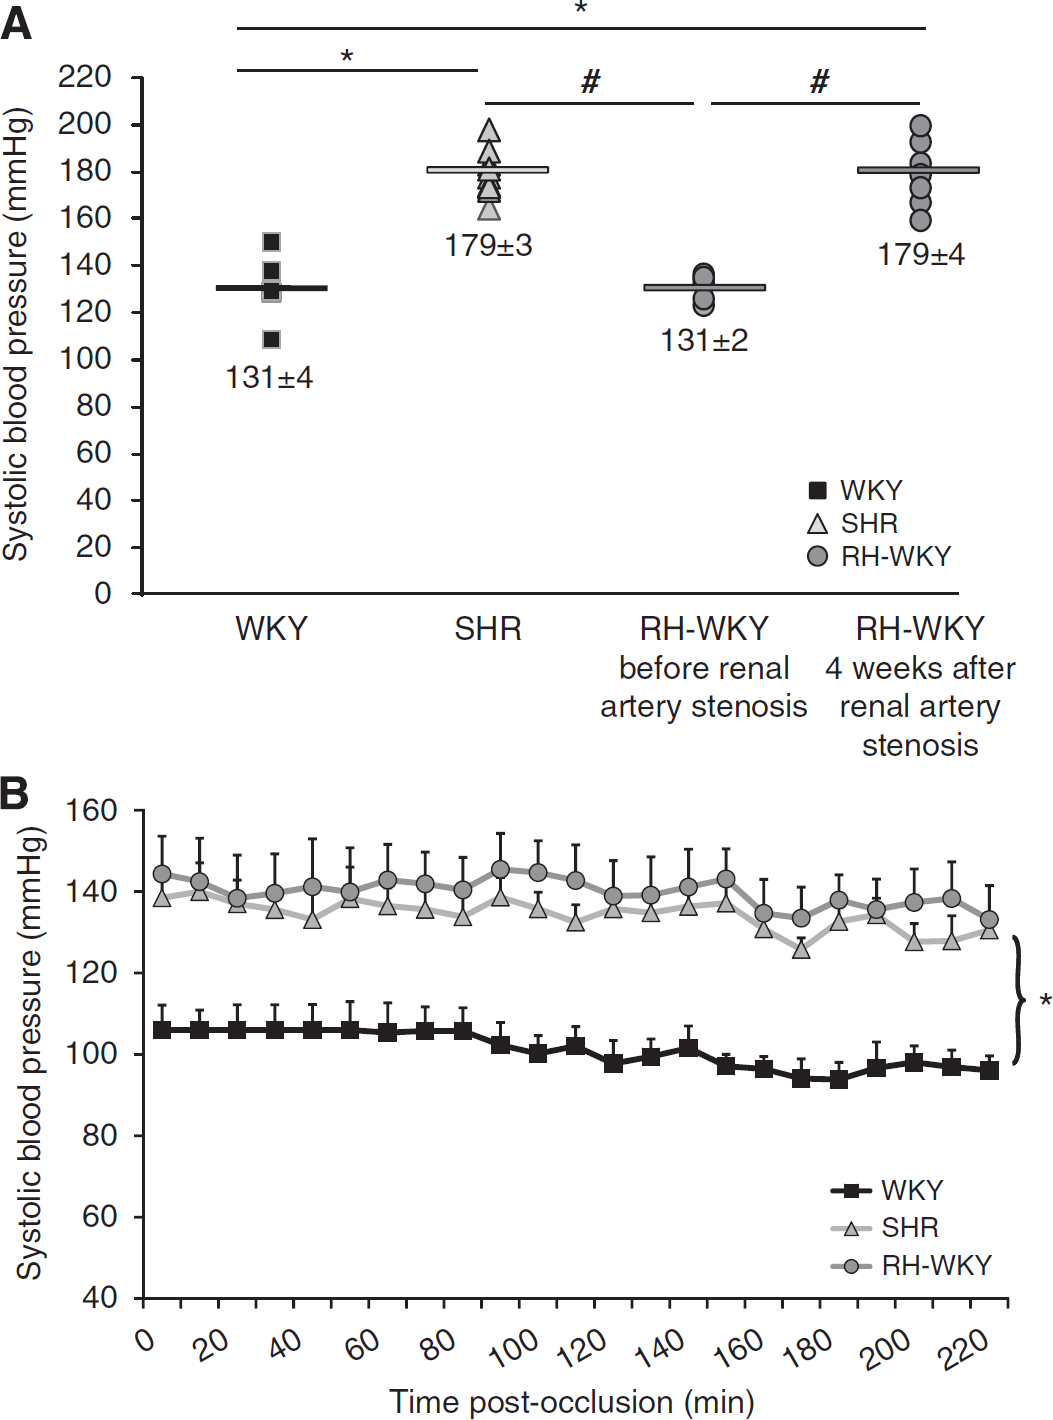
In RH-WKY, ABP was similar to those of WKY before the induction of renal artery stenosis and then increased progressively to reach a plateau 4 weeks later, corresponding to an increase of 30%. At this time, ABP was similar in awake SHR and RH-WKY but significantly higher than that measured in awake WKY (
(
Physiological parameters during the induction of ischemia and MRI acquisition
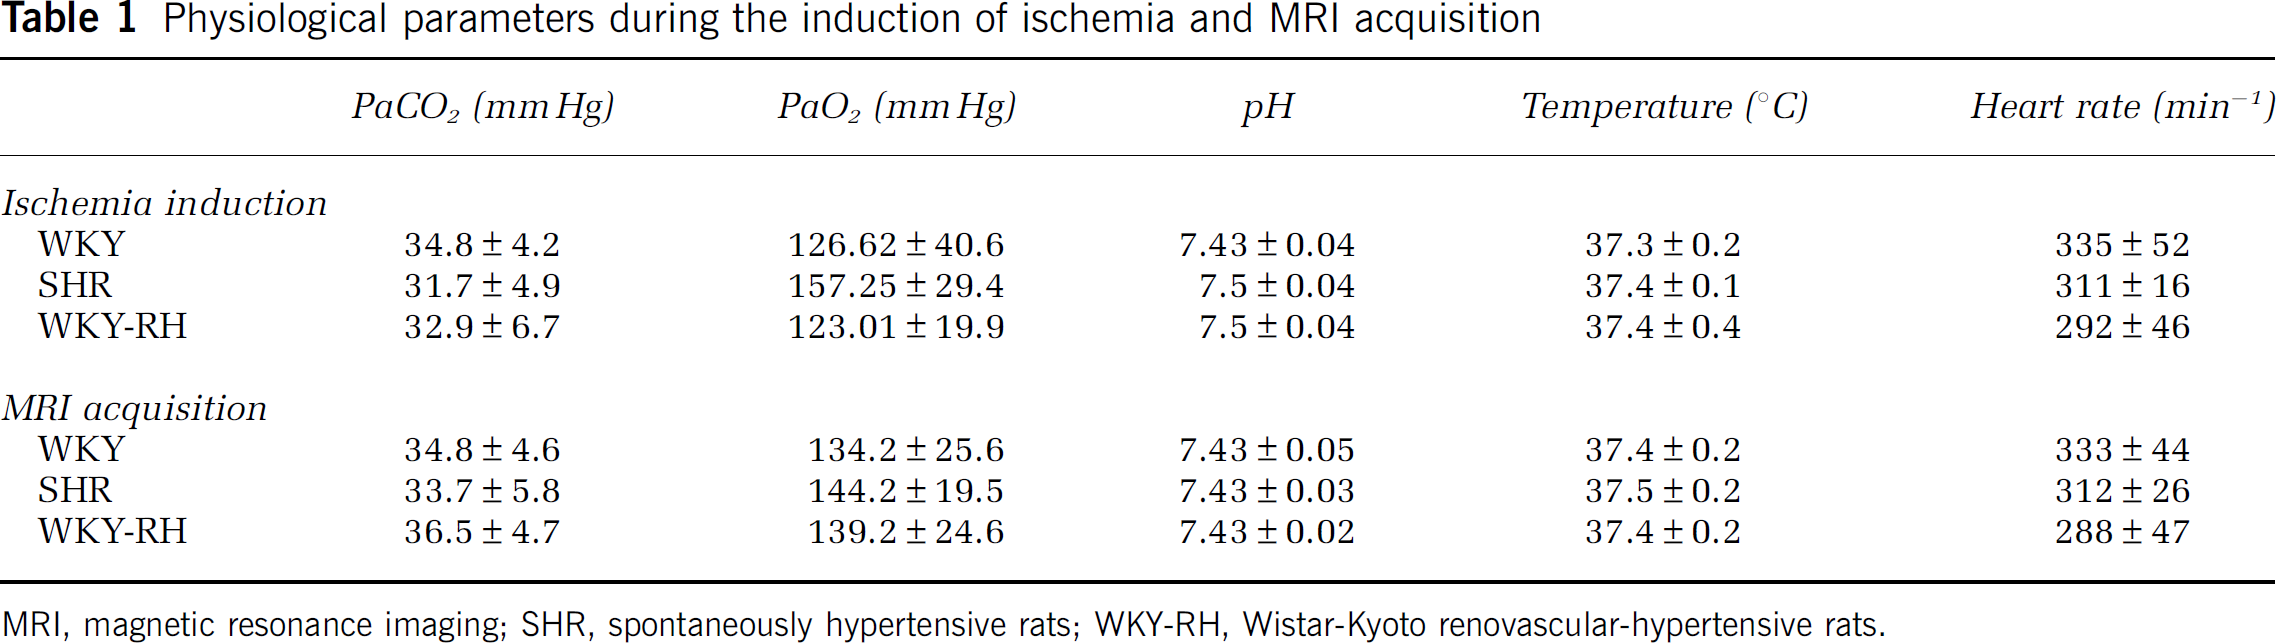
MRI, magnetic resonance imaging; SHR, spontaneously hypertensive rats; WKY-RH, Wistar-Kyoto renovascular-hypertensive rats.
Magnetic Resonance Imaging Observations
The MR angiography performed at 30 minutes and 4 hours after ischemia confirmed the arterial occlusion and the absence of spontaneous reperfusion in all animals as illustrated by the disappearance of the right middle cerebral artery (Figure 2). The T1-enhancement and T2* imaging did not reveal, respectively, any leak of the gadolinium chelate in the parenchyma nor any intracerebral hemorrhage in all the animals irrespective of the group studied (Figure 2). However, ADC maps and perfusion images elicited well-delineated lesions at all times analyzed (Figure 2).
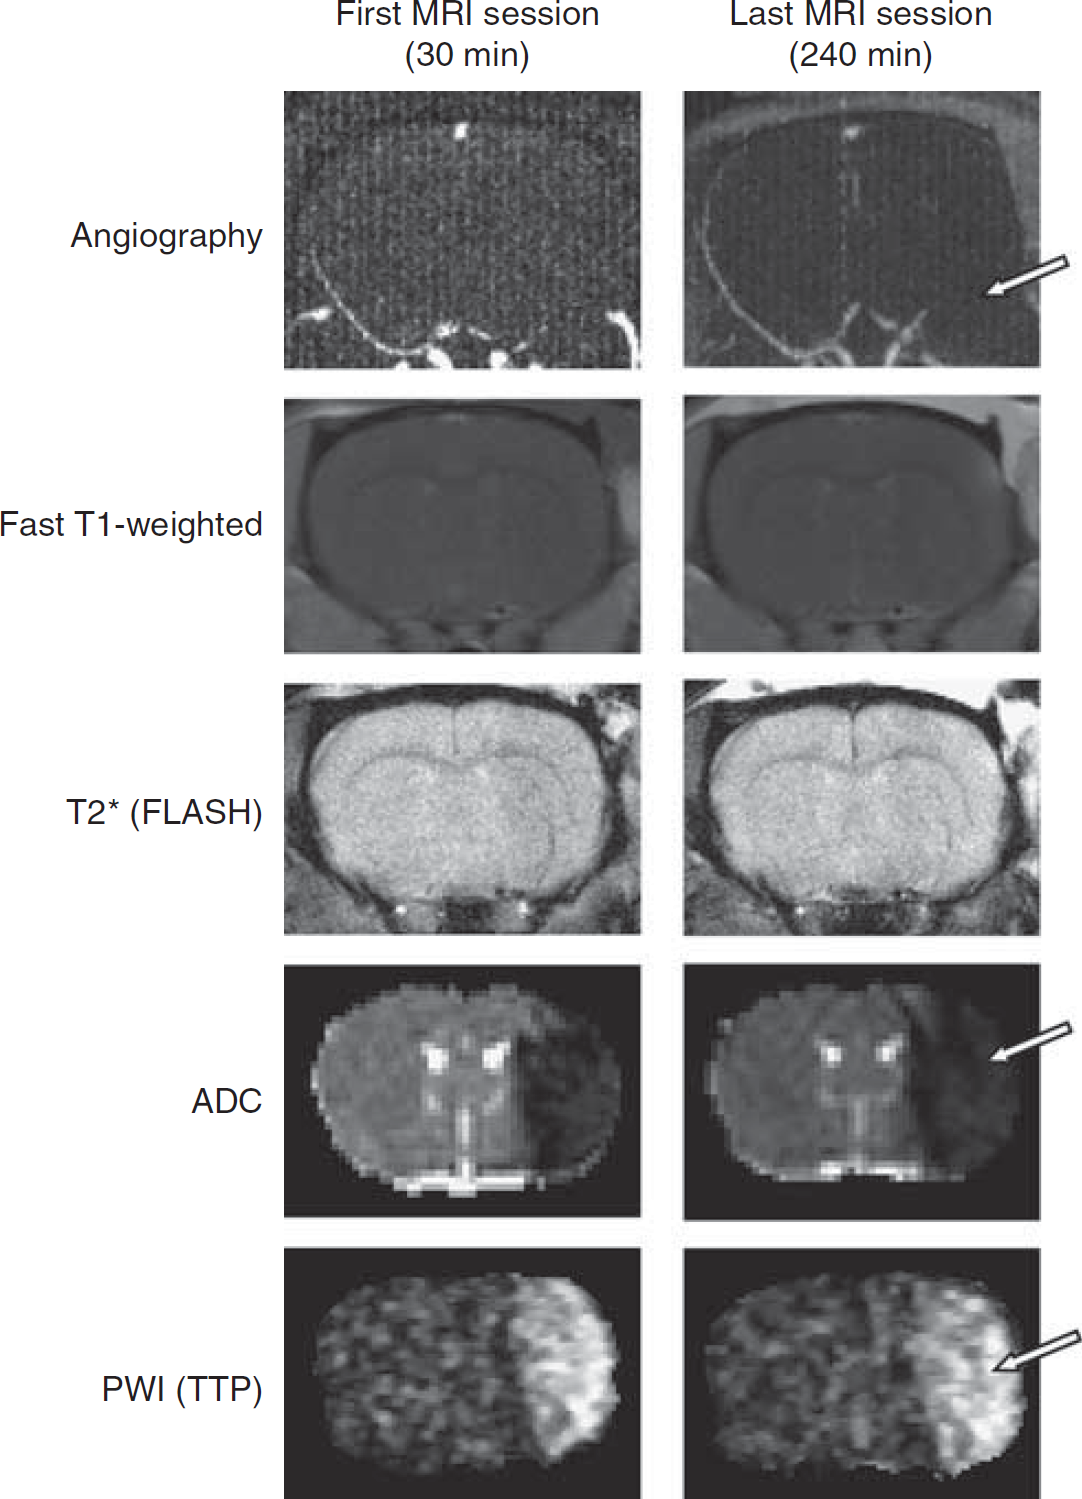
Representative images, at the first and the last examinations of magnetic resonance (MR) angiography, fast T1-weighted sequence, T2* fast low-angle-shot sequence, apparent diffusion coefficient (ADC) map, and perfusion-weighted imaging (PWI) (time to peak, TTP) in a spontaneously hypertensive rats (SHR) animal. The MR angiography revealed the persistence of middle cerebral artery (MCA) occlusion. Arrow indicates the disappearance of the left MCA, illustrating the absence of perfusion of this one. Fast T1-weighted sequence did not show any abnormality, which indicates the absence of blood–brain barrier breakdown. T2* (FLASH) sequence highlighted the absence of hemorrhage. ADC map revealed the presence of tissue with cytotoxic edema indicated by an area with drastic diminution of ADC values (cytotoxic edema is indicated by arrow). The TTP map extracted from the information provided by the first pass of gadolinium chelate showed the presence of hypoperfused tissue in all the animals as shown by an arrow on this image.
Evolution of Apparent Diffusion Coefficient-Defined Lesions
The mean ADC values in the contralateral hemisphere were similar between WKY, SHR, and RH-WKY and remained stable over time around 0.810 ± 0.107 × 10⁻³ mm2/sec (mean ± s.d.). Indeed, when all the groups are taken together, the ADC values were: 0.815 ± 0.05 × 10⁻³; 0.814 ± 0.06 × 10⁻³; 0.818 ± 0.06 × 10⁻³; 0.813 ± 0.05 × 10⁻³; 0.806 ± 0.06 × 10⁻³; 0.803 ± 0.07 × 10⁻³ mm2/sec, respectively, at 30, 90, 120, 150, 180, 240 minutes after occlusion. There was no significant time effect, which suggests no major effect of anesthesia. The normalized threshold calculated on each slice as the mean values of the contralateral hemisphere (excluding the ventricles) minus 2 s.d. was, on average, 0.6 × 10⁻³ mm2/sec (26% ADC reduction) and remained stable at all the time points analyzed. In the lesion, as defined by these thresholds, the ADC was severely reduced from 30 minutes after occlusion (0.55 ± 0.01 × 10⁻³, 0.54 ± 0.01 × 10⁻³, and 0.53 ± 0.02 × 10⁻³ mm2/sec in WKY, SHR, and RH-WKY, respectively). These values did not differ between the groups at any time point but gradually decreased over time (ANOVA repeated measures, time effect:
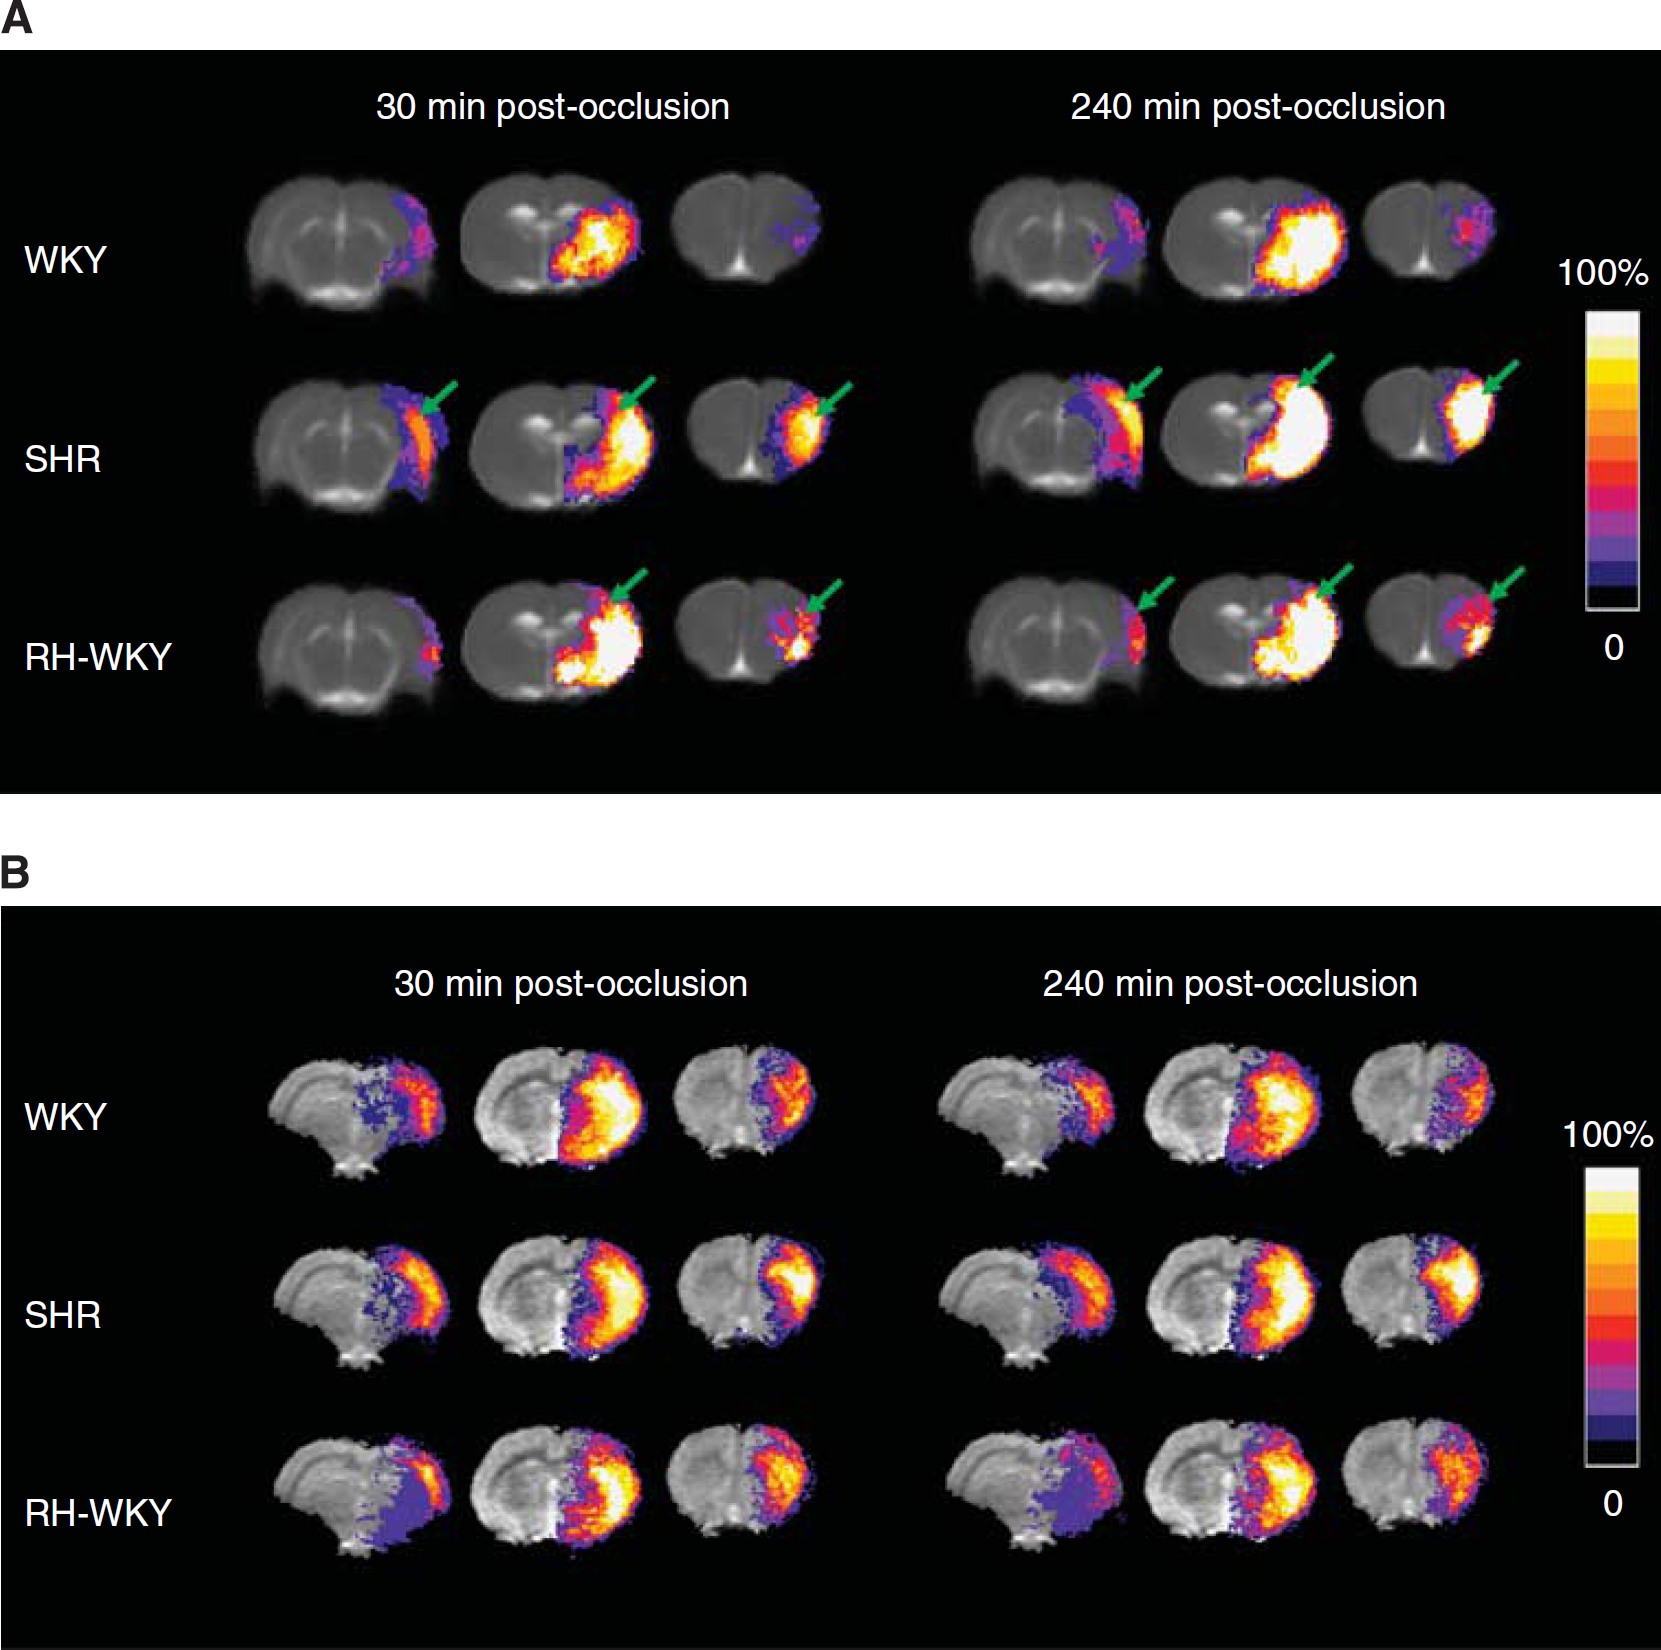
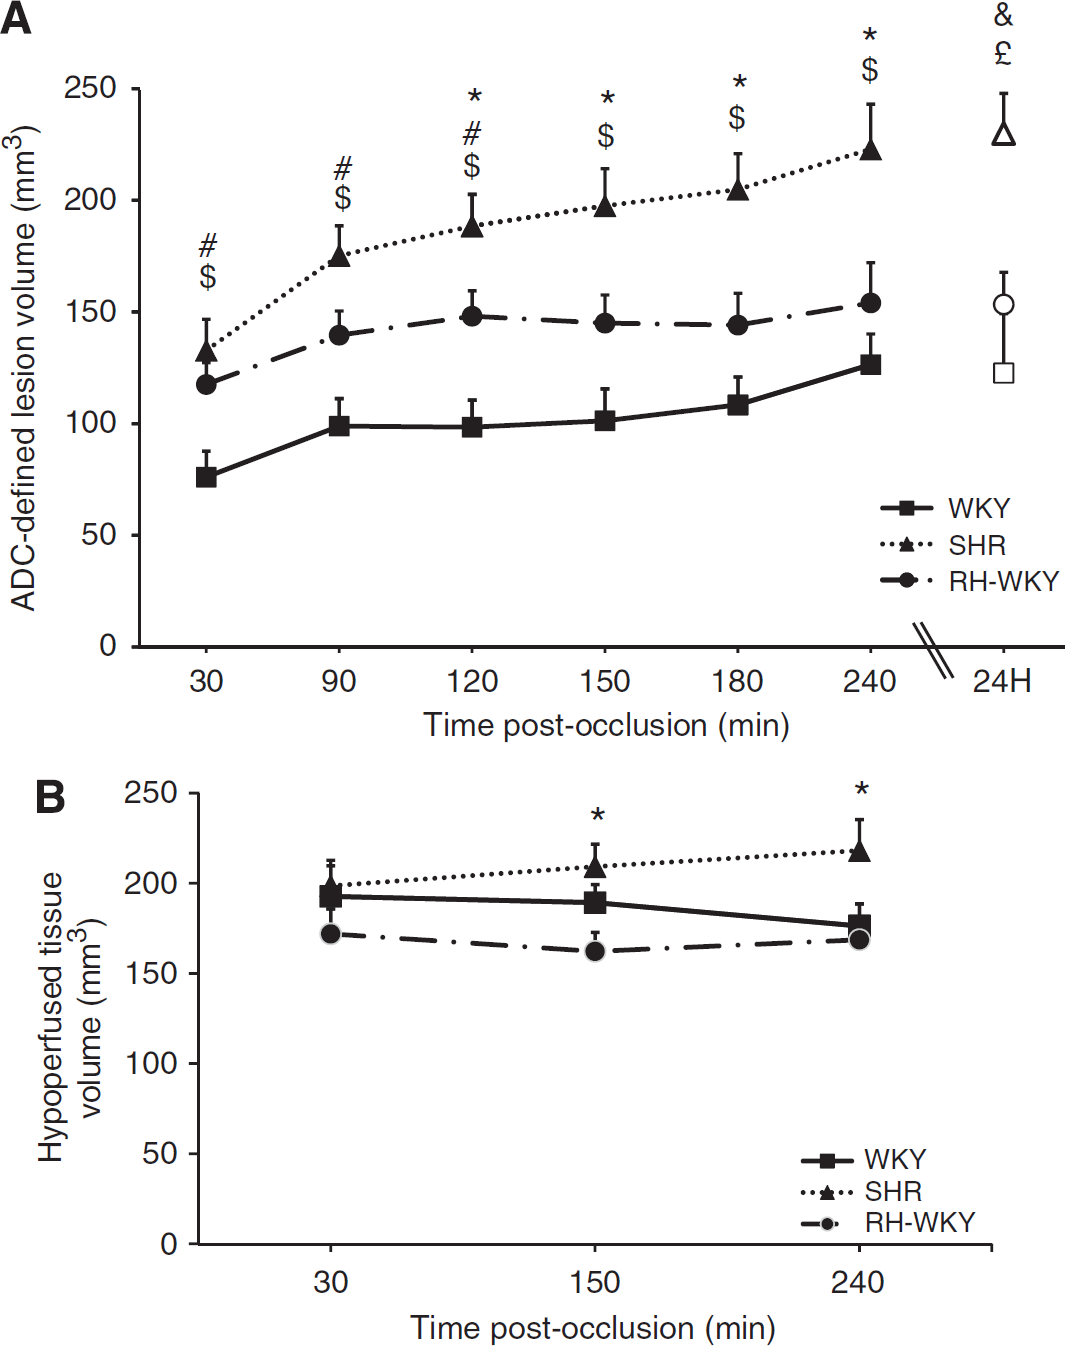
The ADC-defined lesion was more extended, especially in the antero-posterior axis, in hypertensive compared with normotensive rats as early as 30 minutes after occlusion (Figure 3) (ADC-defined lesion volumes at 30 minutes after occlusion were: SHR = 132.7 ± 14.0 mm3 and RH-WKY = 117.6 ± 9.7 mm3 versus WKY = 76.1 ± 11.7 mm3;
(
(
Evolution of Hypoperfused Tissue Volumes
All rats displayed a reduction of blood flow in the ipsilateral hemisphere (Figure 3B). The volume of hypoperfused tissue remained essentially stable over time after ischemia, although there was a tendency toward an increase in SHR (Figure 4B). At 30 minutes after occlusion, there was no difference in the volumes of hypoperfused tissue between groups (192.9 ± 17.0 mm3, 198.8 ± 14.2 mm3, 172.2 ± 13.8 mm3, respectively, in WKY, SHR, and RH-WKY;
Evolution of the Perfusion-Diffusion Mismatch
The perfusion–diffusion mismatch, operationally defined by a significant difference between ADC-defined lesion volume and hypoperfused tissue volume, was more extended in normotensive than in hypertensive animals (Figure 5). Quantification of the volume of the ischemic penumbra as a function of time indicated that in normotensive rats, the PWI/DWI mismatch was significant at all the time points although it gradually decreased with time. However, both in SHR and RH-WKY, the ischemic penumbra was significant only at 30 minutes after occlusion and decreased dramatically at 90 minutes and disappeared thereafter (mismatch perfusion-diffusion at 30 minutes after occlusion: SHR = 66.0 ± 24.8 mm3, RH-WKY = 54.6 ± 17.1 mm3, and WKY = 116.8 ± 13.7 mm3;
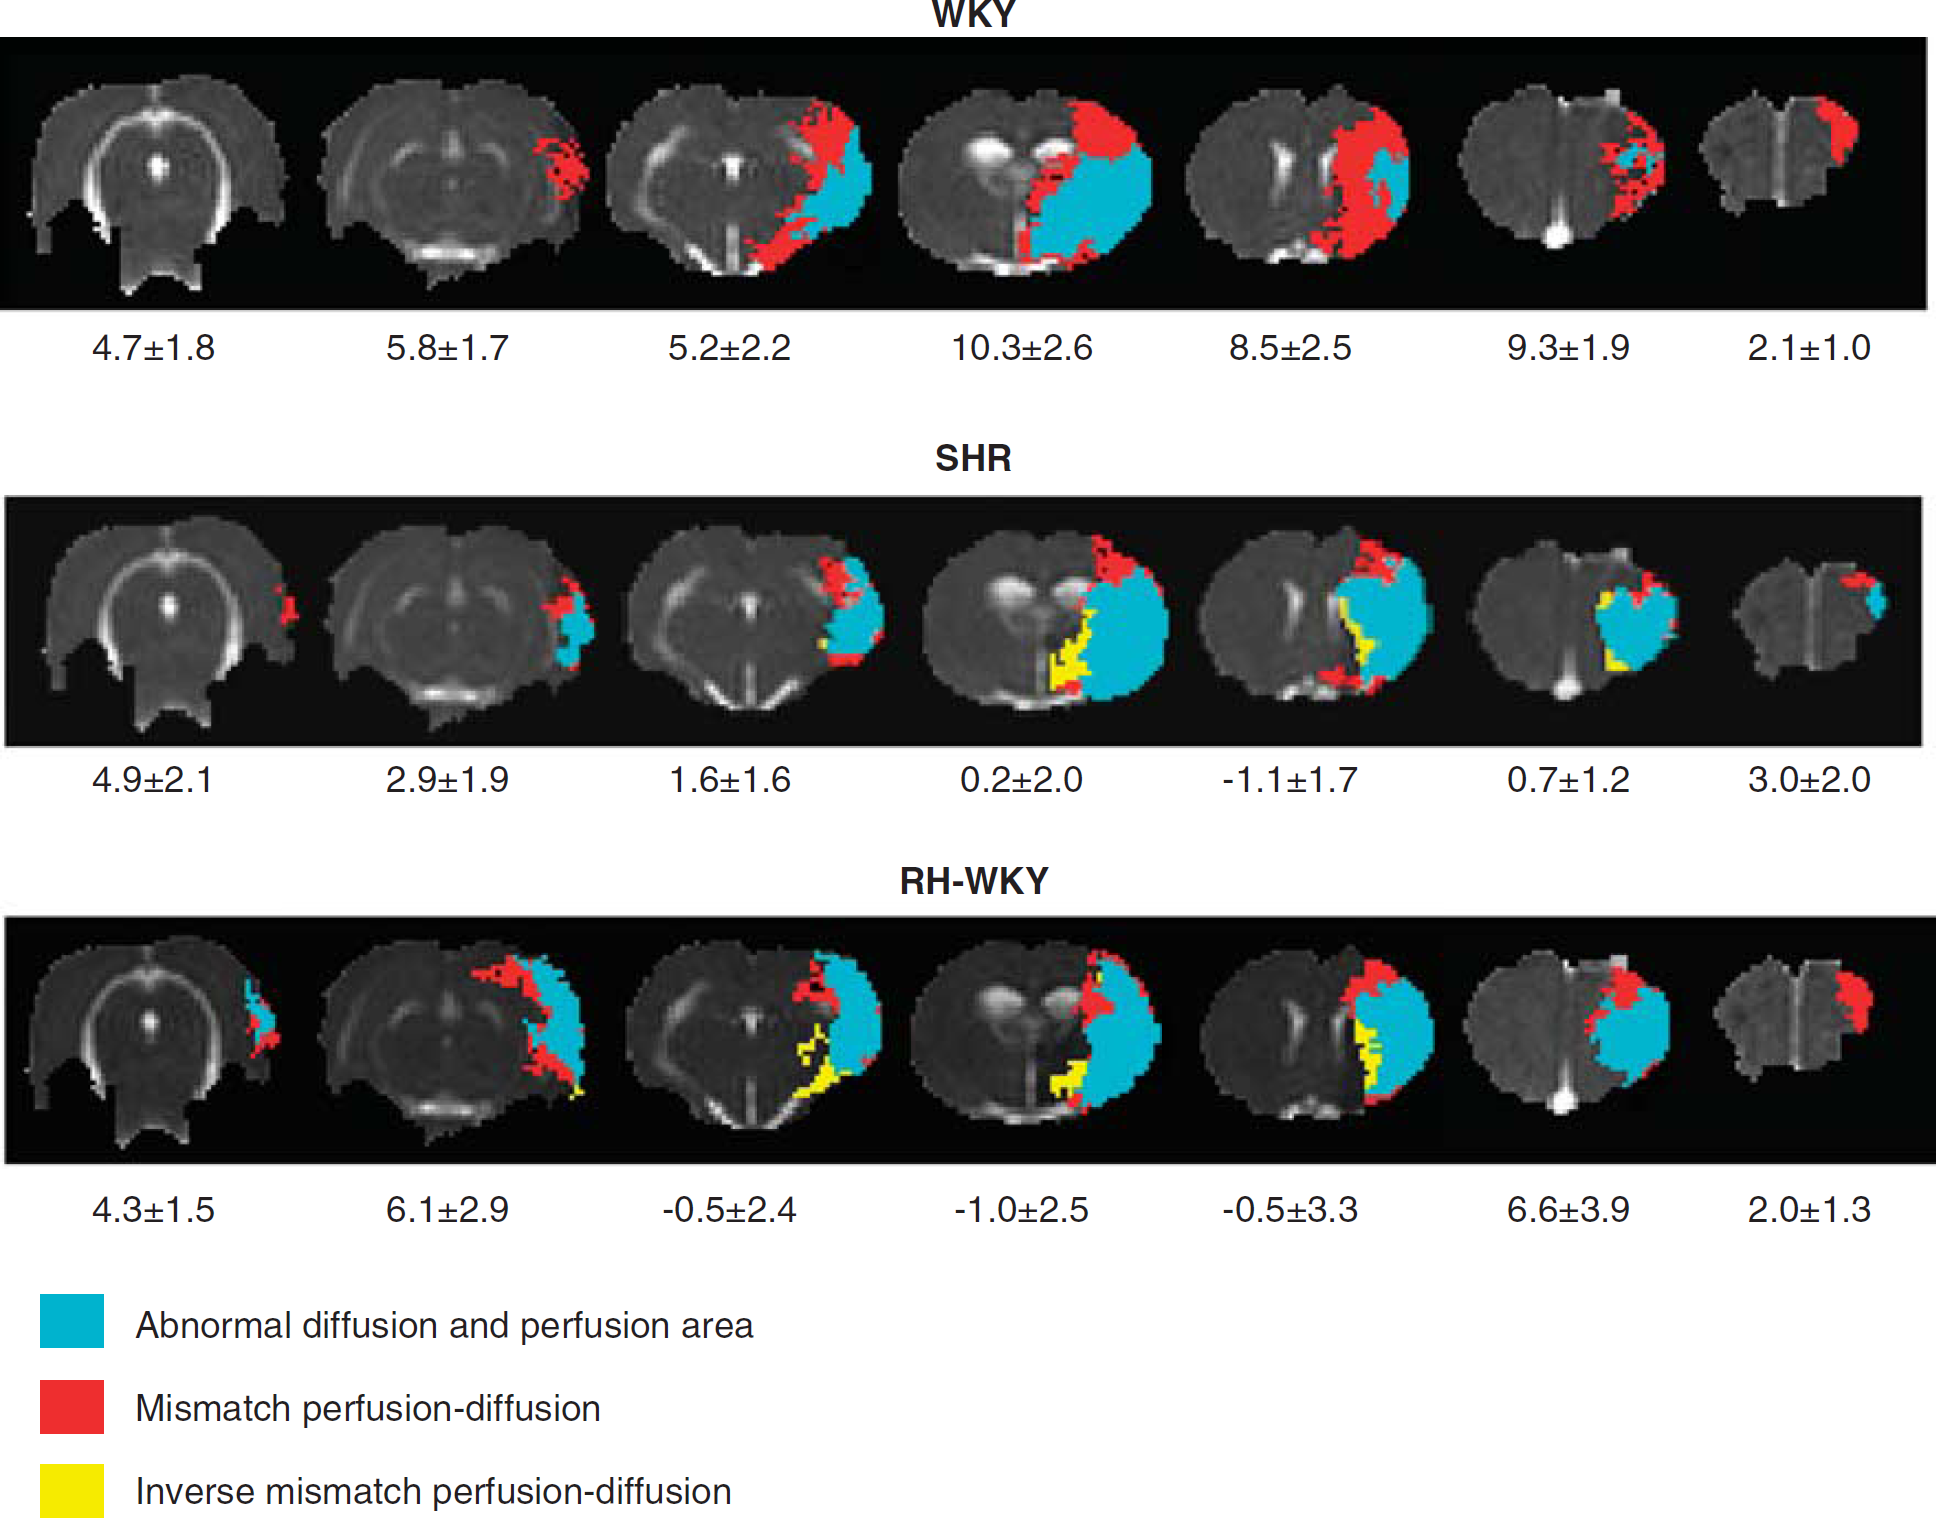
Representative perfusion–diffusion mismatch in a WKY, SHR, and RH-WKY rat at 90 minutes after occlusion. The blue color indicates abnormal diffusion area, whereas the red color indicates the ischemic penumbra as defined by perfusion-diffusion mismatch. The yellow color indicates the inverse mismatch corresponding to an area with reduced apparent diffusion coefficient (ADC) but normal perfusion. The mean area of the mismatch per group is indicated under each slice (mm2). RH-WKY, renovascular-hypertensive WKY; SHR, spontaneously hypertensive rats; WKY, normotensive Wistar-Kyoto.
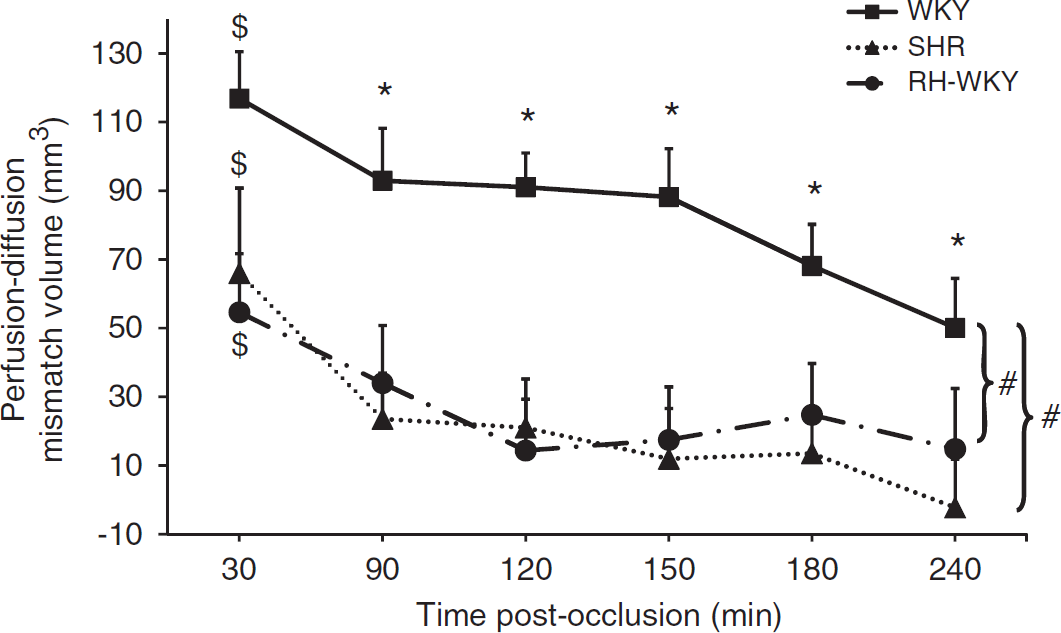
Evolution of the ischemic penumbra volume (perfusion-diffusion mismatch). $
Discussion
Our present study shows that both genetic and renovascular CAH exacerbate the ischemic brain lesion and dramatically accelerate the evolution of the ischemic penumbra into an irreversible lesion. Our results imply that CAH considerably narrows the window of therapeutic opportunity and emphasize the importance of taking into account this comorbid factor in preclinical investigations. Indeed, despite several recommendations from committees of experts regarding the preclinical development of stroke therapies, CAH is rarely considered in stroke models.
Recently, McCabe et al (2009) have reported a limited penumbra after focal ischemia in SHR-SP compared with normotensive rats. Nonetheless, SHR-SP are well known to exhibit an exacerbated ischemic lesion independent from arterial hypertension
To assess the distribution and characteristics of the ischemic penumbra, we relied on the concept of the PWI/DWI mismatch. Although the robustness of this concept has been criticized as perfusion deficit measured by MRI may encompass both penumbral and oligemic tissues and thus overestimate the penumbra, it is increasingly used in clinic to identify patients that may display salvageable ischemic tissue (Olivot and Marks, 2008). Perfusion deficit, in our study was measured, as generally performed in humans, by the analysis of the first pass of gadolinium chelate. This approach has been shown to provide equivalent information on the perfusion deficit as quantified through the use of continuous arterial spin labeling (Bråtane et al, 2010). The volume of initially hypoperfused tissue remained essentially stable over time after ischemia in normotensive animals (ANOVA repeated measures, time effect:
The differences observed between SHR and WKY (strains with a similar genetic background) in the evolution of the ischemic penumbra could be explained by chronic hypertension-induced functional and structural alterations of the brain vasculature. Indeed, eutrophic and hypertrophic remodeling of the brain arteries and the shift of the autoregulation curve are well-known hallmarks of the vascular changes induced in SHR (Mulvany et al, 1978). Nonetheless, data exist in the literature, although to a lesser extent, relative to SHR-SP, to show that hypertension
In RH-WKY, the ADC-defined lesion was also exacerbated compared with normotensive rats (Figure 4A). These data suggest that CAH is a major factor that accelerates the relapse of the penumbra into irreversibly damaged tissue. This argument is supported by the fact that a significant difference between the perfusion deficit and ADC-derived lesion (mismatch) was present in renovascular-hypertensive rats only at 30 minutes after the occlusion and then progressively disappeared (Figure 6). As RH-WKY and SHR manifested the same degree of hypertension, the differences in lesion size observed between RH-WKY and SHR after 2 hours of ischemia could be attributed to other factors independent of hypertension that take place in SHR.
In conclusion, our studies show that CAH, be it genetic or renovascular, shortens the duration of the ischemic penumbra and thus the window of therapeutic opportunity. The effects of efficient antihypertensive treatments on the spatiotemporal evolution of the penumbra need to be addressed. Are these therapies able to restore the extent of the ischemic penumbra and the efficiency of neuroprotective compounds? If yes, which hypertensive agent is optimal? In fact, antihypertensive therapies do not possess the same beneficial effect in the protection of end organ damage and decrease in the risk of stroke. Indeed, it is increasingly recognized that some antihypertensive therapies may have direct protective effects on the brain in parallel to the decrease in arterial pressure (Oprisiu-Fournier et al, 2009). Overall, the present data strongly support the necessity to integrate CAH in animal studies designed to test therapeutic interventions for stroke.
Footnotes
The authors declare no conflict of interest.