
Abstract
Inflammatory Ly6ChiCCR2+ monocytes infiltrate the brain after stroke but their functions are not entirely clear. We report that CCR2+ monocytes and CCR2+ lymphocytes infiltrate the brain after permanent ischemia. To underscore the role of CCR2+ monocytes, we generated mice with selective CCR2 deletion in monocytes. One day post-ischemia, these mice showed less infiltrating monocytes and reduced expression of pro-inflammatory cytokines, markers of alternatively macrophage activation, and angiogenesis. Accordingly, Ly6Chi monocytes sorted from the brain of wild type mice 24 h post-ischemia expressed pro-inflammatory genes, M2 genes, and pro-angiogenic genes. Flow cytometry showed heterogeneous phenotypes within the infiltrating Ly6ChiCCR2+ monocytes, including a subgroup of Arginase-1+ cells. Mice with CCR2-deficient monocytes displayed a delayed inflammatory rebound 15 days post-ischemia that was not found in wild type mice. Furthermore, they showed reduced angiogenesis and worse behavioral performance. Administration of CCR2+/+ bone-marrow monocytes to mice with CCR2-deficient monocytes did not improve the behavioral performance suggesting that immature bone-marrow monocytes lack pro-reparative functions. The results show that CCR2+ monocytes contribute to acute post-ischemic inflammation and participate in functional recovery. The study unravels heterogeneity in the population of CCR2+ monocytes infiltrating the ischemic brain and suggests that pro-reparative monocyte subsets promote functional recovery after ischemic stroke.
Introduction
Acute inflammation after stroke is a multifaceted response to sterile tissue injury. Excessive inflammation is believed to exacerbate the brain lesion, but on the other hand, inflammation is involved in triggering mechanisms that later promote clearance of the damaged tissue and set an adequate environment for subsequent tissue repair. 1 Diverse types of leukocytes are attracted to the injured brain in an orchestrated fashion and they play complex functions.2,3 Mouse monocytes are classified as ‘classical’ essentially corresponding to Ly6Chi monocytes, and ‘non-classical’ corresponding to Ly6Clow monocytes. 4 Classical Ly6Chi monocytes express the chemokine receptor CCR2 and are involved in inflammatory responses after tissue injury.5,6 In contrast, non-classical Ly6CloCX3CR1+ monocytes patrol the vasculature and exert vasculoprotective functions. 7 After brain ischemia, Ly6ChiCCR2+ monocytes are the first subsets reaching the brain tissue where they acquire features of macrophages. 8 Macrophages are plastic cells that depending on the stimuli in the local environment mature acquiring different phenotypes and functions.9,10 In brain ischemia, dynamic beneficial and detrimental macrophage responses are reported, 11 but several lines of evidence suggest that infiltrating monocyte/macrophages mediate pro-resolving mechanisms. 12
The CCL2 chemokine, also termed monocyte chemoattractant protein 1 (MCP-1), is a potent chemoattractant signal for monocytes to the ischemic brain tissue. 13 Astrocyte-derived CCL2 promotes leukocyte infiltration across the blood–brain barrier (BBB). 14 In addition to astrocytes, microglia express CCL2 after ischemia,15,16 and endothelial cells, 17 pericytes, 18 perivascular macrophages, 19 and neurons16,20 can also produce CCL2. Interestingly, genetic predisposition to elevated circulating levels of CCL2 is associated with higher risk of stroke. 21 Constitutive CCR2-deficient mice showed reduced ischemic lesions and improved neurological function compared to wild type mice, 22 thus suggesting that CCR2+ monocytes were detrimental. However, studies administering CCR2 drug inhibitors or blocking antibodies challenged this view because they found more inflammation, worse neurological deficits, impaired recovery, and more hemorrhagic transformation,23–26 suggesting that CCR2+ monocytes exert beneficial functions by promoting neuroprotection and vasculoprotection. However, globally targeting CCR2 may affect other cells besides monocytes since CCR2 expression has been reported in the endothelium 27 and several lymphocyte subsets, including regulatory T cells, 28 and Th17 cells. 29
The objective of this study was to identify the subsets of CCR2+ cells in the ischemic brain tissue and the specific function of CCR2+ monocytes. To this end, we used reporter knock-in Ccr2rfp/+Cx3cr1gfp/+ mice showing infiltration of CCR2+ monocytes and lymphocytes. To underscore the specific function of CCR2+ monocytes we generated mice with selective deletion of CCR2 in myeloid cells. This strategy reduced the acute inflammatory response but evoked delayed inflammation, reduced angiogenesis, and impaired functional recovery. Our results show that infiltrating CCR2+ monocytes induce an acute response associated to subsequent mechanisms critical for recovery after ischemic stroke. The results also suggest that the infiltrating CCR2+ monocyte population is heterogeneous and comprises subsets of cells with pro-angiogenic features.
Methods
Mice
CCR2-deficient mice (Ccr2rfp/rfp) (B6.129(Cg)Ccr2tm2.1Ifc/J, #SN17586), CX3CR1-deficient mice (Cx3cr1Gfp/Gfp) (B6.129P2(Cg)-Cx3cr1tm1Litt/J, #SN5582), Cx3cr1creERT2 mice (B6.129P2(C)-Cx3cr1tm2.1(cre/ERT2)Jung/J, #SN020940), reporter ROSA26-tdTomato mice (B6.Cg-Gt(ROSA)26Sortm9(CAG-tdTomato)Hze/J, #SN007909), and LysMcre mice (Lyz2tm1(cre)Ifo, #SN4781) were purchased from the Jackson Laboratory. We used reporter DsRed mice expressing fluorescent DsRed driven by the actin promoter. 30 Ccr2fl/fl mice were generated by insertion of 2 loxP sites flanking the entire coding sequence of Ccr2 followed by an eGFP cassette. 31 Crossing these mice with LysMcre mice causes functional knockout of Ccr2 in myeloid cells and activates eGFP expression. We used littermate Ccr2fl/flLysMcre+ mice (CCR2-deficient monocytes) and Ccr2fl/flLysMcre− mice (control genotype). We used heterozygous Ccr2rfp/+Cx3cr1GFP/+ mice and Cx3cr1creERT2:ROSA26-tdT mice and also wild type mice. All mice were on the C57BL/6 background. Mouse colonies were maintained under SPF conditions at the animal house of the School of Medicine of the University of Barcelona (UB), except for Ccr2rfp/rfp mice, Cx3cr1GFP/GFP mice, and DsRed mice that were maintained at the animal house of the Faculty of Psychology, UB, under conventional housing conditions in a controlled environment (temperature and humidity, under a 12 h light/dark cycle) free of nasty pathogens. Animal work was conducted following Spanish laws (Real Decreto 53/2013) and European Directives. We obtained approval by the ethical committee (Comité Ètic d’Experimentació Animal, CEEA, UB) and the local regulatory bodies of Generalitat de Catalunya. Animal studies are reported following the ARRIVE guidelines.
Brain ischemia
Surgery for induction of ischemia was carried out in adult (3–5 months old) male (n = 98) and female (n = 118) mice under isoflurane anesthesia (Isovet, BBraun) and mice received analgesia (140 μL of 0.015 mg/mL buprenorphine, via s.c.). Permanent occlusion of the middle cerebral artery (MCA) was induced by coagulation of the distal portion of the right MCA together with ligation of the ipsilateral common carotid artery. The brain was studied with T2w turbo RARE fast spin-echo MRI sequences (7T, BioSpec, Bruker BioSpin, Ettlingen, Germany). Images were obtained with ParaVision 6.0 software (Bruker). Infarct volume was corrected for edema and measured with ImageJ. 32 Mortality was low (1.8%). Predefined exclusion criteria were: absence of infarction (3 out of 216 mice; 1.4%) or infarctions affecting brain areas beyond the ipsilateral cortex (3 out of 216 mice; 1.4%). We excluded two mice because perfusion with FITC-gelatin (see below) was technically incorrect. For comparison of mice of different genotypes (Ccr2fl/flLysMcre+ vs. Ccr2fl/flLysMcre– mice), we used littermates kept in the same cages. Ischemia was induced sequentially by a researcher blinded to the genotype. In the experiment of monocyte administration (see below), recipient mice received ischemia after randomization using GraphPad Quickcalcs. The researchers inducing ischemia and all the following studies and measures were blinded to the mouse genotype and treatment identity.
Behavioral tests
For behavioral tests, mice received preoperative training during the week prior to surgery and tests were performed at different time points after ischemia. 33 The result of the best training day was taken as the basal score in each test. For the Pole test, the score was obtained from the average of five trials per day with a 5-min inter-trial period during the training and testing sessions. For the Rotarod test (Rota-Rod/RS Panlab Harvard apparatus), we carried out three trials on an accelerating rod, starting at 4 r/min with an increasing acceleration of 1 r/min each 8 s with 15 min of rest between the trials. The latency before failing was taken as the average of the three trials.
Flow cytometry
Blood and brain tissue were processed for flow cytometry as described. 8 Fc receptors were blocked by incubation for 10 min with CD16/CD32 (#553142, clone 2.4G2, BD Pharmingen) in FACS buffer (PBS, 2 mM EDTA, 2% FBS) at 4°C. Live/dead Aqua cell stain (#L34957, Molecular Probe, Invitrogen) was used to determine cell viability. Cells from CCR2rfp/+CX3CR1gfp/+ double knock-in reporter mice were stained with the following primary antibodies: CD11b (#557657, clone M1/70, APC-Cy7, BD Pharmingen), CD45 (#564225, clone 30-F11, Brilliant Violet 786, BD Horizon), Ly6G (#560601, clone 1A8, PE-Cy7, BD Pharmingen), F4/80 (#65-4801, clone BM8, PerCP-Cy5.5, Tonbo Biosciences), Ly6C (#48-5932-82, clone HK1.4, eFluor-450, eBioScience), CD115 (#135509, clone AFS98, APC, Biolegend), CD3 (#557869, clone 17A2, Alexa Fluor 647, BD Pharmingen), CD45R (#560472, clone RA3-6B2, V450, BD Biosciences), CD161 (#65-5941, NK1.1, clone PK136; PerCP-Cy5.5, Tonbo Biosciences) and γδTCR (#25-5711-82, clone GL3, PE-Cy7, eBiosciences). Live brain cells from CCR2fl/flLysMcre mice were stained with anti-CD11b, anti-CD45, anti-Ly6G, anti-CD115 and anti-Ly6C. Cells from LysMcre:Rosa26-tdT mice were stained with the antibodies against CD11b, CD45, Ly6G, CD115 and CD192 (CCR2) (#FAB5538F, clone 475301, Fluorescein, R&D systems). Antibody incubations were carried out in FACS buffer and mouse BD Fc block for 20 min at 4°C. Intracellular staining was carried out with anti-Arginase-1 (Arg1) antibody (#IC5868P, sheep polyclonal, PE, R&D systems) after fixation/permeabilization (#554714, BD Cytofix/Cytoperm). Data were acquired in a BD LSRII cytometer using FacsDiva software (BD Biosciences). Data analyses were performed with FlowJo software (version X, FlowJo LLC, Ashland, OR, USA).
Cell sorting
Microglia and Ly6Chi monocytes were isolated from the brain of Cx3cr1creERT2-ROSA26-tdT mice using Fluorescence Activated Cell Sorting (FACS). Cortical tissue from each brain hemisphere (ipsilateral included ischemic and non-affected tissue) was collected separately in cold HBSS buffer (w/o Ca2+ and Mg2+, #14175-053, Thermo Fisher Scientific) in GentleMACS-C tubes (#130-092-628, Miltenyi Biotech). Tissue was enzymatically dissociated using Neural Tissue Dissociation Kit (P) (#130-092-628, Miltenyi Biotec). Programs m_brain_01, m_brain_02 and m_brain_03 of the gentleMACS™ Dissociator (#130-096-427, Miltenyi Biotec) were progressively applied and samples incubated at 37°C for 30 min. The digested tissue was filtered twice with 70 µm and 40 µm cell strainers (#352340, Falcon) and washed with HBSS (w/Ca2+ and Mg2+, #14025-092, Thermo Fisher Scientific). Cells were separated from myelin and debris in 30% isotonic percoll gradient (#17-0891-01, GE Healthcare) in Myelin Gradient Buffer (3.56 g/L Na2HPO4·12H2O, 0.78 g/L NaH2PO4·2H2O, 8 g/L NaCl, 0.4 g/L KCl, 2 g/L D(+)-glucose, pH 7.4). Samples were centrifuged at 950×g for 30 min without acceleration or brake. Cells were collected from the interface, washed once with FACS Stain Buffer (#554656, BD Biosciences), stained with anti-CD11b, anti-CD45, anti-Ly6G, and anti-Ly6C antibodies for 20 min at 4°C in the presence of mouse BD Fc block and live/dead Aqua cell stain, and processed for FACS in a FACSAriaII sorter (BD Biosciences). Sorted CX3CR1hi microglia and Ly6Chi monocytes were recovered in PBS-DEPC at 4°C, centrifuged and lysed in 0.3 mL of Lysis buffer (#46-6001, Invitrogen) supplemented with 1% β-mercaptoethanol, for RNA extraction.
Isolation and administration of reporter monocytes
We isolated adult mouse monocytes from the bone marrow (EasySep™ Mouse Monocyte Isolation Kit; #19861, STEMCELL Technologies). We flushed cells from femur and tibia in RPMI 1640 (#21875-034, GIBCO) supplemented with 2% FBS (Gibco-BRL) using a 25-gauge needle syringe. We removed cell debris by filtering the suspension through a 70-μm mesh nylon strainer and centrifuged at 300 × g for 5 min. We resuspended the cells in 2 mL PBS containing 2% FBS with 2 mM EDTA supplemented with 5% Normal Rat Serum. Then, we incubated the cell suspension with Selection Cocktail at 100 µL/mL at 4°C during 5 min. RapidSpheres™ were added to the sample (100 µL/mL) for 3 min in the refrigerator. Finally, samples were placed in the magnet and monocytes were obtained by negative selection. In 200 µL PBS, 1.5 million cells were resuspended and were injected in the mouse tail-vein 6 h after MCA occlusion. Administration was carried out in a blinded fashion.
RNA extraction and processing
RNA was extracted from samples of FACS-sorted Ly6Chi monocytes and CX3CR1hi microglia with PureLink™ RNA Micro Kit (#12183016, Invitrogen). RNA was precipitated with 70% ethanol overnight at -20°C. A DNAse step was performed. RNA quantity and purity were assessed with High Sensitivity RNA ScreenTape® (The Agilent 2200 TapeStation system). We obtained 200–1600 pg/μL RNA from sorted cells. We also extracted RNA from the cortex using Trizol® Reagent (Life Technologies) followed by PureLink™ RNA Mini Kit (#12183018 A, Invitrogen), and assessed RNA quantity and quality using a ND-1000 micro-spectrophotometer (NanoDrop Technologies). Total RNA was reverse-transcribed using a mixture of random primers (#4387406, High Capacity cDNA Reverse Transcription kit, Applied Biosystems, Foster City, CA). For RNA obtained from brain tissue, 1000 ng of total RNA were reverse-transcribed and the final product was diluted six times in RNAse-free water. For samples of FACS-sorted cells, cDNA was pre-amplified (TaqMan® Pre Amp Master Mix (2×) #4384266) using a pool of TaqMan probes. The final product was diluted ×20 with tris-EDTA buffer pH 8.0 (#BP2473, Fisher Bioreagents).
Real-time quantitative RT-PCR analysis was carried out with Taqman system (#4304437, Life Technology, Carlsbad, CA, USA) or SYBR green I dye detection (#11761500, Invitrogen) using iCycler iQTM Multicolor Real-Time Detection System (Bio-Rad). Primers are listed in Supplementary Table S1. For Taqman system, qPCR conditions were 2 min at 50°C, 10 min at 95°C followed by 40 cycles of 15 s at 95°C and 1 min at 60°C. For SYBR green system, PCR primers (IDT, Conda, Spain) were designed with Primer-Blast software to bridge the exon-intron boundaries within the gene of interest. Optimized thermal cycling conditions for SYBR green assays were: 2 min at 50°C, 10 min at 95°C followed by 40 cycles of 15 s at 95°C and 1 min at 60°C, and 1 min at 95°C, 1 min and 10 s at 55°C. Data were collected after each cycle and were graphically displayed (iCycler iQTM Real-time Detection System Software, version 3.1, Bio-Rad, Hercules, CA). We quantified by normalizing cycle threshold (Ct) values with Hprt1, GAPDH, or Rpl14 housekeeping gene Ct. Analysis was carried out with the 2−ΔΔCT method.
Assessment of vessel patency
At the time of euthanasia we injected a fluorescent dye. 34 Mice were anesthetized with isoflurane and perfused through the heart with 20 mL PBS containing 0.1% heparin and 20 mL of 4% (w/v) paraformaldehyde (PFA) at RT diluted in phosphate buffer (PB) pH 7.4, at 5 mL/min. This was followed by perfusion with 20 mL of a fluorescent gel prepared as follows: 400 mg gelatin (#G1890, Sigma) was diluted in 20 mL PBS at 50°C, and the solution was allowed to cool to 37°C. Then, FITC-albumin (10 mg, #A9771, Sigma) was added and maintained at 37°C. After perfusion, mice were placed with the head down on ice to rapidly cool and solidify the gel. After 15 min, the brain was carefully removed, post-fixed in 4% PFA at 4°C overnight, and processed for immunofluorescence and microscopy.
Immunofluorescence
Mice were transcardially perfused with 40 mL of cold saline and 20 mL cold 4% PFA in PB pH 7.4. The brain was fixed overnight with PFA, cryoprotected in 30% sucrose, and frozen in isopentane at −40°C. Cryostat sections (14-μm thick) were fixed in ethanol 70%, blocked with 3% normal serum, and incubated overnight at 4°C with: rabbit polyclonal antibodies against glial fibrillary acidic protein (GFAP) (1:400, #Z0334, Dako) or pan-laminin (1:100, #Z0097, Dako); goat polyclonal antibodies against PDGFRβ (1:100, #AF1042; R&D) or Arginase-1 (1:100, #SC-18354, Santa Cruz Biotech.); rat monoclonal antibody against CD68 (1:100, #MCA195, BioRad) or CD31 (1:50, #550274, BD Pharmingen). To amplify the signal of the DsRed cells we used a goat polyclonal anti-DsRed antibody (#sc-33354, Santa Cruz Biotechnology, Inc.) diluted 1:100. The secondary antibodies were: Alexa Fluor 488, 546, or 647 (Molecular Probes; Life Technologies S.A.) diluted 1:500. Cell nuclei were stained with DAPI or To-Pro3 (Invitrogen). Images were obtained in a confocal microscope (TCS SPE-II, Leica Microsystems). Images were not further processed except for enhancing global signal intensity in the entire images for image presentation purposes using LAS software (Leica), ImageJ, or Adobe Photoshop. For quantification, we analyzed three sections separated from each other by a thickness of 1 mm (starting 1.7 mm from Bregma). We estimated FITC-albumin+ vessel density by measuring the % of FITC+ area in 12 regions-of-interest (ROIs) per section. ROIs (0.4 mm2) were located as follows: 3 in infarcted core, 2 in periphery, 1 in distant non-affected cortex, and corresponding mirror ROIs in the contralateral hemisphere. Images were obtained with the 20× objective of a microscope (Olympus BX51) with motorized stage (Prior Pro Scan II) and equipped with a digital camera (Olympus DP71). FITC+ vessel segmentation was achieved by manual thresholding (ImageJ). ROI results were averaged to obtain representative values for each mouse. Quantification was carried out in a blinded fashion.
Free-floating immunostaining and brain clearing
We perfused the mice with FITC-albumin hydrogel as above. The brain was sectioned in two coronal parts at +1.5 mm from Bregma. The anterior part was cut in 100-μm thick brain sections with a vibratome (VT1200S, LEICA) for free-floating immunostaining. The posterior section (1.6 mm-thick) was clarified. 35 Tissue was dehydrated in gradients (30%, 60%, 80% and 100%) of tetrahydrofuran (Sigma-Aldrich) and clarified with dibenzyl ether (DBE) (Sigma-Aldrich). The tissue was dipped in DBE and studied in a confocal microscope (Zeiss LSM 880). Image series (resolution 512 × 512 pixels) were acquired with a motorized stage with 3.2 µm steps in the Z direction to produce a final ‘Z stack’. We used a 10X 0.4 NA objective and a master pinhole size (1.0 AU). Tissue was excited using a 488 nm laser. Images were acquired in a bidirectional sweep system at 9 µm/s with a line average of 2. For section alignment we carried out a 10% overlap correction. We generated the maximum intensity projection of a 451-µm thick slice equal for each sample.
Statistics
Two-group comparisons were carried out with two-tailed Mann–Whitney test or t-test, as required after normality testing. Multiple groups were compared with one-way ANOVA, Kruskal-Wallis test, or two-way ANOVA, as appropriate, followed by post-hoc analysis. We corrected for multiple t-test comparisons. The specific tests used in each experiment, p values, and n values are stated in the figure legends. Statistical analyses were performed with GraphPad Prism software version 8.2.0. In experiments designed to study differences in stroke outcome between genotypes, sample size was calculated using G*power 3.1 software (University of Düsseldorf) with an alpha level of 0.05 and a statistical power of 0.95. The effect size d was estimated at 1.3, 1.1, and 1.8 for a change of 30% based on prior information on mean and SD infarct volume, rotarod time, and pole time, respectively, for wild type mice subjected to ischemia by the same researcher. Accordingly, we estimated a sample size of 15–20 mice per group.
Results
Complex populations of peripheral leukocytes with various levels of CCR2 and/or CX3CR1 expression infiltrate in the ischemic brain
We characterized the subpopulations of monocytes infiltrating the ischemic brain tissue in heterozygous Ccr2rfp/+Cx3xr1gfp/+ double knock-in reporter mice using flow cytometry and confocal microscopy. Circulating leukocytes express different degrees of CCR2 and CX3CR1. Ly6Chi monocytes are CCR2+ and show bright red fluorescence (RFP) whereas Ly6Clow monocytes express CX3CR1 and show green fluorescence (GFP). 36 CD45dimCD11bdim microglia express higher levels of CX3CR1 than monocytes and do not express CCR2; thus, microglia showed very bright green fluorescence and did not show red fluorescence (Figure 1, Supplementary Figures S1 and S2). At day 4 post-ischemia, infiltrating red cells dominated in the core and borders of infarction whereas microglia predominated at the border and periphery of the lesion (Figure 1(a)). Infiltrating leukocytes with diverse mixtures of either red fluorescence or low green fluorescence, or both, with or without CD68 expression, were detected in the ischemic tissue (Figure 1(b)). Fluorescent leukocytes persisted 15 days post-ischemia, where among other cells we observed very bright RFP+ leukocytes with morphology compatible with lymphocytes (Supplementary Figure S3). These cells were prominent within the ischemic tissue and meninges suggesting that CCR2+ leukocytes reached the injured tissue long after stroke onset. Four and 15 days post-ischemia, we identified subsets of RFP+ leukocytes positive for Arg1, a marker of alternative macrophage polarization, whereas Arg1 was not detected in microglia (Supplementary Figure S4). Altogether, these results show brain invasion by a complex population of leukocytes composed of several subtypes of cells with different phenotypes and expressing CCR2 and/or CX3CR1 with various intensity degrees.
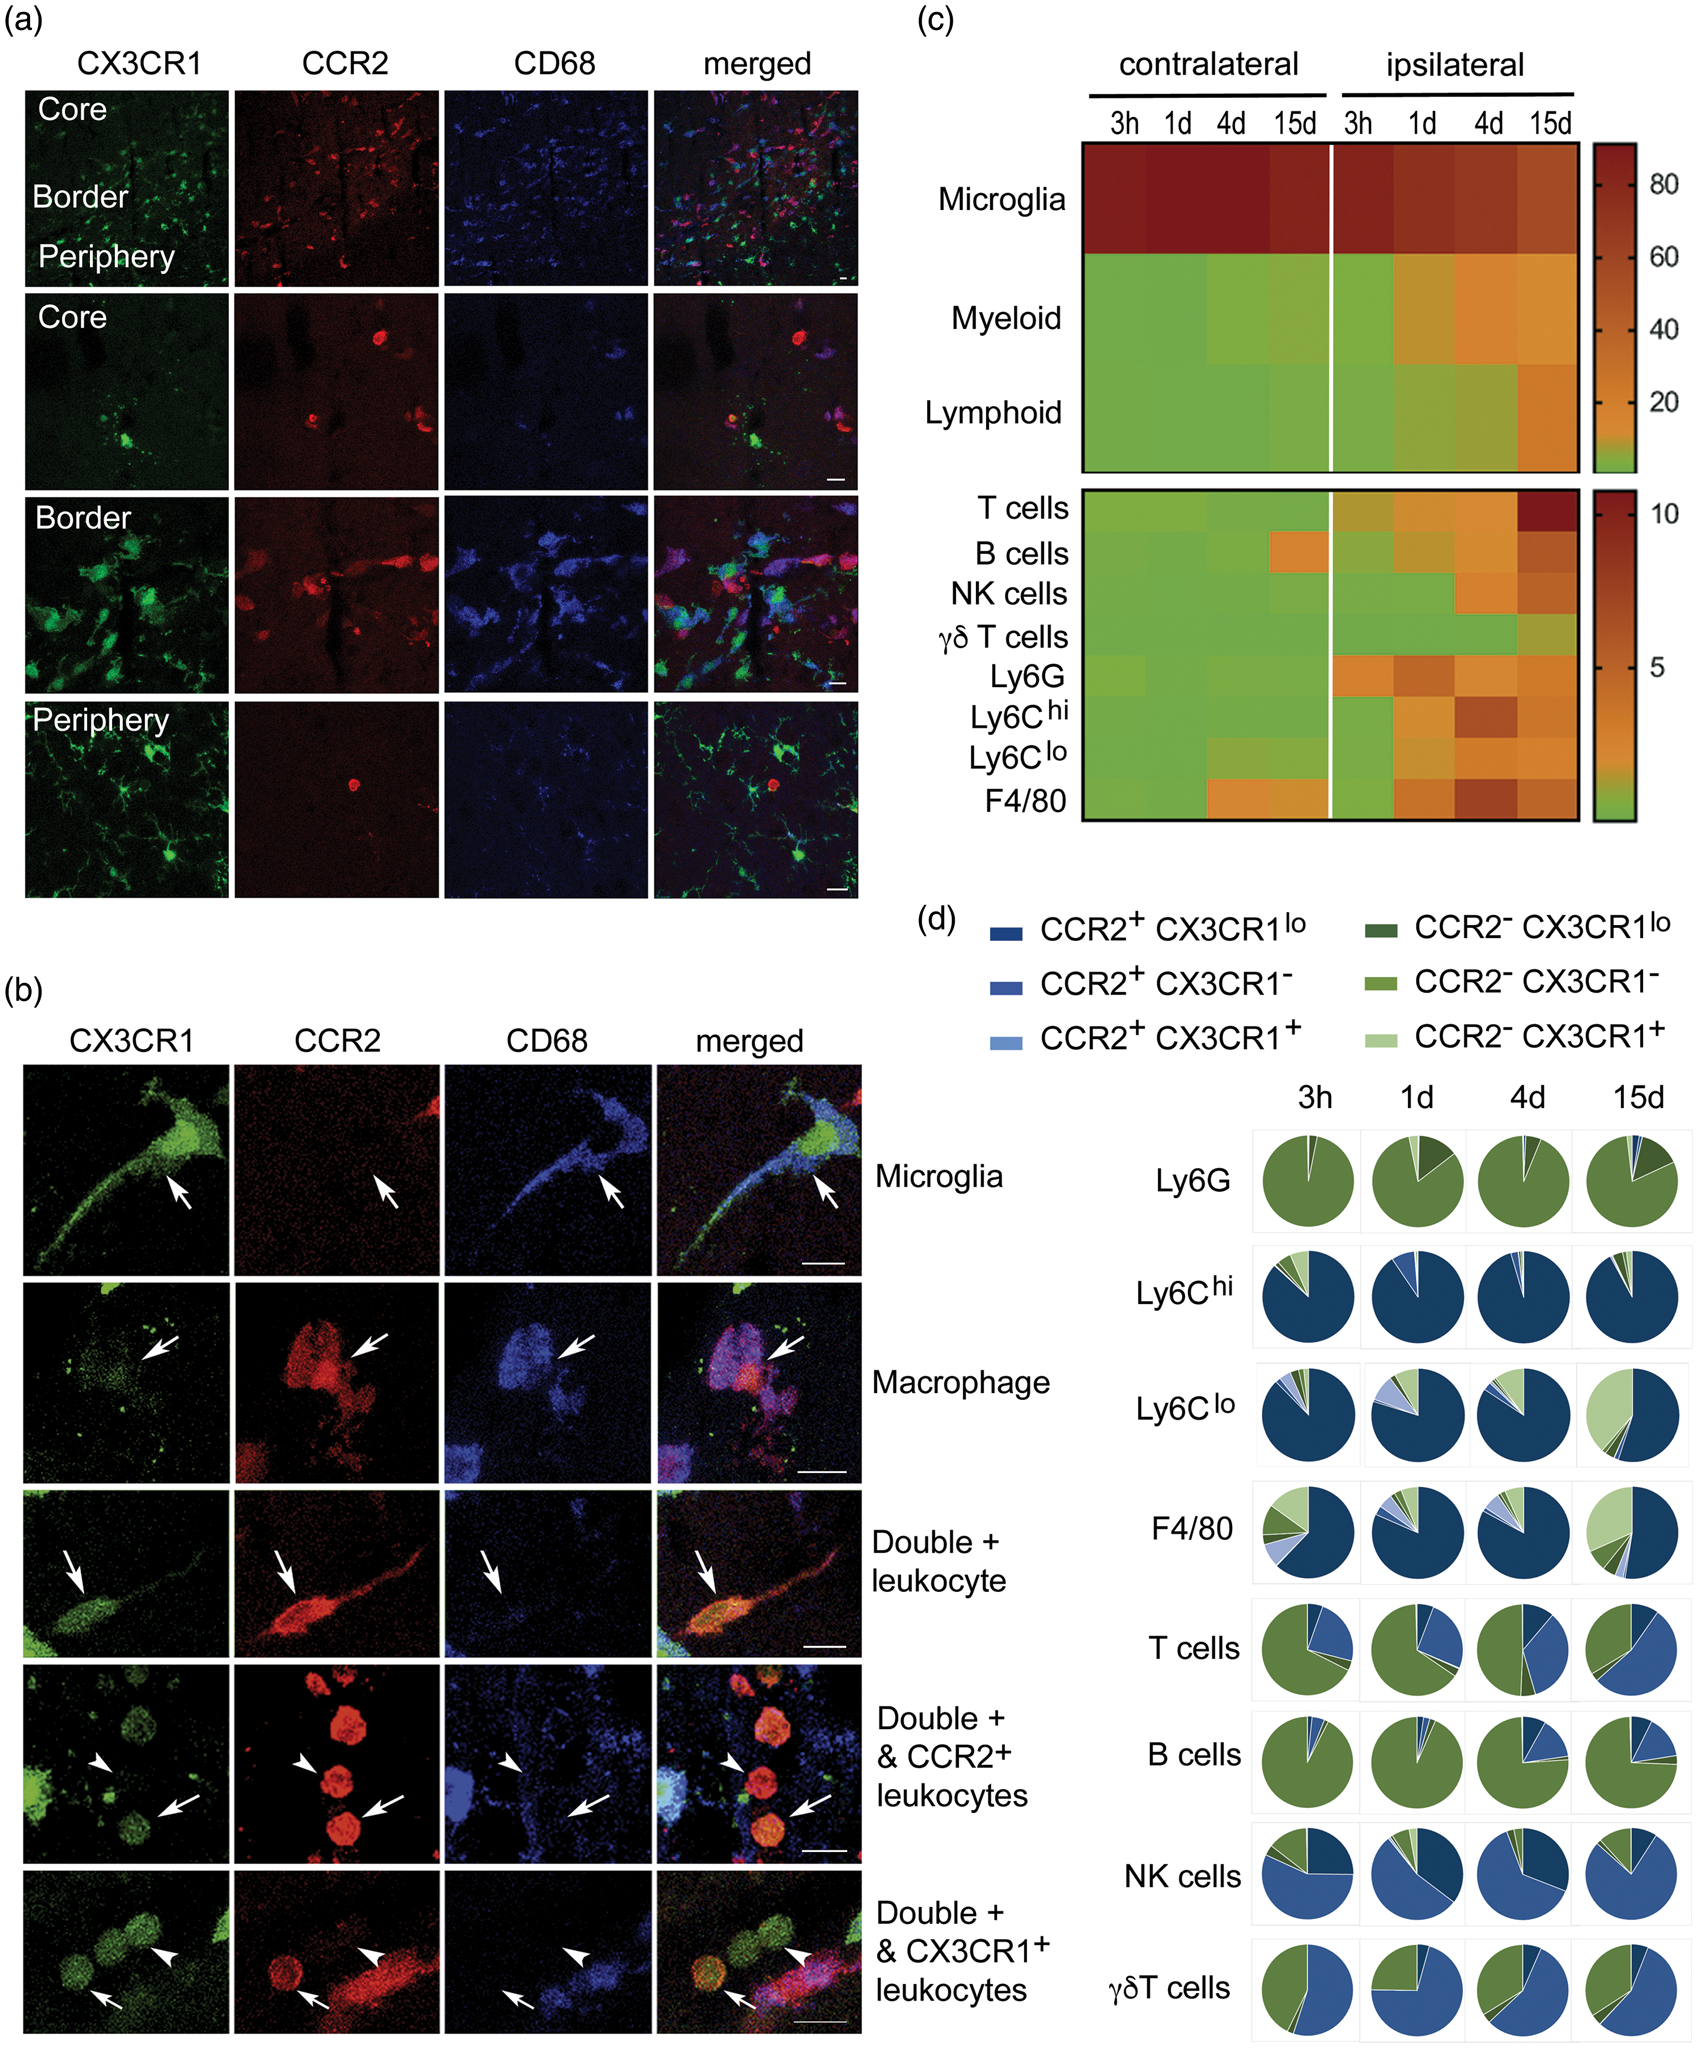
A complex population of CCR2+ and/or CX3CR1+ leukocytes infiltrate the ischemic brain tissue. We induced ischemia in the Ccr2rfp/+Cx3cr1gfp/+ double knock-in reporter mice. (a) Confocal microscopy of brain tissue four days post-ischemia (n = 3) shows red cells concentrated in the core and border of infarction whereas green cells predominate at the border and infarct periphery. Therefore, the borders of infarction show the highest density of fluorescent cells consisting of a mixed population of green and red cells. Microglia cells show very bright GFP (green) and are RFP– (lack red fluorescence). Some of the fluorescent cells co-localize with CD68 immunostaining. (b) Examples of individual cells with different morphologies showing single positive (either RFP or GFP fluorescence) and double positive cells. Besides very intense green microglial cells, in the ischemic hemisphere, there are RFP+CD68+GFP+ cells, compatible with monocyte-derived macrophages. Other infiltrating cells are CD68– and exhibit different degrees of RFP fluorescence intensity (from high to low) and/or GFP (low or absent). Scale bar: 10 µm. (c, d) Flow cytometry results of cell populations in the contralateral and ipsilateral cortex at different time points post-ischemia ranging from 3 h to 15 days (n = 3–4 mice per group). Gating strategy is shown in Supplementary Figures S1 and S2. The percentage of the different myeloid and lymphoid cells is shown as a heatmap in (c), and the frequency of CCR2 (blue) and CX3CR1 (green) within each cell population and time point is shown as pie charts in (d). Most Ly6Chi cells are CCR2+CX3CR1lo. Of note, a fraction of lymphocytes also express CCR2.
We further characterized the phenotype of fluorescent cells by flow cytometry from 3 h to 15 days post-ischemia (Figure 1(c) and (d), Supplementary Figures S1 and S2). Leukocyte infiltration progressively increased with maximal peaks of neutrophils (CD45hiCD11b+Ly6G+) at day 1, monocytes (CD45hiCD11b+Ly6G–Ly6C+) and macrophages (CD45hiCD11b+Ly6G–F4/80+) at day 4, and maximal numbers of lymphoid cells (CD45hiCD11b–), particularly T cells (CD45hiCD11b–CD3+) at day 15 (Figure 1(c)). The majority of infiltrating Ly6Chi monocytes were double-positive for RFP and showed low levels of GFP at all-time points, whereas Ly6Clow monocytes showed a time-dependent shift towards GFP+ and they lost RFP expression, and similar results were found for F4/80+ macrophages (Figure 1(d)). Infiltrating neutrophils were RFP– and the vast majority of these cells did not express GFP either (Supplementary Figure S2). In addition to myeloid cells, several lymphocytic populations express CCR2 or CX3CR1.37,38 Accordingly, we detected RFP+ lymphoid cells in the ischemic brain tissue. Most B cells (CD45hiCD11b–CD45R+) were double negative for RFP and GFP, but we detected RFP+GFP– infiltrating T cells that were particularly prominent at day 15 (Figure 1(d)). Furthermore, about one-half of the infiltrating γδ lymphocytes (CD45hiCD11b–γδ-TCR+) and NK cells (CD45hiCD11b–NK1.1+) were RFP+GFP–. Therefore, CCR2+ leukocytes infiltrating the ischemic brain tissue are a heterogeneous and dynamic population of cells including monocytes and lymphoid cells.
CCR2-deficiency in monocytes reduces monocyte infiltration to the ischemic brain tissue without affecting the recruitment of other leukocytes
To investigate the function of infiltrating CCR2+ monocytes we induced selective CCR2 deletion in myeloid cells by crossing LysMcre+ mice with floxed Ccr2 (Ccr2fl/fl) mice (Figure 2(a)). 31 CCR2 deficiency is restricted to mononuclear myeloid cells (CD11b+ CD115+Ly6G–) (Figure 2(b)) since the highest LysMcre recombination takes place in myeloid cells (Supplementary Figure S5) but it is low in microglia, 39 which together with neutrophils express low levels of CCR2 (Supplementary Figures S1 and S2).
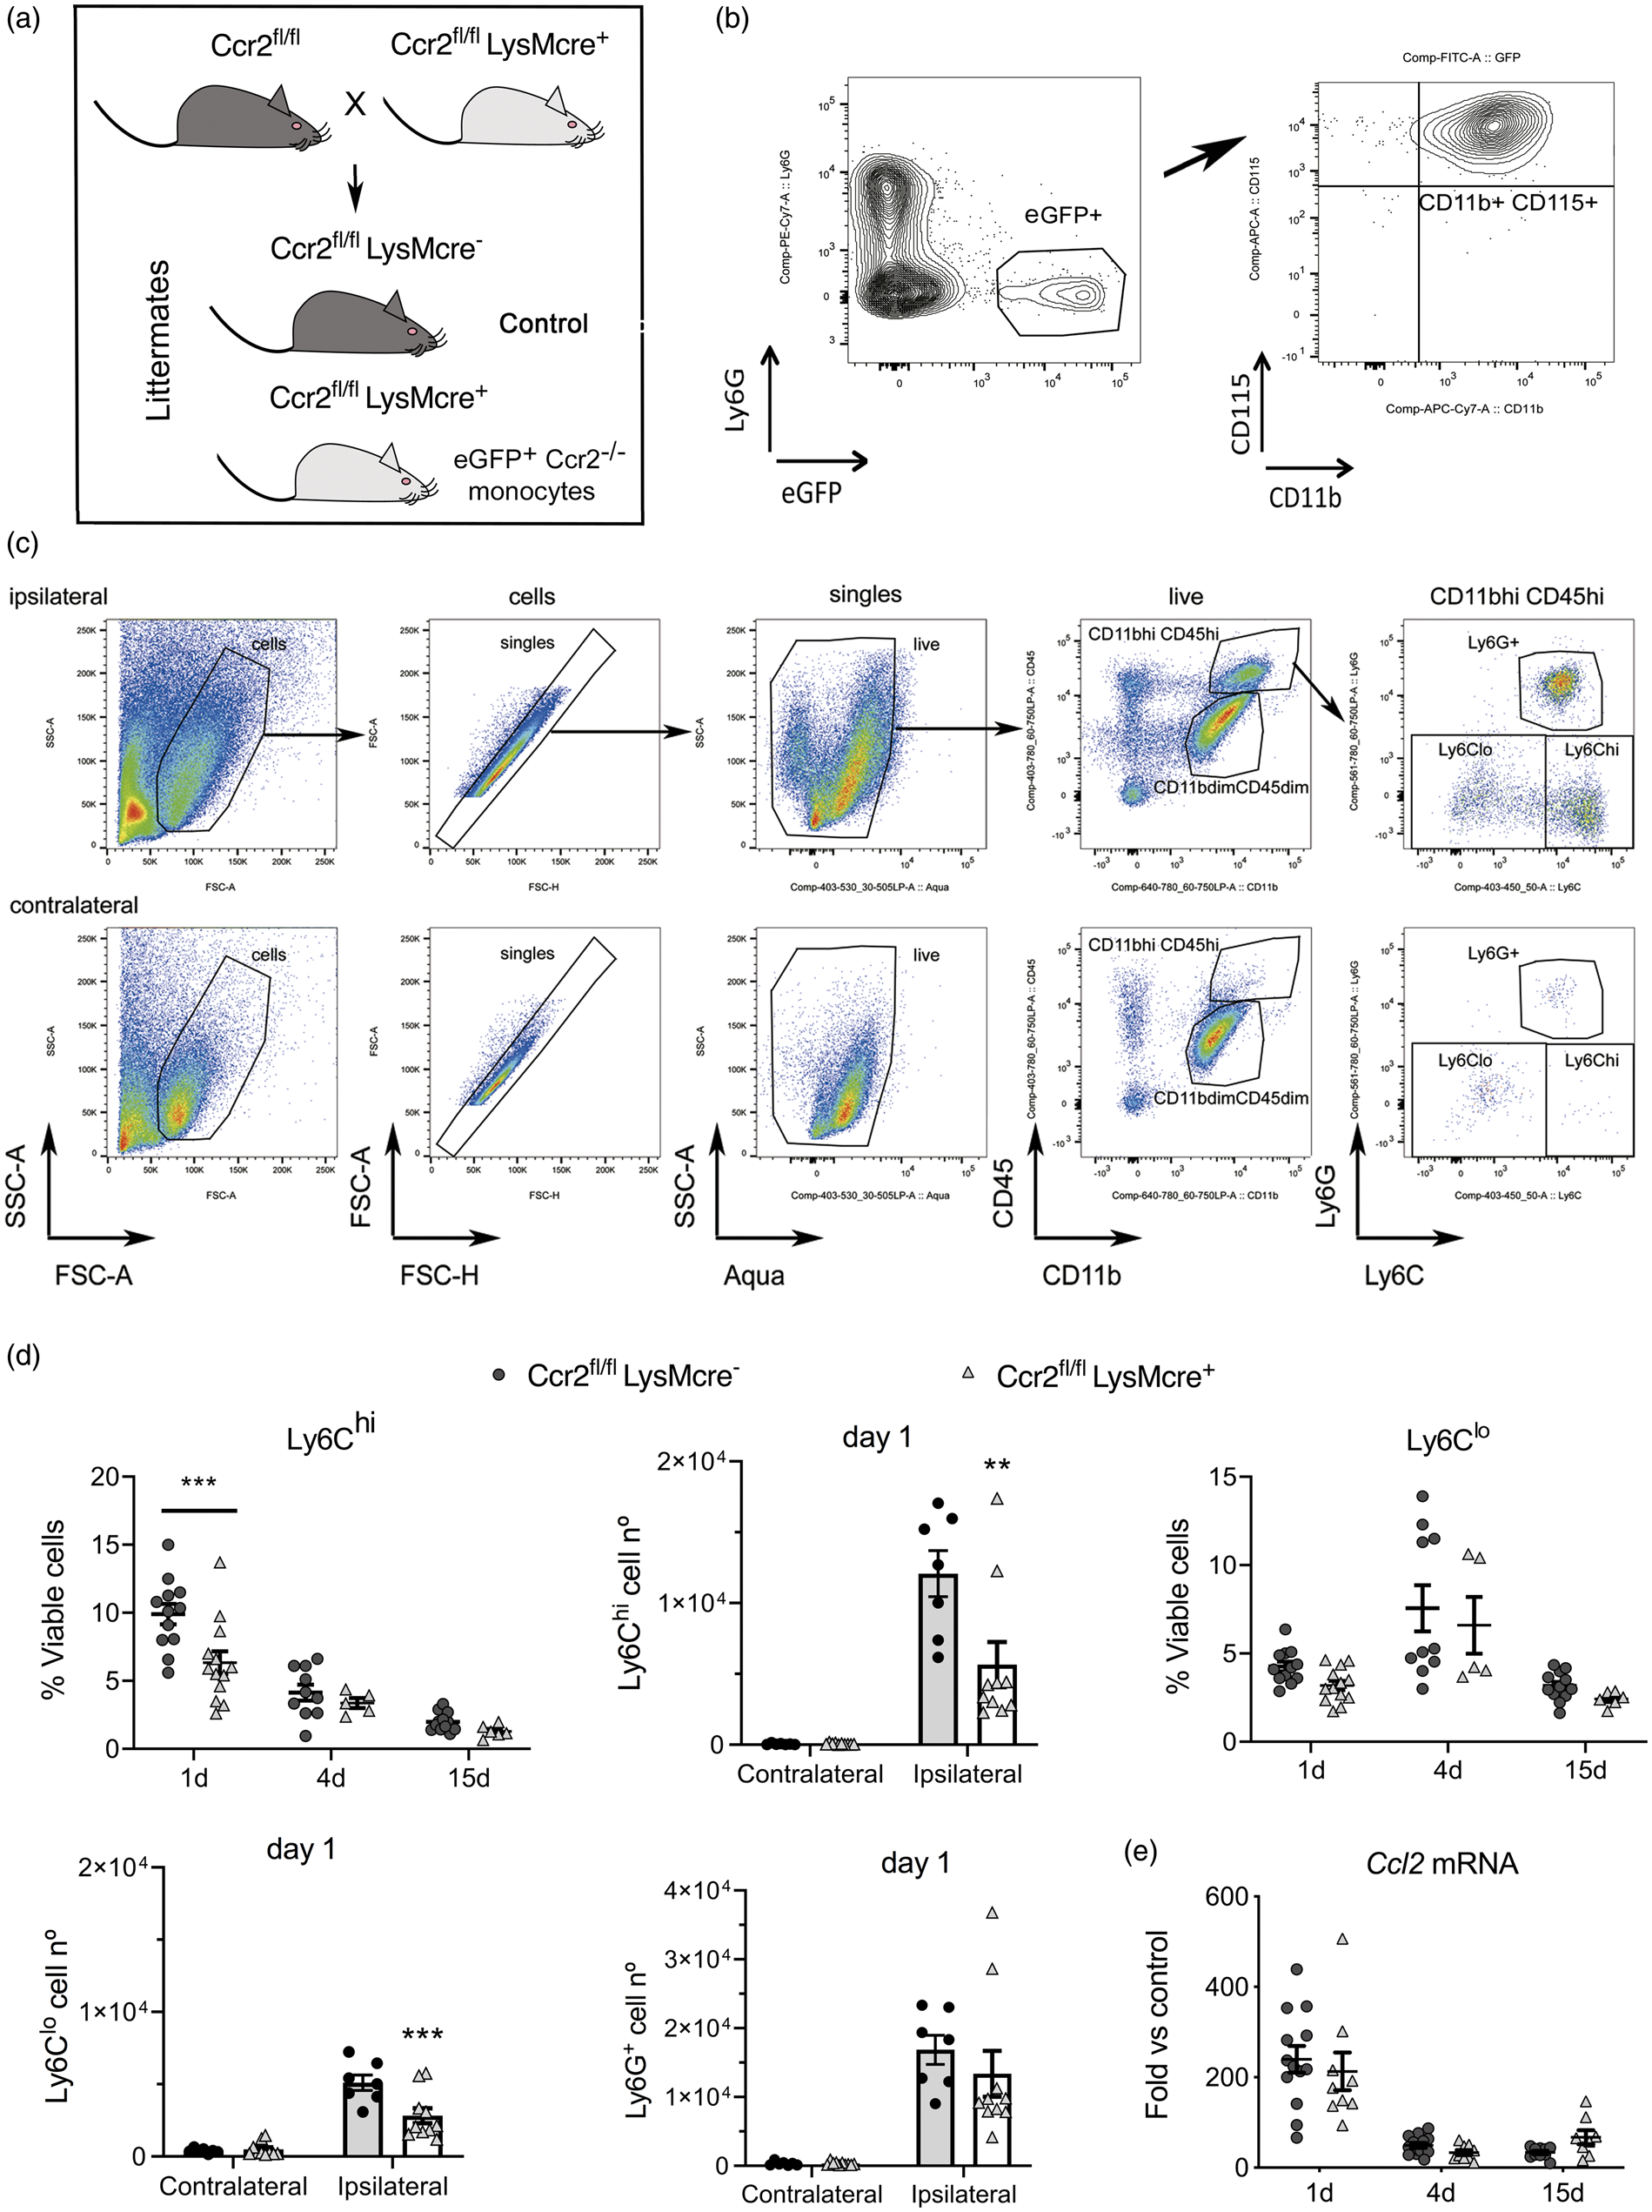
CCR2 deficiency in monocytes reduces monocyte infiltration to the ischemic tissue. We conditionally targeted Ccr2 gene expression by Cre-mediated recombination crossing LysMcre+ mice with floxed CCR2 mice (Ccr2fl/fl) that express reporter eGFP. 31 (a) The study was conducted in littermate Ccr2fl/flLysMcre+ and Ccr2fl/flLysMcre– mice (control). (b) We verified that blood eGFP+ cells in the Ccr2fl/flLysMCre+ mice were monocytes: CD11b+CD115+Ly6G–. (c) Gating strategy to study monocytes and neutrophils in the contralateral and ipsilateral cortex. Images correspond to 1 day after ischemia. We separated monocytes with high Ly6C expression (Ly6Chi) from monocytes with dim or negative Ly6C expression (collectively termed Ly6Clo). (d) We studied monocyte subsets infiltrating the brain tissue at different time points after induction of ischemia, i.e. 1, 4 and 15 days, by flow cytometry in mice of both genotypes (n = 5–12 mice per time point and genotype). Ly6Chi and Ly6Clo monocytes increased after ischemia in the ipsilateral (ischemic) but not the contralateral cortex. The % of CD45hiCD11bhiLy6G–Ly6Chi cells is lower in Ccr2fl/flLysMcre+ mice one day post-ischemia (Two-way ANOVA by genotype and time point followed by Sidak’s multiple comparisons test, ***p < 0.001). The number of Ly6Chi monocytes decreases in the ipsilateral cortex in Ccr2fl/flLysMCre+ mice at day 1 (two-way ANOVA by genotype and brain region followed by Sidak’s multiple comparisons test; ***p < 0.001). The % of CD45hiCD11bhiLy6G–Ly6Clo cells also tend to decrease in Cre+ mice (two-way ANOVA by genotype and time point, genotype effect p = 0.06), and the absolute cell number at day 1 is lower in Ccr2fl/flLysMCre+ mice (two-way ANOVA by genotype and brain region followed by Sidak’s multiple comparisons test; ***p < 0.001). However, the numbers of infiltrating Ly6G+ neutrophils are no different between genotypes. (e) Ccl2 mRNA expression in the ischemic brain tissue at different time points after ischemia shows the highest increase at day 1 versus 4 or 15 days, but there are no differences between genotypes (n = 8–14 mice per time group and genotype). Values are expresses as fold versus non-ischemic contralateral hemisphere of the control genotype.
We induced ischemia in Ccr2fl/flLysMcre+ mice, and Ccr2fl/flLysMcre– littermates as the control genotype (Figure 2(a)). Flow cytometry (Figure 2(c)) showed ischemia-induced strong infiltration of Ly6Chi monocytes, and to a lower extent Ly6Clo monocytes (including monocytes with low or negative Ly6C expression) to the injured tissue at day 1 (Figure 2(c) and (d)). Compared with mice of the control genotype, Ccr2fl/flLysMcre+ mice showed reduced brain infiltration of Ly6Chi and Ly6Clo monocytes 24 h post-ischemia (Figure 2(d)). Absence of CCR2 in monocytes did not cause significant modification in the infiltration of neutrophils (Figure 2(d)) or lymphocytes (Supplementary Figure S6).
Brain Ccl2 mRNA expression increased 24 h post-ischemia and declined afterwards showing that the CCL2/CCR2 axis was involved in monocyte recruitment during the acute phase of stroke but it was dispensable at chronic phases. Up-regulation of Ccl2 mRNA expression in the ischemic tissue was not affected in Ccr2fl/flLysMcre+ mice (Figure 2(e)). Therefore, CCR2+ monocytes rapidly infiltrate the ischemic brain in response to chemoattraction through the CCL2/CCR2 axis, and monocyte infiltration is impaired in mice with CCR2-deficient monocytes.
Absence of CCR2+ monocytes impairs stroke neurological outcome
Infarct volume (MRI) was similar in Ccr2fl/flLysMCre+ mice than corresponding Ccr2fl/flLysMcre– controls (Figure 3(a) and (b)). We found no significant differences in infarct volume between male and female mice at day 1 (Figure 3(b)) and we pooled mice of both sexes in subsequent experiments. We did not observe differences in lesion volume 1 or 15 days post-ischemia (Figure 3(c)), and there were no sex differences at day 15 (Supplementary Figure S7). However, the neurological function was worse in mice with CCR2-deficient monocytes, as shown by the poorer performance in the Pole test (Figure 3(d)) and the Rotarod test (Figure 3(e)).
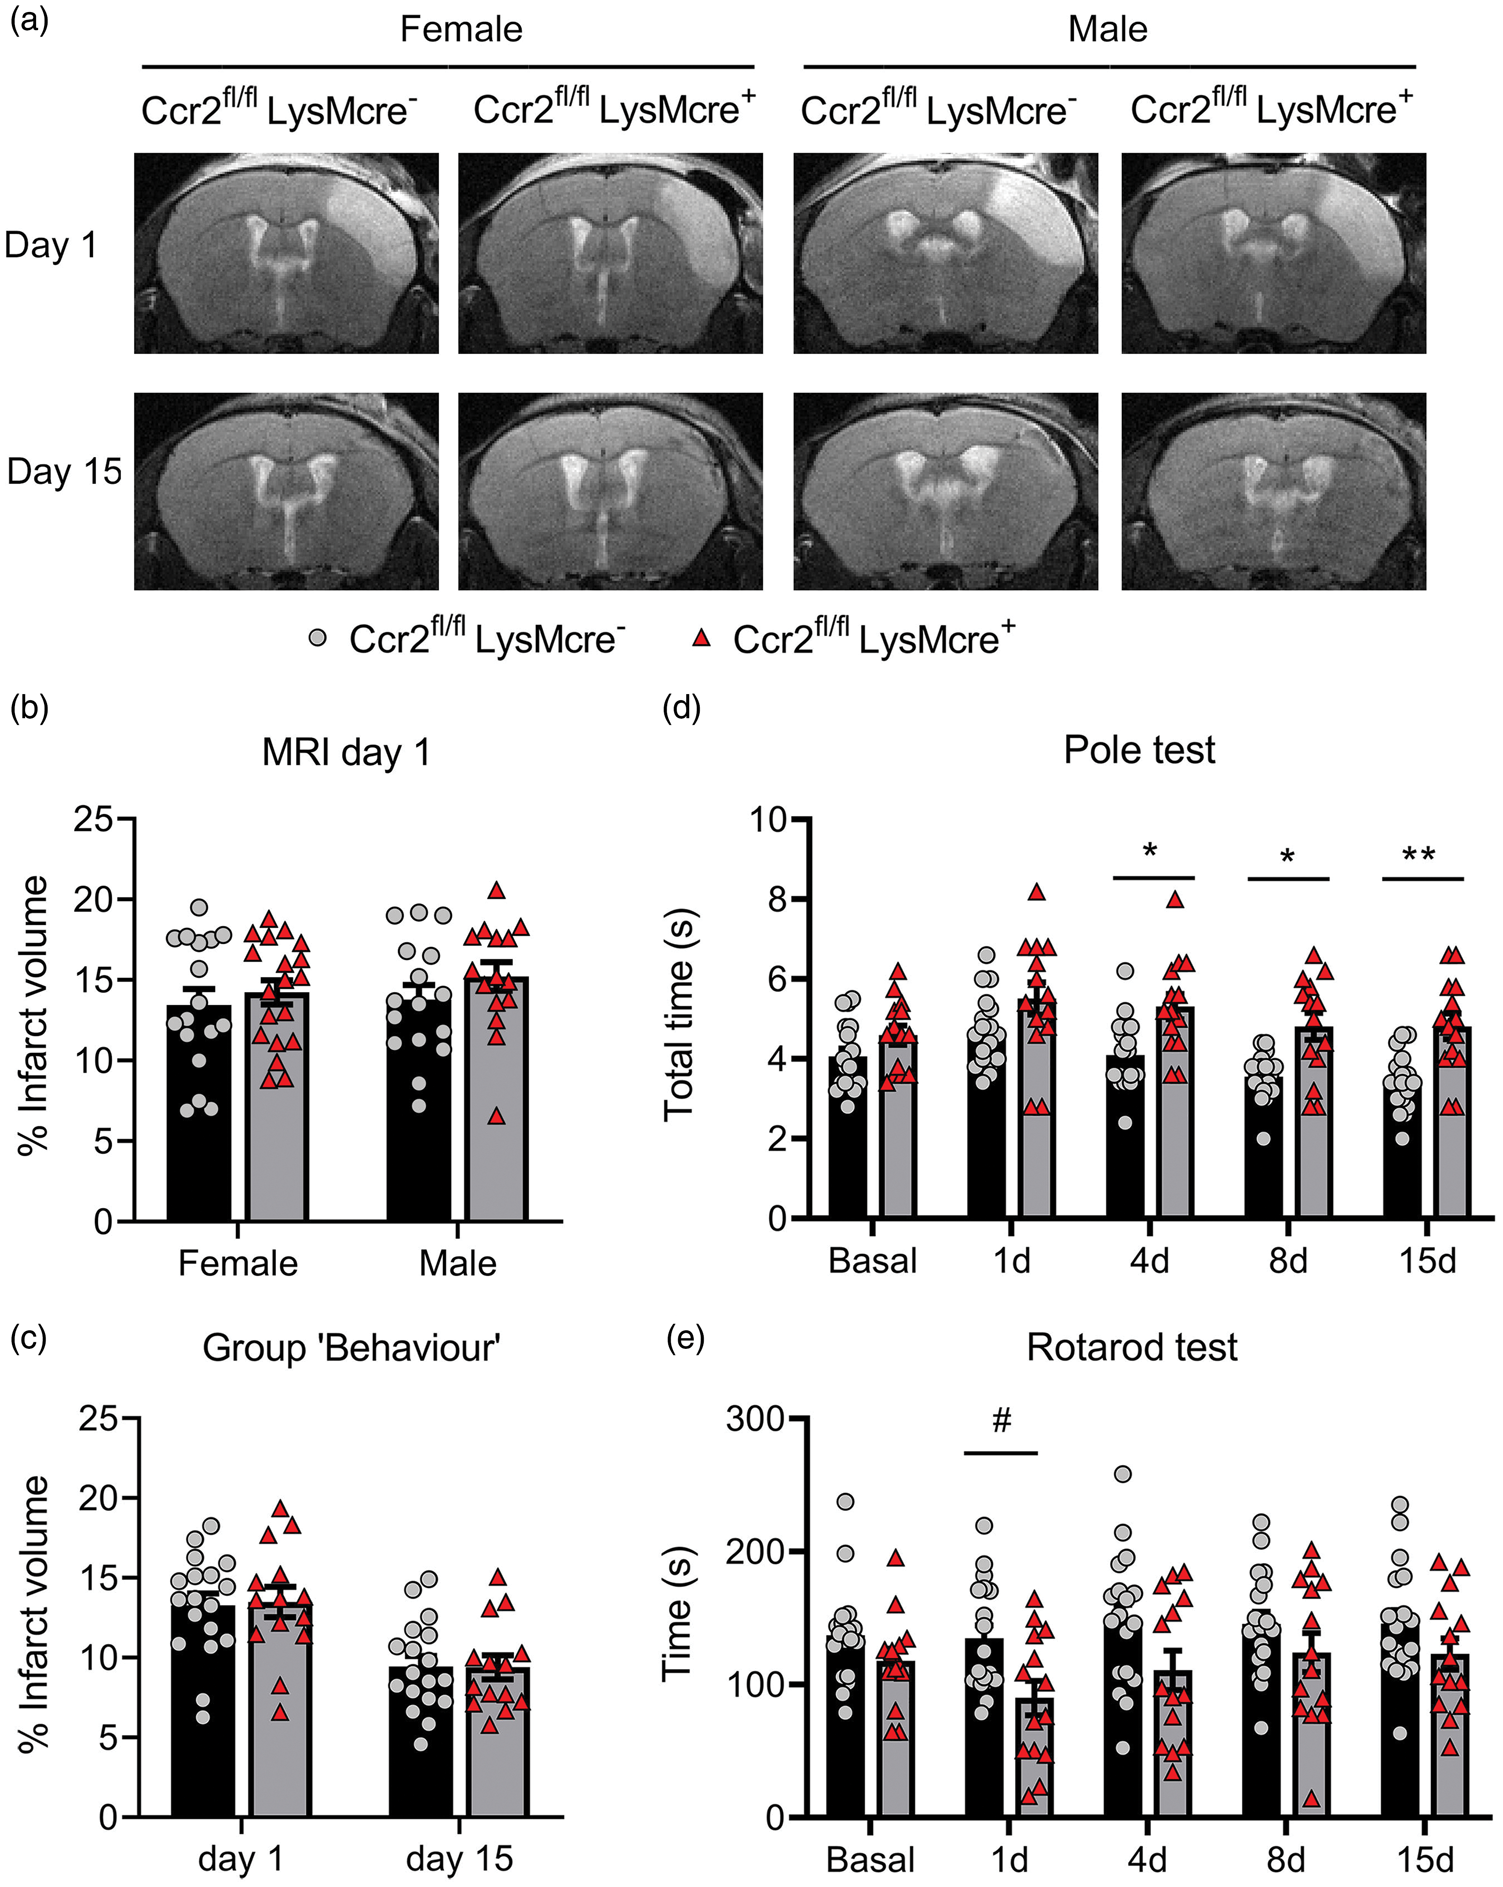
CCR2 deficiency in monocytes causes neurological impairment after ischemic stroke. We compared stroke outcome in mice with CCR2-deficient monocytes (Ccr2fl/flLysMcre+ mice) and corresponding control littermate mice (Ccr2fl/flLysMcre– mice). (a) MRI images (T2w) show infarct volume in representative female and male mice of both genotypes at day 1 and 15 post-ischemia in the same mice. (b) Measures of MRI infarct volume 1 day post-ischemia in female (n = 16) and male (n = 17) CCR2fl/flLysMcre– mice and female (n = 15) and male (n = 19) CCR2fl/flLysMcre+ mice show no differences in infarct volume between genotypes or sexes; two-way ANOVA by genotype (p = 0.212) and sex (p = 0.465). (c) In an independent group of mice we pooled male and female mice of each genotype (n = 18 CCR2fl/flLysMcre– mice; n = 14 CCR2fl/flLysMcre+ mice) and measured infarct volume by MRI twice at days 1 and 15 post-ischemia (a) and conducted behavioral tests in the same mice at several time points (Group ‘Behaviour’). Again, we found no significant differences in infarct volume due to genotype. Two-way ANOVA by genotype (p = 0.932) and time (p < 0.001) with a subject matching design (subject effect p < 0.001). (d, e) Nonetheless, the latter group of mice showed differences in behavior between genotypes since the mice with CCR2-deficient monocytes needed more time to complete the Pole test (s, seconds) than the control genotype (d). Two-way ANOVA by genotype (p = 0.001) and time (p < 0.001) with a subject matching design (subject effect p < 0.001) and no interaction between factors, followed by Sidak’s multiple comparisons test that showed significant differences between genotypes at day 4 (*p = 0.020), day 8 (*p = 0.015), and day 15 (**p = 0.004). Also, mice with CCR2-deficient monocytes run less time (s, seconds) in the Rotarod test that the control genotype (e). Two-way ANOVA by genotype (p = 0.036) and time (p = 0.024) and subject matching (subject effect p < 0.001) with no interaction between factors, followed by the Sidak’s multiple comparisons test that highlighted genotypes differences at day 1 (#p = 0.05).
Effect of CCR2+ monocytes in mRNA expression of genes related to inflammation and angiogenesis
Ischemia induced an acute inflammatory reaction highlighted by increased cytokine Il1b and Il6 mRNA expression one day post-ischemia, decreasing in the following days (Figure 4(a) and (b)). Pro-inflammatory gene expression was accompanied by expression of genes that are hallmarks of M2 alternative macrophage activation, 40 such as Chil3 (YM1) and Arg1 (Figure 4(a) and (b)). Compared to the control genotype, mice with CCR2-deficient monocytes showed reduced mRNA expression of Il1b and Il6, but also Arg1 and Chil3 one day post-ischemia (Figure 4(a) and (c)). However, these mice showed a delayed exacerbated inflammatory response highlighted by increased expression of Il1b mRNA, amongst other genes, 15 days post-ischemia (Figure 4(a) and (c)).
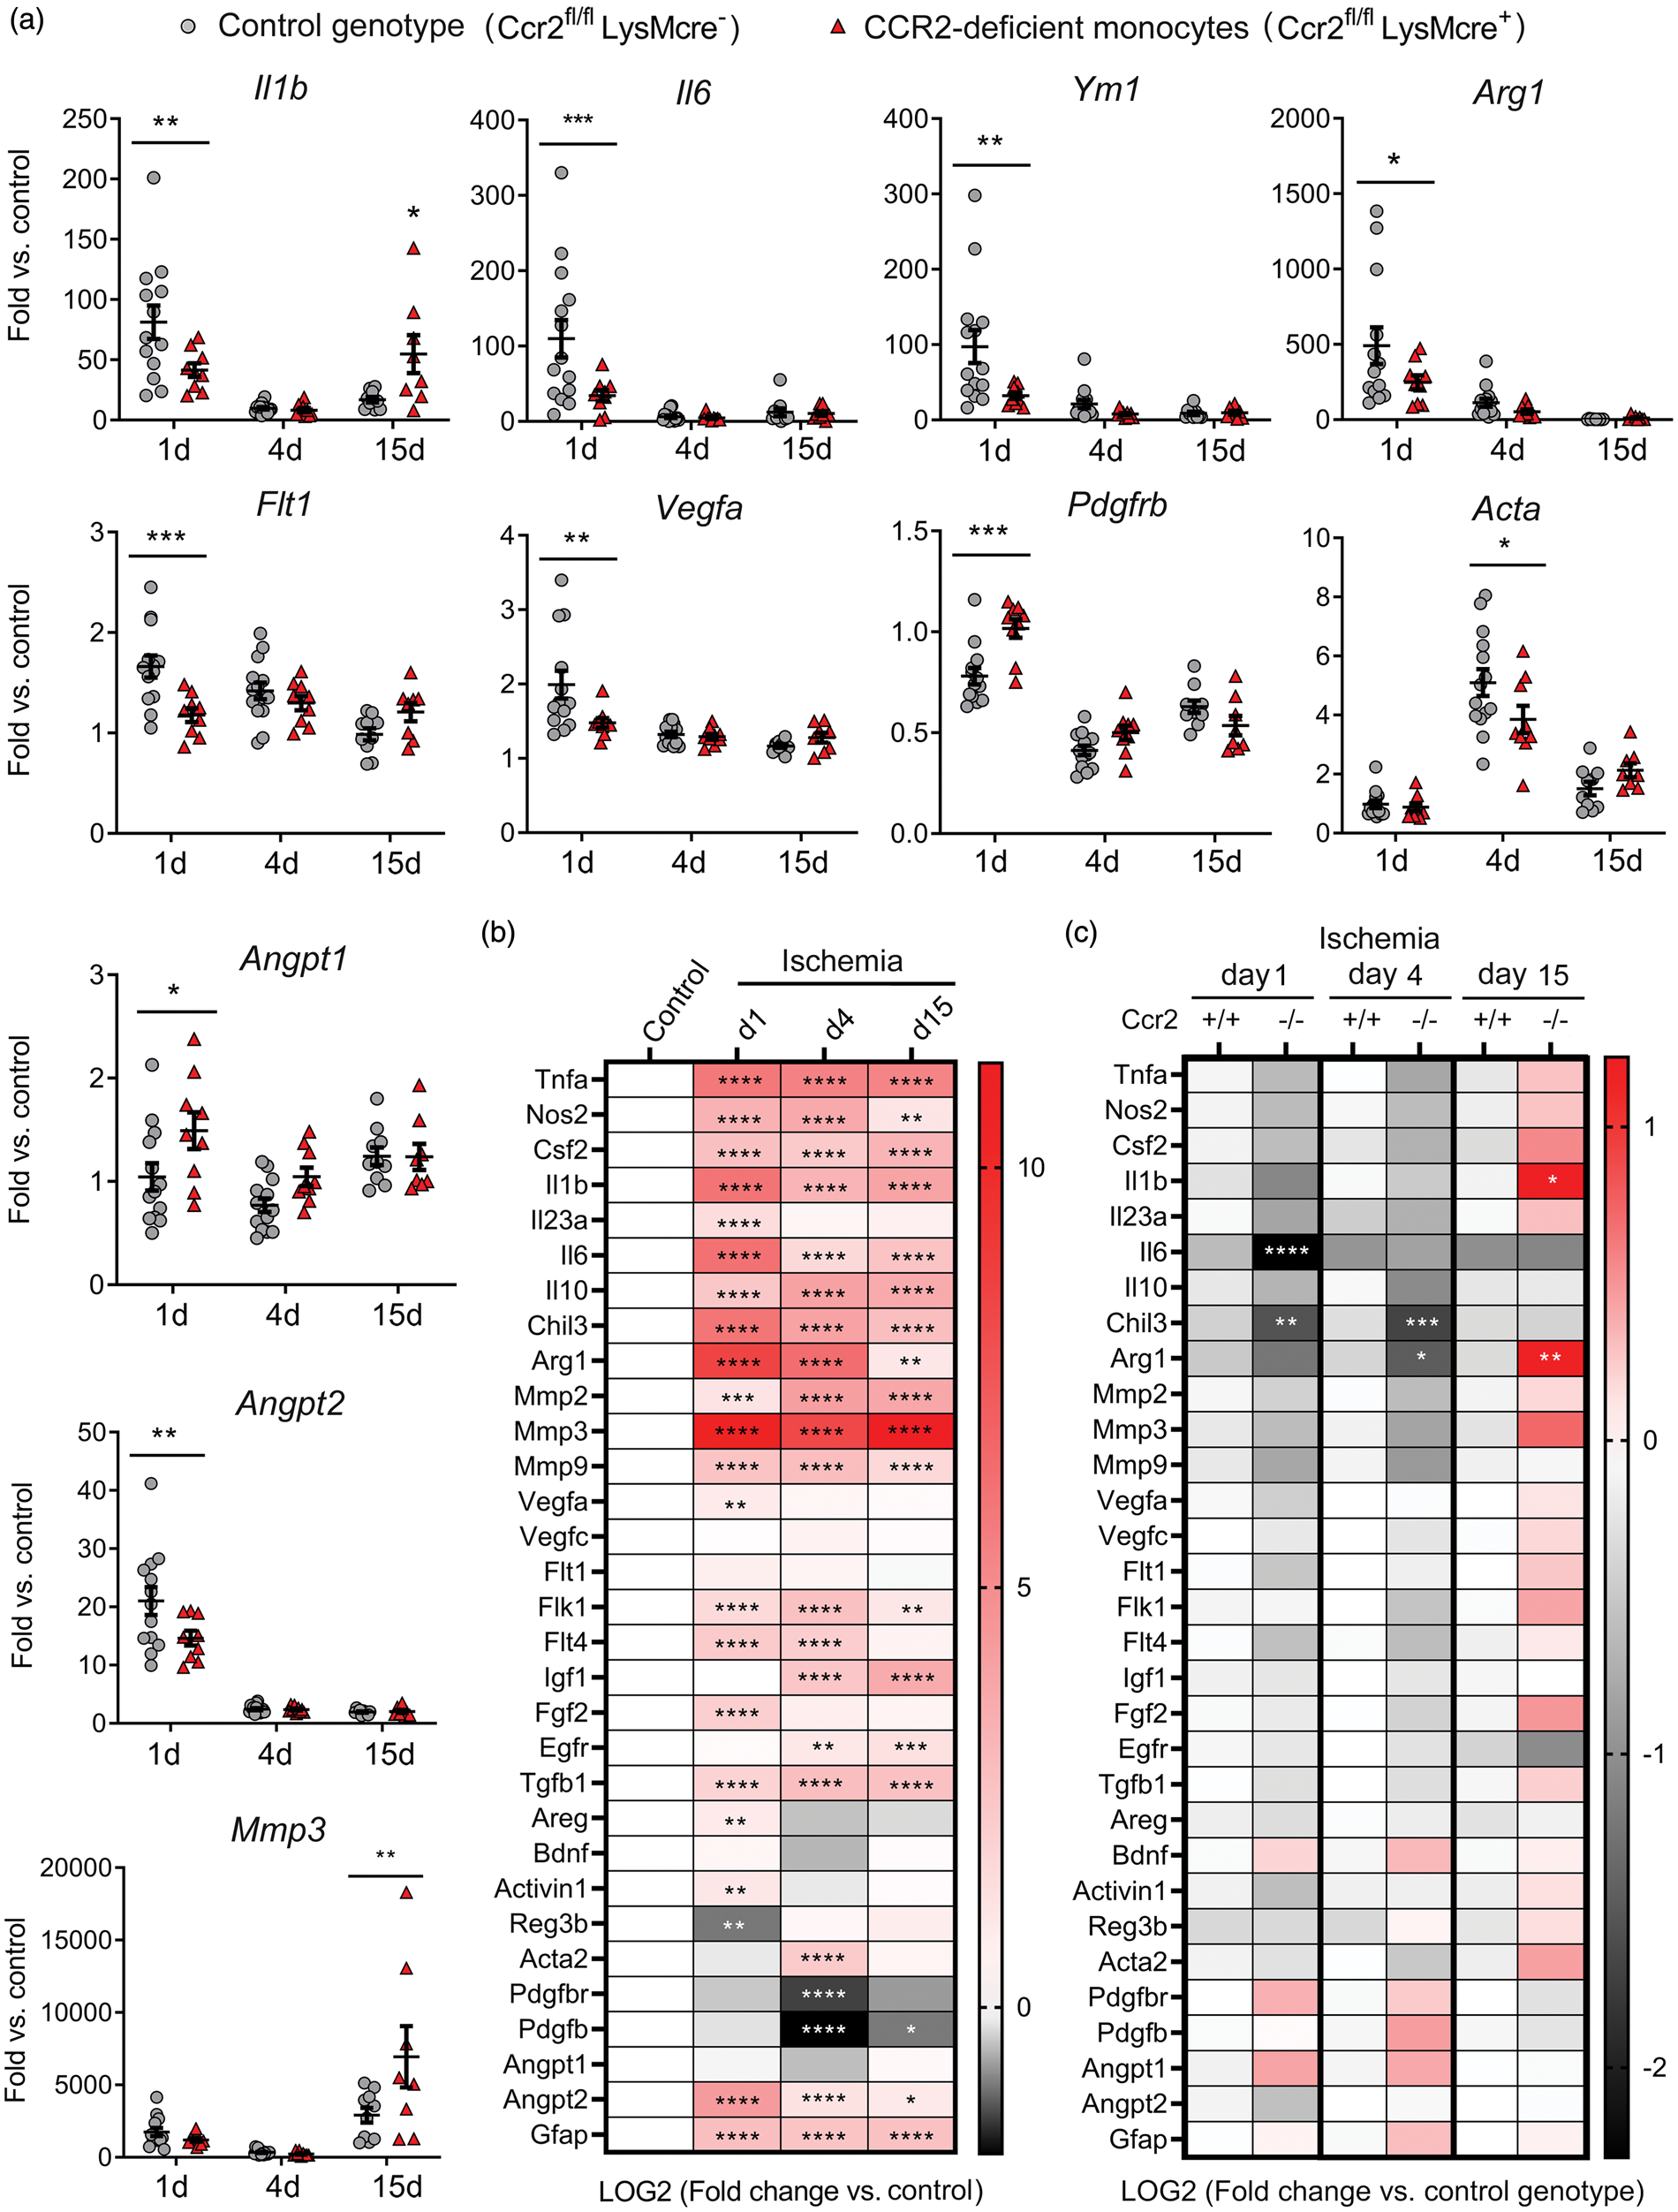
Monocyte CCR2-deficieny alters gene expression in the ischemic brain tissue. Gene expression was assessed by qRT-PCR in the ischemic cortex of mice with CCR2-deficient monocytes (Ccr2fl/flLysMcre+) and control littermate mice (Ccr2fl/flLysMcre–) at day 1 (n = 9 and n = 13), 4 (n = 9 and n = 14), and 15 (n = 9 and n = 10), respectively. (a) Expression of individual genes after ischemia in mice of both genotypes. Values are expressed as fold versus the mean value of non-ischemic cortex of control genotype (n = 15). Two-way ANOVA by genotype and time followed by Sidak’s multiple comparisons test. (b, c) Given that we studied multiple genes (n = 31) in the same samples, we carried out a global statistical analysis adjusting for multiple comparisons using the Holm-Sidak method. (b) Global heatmap of gene expression values in the control genotype (Ccr2fl/flLysMcre–) showing changes induced by ischemia at different time points versus non-ischemic control. Symbols indicate adjusted p value. Values are expressed as Log2 of fold change versus control. (c) Global heatmap showing the differences between genotypes at each time point post-ischemia according to multiple t-test. Values in color code correspond to Log2 of fold change versus control genotype at each time point. The analysis identified the largest and more robust changes between CCR2-deficient mice and the corresponding controls. The observed differences between genotypes for the VEGF- and pericyte-related genes were not as strong as for pro-inflammatory and M2 genes since the statistical significance found in individual gene analysis was not sustained after adjusting for multiple comparisons, which was attributable to the comparatively smaller magnitude of the former changes. ****p < 0.0001, ***p < 0.001, **p < 0.01, *p < 0.05
Given that monocyte-derived macrophages participate in tissue repair and regeneration in various organs,41,42 we evaluated the cerebral mRNA expression of various growth and pro-regenerative factors. Ischemia generally increased most factors (Figure 4(a) and (b)). Angiogenesis is important to heal-injured tissues. The expression of angiopoietin gene Angpt2 increased one day post-ischemia and the effect was attenuated in mice with CCR2-deficient monocytes, whereas Angpt1 expression was higher in the latter group (Figure 4(a) and (c)). Vascular endothelial growth factor (VEGF) is a potent stimulator of angiogenesis.43,44 Expression of Vegfa and the VEGF receptors, Flk1 (Kdr, VEGFR2) and Flt4 (VEGFR3) increased 1 and/or 4 days post-ischemia (Figure 4(a) and (b)), but the effect was attenuated in mice with CCR2-deficient monocytes suggesting a reduced angiogenic capacity (Figure 4(a) and (c)). Macrophages can induce pro-angiogenic functions by signaling to pericytes. 45 Ischemia reduced Pdgfbr and Pdgfb mRNA and increased Acta mRNA, encoding for α-smooth muscle actin (α-SMA) (Figure 4(a) and (b)). Ischemia-induced changes in pericyte-related genes were less prominent in mice with CCR2-deficient monocytes (Figure 4(a) and (c)). Altogether, the gene expression study suggested a contribution of CCR2+ monocytes to angiogenesis after ischemia. Differences between genotypes in gene expression of both pro-inflammatory and pro-repair genes indicated that there could be functionally diverse subsets of infiltrating CCR2+ monocytes.
Gene expression in Ly6Chi monocytes vs. microglia
Ly6ChiCCR2+ monocytes are pro-inflammatory. 8 Some monocytes express VEGFR-1, 46 and there are subsets of pro-angiogenic VEGFA+CCR2+Ly6Chi monocytes. 31 To obtain information about infiltrating Ly6Chi monocyte features, we isolated them from the ischemic brain tissue one-day post-ischemia by FACS (gating strategy is shown in Supplementary Figure S8). We obtained RNA from the sorted cells and studied gene expression. For comparative purposes we sorted microglia from the same ischemic brains and obtained control microglia from naïve mice. We conducted this study in Cx3cr1creERT2:Rosa26-tdT mice. Ischemia was induced after three-weeks of washout following tamoxifen administration to allow turnover of circulating fluorescent monocytes while fluorescent microglial cells persist because they are long living cells. 47 Ccr2 mRNA expression was higher in sorted Ly6Chi monocytes than microglia whereas typical microglia marker Tmem119 was virtually undetectable in Ly6Chi monocytes (Figure 5(a)). Ly6Chi monocytes showed higher expression of Il1b than microglia from the ischemic brain and a tendency to higher Il6, but not Tnfa (Figure 2(a)). Notably, Ly6Chi monocytes showed higher expression than microglia of M2 genes Chil3 and Arg1 (Figure 5(a)) and Vegfa and its receptor Flt1 (Figure 5(a)), suggesting that subsets of infiltrating CCR2+Ly6Chi monocytes may have pro-angiogenic features. We studied Arg-1 expression by intracellular flow cytometry one-day post-ischemia. A subset of Ly6Chi monocytes (15%) was positive for Arg-1 in the ischemic brain tissue but not in blood (Figure 2(b)) showing that the population of infiltrating Ly6Chi monocytes includes cells with diverse phenotypes.
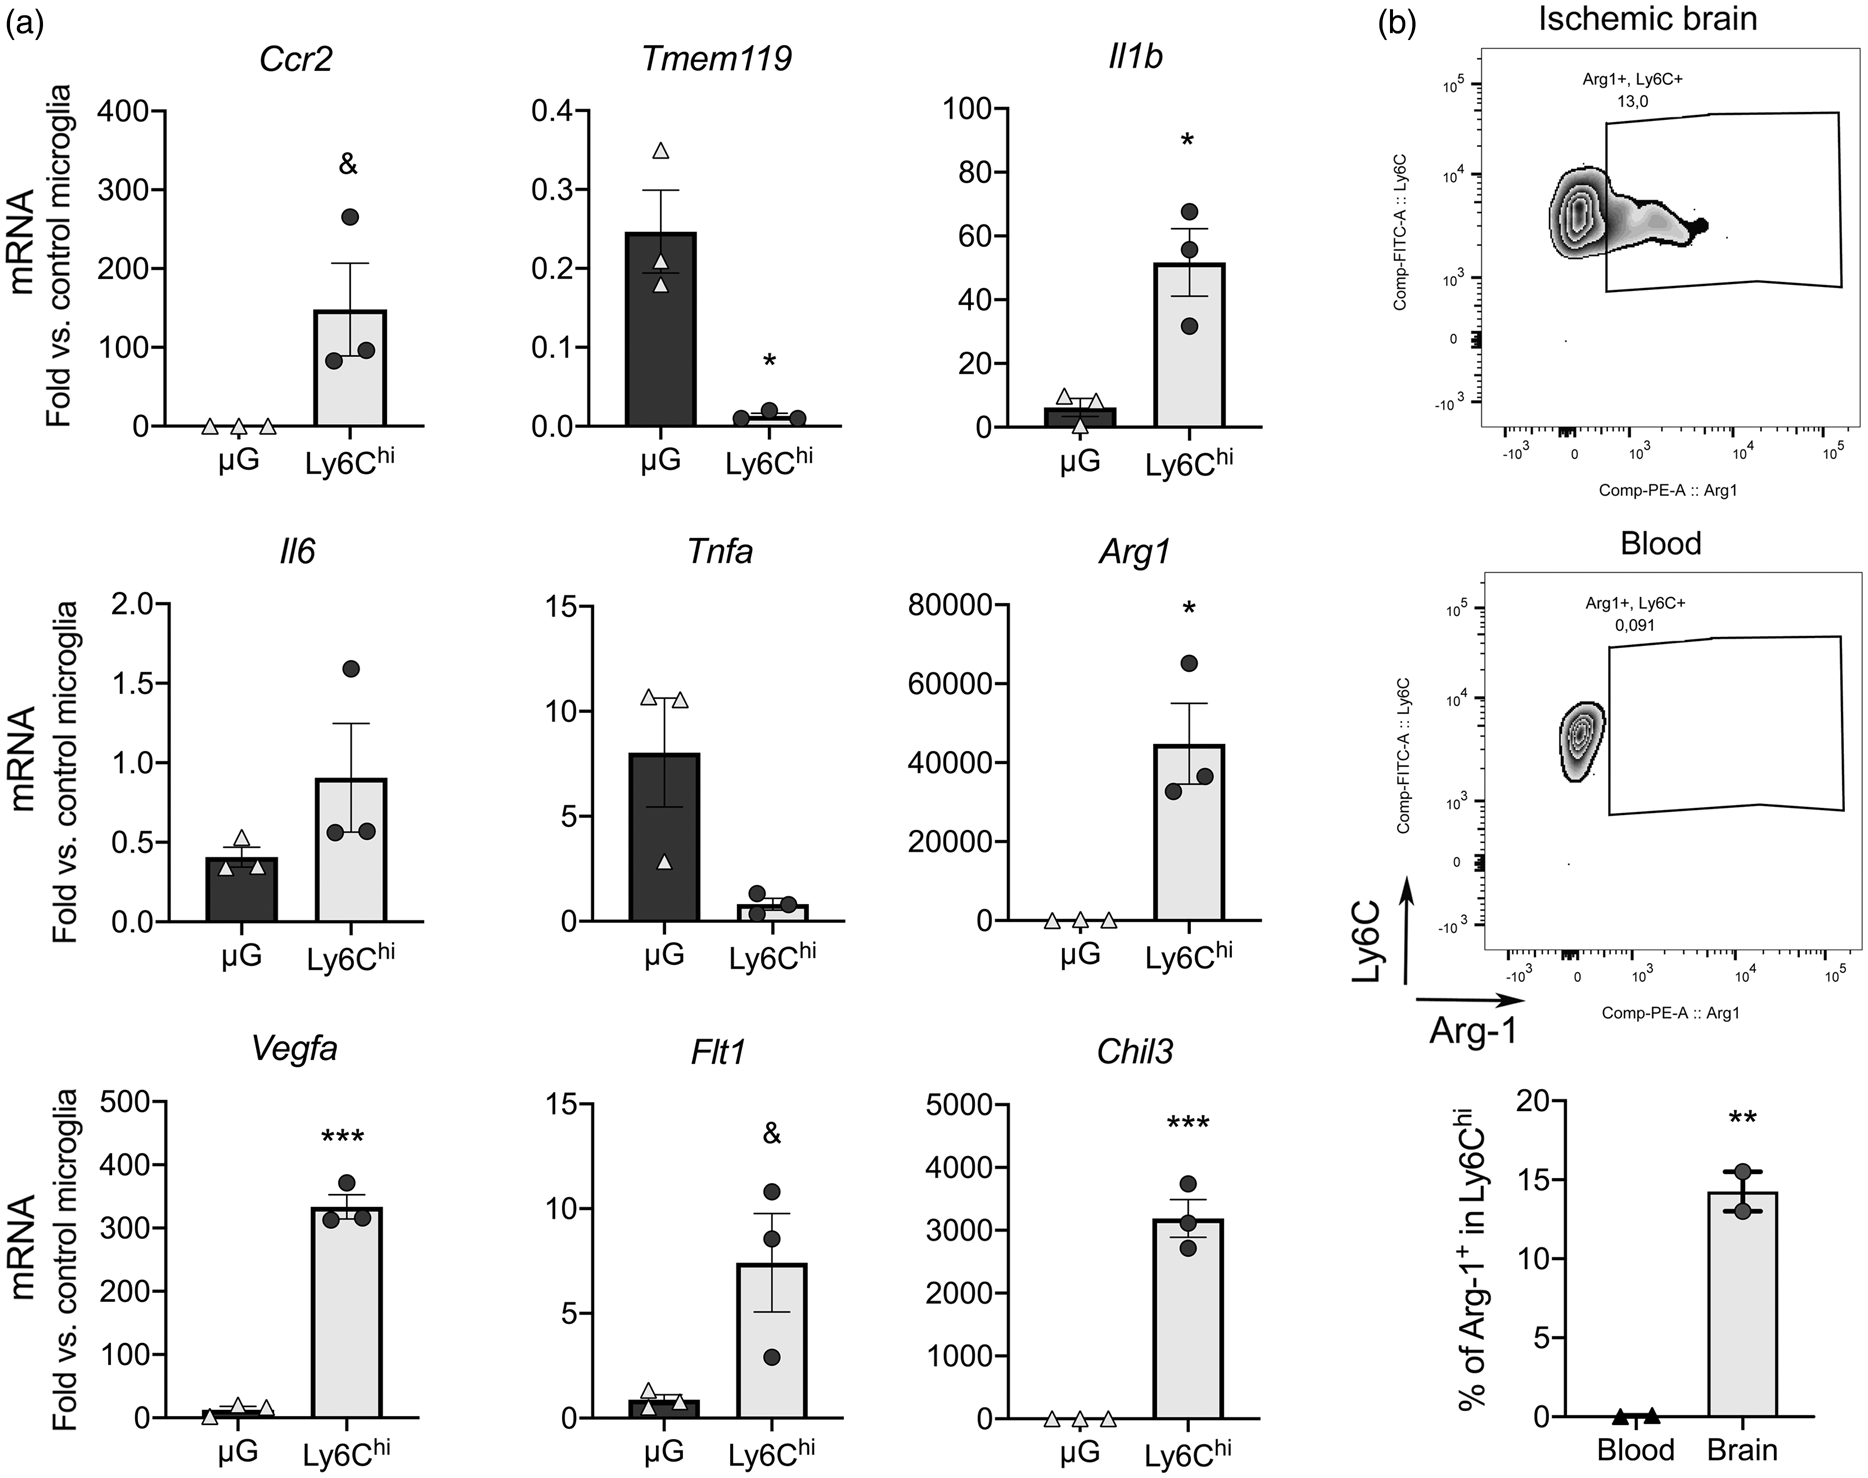
Brain infiltrating Ly6Chi monocytes express pro-inflammatory and pro-repair genes. We sorted Ly6Chi monocytes and microglia (µG) by FACS from the cerebral cortex 1 day post-ischemia (n = 3 mice), and control microglia from the cortex of control mice (n = 3 mice). The study was performed in CX3CR1cre-Rosa26-tdT mice with a gating strategy shown in Supplementary Figure S7. (a) RNA was extracted from the sorted cells and gene expression was studied by qRT-PCR (n = 3 samples per group). We checked the expression of Ccr2 and Tmem119 as markers of Ly6Chi monocytes and microglia, respectively. Expression of Il1b is higher in Ly6Chi monocytes compared to microglia in the ischemic brain. Ly6Chi monocytes express higher levels of genes involved in tissue repair, such as the markers of alternative macrophage polarization Chil3 and Arg1, as well as pro-angiogenic Vegfa and to a lower extent its receptor Flt1. Values are expressed as fold versus control microglia. (b) Intracellular flow cytometry did not show Arg1+ cells in blood Ly6C+ monocytes, but we found Arg1+ cells within the Ly6C+ monocytes infiltrating the ischemic brain tissue 24 h post-ischemia (n = 2 wild type mice). All statistical comparisons in this figure were carried out with t-test, except for Tnfa mRNA that was analyzed with Mann-Whitney test because data did not follow normality (Shapiro-Wilk test). &p = 0.05; *p < 0.05; **p < 0.01; ***p < 0.001.
Involvement of CCR2+ monocytes in angiogenesis
Down-regulation of pro-angiogenic gene expression in the ischemic tissue of mice with CCR2-deficient monocytes (Figure 4) and expression of Vegfa mRNA in Ly6Chi monocytes (Figure 5) led us hypothesize that infiltrating CCR2+ monocytes may promote angiogenesis. Ischemia caused a reduction of patent vessels at day 1. However, at day 8 we observed the presence of FITC+ vessels within the lesion core (Figure 6(a)), which contained CD68+ macrophages and was surrounded by a GFAP+ astroglial scar (Figure 6(b)). FITC+ vessels were CD31+ and were enveloped by a prominent basal lamina (pan-laminin+) and PDGFβR+ scaffold-like structures (Figure 6(c) and (d)). Measuring FITC+ vessel density in different regions of the brain of Ccr2fl/flLysMCre+ mice and Ccr2fl/flLysMCre– mice 8 days post-ischemia, we found reduced density of FITC+ patent vessels in the core region of mice with CCR2-deficient monocytes compared to the control genotype.
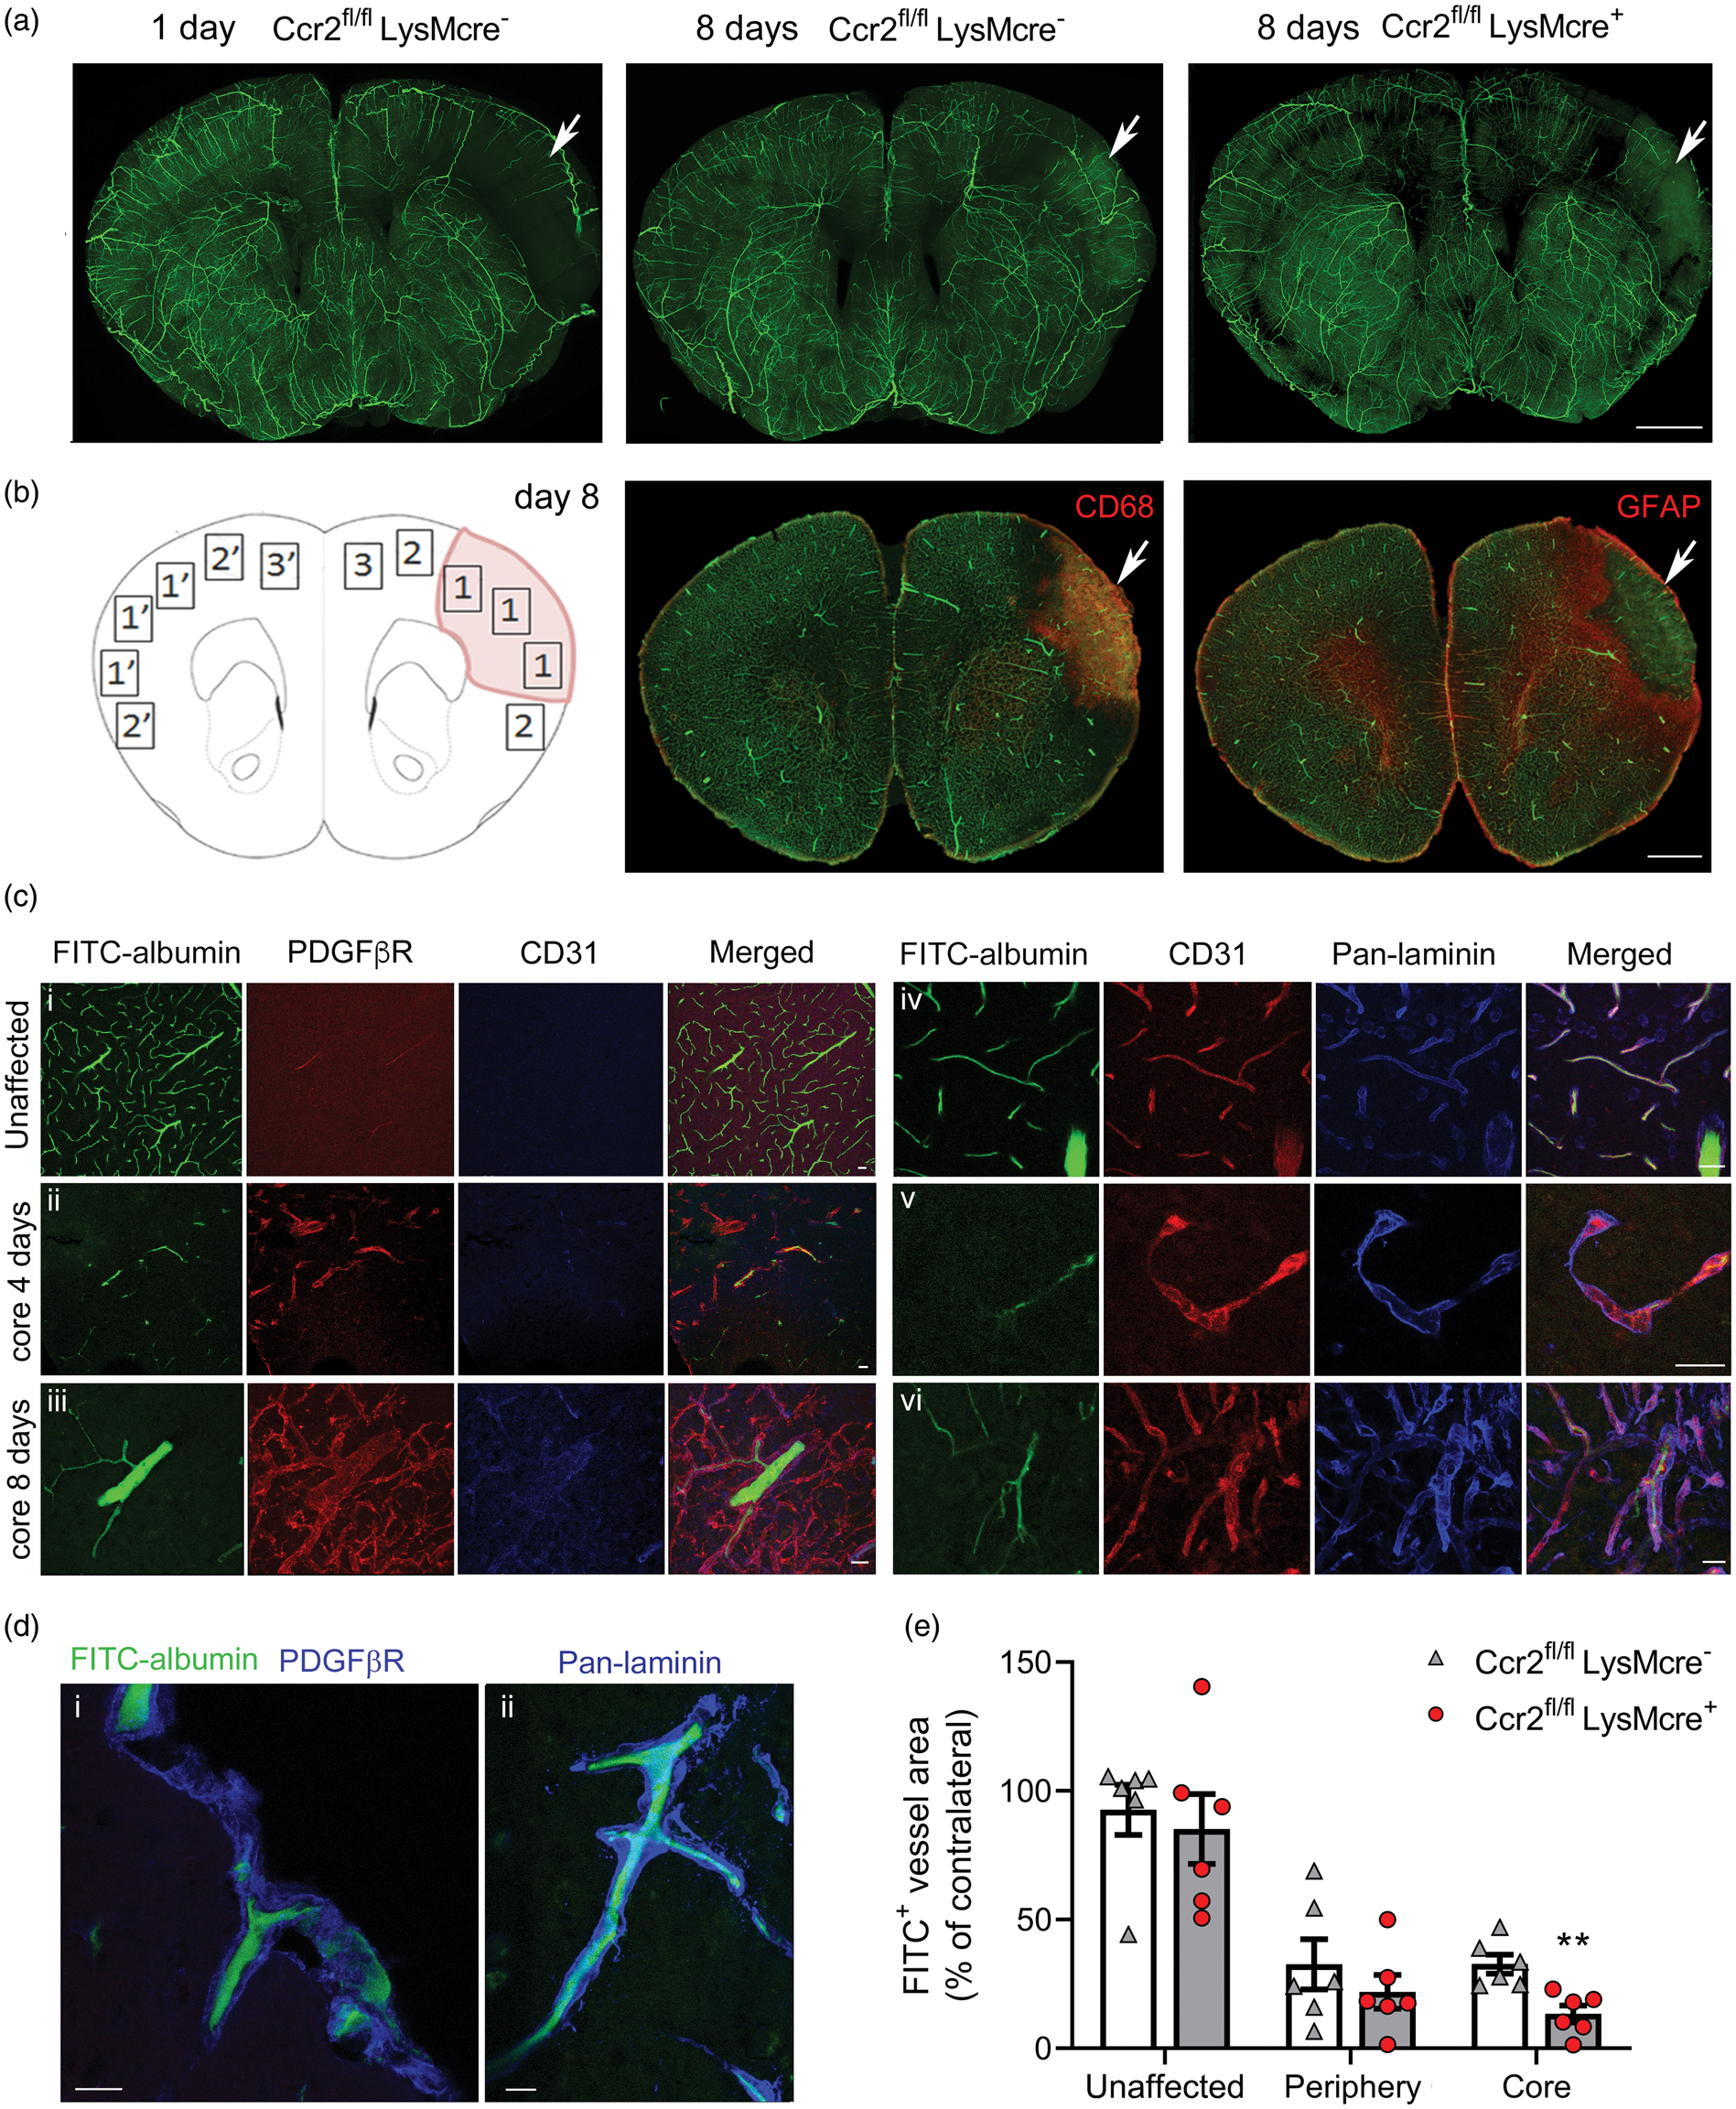
CCR2+ monocytes promote angiogenesis. Mice were perfused through the heart with FITC-albumin gel to visualize patent vessels (green) and the brain was studied by immunofluorescence. (a) Z-projection of a 3D-image of clarified brain sections. The effect of ischemia is observed (arrow) in the ipsilateral cortex showing a zone devoid of patent vessels at 24 h. Patent vessels are seen in the core of the lesion (arrows) eight days post-ischemia suggesting angiogenesis that is less apparent in Ccr2fl/fl LysMcre+ mice than corresponding Ccr2fl/fl LysMcre– mice of the control genotype. (b) Schematic drawing of the regions-of-interest (ROI) used for vessel quantification eight days post-ischemia: (1) Core; (2) Periphery; (3) Unaffected cortex in the ipsilateral hemisphere. ROIs 1′, 2′ and 3′ are mirror ROIs in the contralateral hemisphere. The core region was defined as the CD68+ zone containing macrophages. The periphery was defined as the GFAPhi area of astroglyosis limiting the core of infarction. The unaffected ROI was outside the GFAPhi zone. (c) Tissue sections were stained with PDGFβR (red), CD31 (blue) or pan-laminin (blue) to characterize the zone surrounding the vessels. (i) contralateral hemisphere; (ii) FITC+ patent vessel in the infarcted core four days post-ischemia; (iii) thick patent vessel in the core eight days post-ischemia; (iv) periphery region 8-days post-ischemia; (v) string vessel-like structure in the ischemic core four days post-ischemia; vi/thick basal laminae and vessel walls with some patent vessels in the core eight days post-ischemia. (d) Details of FITC+ patent vessels immunostained with PDGFβR or pan-laminin (blue) in the core region eight days post-ischemia. (i) Vessel penetrating the cortex from the brain surface; ii/vessel in the cortex. (e) We measured the density of fluorescent vessels in the different ROIs (% of FITC+ area per ROI) in brain sections of mice of both genotypes (n = 6 mice per group) eight days post-ischemia. Ccr2fl/fl LysMcre+ mice showed a significant reduction in the density of patent vessels within the core of infarction versus the control genotype (Two-way ANOVA with subject matching design followed by Sidak’s multiple comparisons test, **p = 0.008). Values of each ROI are expressed as % of corresponding contralateral ROIs. Scale bar: a, b = 1 mm; c, d = 20 µm.
Effects of administration of bone marrow monocytes in the outcome of ischemia
To find out whether bone marrow monocytes from CCR2+/+ mice could rescue the detrimental effects of monocyte CCR2-deficiency, we administered monocytes to Ccr2fl/flLysMCre+ mice 6 h post-ischemia (Figure 7(a)). Immature monocytes initially released from the bone marrow are predominantly Ly6ChiCCR2+ cells.8,48 We injected CCR2+/+ monocytes obtained from the bone marrow of reporter DsRed mice to visualize the cells in the brain 8 days later. We found DsRed+ cells in the ischemic brain tissue, where they displayed the typical morphology of macrophages and were mainly associated with the vascular basal lamina and PDGFβR+ cells forming scaffold-like structures (Figure 7(b)). We also found endogenous Ccr2–/– monocytes (eGFP+) of the recipient mice but, compared to injected DsRed cells, eGFP+ monocytes were smaller and their morphology resembled monocytes (Figure 7(b)). This difference could be attributable to delayed infiltration of CCR2–/– monocytes, which are unable to respond to the rapid release of CCL2 shortly after stroke onset.
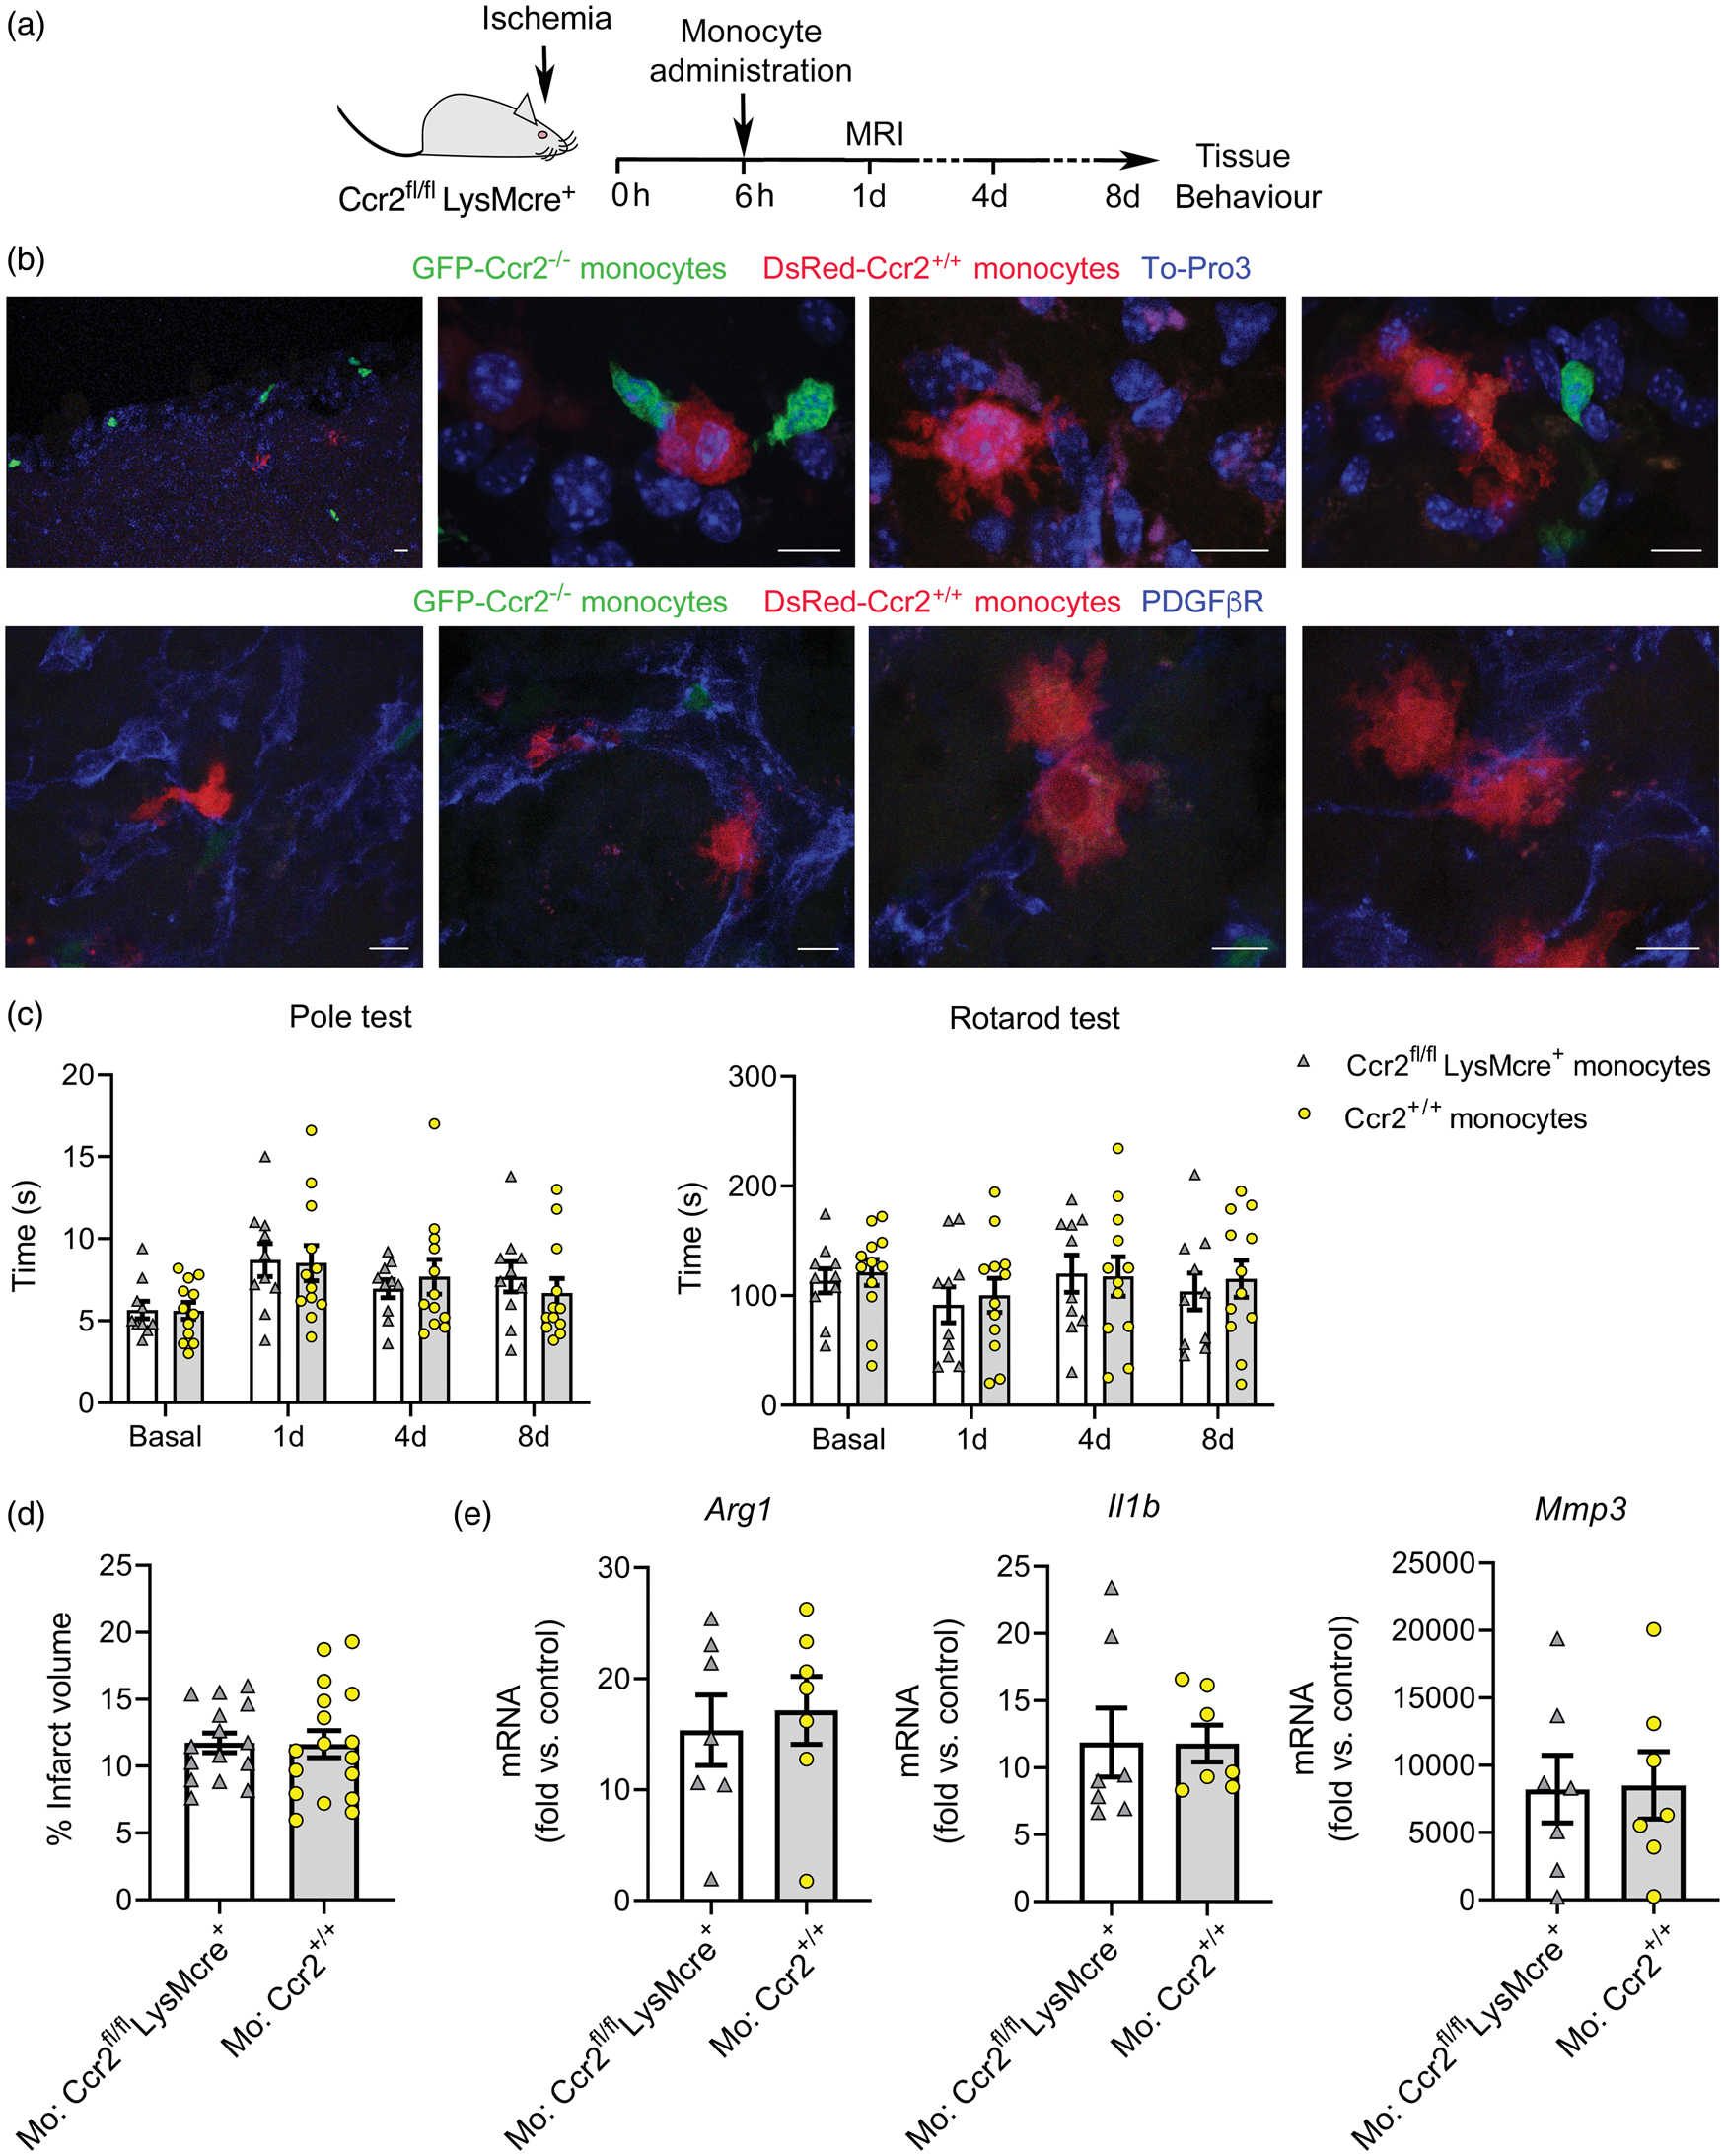
Administration of bone marrow monocytes is not beneficial. (a) Mice with CCR2-deficient monocytes (Ccr2fl/flLysMcre+) received i.v administration of bone marrow monocytes through the tail vein 6 h post-ischemia. (b) We administered CCR2+ monocytes obtained from reporter fluorescent DsRed mice for microscopic visualization. DsRed monocytes (red) are seen in the core of the lesion eight days post-ischemia (n = 5). The images also show endogenous eGFP+ monocytes (Ccr2gfp/gfp) (green) of the recipient CCR2fl/flLysMcre+ mice. Images in the first raw are stained with To-Pro3 (blue) to illustrate the cell nuclei. Images in the second raw are stained with PDGFβR (blue). DsRed monocytes interact with PDGFβR+ cells, which form scaffold-like structures. (c) Effect of CCR2+ monocyte administration on stroke outcome in CCR2fl/flLysMcre+ recipient mice. For treatment controls, we administered monocytes obtained from donor mice of the same genotype as the recipient mice. Behavioral tests conducted at 1d, 4d and 8d post-ischemia showed no differences in the Pole test or the Rotarod test in Ccr2fl/flLysMcre+ mice injected with either Ccr2+/+ (n = 17) or Ccr2–/– (n = 15) monocytes, as analyzed with two-way ANOVA by treatment and time with a subject-matching design. (d) Likewise, MRI infarct volume (%) 24 h post-ischemia showed no differences between treatment groups. (e) Gene expression eight days post-ischemia in the ipsilateral cortex of Ccr2fl/flLysMcre+ mice that received administration of either Ccr2fl/flLysMcre+ monocytes (n = 7) (treatment control) or Ccr2+/+ monocytes (n = 7) shows no differences between groups (Mann-Whitney test). Fold increases are calculated versus non-ischemic cortex of Ccr2fl/flLysMcre– mice. Scale bar: 10 µm.
We then studied whether administration of CCR2+/+ bone marrow monocytes to Ccr2fl/flLysMCre+ mice modified stroke outcome. For treatment control, Ccr2fl/flLysMCre+ mice received administration of bone marrow monocytes obtained from mice of the same genotype. We administered the cells 6 h after induction of ischemia, measured infarct volume at day 1, and conducted behavioral tests at days 1, 4 and 8 post-ischemia (Figure 7(a)). Neither performance in the Pole test and the Rotarod test (Figure 7(c)) nor infarct volume (Figure 7(d)) differed between treatment groups. Moreover, the treatment did not change gene expression in the ischemic tissue 8 days post-ischemia (Figure 7(e)). Overall, this treatment regimen with a single administration of bone marrow CCR2+/+ monocytes was unable to rescue the effects of monocyte CCR2-deficiency after ischemic stroke.
Discussion
This study shows that complex populations of CCR2+ leukocytes, including monocytes and lymphocytes, infiltrate the ischemic brain tissue. By selectively deleting CCR2 expression in monocytes using genetically modified mice we found that CCR2+ monocytes enhanced the expression of pro-inflammatory cytokines during the first day post-stroke. In spite of this effect, CCR2+ monocytes promoted resolution of inflammation and limited the functional impairment during 15 days post-ischemia. This latter finding is in agreement with previous studies showing detrimental effects of CCR2 blockade in ischemic stroke.23–26 Our study demonstrates that this effect is attributable to CCR2+ monocytes rather than to other populations of CCR2+ leukocytes that also infiltrate the ischemic brain tissue.
Inflammation is regarded as a detrimental response that exacerbates brain damage after stroke and a target for therapeutic intervention. 49 However, inflammation triggers subsequent processes involved in cell migration, proliferation, matrix deposition and tissue remodeling. 44 The experimental model of cortical ischemia used in this study induced a sharp peak of pro-inflammatory cytokine expression 1 day post-ischemia that decreased at day 4. CCR2+ monocytes infiltrating the ischemic lesion partly contributed to this effect but they also exerted long-term benefits. In line with this finding, systemic injection of low-dose lipopolysaccharide induces an Ly6Chi monocyte response that protects the brain after transient MCA occlusion in mice. 50 Furthermore, a recent study showed that remote ischemic limb conditioning causes a shift in circulating monocytes towards a proinflammatory Ly6ChiCCR2+ phenotype that attenuates brain infarct and enhances long-term functional recovery after ischemia/reperfusion in mice. 51 It is possible that a certain degree of acute inflammation in the injured brain tissue was necessary to initiate secondary processes involved in lesion resolution and repair. The effect of acute inflammation is different from chronic inflammation that delays healing. 52 Accordingly, several stroke co-morbidities chronically raise the inflammatory status and worsen stroke outcome. 53 The mice with CCR2-deficient monocytes showed an attenuated acute inflammatory response but a delayed increase in pro-inflammatory mediators that may impair tissue repair.
Damage resolution in different organs involves the action of macrophages.54,55 Ischemia causes a strong reduction of blood supply to the ipsilateral cortex and loss of patent vessels in the core of infarction. However, eight days later, we detected an increase in patent blood vessels in the infarcted core where macrophages were located. This effect was attenuated in mice with CCR2-deficient monocytes, suggesting the participation of these cells in angiogenesis. CCR2+ monocytes contributed to the tissue expression of genes involved in angiogenesis and repair. Mice with CCR2-deficient monocytes showed reduced ischemia-induced upregulation of Vegfa and its receptors, which play crucial functions in angiogenesis.43,44 Likewise, pericytes are critically involved in angiogenesis and exert repair functions. 56 For instance, pericytes promote differentiation of oligodendrocyte precursors favoring remyelination. 57 Macrophages signal to pericytes inducing the differentiation to collagen-producing myofibroblasts involved in tissue re-vascularization and wound healing. 45 Pericytes express low levels of α-SMA,58–60 and α-SMA induction in pericytes is taken as a marker of pericyte-myofibroblast transition.45,61 Ischemia reduced the mRNA expression of Pdgfbr and Pdgfb mRNA and increased the expression of Acta mRNA, and these effects were mediated, at least in part, by CCR2+ monocytes. Therefore, it is possible that brain CCR2+ monocytes favored pericyte differentiation to pro-angiogenic fibroblasts. Furthermore, infiltrating Ly6Chi monocytes, or some subset of these cells, may display proangiogenic features because they express Vegfa. Indeed, Ly6Chi cells sorted from the ischemic brain tissue showed expression of Il1b, Arg1, Chil3, Vegfa and Flt1 mRNA. It is possible that these various genes were expressed in different subgroups of CCR2+ monocytes. In agreement with this view, a subset of the CCR2+ monocytes expressing strong levels of VEGF-A was reported and was found to play a crucial role inducing vascular sprouts. 31 Also, previous studies showed that monocytes express VEGFR1 (Flt1) and expression of this receptor is upregulated during differentiation to macrophages. 46 Therefore, our results are compatible with the possibility that infiltrating CCR2+ monocytes contained different functional subsets of cells with some of them being involved in angiogenesis and tissue repair. Monocyte diversity may arise from phenotypic shifts induced by ischemia. 8 Moreover, stimuli that may improve stroke outcome, such as remote postischemic conditioning, shift monocyte phenotype towards CCR2+ subsets. 51
Several lines of evidence suggest that classical monocytes can be reprogrammed in situ at the lesion site. In a model of sterile hepatic injury, classical pro-inflammatory CCR2hiCX3CR1lowmonocytes phenotypically convert into non-classical or alternative CX3CR1hiCCR2low monocytes. 62 We also observed that the initial prevalence of infiltrating Ly6ChiCCR2+CX3CR1low/– monocytes in the acute phase of stroke shifted towards predominant Ly6Clo populations with different degrees of CCR2 and CX3CR1 expression at later phases. Furthermore, tissue macrophages, not microglia, expressed Arg1 and Chil3, which are markers of alternatively polarized macrophages involved in lesion resolution. 40 Despite evidence of pro-reparative functions in some subset of CCR2+ monocytes, administration of CCR2+/+ bone marrow monocytes to mice with CCR2-deficient monocytes did not restore the alterations found in the latter mice. Several limitations in our study may contribute to explain this result. First, the dose and dosing regimen deserve further investigation because treatment may be insufficient for functional restoration. Second, another limitation could be the source of monocytes. We obtained monocytes from the bone marrow, which contains mainly immature Ly6ChiCCR2+ monocytes.8,48 The observed phenotypic heterogeneity in the population of brain infiltrating CCR2+ monocytes may include minor subsets of cells with pro-repair capacity that are absent in bone marrow monocytes. Thus, immature bone-marrow monocytes may require some maturation process possibly acquired in the circulation or other organs acting as reservoirs of specific monocyte subsets with reparative capacity. The spleen is a monocyte reservoir that can rapidly deploy to inflammatory sites. 63 Accordingly, studies have shown beneficial effects of CCR2+ splenocytes in brain ischemia/reperfusion. 51 Spleen monocytes may acquire protective features not displayed by bone marrow monocytes.
In conclusion, this study shows that a complex population of CCR2+ leukocytes infiltrates the ischemic brain tissue, including myeloid and lymphoid cells. Selective deletion of CCR2 in monocytes reduces ischemia-induced acute brain inflammation but causes a delayed inflammatory response, reduces angiogenesis and impairs the neurological function. We identified pro-inflammatory and pro-angiogenic traits in CCR2+ monocytes infiltrating the ischemic brain tissue suggesting that these cells comprise heterogeneous subsets of cells with diverse phenotypes and functions. Unraveling the phenotypic heterogeneity within the CCR2+ monocyte population infiltrating the ischemic brain tissue can open new avenues to design monocyte-based therapies for functional recovery after ischemic stroke.
Supplemental Material
JCB909055 Supplemental Material - Supplemental material for CCR2 deficiency in monocytes impairs angiogenesis and functional recovery after ischemic stroke in mice
Supplemental material, JCB909055 Supplemental Material for CCR2 deficiency in monocytes impairs angiogenesis and functional recovery after ischemic stroke in mice by Jordi Pedragosa, Francesc Miró-Mur, Amaia Otxoa-de-Amezaga, Carles Justicia, Francisca Ruíz-Jaén, Peter Ponsaerts, Manolis Pasparakis and Anna M Planas in Journal of Cerebral Blood Flow & Metabolism
Footnotes
Acknowledgements
We thank Clara Castellví and Marina Purroy, IDIBAPS Cytomics and Image platforms, and Microscopy Unit-Campus Clínic of Serveis Cientifico-Tècnics of the University of Barcelona for technical support.
Authors’ contributions
JP performed most of the experiments. FMM designed, contributed, and analyzed the flow cytometry and cell sorting studies. AOdA contributed to the RNA studies. CJ set histological techniques for vessel patency and brain clarification studies. FRJ contributed to experiments with the genetically modified mice. PP provided insight for discussion and data interpretation. MP provided input for generation of mice and studies in mice with CCR2-deficient monocytes. AMP designed the study, supervised the experimental work, data, and analysis, and drafted the article. All the authors revised and approved the article.
Data accessibility
Data will be made available upon reasonable request to the corresponding author.
Funding
The author(s) disclosed receipt of the following financial support for the research, authorship and/or publication of this article: Supported by Spanish Ministerio de Economía y Competitividad (SAF2017-87459-R) co-funded by Fondo Europeo de Desarrollo Regional (FEDER), and AGAUR, Generalitat de Catalunya (2017-SGR-645). JP had an AGAUR predoctoral fellowship. FMM was supported by Pla Estratègic de Recerca i Innovació en Salut (PERIS) program of the Health Department of Generalitat de Catalunya. AOdA had a predoctoral fellowship of MINECO-FPI program (BES-2015-074419). FRJ was supported by Redes Temáticas de Investigación Colaborativa Sanitaria (RETICS-INVICTUS PLUS RD16/0019/0014) of Instituto de Salud Carlos III co-funded by FEDER. Work performed in part at Centre de Recerca Biomèdica Cellex, Barcelona. Centres de Recerca de Catalunya (CERCA) Program of Generalitat de Catalunya supports Institut d’Investigacions Biomèdiques August Pi i Sunyer.
Declaration of conflicting interests
The author(s) declared no potential conflicts of interest with respect to the research, authorship, and/or publication of this article.
Supplemental material
Supplemental material for this article is available online.
References
Supplementary Material
Please find the following supplemental material available below.
For Open Access articles published under a Creative Commons License, all supplemental material carries the same license as the article it is associated with.
For non-Open Access articles published, all supplemental material carries a non-exclusive license, and permission requests for re-use of supplemental material or any part of supplemental material shall be sent directly to the copyright owner as specified in the copyright notice associated with the article.