
Abstract
The mechanisms underlying blood—brain barrier (BBB) dysfunction seen in human immunodeficiency virus 1 (HIV-1) infection are poorly understood; however, they are believed to be caused by interactions of human brain microvascular endothelial cells (HBMEC) with virus-infected macrophages. Using a transwell system and Affymetrix arrays, we investigated HIV-1-induced genomic changes in HBMEC after coculture with HIV-1-infected or -uninfected monocyte-derived macrophages (MDM). Differentially expressed genes were determined by linear modeling and then were grouped by hierarchical clustering. Compared to HBMEC cocultured with noninfected MDM, 184 probe sets corresponding to 84 genes were differentially expressed in HBMEC cocultured with HIV-infected MDM. Genes activated in HIV-1 MDM-exposed HBMEC included proinflammatory cytokines and chemokines, tumor necrosis factor-α-induced proteins, interferon (IFN)-inducible genes, intercellular adhesion molecule-1, transcription factors of the nuclear factor-κB family, and signal transducer and activator of transcription 1. Analysis of molecular networks and canonical pathways associated with differentially expressed genes suggest that HIV-1 causes BBB impairment by mechanisms involving inflammation, cytokine, and IFN signaling in HBMEC.
Introduction
Brain microvascular endothelial cells are a major component of the blood—brain barrier (BBB) and are connected by tight junctions limiting paracellular flux and restricting permeability (Hawkins and Davis, 2005). Under normal physiologic conditions, the BBB functions as an interface between the blood and the brain parenchyma, strictly regulating influx of ions, molecules, and leukocytes into the central nervous system (CNS). During progressive human immunodeficiency virus 1 (HIV-1) infection, BBB function is compromised. Human immunodeficiency virus 1 invades the brain in the early stages of infection and causes various clinical and pathologic abnormalities, ranging from subclinical and mild cognitive motor impairment to overt dementia. Despite the beneficial effects of antiretroviral therapy, 76 to 83% of AIDS autopsy cases show brain involvement (Masliah et al, 2000).
Blood—brain barrier dysfunction seen in HIV-1-infected individuals is implicated in the pathogenesis of HIV-1-associated dementia (Burger et al, 1997; Dallasta et al, 1999). A number of laboratory and animal models, as well as human studies show BBB breakdown as a consequence of chronic viral infection and immune compromise (Burger et al, 1997; Dallasta et al, 1999; Kanmogne et al, 2005, 2007; Persidsky et al, 2000). Blood—brain barrier injury facilitates penetration of virus and infiltration of activated, HIV-1-infected monocytes into the brain. This leads to accumulation of monocyte-derived macrophages (MDM) in the CNS and spread of virus to resident glia, including microglia and astrocytes. The mechanisms mediating BBB dysfunction in HIV infection remain poorly understood. This study used the Affymetrix GeneChip® (Santa Clara, CA, USA) system with Human Genome U133A 2.0 arrays to investigate genomic changes in human brain microvascular endothelial cells (HBMEC) caused by interaction with HIV-1-infected MDM. We further used Ingenuity Pathway Analysis (Redwood City, CA, USA) to investigate the molecular networks, functions, and canonical pathways activated as a consequence of HBMEC's interaction with HIV-infected macrophages.
Materials and methods
Endothelial Cell Culture
Primary HBMECs were isolated from the temporal cortex of brain tissue obtained during surgical removal of epileptogenic cerebral cortex in adult patients, as described previously (Kanmogne et al, 2007) and provided by Drs Marlys Witte and Michael Bernas (University of Arizona, Tucson, AZ). Routine evaluation for von Willebrand factor, Ulex europaeus lectin, and CD31 showed that cells were >99% pure. Freshly isolated HBMECs were seeded in the upper chamber of collagen I-coated six-well tissue culture inserts (with 0.4 μm pore size) and cultured to confluence in EGM™-2 BulletKit® media (Cambrex, Walkersville, MD, USA) supplemented with 5% fetal bovine serum. Cells at passages 1 to 4 were used in this study.
Monocyte Isolation, Macrophage Culture, and Human Immunodeficiency Virus 1 Infection
Monocytes were obtained from HIV-1, HIV-2, and hepatitis B seronegative donor leukopacks, and separated by countercurrent centrifugal elutriation, as previously described (Kanmogne et al, 2007). These cells are generally identified as >98% pure monocytes by Wright staining and CD68 immunostaining (1:50 dilution; Dako, Carpentaria, CA, USA). Freshly elutriated monocytes were differentiated into MDM by culturing for 7 days in Dulbecco's modified Eagle's media (DMEM) containing 1 U/mL recombinant human macrophage colony-stimulating factor (a generous gift from Wyeth Inc., Cambridge, MA, USA), 10% heat-inactivated human serum, 2 mmol/L
Endothelial—Macrophage Coculture, RNA Isolation, and Quality Control
Human brain microvascular endothelial cells in transwell inserts (0.4-μm pore size) were cocultured for 12 h with HIV-1ADA-infected MDM (three replicates). For coculture, endothelial cell media (EGM-2 BulletKit media with 5% fetal bovine serum) was used for both cell types. Controls consisted of HBMEC cocultured for 12 h with noninfected MDM or untreated HBMEC (in triplicates). After coculture, total RNA was extracted from HBMEC using RNAeasy minikit and column (Qiagen, Valencia, CA, USA) with DNase treatment, according to the manufacturer's instructions. RNA yield and quality were checked using a NanoDrop spectrophotometer, and for all samples, absorbance ratio of 260/280 was >2. The purity and quality of extracted RNA were further assessed using the RNA 6000 Nano LabChip® Kit and Agilent 2100 Bioanalyzer (Agilent Technologies, Palo Alto, CA, USA) according to the manufacturer's instructions.
Microarray Data Generation
Microarray analysis of samples was performed using the Human 133 Plus 2.0 GeneChip arrays (Affymetrix). Briefly, 3 μg total RNA was reverse transcribed using the Affymetrix labeling kit and protocol as per the manufacturer's instructions. Probes were then hybridized to the Affymetrix Human 133 Plus 2.0 GeneChip arrays, which has more than 54,000 probe sets and profiles the expression of more than 47,000 unique transcripts. After washing and staining, the chips were scanned using the Affymetrix GeneChip 3000 scanner in the University of Nebraska Medical Center microarray core facility. Images were analyzed using the Affymetrix GeneChip Operating Software and quality metric parameters including noise level, background, and efficiency of reverse transcription ascertained for all hybridizations. Data sets passing the stringent quality recommendations were further analyzed to identify differentially expressed genes. With the false discovery rate (FDR) being controlled at a 0.05 level, only genes differentially expressed in all three replicates by at least twofold were considered.
Linear Modeling, Hierarchical Clustering, and Statistical Analysis of Microarray Data
Differentially expressed genes were determined by linear modeling (Smyth, 2004) and then were grouped by hierarchical clustering (Eisen et al, 1998). Briefly, cell intensity data (.cel file) from Affymetrix GeneChip Operating Software were preprocessed with Robust Multi-array Analysis (Irizarry et al, 2003), which is implemented in a Bioconductor package of R programming environment (http://www.bioconductor.org). Procession of probe-level data of the Affymetrix oligo arrays was performed in three steps: background correction, normalization, and probe-level summarization at the log 2 scale. To correct background, we used the procedure of GC content background correction (Wu et al, 2004). The approach of quantile normalization was then applied to the background-corrected data to control for systematic variations in hybridizations. Intensity values from all arrays were combined and summarized by Robust Multi-array Analysis to extract probe set-level data. Data quality was assessed using the affy Bioconductor package (http://www.bioconductor.org) (Gentleman et al, 2004), and genes differentially expressed between different groups were identified using the ‘Linear Model for Microarray Data’ with FDR being controlled at 0.05 (Smyth, 2004). After identification of differentially expressed genes, hierarchical clustering was performed to group together genes with similar expression patterns (Eisen et al, 1998).
Real-Time PCR
For each sample, cDNA was generated from 1 μg RNA using random hexamers and Molomey murine leukemia virus (MMLV) reverse transcriptase (Invitrogen). Reverse transcription was performed for 1 h at 42°C and the cDNA obtained used for real-time quantitative PCR, using an ABI PRISM 7000 sequence detector (Applied Biosystems, Foster City, CA, USA). A TaqMan gene detection system was employed and quantification was performed using the standard curve method as described in user bulletin #2 supplied with ABI PRISM 7000 sequence detector. All PCR reagents and primers were obtained from Applied Biosystems and primer IDs were as follows: interleukin (IL)-8, Hs00174103_m1; IL-6, Hs00174131_m1; chemokine (C—C motif) ligand (CCL)20, Hs00171125_m1; chemokine (C—X—C motif) ligand (CXCL)3, Hs00171061_m1; CCL2, Hs00234140_m1; IRF7 (interferon regulatory factor 7), Hs_00242190_g1; IFIH1 (interferon induced with helicase C domain 1), Hs00223420_m1; ISGF3G (interferon-stimulated transcription factor 3, gamma 48 kDa), Hs00196051_m1; interferon-induced protein (IFI)44, Hs00197427_m1; tumor necrosis factor-α-induced proteins (TNFAIP)2, Hs00196800_m1; TNFAIP6, Hs00200180_m1; Rel, Hs00231279_m1. For endogenous control, each gene expression was normalized to glyceraldehyde-3-phosphate dehydrogenase (Hs99999905_m1).
Ingenuity Pathway Analysis
Differentially regulated genes identified in HBMEC cocultured with HIV-1-infected MDM compared to HBMEC cocultured with noninfected MDM were analyzed using the Ingenuity Pathways Analysis 3.0 (IPA) (Ingenuity Systems). Ingenuity Pathways Analysis is a web-based software application containing most literature knowledge of biologic interactions between gene products. When using the IPA software, the networks obtained described functional relationships between gene products based on known interactions in the literature. The IPA tool then associates these networks with known biologic functions and canonical pathways. At FDR 0.05, only genes upregulated or downregulated by at least twofold were considered. A data set containing gene identifiers and corresponding fold changes were uploaded into the Ingenuity application. Canonical pathway analysis identified the pathways from the IPA library of canonical pathways that were most significant to the data set.
Protein Extraction and Western Blot Analysis
After coculture, HBMECs were lysed in a mammalian total protein extraction reagent (M-PER®, Pierce, Rockford, IL, USA) containing 1 × Protease Inhibitor Cocktail (Sigma). Lysates were kept on ice for 20 mins and centrifuged 30 mins at 9,000g to remove insoluble materials. Total protein concentration in the resulting supernatant was measured using the bicinchoninic acid assay (Pierce). Twenty-five micrograms of protein was fractionated in a 4 to 15% gradient gel and electrophoretically transferred to nitrocellulose membranes. Membranes were blocked for 1 h with SuperBlock® T-20 (Pierce), blotted 2 h or overnight with a CXC chemokine receptor 2 (CXCR2) antibody (R&D Systems, Minneapolis, MN, USA), blotted 1 h with a horseradish peroxidase-conjugated secondary antibody, washed, and visualized using SuperSignal® West Pico Substrate (Pierce). For actin Western blot control, membranes were stripped using Restore™ Western Blot Stripping Buffer (Pierce) and re-blotted with β-actin antibody.
Exposure of Endothelial Cells to Human Immunodeficiency Virus 1 and Interleukin-8 Detection
Human brain microvascular endothelial cells were exposed to purified HIV-1ADA (MOI 0.01) for 5 mins to 24 h, and IL-8 levels in culture supernatant quantified using the Human IL-8 ELISA kit (eBioscience, San Diego, CA, USA) according to the manufacturer's instructions. Four replicate samples were used for each experimental condition. Controls consisted of untreated HBMECs, cells exposed to conditioned media from noninfected MDM, and HIV-1ADA at MOI 0.01.
Monocyte Migration in Blood—Brain Barrier Models
For monocyte migration, 2 × 10⁴ HBMECs were seeded on collagen-coated FluoroBlok-tinted tissue culture inserts (with 3-μm pore size) from BD Biosciences (Franklin Lakes, NJ, USA). As monolayers are not visible on these inserts, manual readings of transendothelial electric resistance were taken with a voltmeter (EVOM, World Precision Instruments, Sarasota, FL, USA) to confirm monolayer formation and confluence. Freshly elutriated monocytes were labeled with calcein-AM (Invitrogen) at 5 μmol/L/1 × 106 cells for 45 mins and washed; for migration, 2.5 × 10⁵ labeled monocytes were placed on HBMECs (upper chamber of the FluoroBlok insert) and allowed to migrate for 2 h (37°C, 5% CO2). Migrated monocytes were then quantified using a fluorescence plate reader (absorbance 494 nm; emission 517 nm), with a standard curve derived from a serial dilution of a known number of calcein-labeled cells. Additional migration experiments were performed using the superoxide dismutase 2 (SOD2) inhibitor methoxyestradiol (Sigma), the signal transducer and activator of transcription (STAT) inhibitor AG490, and the nuclear factor-κB (NF-κB) inhibitor SN50 (EMD Chemicals Inc., San Diego, CA, USA). For these experiments, endothelial cells were exposed for 30 mins to 50 nmol/L AG490, 18 μmol/L SN50, or 10 nmol/L methoxyestradiol before migration.
Statistical Analysis
Statistical analysis was performed by one- or two-way analysis of variance and the general linear models procedure using the SAS program, followed by Tukey's multiple comparison test. Threshold significance level was 0.05.
Results
Assessment of Microarray Data Quality
To examine the full spectrum of HIV-1-induced effects on the HBMEC genome, we used an Affymetrix system with Human 133 Plus 2.0 GeneChip arrays. These arrays are the most comprehensive whole-human genome expression array currently available. After generating microarray data, we validated data quality among all replicate samples at the probe level. All arrays were consistent regarding the probe intensity and showed a similar level of distribution between replicates. We further evaluated data quality at the probe-set level by conducting a Robust Multi-array Analysis with quantile normalization (Irizarry et al, 2003). Figure 1 shows the M versus A (MvA) plot for all samples. Data quality, probe intensity, and probe-set signals were consistent across arrays and across replicate samples.
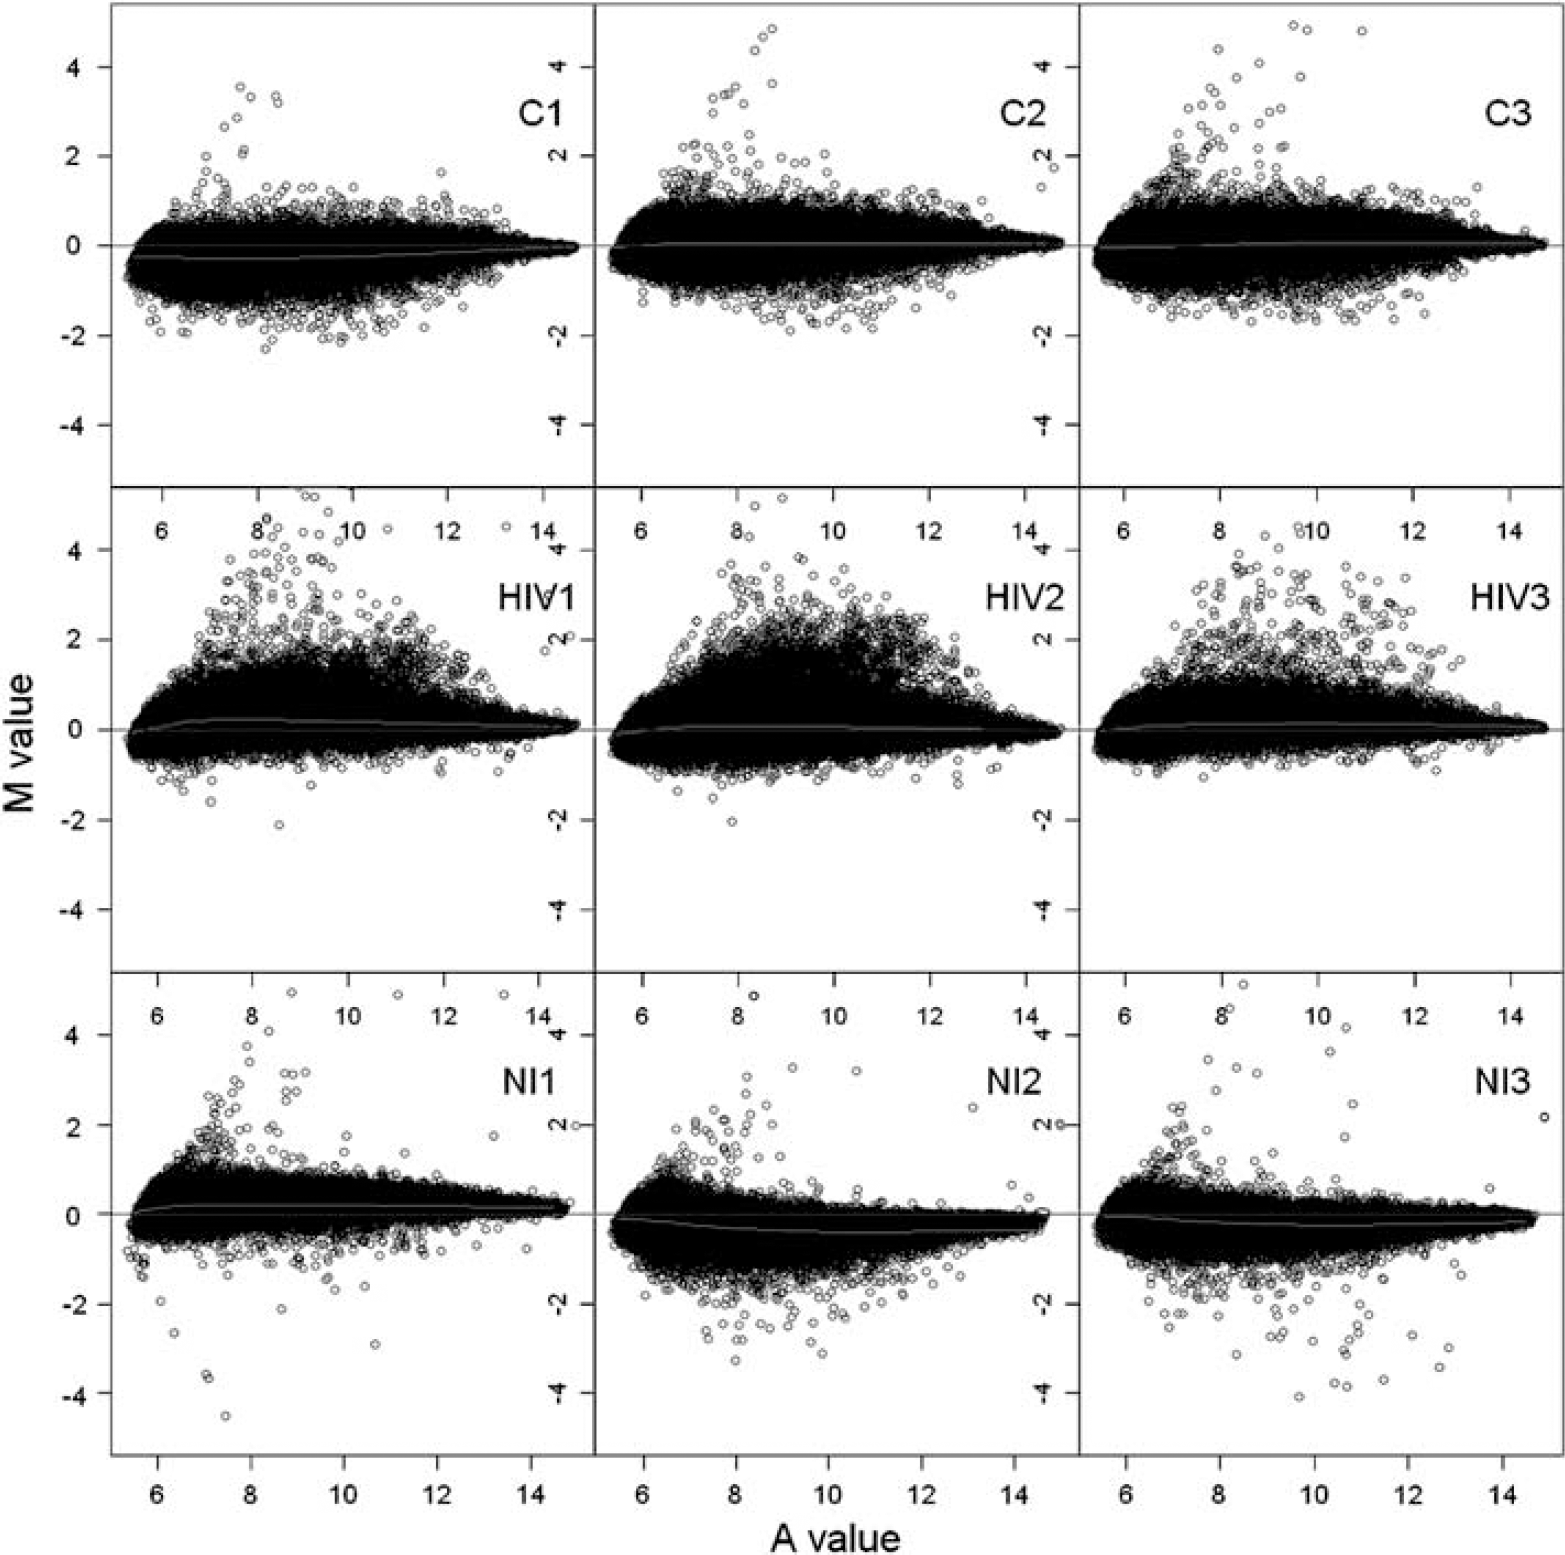
Assessment of microarray data quality. MvA plots of the probe-set signal estimates after Robust Multi-array Analysis model fit (GC Robust Multi-array Average background correction plus quantile normalization). None of the samples reveals any special pattern; data quality, probe intensity, and probe set signals were consistent across arrays and across replicate samples. Y axis (M value)=log 2 intensity for array 2−log 2 intensity for array 1; X axis (A value)=(log 2 intensity for array 2+log 2 intensity for array 1)/2. Red lines are drawn after the Loess fitting of M values and blue lines correspond to the zero level of M values. Triplicate samples are as follows: C1, C2, and C3 are controls (untreated HBMEC), HIV-1, HIV-2, and HIV-3 are HBMECs cocultured with HIV-infected MDM; NI1, NI2, and NI3 are HBMEC cocultured with noninfected MDM.
Microarray Analysis of HBMEC Exposed to Human Immunodeficiency Virus 1-Infected Monocyte-Derived Macrophages
Using a stringent data filter as described in the Materials and methods section with a twofold cut-off, 0.05 FDR, and linear modeling, we identified 1,071 probe sets differentially expressed in HBMEC cocultured with HIV-1-infected MDM compared to untreated HBMEC; 184 probe sets were differentially expressed in HBMEC cocultured with HIV-1-infected MDM compared to endothelial cells cocultured with noninfected MDM (Figure 2). These 184 differentially expressed probe sets corresponded to 84 differentially expressed genes, of which 64 had a direct or an indirect relationship with each other and were relevant to the pathogenesis of HIV-1-induced endothelial cell dysfunction (Table 1 and Figure 3). Of these 64 genes, 60 were upregulated and four showed decreased expression. The four downregulated genes were β-arrestin 1, hydroxyprostaglandin dehydrogenase 15-(NAD) (HPGD), kinase insert domain receptor (a type III receptor tyrosine kinase), and the transporter solute carrier family 26, member 4. Compared to HBMEC cocultured with noninfected MDM, endothelial cells cocultured with HIV-1-infected MDM showed a 2- to 2.4-fold downregulation of β-arrestin 1, HPGD, kinase insert domain receptor, and solute carrier family 26, member 4 transporter (P<0.0002) (Table 1).
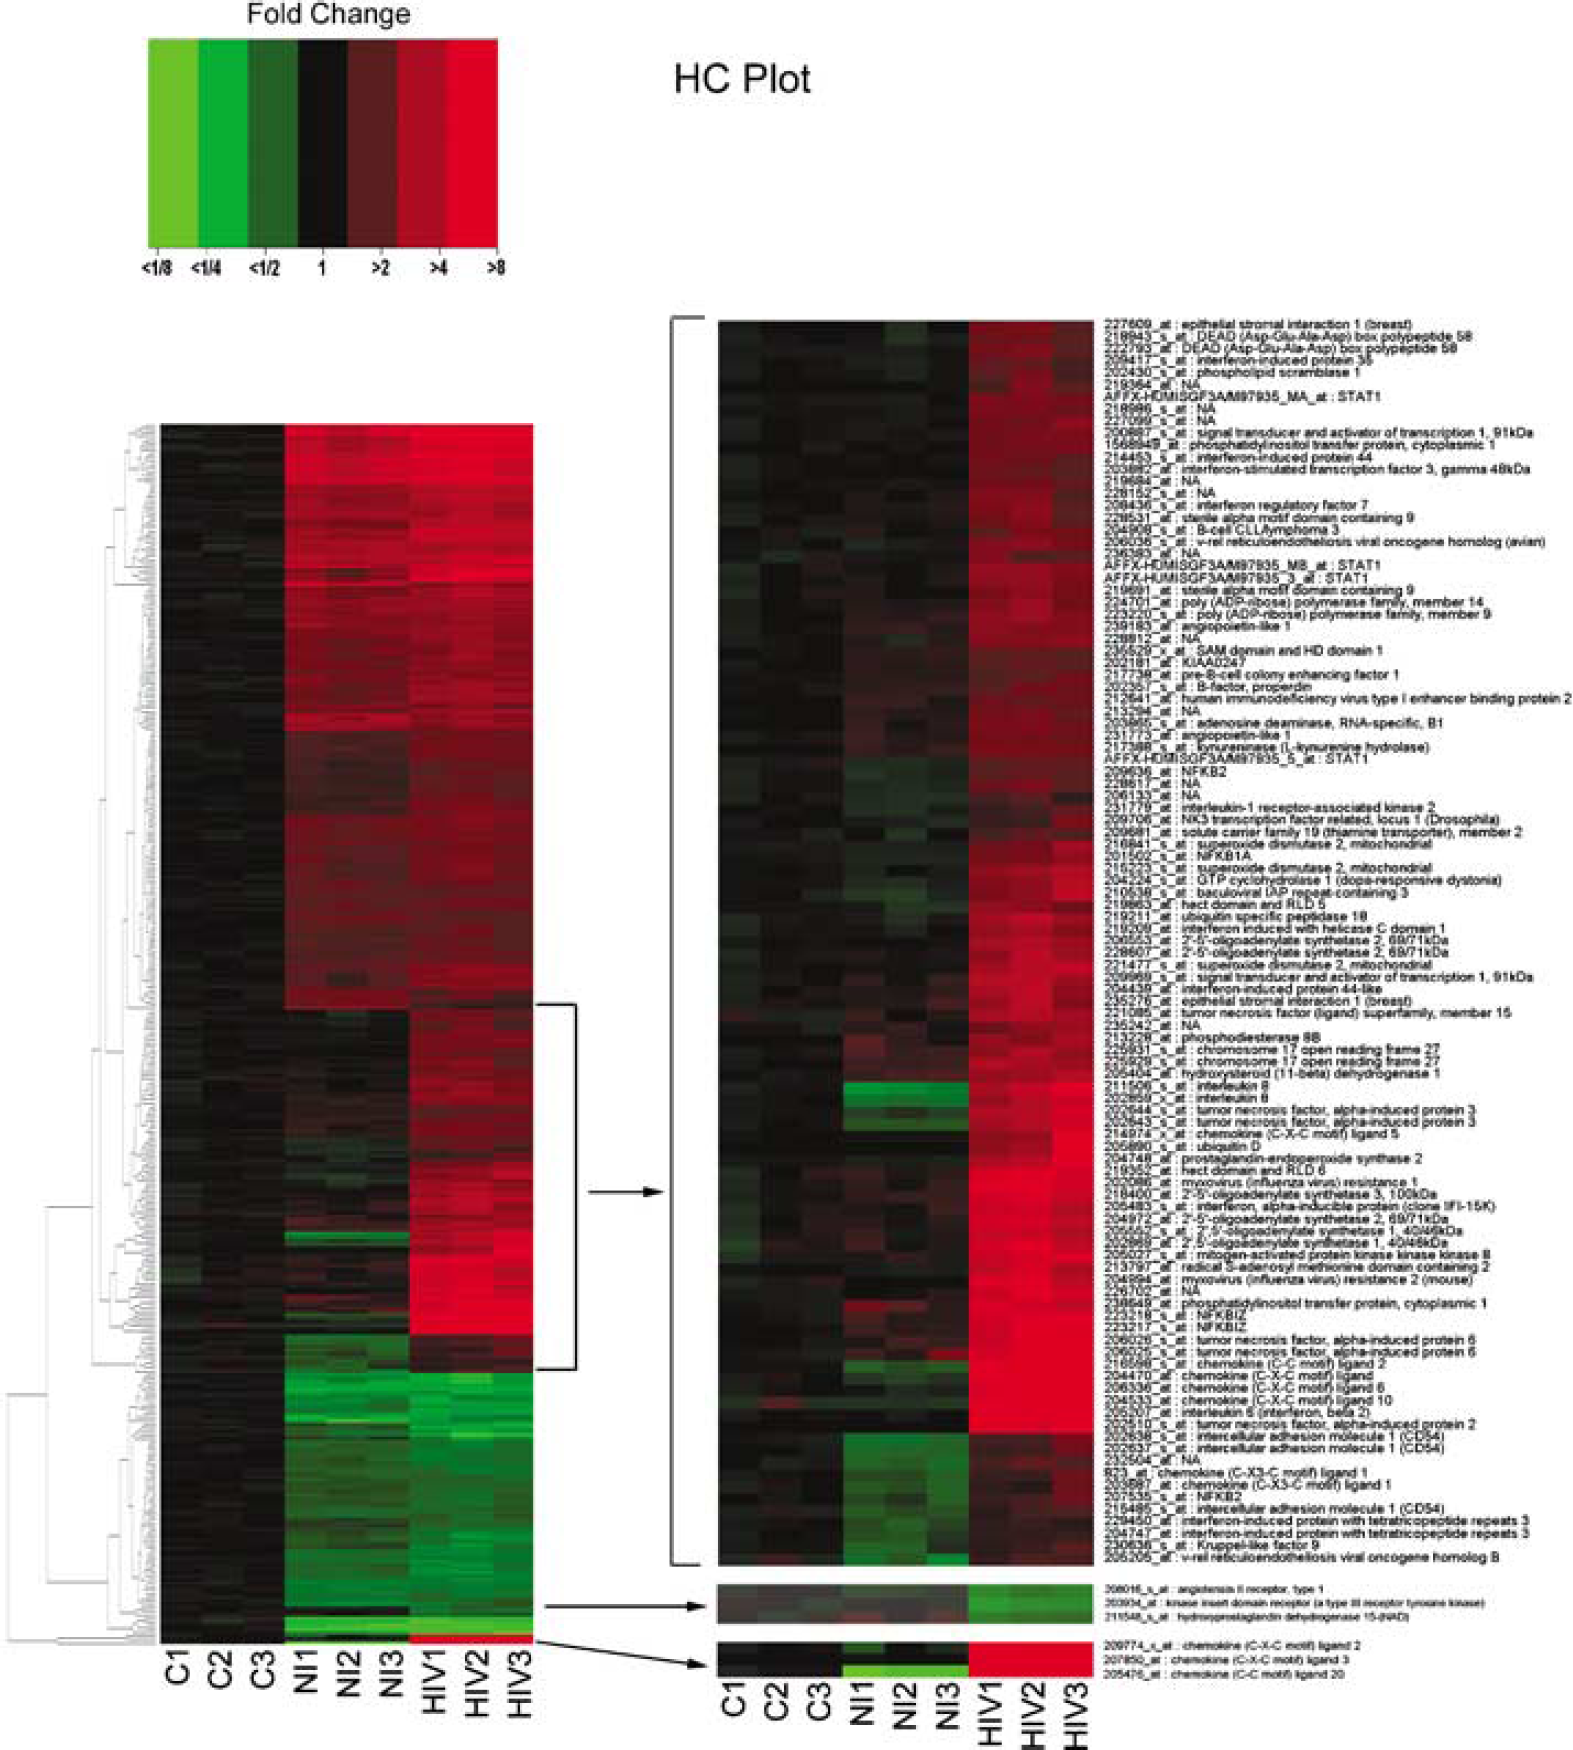
Hierarchical clustering of genes differentially expressed in HBMEC cocultured with HIV-infected MDM (HIV-1, HIV-2, HIV-3) as compared to HBMEC cocultured with noninfected MDM (NI1, NI2, NI3) and control-untreated HBMEC (C1, C2, C3). Cluster images show the expression profiles of transcripts with at least twofold changes relative to untreated HBMEC, with multiple tests being controlled at a 0.05 FDR. Differential expression analysis was performed using the linear model for microarray data (Smyth, 2004) and hierarchical analysis performed as described by Eisen et al (1998). Expression levels are represented on a continuum from green (low abundance) to red (high abundance).
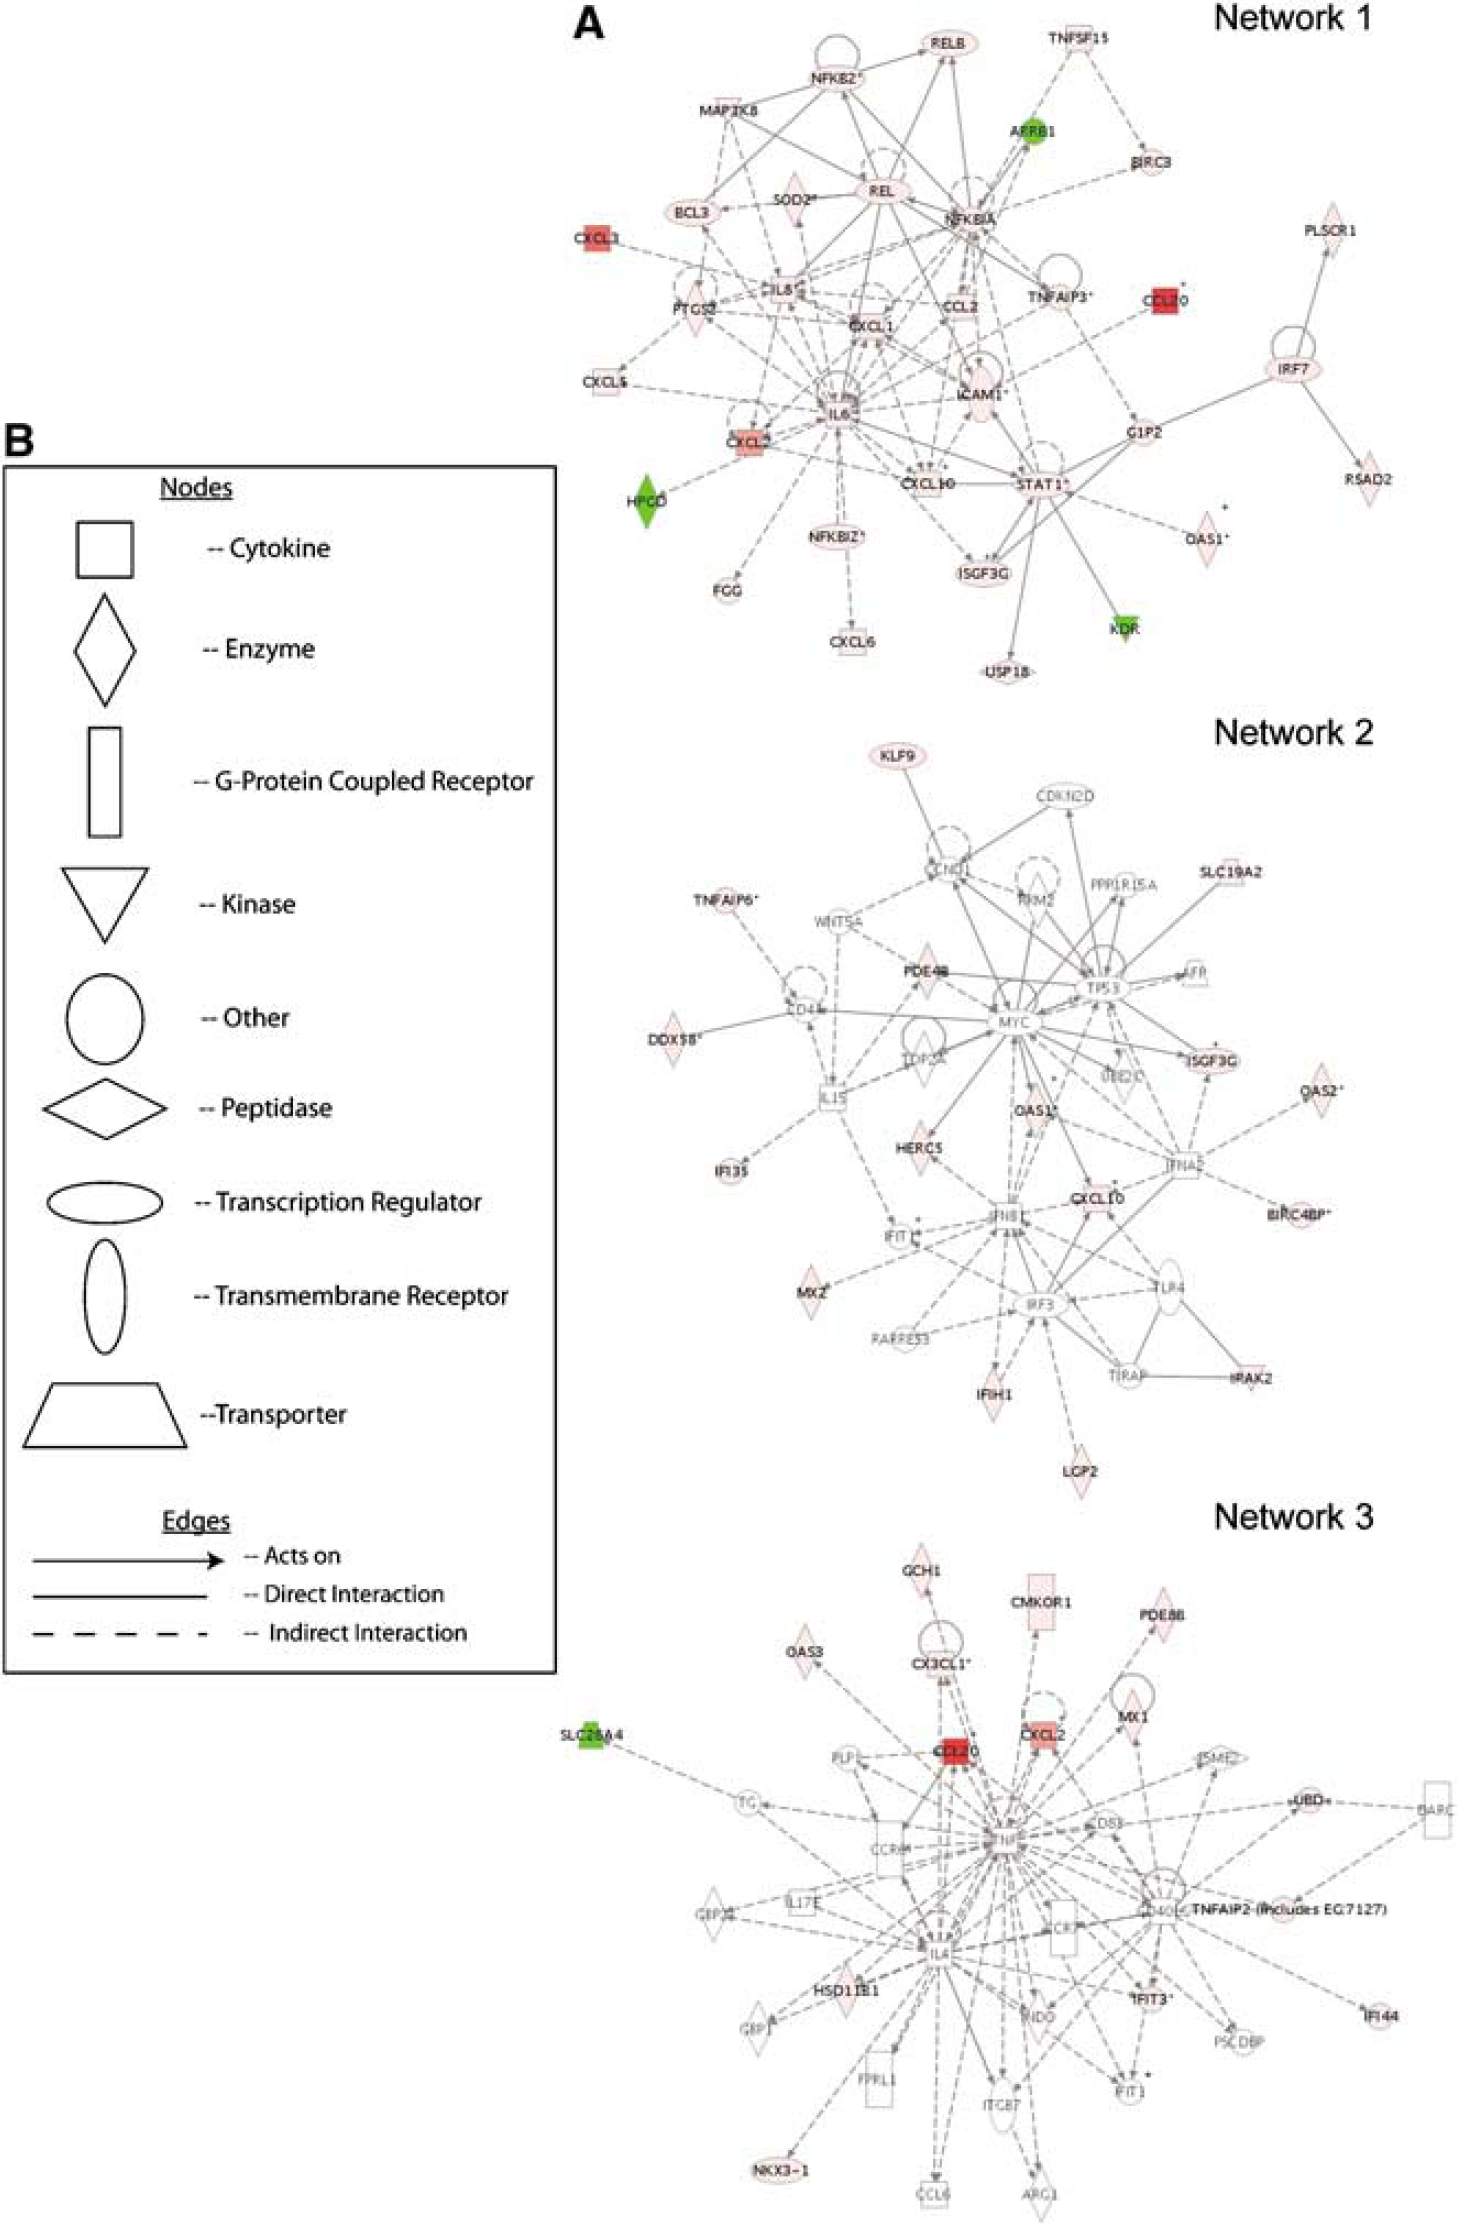
Immune response, regulatory networks, and pathways mediated by HIV-1 in HBMEC. Ingenuity Pathways Analysis revealed three major networks of genes differentially expressed in HBMEC cocultured with HIV-infected MDM as compared to HBMEC cocultured with noninfected MDM (
Functional classes of differentially expressed genes in HIV-exposed HBMEC
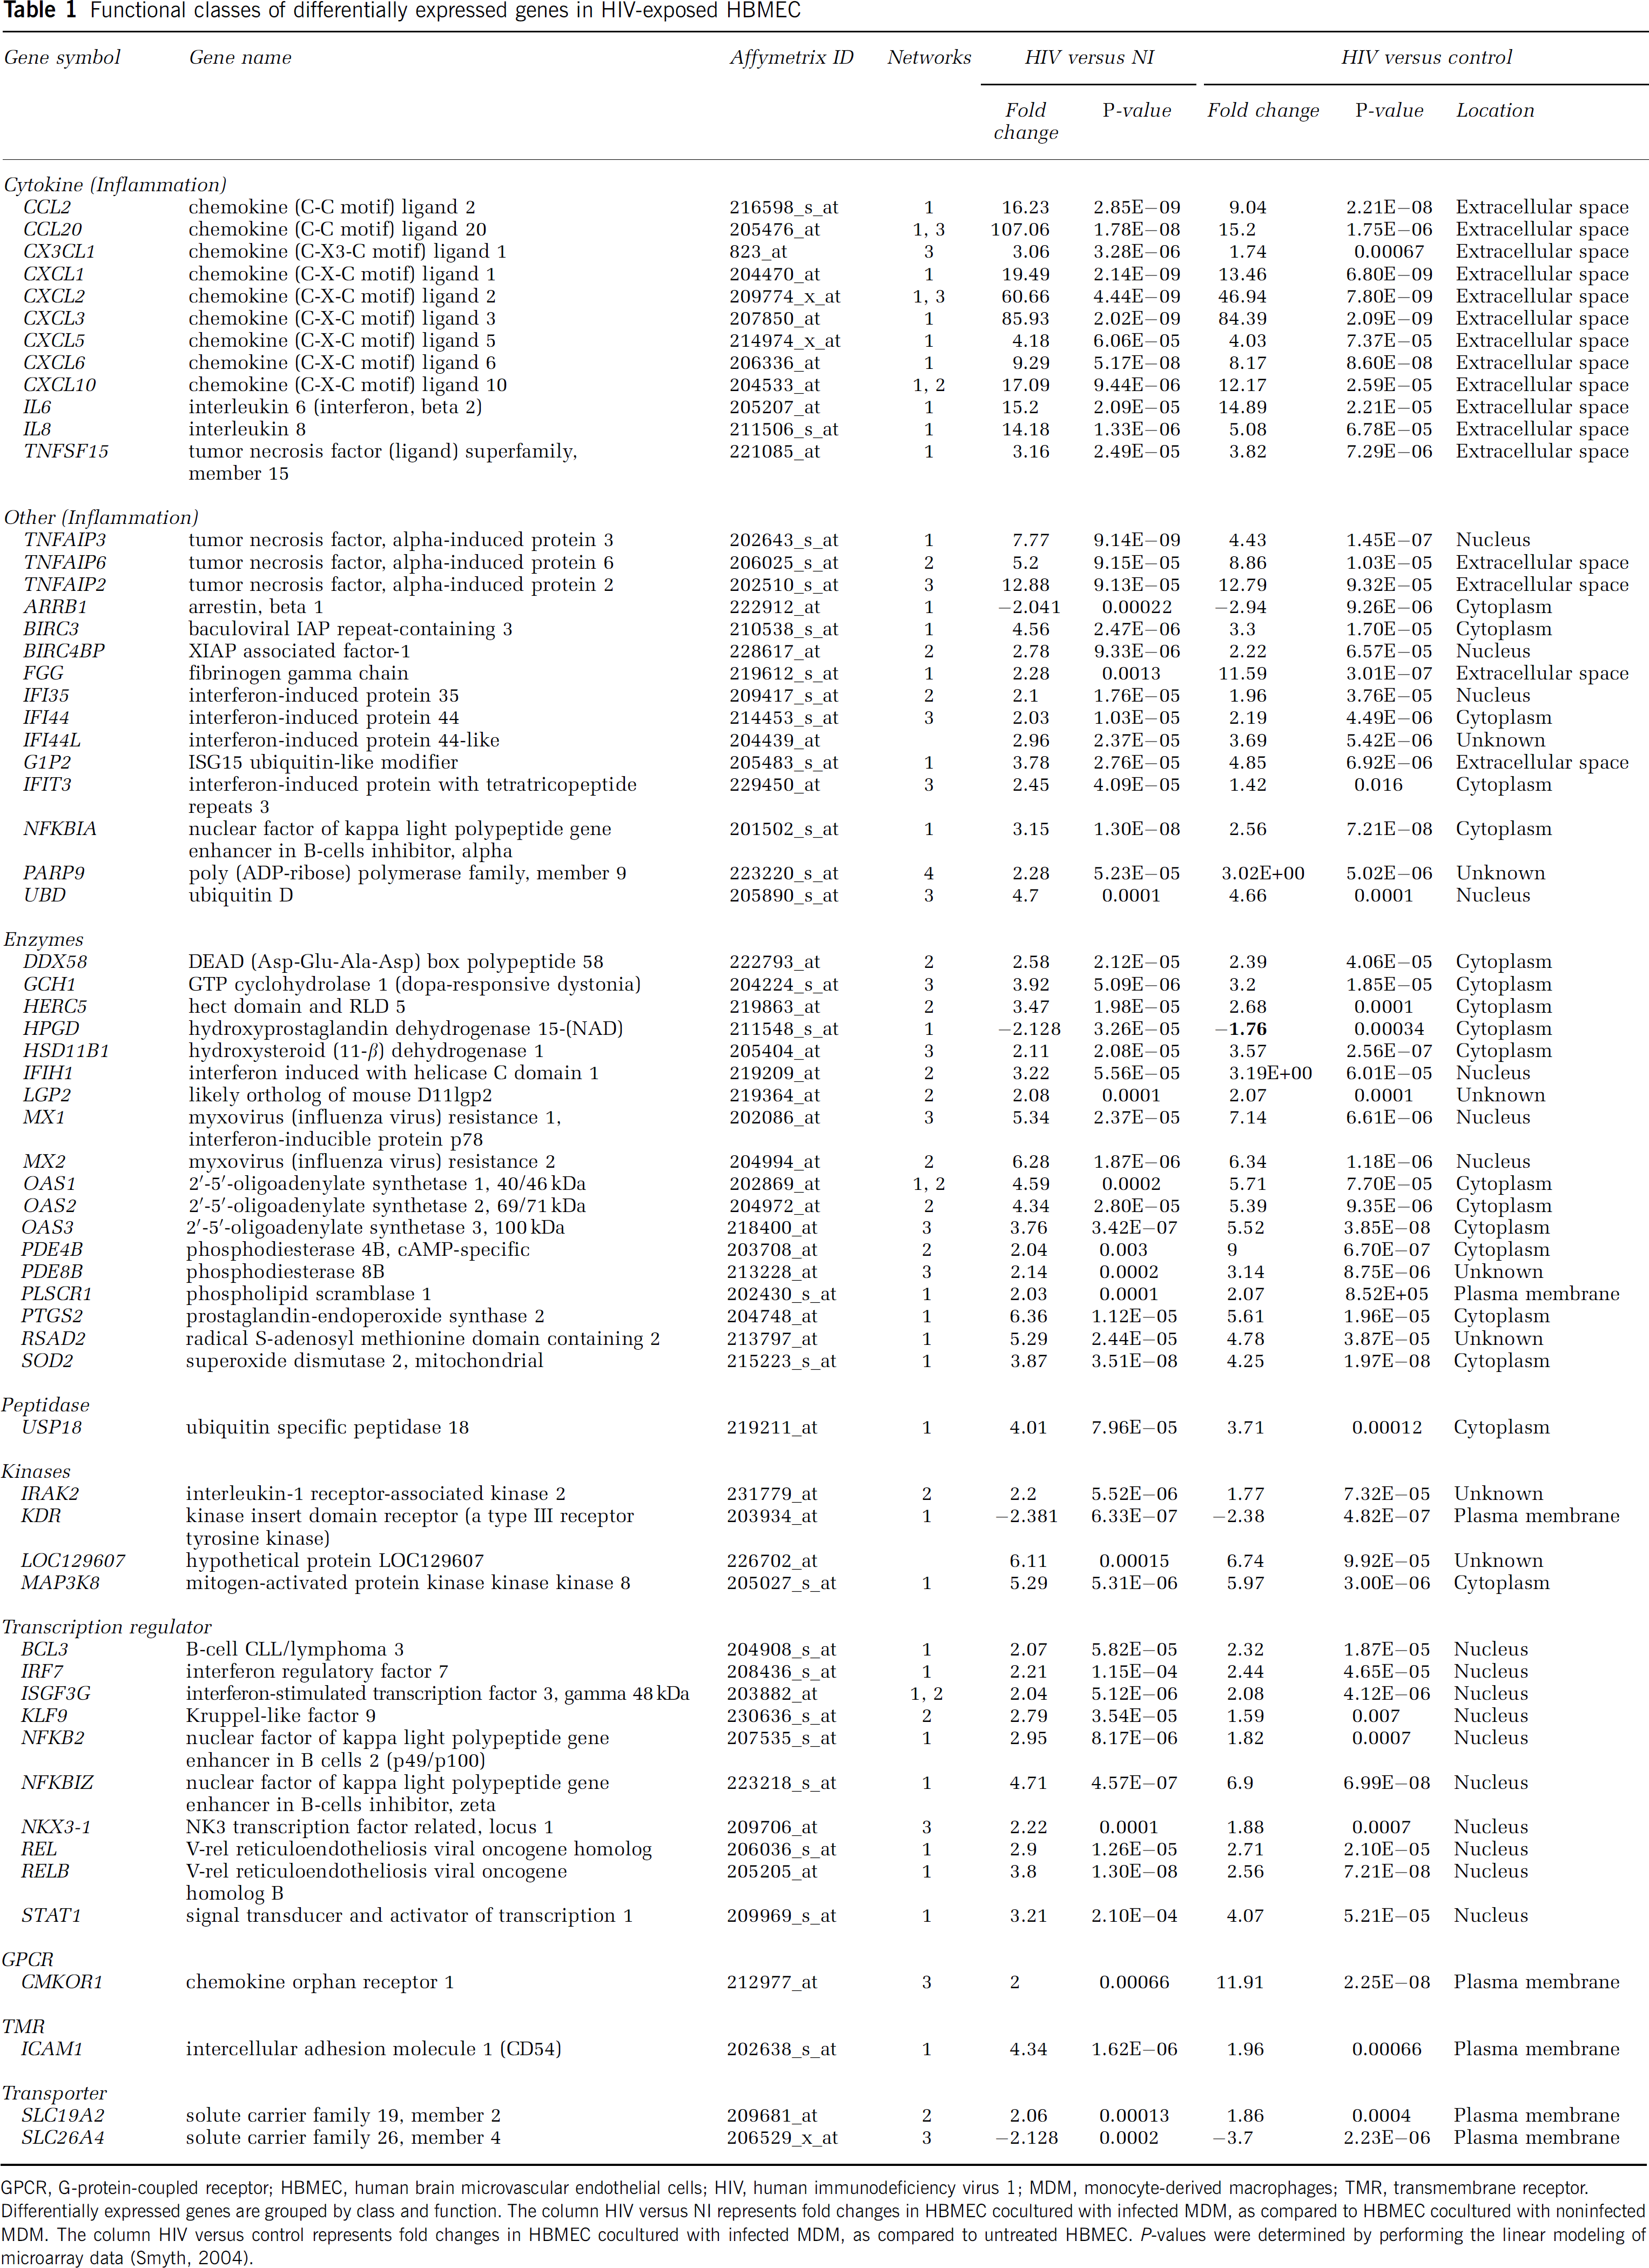
GPCR, G-protein-coupled receptor; HBMEC, human brain microvascular endothelial cells; HIV, human immunodeficiency virus 1; MDM, monocyte-derived macrophages; TMR, transmembrane receptor.
Differentially expressed genes are grouped by class and function. The column HIV versus NI represents fold changes in HBMEC cocultured with infected MDM, as compared to HBMEC cocultured with noninfected MDM. The column HIV versus control represents fold changes in HBMEC cocultured with infected MDM, as compared to untreated HBMEC. P-values were determined by performing the linear modeling of microarray data (Smyth, 2004).
Upregulated genes included proinflammatory cytokines, TNFAIP, IFI genes, enzymes, transcription factors, ubiquitin D and ubiquitin-associated genes, transporters, and the transmenbrane receptor intercellular adhesion molecule 1 (ICAM-1). Inflammatory cytokines with increased expression in HBMEC cocultured with HIV-infected MDM, compared to HBMEC cocultured with noninfected MDM, included IL-6 (15-fold), the CCL2 (16-fold), CCL20 (107-fold), CXCL1 (20-fold), CXCL2 (60-fold), CXCL3 (86-fold), CXCL5 (fourfold), CXCL6 (ninefold), CXCL10 (17-fold), and the chemokine (C—X3–C motif) ligand 1 (CX3CL1, threefold) (Table 1). When compared to HBMEC cocultured with noninfected MDM, exposure of HBMEC to infected MDM led to upregulation of endothelial TNFAIPs (TNFAIP-2, -3 and -6 by 13-, 8-, and 5-fold, respectively) and the TNF (ligand) superfamily 15 (threefold). Interferon-induced protein35, IFI44, IFI44-like, the interferon-stimulated gene 15, and IFI with tetratricopeptide repeats 3 were upregulated 2- to 4-fold. Increased gene expression in HBMEC caused by HIV-1-infected MDM was statistically significant for the results shown above (P-values were <0.00004). Other genes significantly upregulated in HBMEC exposed to infected MDM included enzymes such as 2′,5′-oligoadenylate synthetase, SOD2, prostaglandin-endoperoxidase synthase 2 (or cyclooxygenase 2), kinases, transcription factors STAT1, and NF-κB (Table 1).
Molecular Networks of Differentially Expressed Genes at the Blood—Brain Barrier after Human Immunodeficiency Virus 1 Exposure
We performed IPA analysis (http://www.ingenuity.com) to determine how genes differentially expressed in HIV-1-exposed HBMEC interact as parts of complexes, pathways, and biologic networks. The identified genes were mapped to genetic networks in the IPA database and ranked by score. The score is the probability that a collection of genes equal to or greater than the number in a network could be achieved by chance alone. For example, a score of 2 means there is a 1/100 chance that the genes in the network are only associated by chance, indicating a 99% confidence that the network is not generated by random chance. Our analysis revealed a total of four molecular networks and the scores were 82, 27, 24, and 2, respectively for network 1, 2, 3, and 4 (Table 2). Networks 1, 2, 3, and 4 contained 35, 16, 15, and 1 focus genes, respectively, with overlap between networks 1, 2, and 3 (Table 2 and Figure 3). The intensity of the node color in Figure 3 indicates the degree of increased (red) or decreased (green) expression in HBMEC cocultured with HIV-1-infected MDM when compared to HBMEC exposed to noninfected MDM.
Genetic Networks in HIV-exposed HBMEC
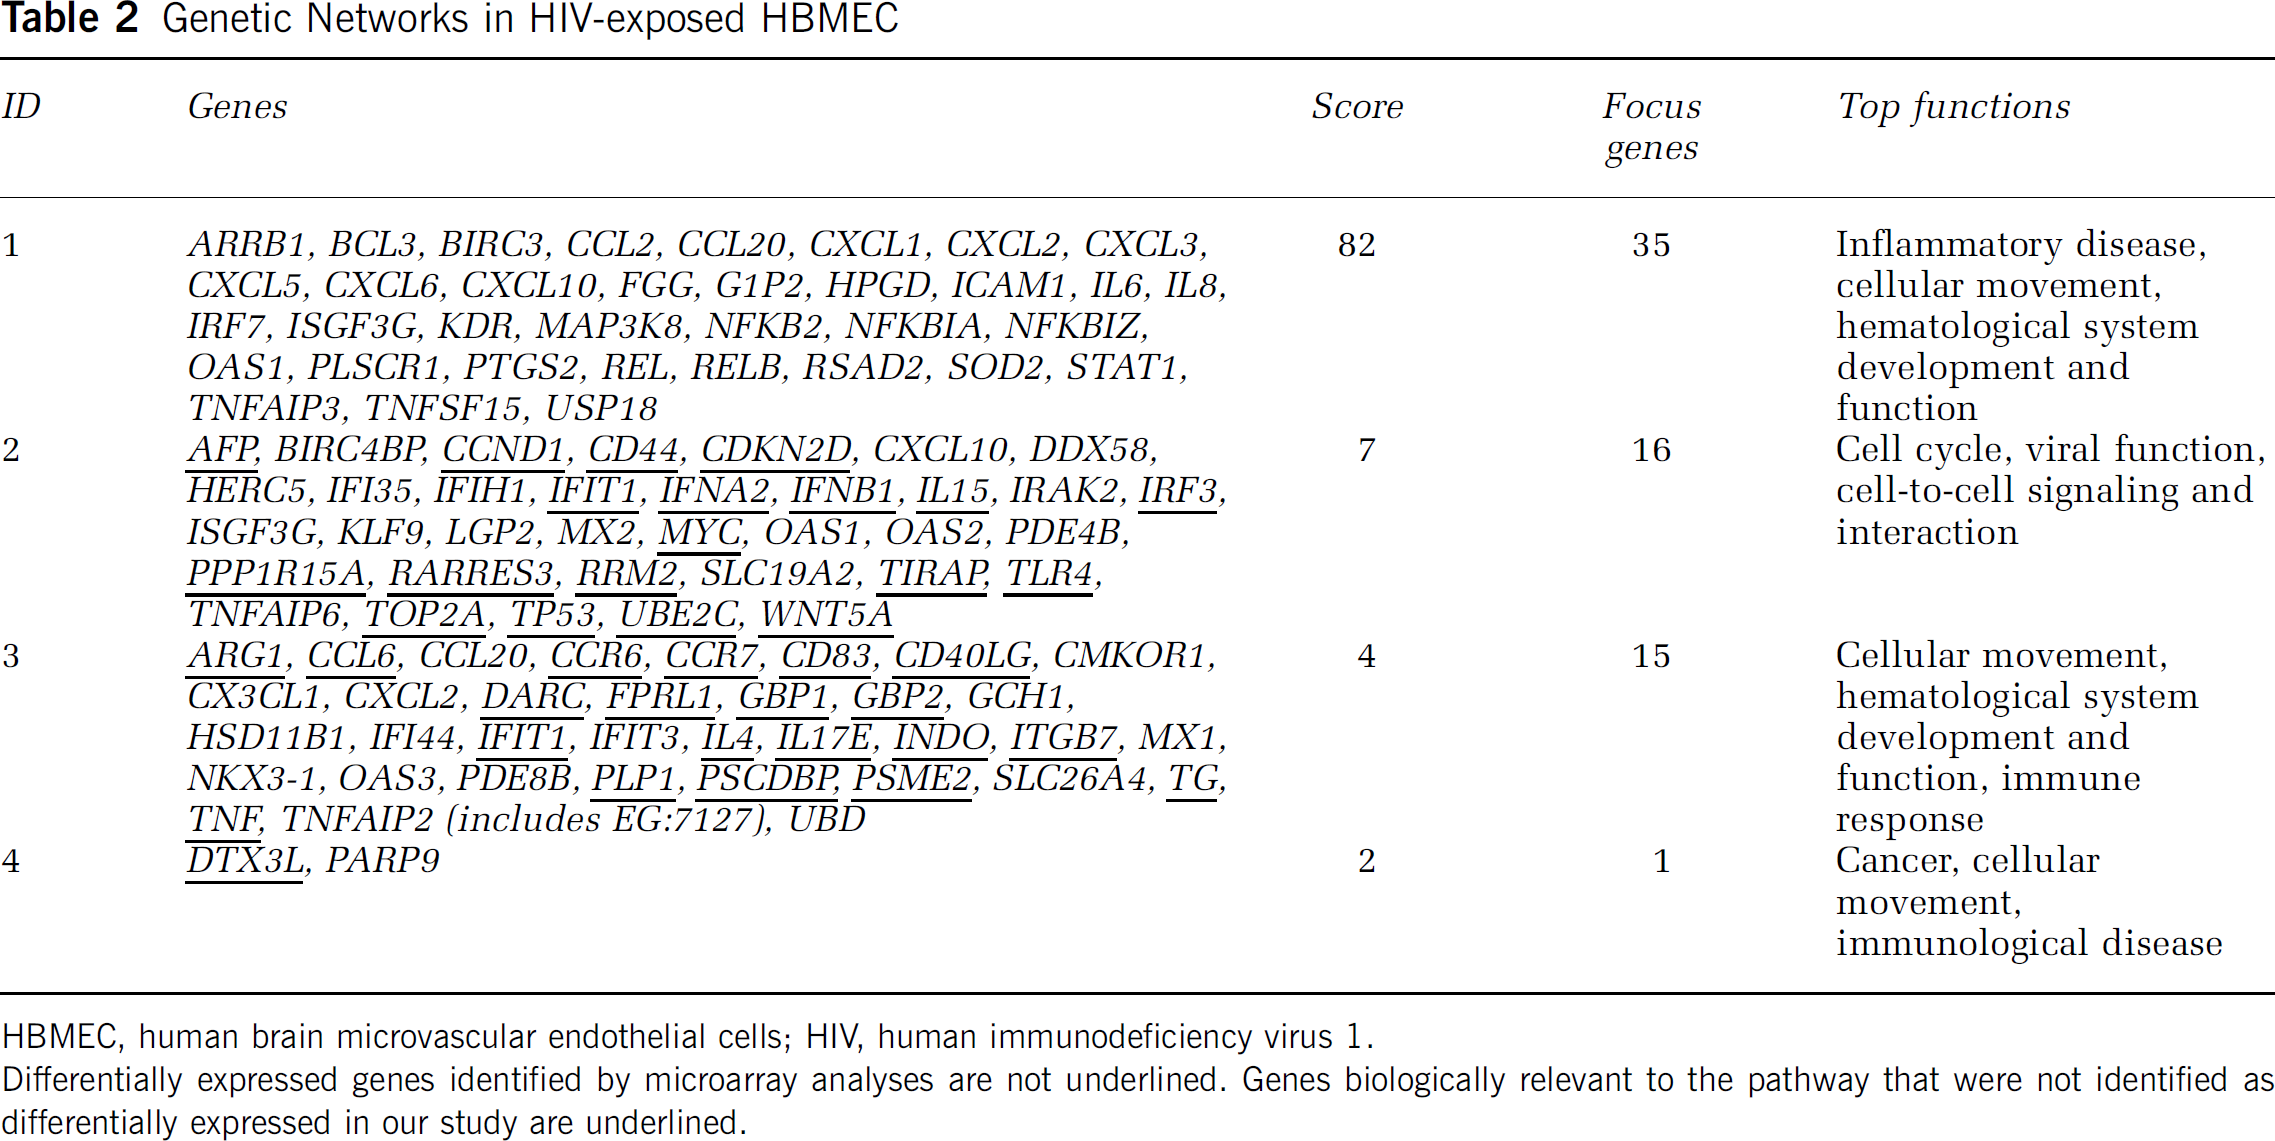
HBMEC, human brain microvascular endothelial cells; HIV, human immunodeficiency virus 1.
Differentially expressed genes identified by microarray analyses are not underlined. Genes biologically relevant to the pathway that were not identified as differentially expressed in our study are underlined.
Canonical Pathways and Function of Genes Differentially Expressed at the Blood—Brain Barrier after Human Immunodeficiency Virus 1 Exposure
Using the IPA software, a total of 54 genes were assigned to three top functional categories: diseases and disorders, molecular and cellular functions, physiological system development and function (Table 3). The diseases and disorders category included inflammatory diseases, viral function, dermatological diseases, hematological disease, organismal injury and abnormalities, and immunologic disease. Many genes were associated with more than one disease or disorder. All P-values were significant (P=2 E−9 to 8.3 E−3), and the top two significant groups were inflammatory disease and viral function (Table 3). Genes in the molecular and cellular functions category were associated with cellular movement, cell-to-cell signaling and interaction, cell signaling, molecular transport, metabolism, and gene expression. These associations were significant (P=9 E−11 to 8.3 E−3). Genes in the physiological system development and function category were associated with immune response, hematological system development and function, immune and lymphatic system development and function, tissue morphology, and tissue and cellular development (P=9 E−11 to 8.3 E−3; Table 3).
Top biological functions associated with genes differentially expressed in HIV-exposed HBMEC
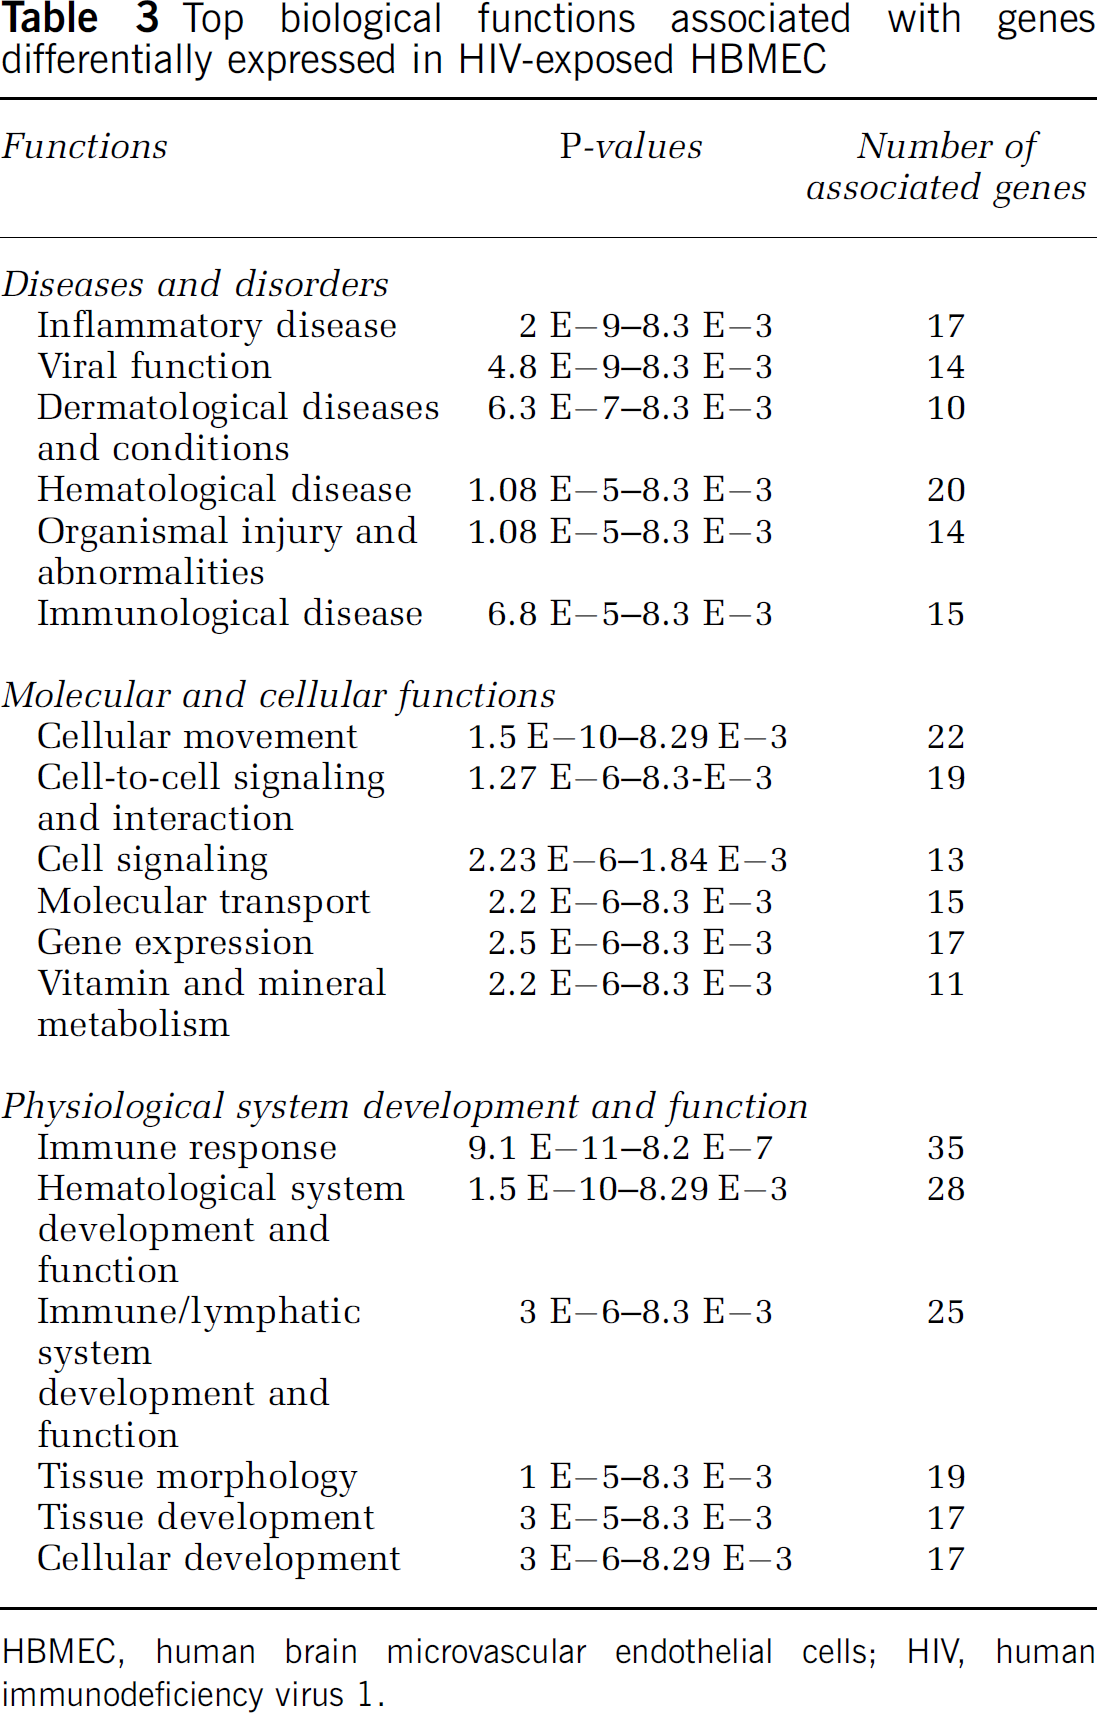
HBMEC, human brain microvascular endothelial cells; HIV, human immunodeficiency virus 1.
We further used the ‘canonical pathways’ feature of the IPA software to identify specific pathways likely to be activated by these genes differentially expressed in HIV-exposed HBMEC. A total of 34 canonical pathways were identified, of which 11 were statistically significant (Table 4). The top six canonical pathways were the IL-6 signaling, Toll-like receptor signaling, death receptor signaling, IL-10 signaling, NF-κB signaling, and interferon (IFN) signaling (Table 4). The Janus-family tyrosine kinase (JAK)/STAT signaling was not statistically significant; however, STAT1 was associated with seven different signaling pathways (Table 4).
Canonical pathways activated in HIV-exposed HBMEC
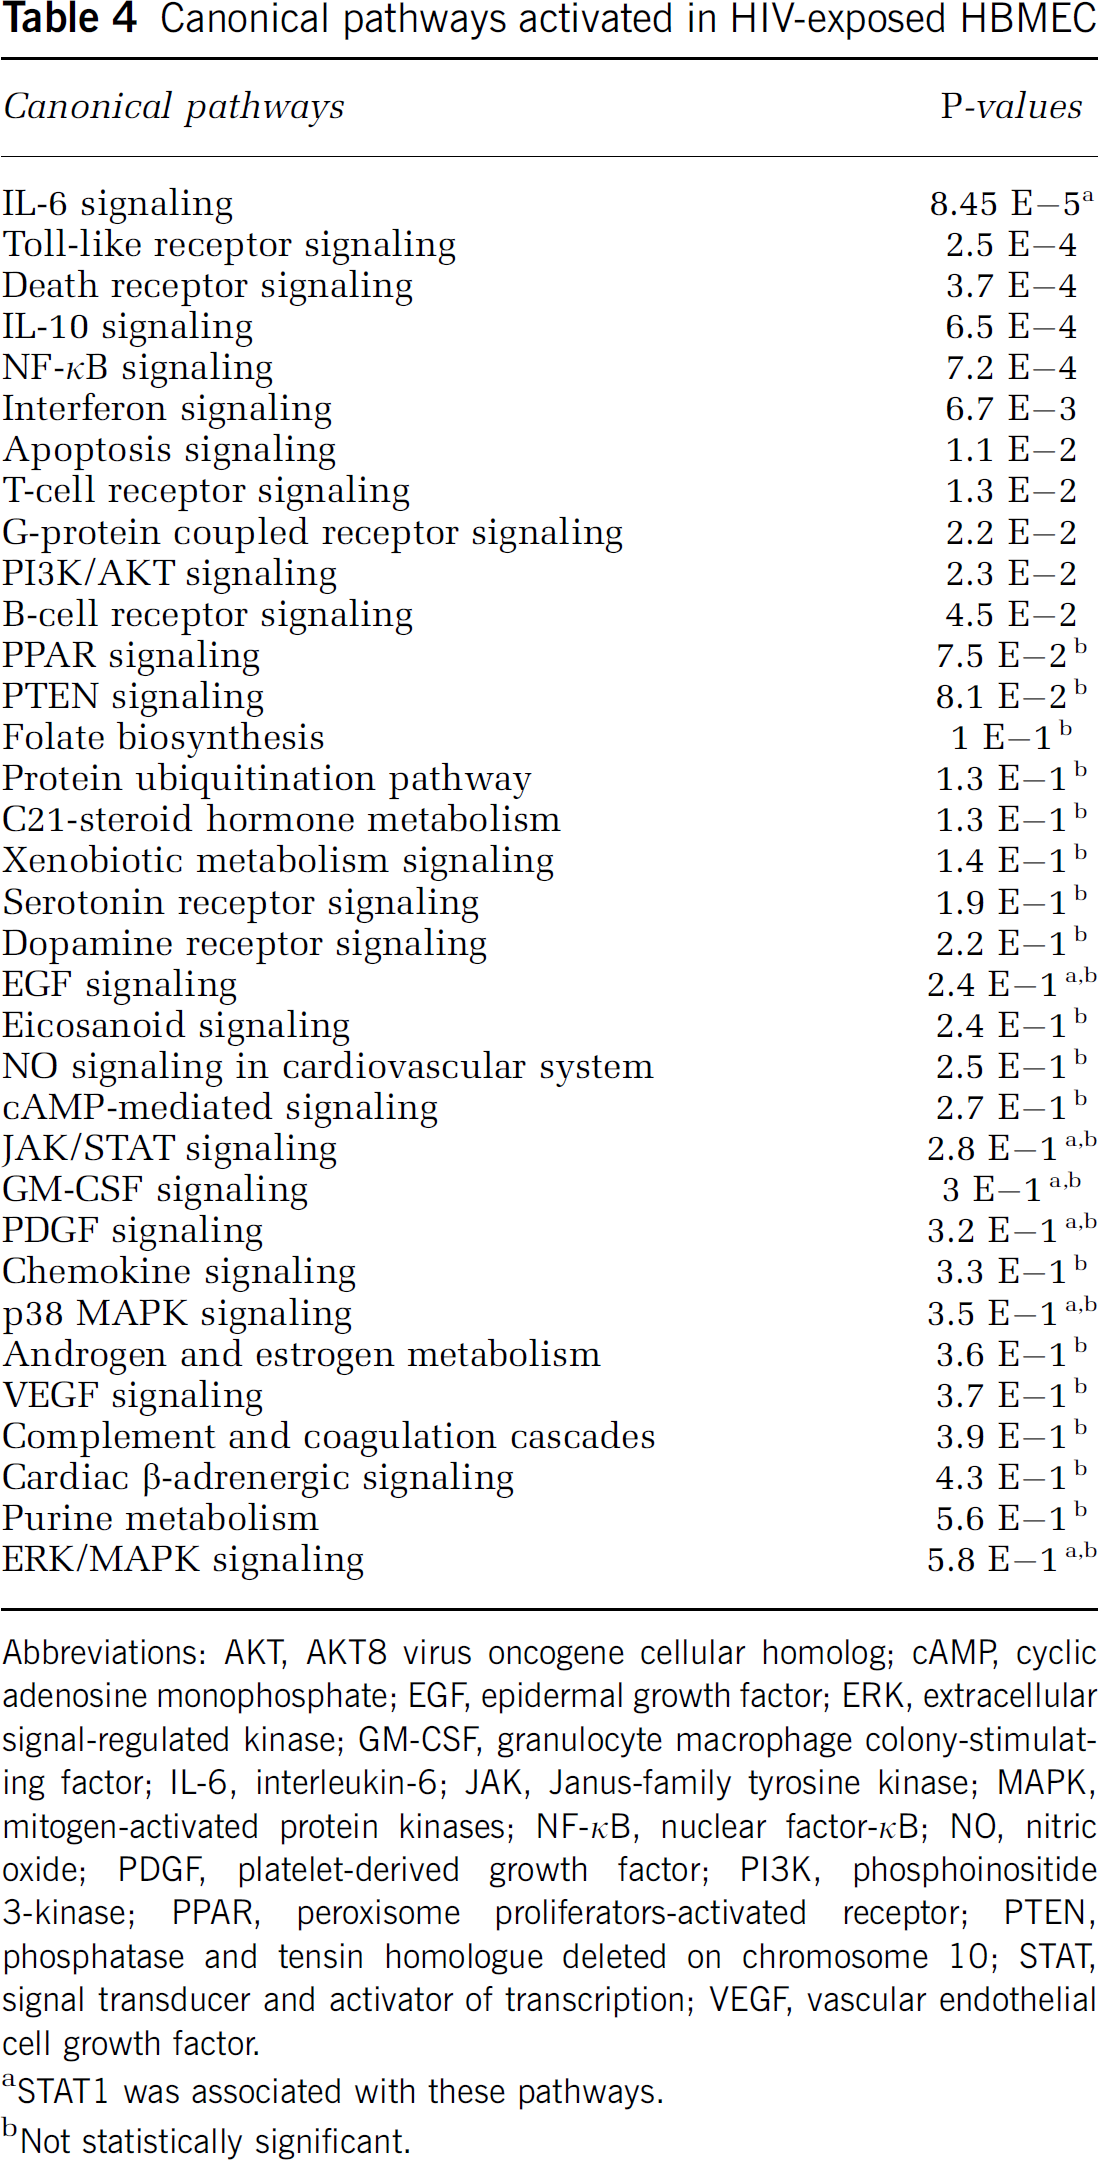
Abbreviations: AKT, AKT8 virus oncogene cellular homolog; cAMP, cyclic adenosine monophosphate; EGF, epidermal growth factor; ERK, extracellular signal-regulated kinase; GM-CSF, granulocyte macrophage colony-stimulating factor; IL-6, interleukin-6; JAK, Janus-family tyrosine kinase; MAPK, mitogen-activated protein kinases; NF-κB, nuclear factor-κB; NO, nitric oxide; PDGF, platelet-derived growth factor; PI3K, phosphoinositide 3-kinase; PPAR, peroxisome proliferators-activated receptor; PTEN, phosphatase and tensin homologue deleted on chromosome 10; STAT, signal transducer and activator of transcription; VEGF, vascular endothelial cell growth factor.
STAT1 was associated with these pathways.
Not statistically significant.
Validation of Human Immunodeficiency Virus 1-Induced Molecular Alterations in HBMEC
To validate the results of our genomic experiments, we performed real-time quantitative PCR with the same RNA samples used for microarray analysis, using an ABI PRISM 7000 sequence detector, gene-specific primers, and a TaqMan gene detection system (Applied Biosystems). Data confirmed upregulation of proinflammatory genes, IFN-inducible genes, and transcription factors in HBMEC exposed to HIV-infected MDM compared to controls and HBMEC exposed to noninfected MDM (Figure 4). Real-time PCR showed significant increase in mRNA of proinflammatory cytokines IL-6, IL-8, CXCL3, CCL2, CCL20, TNFAIP2, TNFAIP6, the IFN-inducible genes IFIH1, IFI44, as well as the transcription factors IRF7, ISGF3G, and Rel (Figure 4).
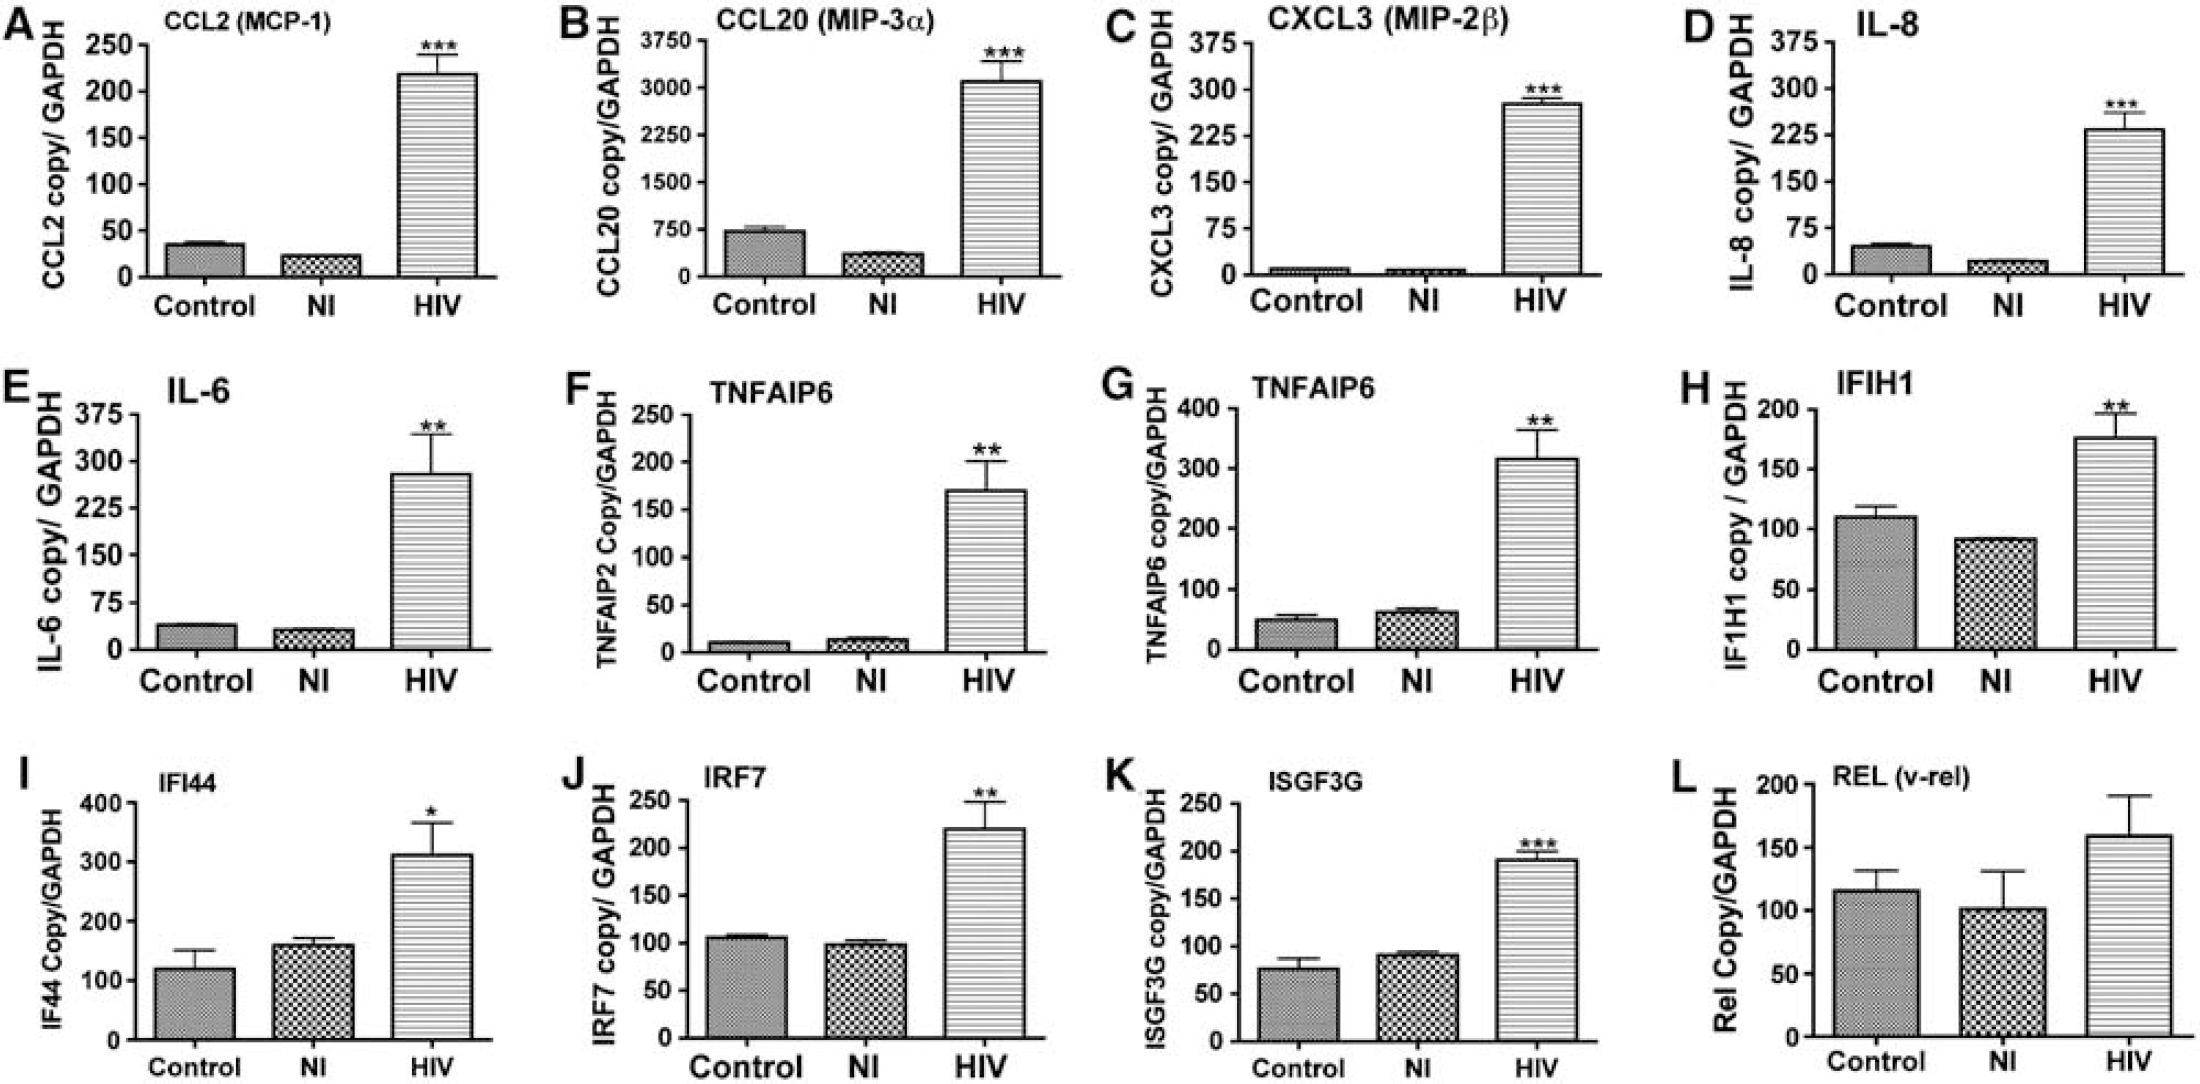
Real-time PCR confirmed HIV-induced upregulation of the proinflammatory chemokines and cytokines (
Human Immunodeficiency Virus 1 Increases Interleukin-8 Expression in HBMEC
Interleukin-8 was among the chemokines transcriptionally upregulated in HIV-1-exposed HBMEC (Figures 2 and 4 and Table 1). To determine whether HIV also increases IL-8 protein levels in endothelial cells, we measured IL-8 secreted by HBMEC after 2 to 24 h HIV-1 exposure. Six replicates were used for each experimental condition. Six-, 12-, and 24-h HIV-1 exposure increased IL-8 secretion in HBMEC by 6.7-, 11.5-, and 9.7-fold, respectively (P<0.001, Figure 5A). Human brain microvascular endothelial cells exposed for 24 h to conditioned media from noninfected MDM secreted 318.6±19.2 pg/mL of IL-8, whereas HBMEC exposed to HIV-1 for 2, 6, 12, and 24 h produced 494.7±3.5, 2,126±40.5 (P<0.001), 3,669±76.5 (P<0.001), and 3094±178.7 pg/mL (P<0.001), respectively. The IL-8 level in the HIV inoculum (HIV-1ADA at MOI 0.01, not exposed to HBMEC) was 582.8±76.6 pg/mL (Figure 5A).
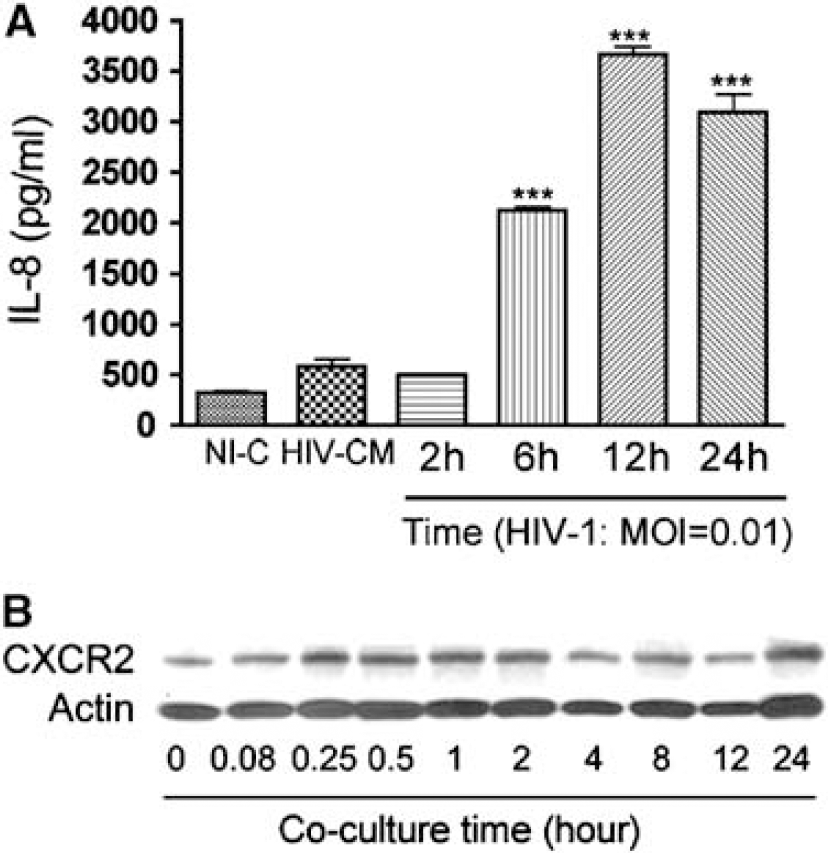
Human immunodeficiency virus 1 induces IL-8 secretion and increases CXCR2 expression in HBMEC. (
Human Immunodeficiency Virus 1 Exposure Increases Expression of the Interleukin-8 Receptor in HBMEC
To determine whether HBMEC expressed IL-8 receptor and the potential effect of HIV exposure on receptor expression, we analyzed CXCR2 (IL-8 receptor type II) expression in HBMEC cocultured with infected or noninfected MDM as well as control untreated HBMEC. After 5 mins to 24 h coculture, proteins were extracted from HBMEC and analyzed by Western blotting with CXCR2 antibodies. Human brain microvascular endothelial cells expressed CXCR2 and coculture of endothelial cells with infected MDM increased receptor expression (Figure 5B). Coculture of HBMEC with noninfected MDM did not increase CXCR2 expression (data not shown).
Human Immunodeficiency Virus 1 Infection and Interleukin-8 Increased Monocyte Migration Across In Vitro Blood—Brain Barrier Models
To determine the functional significance of HIV-induced effects on HBMEC, we performed migration experiments across in vitro BBB models using both noninfected and HIV-infected monocytes. Human immunodeficiency virus 1 infection increased monocyte migration and IL-8 further increased migration of both infected and noninfected monocytes (Figure 6A). Our microarray data showed increased mRNA for SOD2, transcription factors of the NF-κB family, and STAT1 in HBMEC cocultured with HIV-infected MDM. Therefore, we tested the effects of a STAT1/STAT3 inhibitor (AG490, 50 nmol/L), an SOD inhibitor (methoxyestradiol, 10 nmol/L), and an NF-κB inhibitor (SN50, 18 μmol/L) on IL-8-induced monocyte migration. AG490 diminished IL-8-induced migration of both infected and noninfected monocytes (P<0.01; Figure 6B), whereas SOD2 and NF-κB inhibitors had no effect (data not shown).
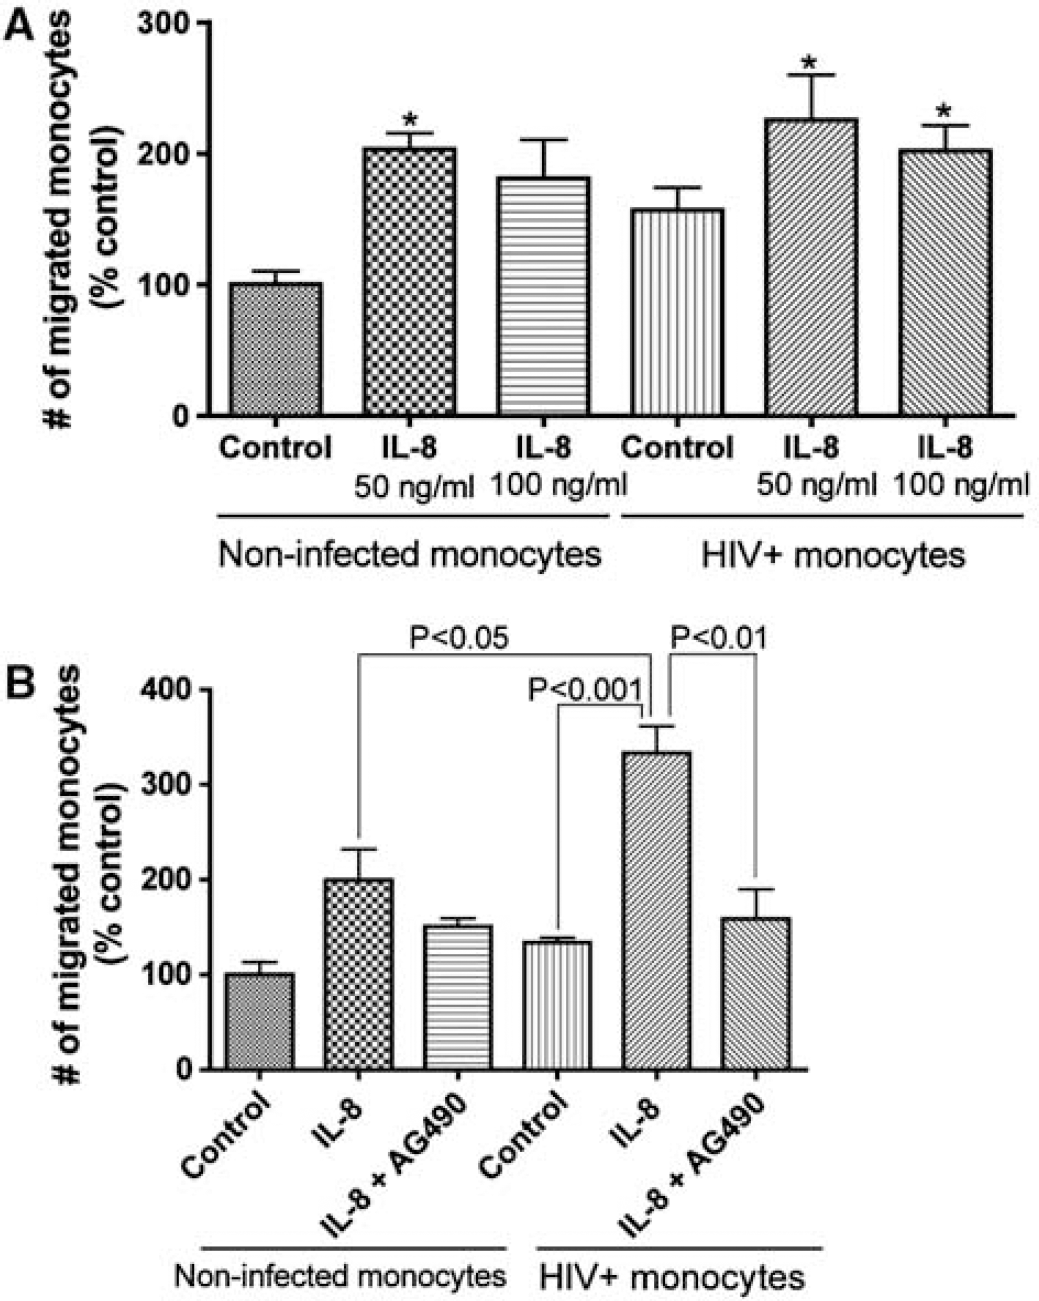
Human immunodeficiency virus 1 infection and IL-8 increased monocyte migration across in vitro BBB models. (
Discussion
Although BBB impairment plays an important role in HIV-1-associated dementia pathogenesis, the mechanisms underlying barrier dysfunction and virus/toxin penetration across the BBB are not well understood. In this study, we used an Affymetrix GeneChip system with Human Genome U133A 2.0 arrays to investigate HIV-1-induced genomic changes in primary HBMEC, the principal component of the BBB as well as the pathways activated at the BBB after endothelial cell exposure to HIV-1-infected macrophages. Microarray and real-time PCR showed that HIV-1 induced upregulation of several proinflammatory cytokines and chemokines in HBMEC, many of which have been implicated in the pathogenesis of HIV-1 infection and progression to AIDS. In fact, HIV-1 infection alters cytokine production in vivo and in vitro (Kedzierska and Crowe, 2001). Secretion of IL-8, IL-6, CXCL10, CCL2, and CXCL1 increases during the course of HIV infection correlating with disease progression (Kedzierska and Crowe, 2001). Ingenuity Pathways Analysis identified four highly significant networks. The top functions significantly associated with these networks included inflammation, immune response, cellular movement, gene expression, and cell-to-cell signaling. The most statistically significant canonical pathways associated with these networks included the IL-6, IL-10, and IFN signaling. The JAK/STAT signaling pathway was not statistically significant. However IL-6, IL-8, IL-10, STAT1, ISGF3G, and IFN-associated genes signal through the JAK/STAT pathway, and there is crosstalk between the IL-6, IL-10, IFN signaling, and the JAK/STAT pathway. Thus, STAT1 and signaling through JAK/STAT may play an important role in HIV-induced BBB compromise.
Inflammation induces leukocyte infiltration through the brain endothelium (reviewed in Couraud, 1998), and inflammatory cytokines have been implicated in the neuropathogenesis of HIV-1-associated dementia. In fact, increased expression of CCL2, IL-6, CXCL10, and chemokine (C—X3–C motif) ligand 1 in the brain and cerebrospinal fluid of infected patients is associated with higher viral load, diminished microvascular integrity, increased risk of encephalopathy, and HIV-1-associated dementia (Avison et al, 2004; Laverda et al, 1994; Perrella et al, 1992; Poluektova et al, 2001). Endothelial cell interaction with HIV-infected MDM increased MCP-1 mRNA levels and cyclooxygenase 2 expression (Boven et al, 2000; Pereira et al, 2000), and HIV-1 tat protein enhanced cyclooxygenase 2, CCL2, vascular cell adhesion molecule–1, and ICAM-1 expression in mouse brain tissues (Flora et al, 2006; Pu et al, 2003). Our present study shows transcriptional upregulation of cyclooxygenase 2 as well as downregulation of HPGD in HBMEC co-cultured with infected MDM. Hydroxyprostaglandin dehydrogenase 15-(NAD) is the main enzyme involved in the biologic inactivation of prostaglandins, and inflammation or cytokine-induced upregulation of COX and prostaglandin expression are often associated with downregulation of HPGD (Otani et al, 2006; Tong et al, 2006). This suggests that the eicosanoid signaling pathway may also be involved in HIV-1-induced inflammation and injury of brain endothelial cells during endothelial—macrophage interaction. Astrocytes and pericytes are known to regulate brain capillary endothelial functions and play a vital role in the maintenance of BBB integrity. Inflammatory molecules secreted by HIV-exposed HBMEC could also alter the structure and function of astrocytes and pericytes, further destabilizing the neurovascular unit.
In vitro BBB models often consist of monolayers of brain endothelial cells, brain endothelial cells co-cultured with astrocytes or astrocyte conditioned media. In this study, we used monolayers of primary HBMEC to ensure that we were dealing with a homogeneous cell population, and differentially expressed genes were from endothelial cells. We routinely used the electric cell-substrate impedance-sensing system (model 1600R; Applied Biophysics, Troy, NY, USA) or a voltmeter to monitor monolayer integrity before experiments. Our confluent HBMEC showed transendothelial electric resistance values between 800 and 1,300 Ω × cm2 (Haorah et al, 2007), which is comparable with ones reported using similar models or brain endothelial cells cocultured with astrocytes (Cucullo et al, 2007; Siddharthan et al, 2007).
Adhesion molecules can mediate leukocyte adhesion and transendothelial migration (Maslin et al, 2005). Human brain microvascular endothelial cells express ICAM-1 and blocking antibodies to ICAM-1 significantly inhibit monocyte migration across HBMEC monolayers (Seguin et al, 2003). Our data show that ICAM-1 was the only adhesion molecule significantly upregulated in HIV-1-exposed HBMEC, suggesting that ICAM-1 could play a role in endothelial—leukocyte interaction and transmigration of infected cells into the CNS. Intercellular adhesion molecule 1 signaling also mediates reorganization of the endothelial actin cytoskeleton and lymphocyte migration into the CNS (Greenwood et al, 2002). In line with these observations, we recently showed changes of cytoskeletal proteins in HBMEC as a consequence of endothelial cell interaction with HIV-infected MDM (Ricardo-Dukelow et al, 2007). These HIV-1 and inflammation-induced cytoskeletal alterations of the brain endothelium could play a major role in viral and cellular infiltration in the brain.
Chemokines upregulated in HIV-1-exposed HBMEC included CXCL1, CXCL2, CXCL3, CXCL5, CXCL6, and CXCL8 (IL-8), all of which are CXCR2 agonists (for a recent review, see Alexander et al, 2007). CXCR2 mediates leukocyte migration in response to these chemokines. This seven-transmenbrane receptor has been implicated in the pathogenesis of acute and chronic inflammatory diseases, and CXCR2 inhibition reduced leukocyte recruitment and tissue damage (Reutershan, 2006). In this study, we showed that HBMEC express CXCR2 and HIV-1 exposure increases its expression. Endothelial cells from other vascular beds, including microvascular cells from human lung, dermal, umbilical vein, and saphenous vein endothelium also express CXCR2 (Hillyer et al, 2003; Murdoch et al, 1999). We also showed that interaction of HBMEC with HIV-1-infected MDM induce transcriptional upregulation of IFN-inducible genes and IFN-associated enzymes in HBMEC. These results parallel previous findings showing that HIV-1 stimulates IFN-inducible genes in vivo and in vitro. In HIV-infected humans, progression to AIDS is associated with significant increases in 2′-5′-oligoadenylate synthetase, IFN-stimulated gene 15 and 20, IFI44, IFI4, and IFI30 expression (Baca et al, 1994; Witt et al, 1991). Analysis of brain tissues from the frontal cortex of patients with HIV-1 encephalitis showed increased mRNA for IFN-inducible genes (Masliah et al, 2004). One limitation of this study was the use of one time point (12 h) in Affymetrix microarray studies, as gene expression profiles may change with viral exposure time. To address this limitation, we will use several time points in subsequent experiments when investigating the role of specific genes in HIV-induced inflammation and BBB dysfunction.
To delineate the functional significance of HIV-induced IL-8 expression, we performed migration experiments with infected and non-infected monocytes in the presence of IL-8, as well as pharmacological inhibitors of STAT, NF-κB, and SOD2. The STAT1/STAT3 inhibitor AG490 significantly diminished HIV-1- and IL-8-induced monocyte migration, whereas NF-κB and SOD2 inhibitors had no effect. This suggests that the JAK/STAT pathway may be involved in HIV-1- and chemokine-induced BBB compromise. Other studies showed involvement of the JAK/STAT pathway in IL-8 expression, and AG490 inhibited inflammation-induced IL-8 secretion in human monocytic cell lines (D'Isanto et al, 2004). Activation of epithelial cells increased IL-8 and ICAM-1 expression and a STAT1 inhibitor attenuated IL-8 secretion (Tang et al, 2006). Thus, targeting the JAK/STAT pathway could be important in regulating HIV-1-induced inflammation and endothelial dysfunction. Studies addressing this idea are currently ongoing in our laboratory. In summary, results of this study suggest that inflammation and immune dysregulation play a major role in HIV-induced BBB dysfunction, and likely results in enhanced chemotaxis, adhesion, and migration of circulating HIV-infected leukocytes into the CNS. This study comprehensively addresses putative underlying pathways leading to BBB compromise; these data will guide functional assays further dissecting molecular dysregulation of barrier function.
Footnotes
Acknowledgements
We thank Debbie Baer for excellent editorial support, Dr Jim Eudy of the UNMC Microarray Core Facility for assistance in microarray analysis, and Dr Charles Murrin and Robin Taylor for critical reading of the manuscript.