
Abstract
The receptor tyrosine kinase PDGFRβ is essential for pericyte migration to the endothelium. In mice lacking one allele of PDGFRβ (PDGFRβ+/−), previous reports have described an age-dependent loss of pericytes in the brain, leading to cerebrovascular dysfunction and subsequent neurodegeneration reminiscent of that seen in Alzheimer’s disease and vascular dementia. We examined 12–20-month-old PDGFRβ+/− mice to better understand how pericyte loss affects brain microvascular structure and perfusion in vivo. We observed a mild reduction of cortical pericyte number in PDGFRβ+/− mice (27% fewer cell bodies) compared to controls, but no decrease in pericyte coverage of the endothelium. This mild degree of pericyte loss caused no discernable change in cortical microvascular density, length, basal diameter or reactivity to hypercapnia. Yet, it was associated with an increase in basal blood cell velocity, primarily in pre-capillary arterioles. Taken together, our results suggest that mild pericyte loss can lead to aberrant cerebral blood flow despite a lack of apparent effect on microvascular structure and reactivity.
Introduction
Pericytes are mural cells of brain microvessels. They are positioned within the vascular basement membrane, located abluminal to endothelial cells and luminal to astrocytic endfeet.1,2 In the normal brain, pericytes contribute to cerebrovascular homeostasis with roles in angiogenesis, 3 immune function, 4 cerebral blood flow regulation, 5 and blood–brain barrier (BBB) integrity.6,7 Recent preclinical studies have shown that loss of pericyte coverage can exacerbate BBB leakage and cause blood flow deficits in advanced age, and in models of Alzheimer’s disease and CADASIL.8,9 These results support clinical reports that pericyte degeneration is accelerated in Alzheimer’s disease and related dementias.10–14 In a study that counted pericyte number in human brain slices, AD patients with APOE3 genotype experienced ∼25% pericyte loss, while APOE4 carriers experienced ∼50% loss. 10 In a separate study, ∼30% pericyte loss was observed in AD patients with no alterations in microvascular length. 15 Most studies have focused on relating this 25–30% loss of pericyte number to functional changes in BBB integrity. However, its effect on brain microvascular flow has remained obscure.
Mouse models that exhibit pericyte deficiency have provided insight into this gap in knowledge. Mice with varying mutations in the tyrosine kinase receptor platelet-derived growth factor receptor beta (PDGFRβ), or its ligand PDGFB, exhibit impaired recruitment of pericytes to the endothelium. Collectively, these mutant mice have created a range of severities in pericyte loss, allowing the relationship between pericyte number/coverage and vascular function to be probed. While pdgfb or pdgfrb null mice have near complete absence of brain pericytes and are perinatal lethal,16,17 some mutants exhibit partial disruption in PDGFB/PDGFRβ signaling and are postnatally viable. Mice carrying only a single functional allele of pdgfrb, referred to as PDGFRβ+/− mice, are postnatally viable. They carry a deletion mutation within the pdgfrb gene, which leads to a ∼50% overall reduction in pdgfrb mRNA transcript expression compared to wild-type. 16
In a series of studies by Zlokovic and colleagues, an age-related degeneration of pericytes and neurovascular dysfunction was reported in PDGFRβ+/− mice. By six months of age, these mice exhibited moderate ∼40% pericyte loss, which progressively worsened to a severe ∼70% loss by 12 months of age. This pericyte loss was associated with severe BBB breakdown and concomitant cerebral hypoperfusion driving neurodegeneration. 18 A subsequent study from the same group examined PDGFRβ+/− mice at one month of age, when pericyte loss was mild (25% loss). Even at this early age, PDGFRβ+/− mice already began to exhibit defects in neurovascular coupling that resulted in cortical tissue hypoxia. 19 In contrast, other laboratories have found a much milder phenotype with PDGFRβ haploinsufficiency. A study by Betsholtz and colleagues examined mice that were double heterozygous (PDGFB+/−; PDGFRβ+/−), detecting only ∼20–30% pericyte loss at six months of age, with no worsening at 12 months. Further, no obvious BBB permeability could be detected at either age examined in their hands. 20
The goal of this study was two-fold: (1) To independently examine the effect of PDGFRβ haploinsufficiency on brain pericyte number in aged mice, and (2) to understand the effect of pericyte loss on brain microvessel structure and flow.
Methods
The Institutional Animal Care and Use Committee at the Medical University of South Carolina approved the procedures used in this study. The University has accreditation from the Association for Assessment and Accreditation of Laboratory Animal Care International, and all experiments were performed within its guidelines. All data were analyzed and reported according to ARRIVE guidelines.
Animals
PDGFRβ+/− mice were originally generated by P. Soriano 16 using a PGKneobpA expression cassette to replace a Smal-EcoRV fragment (1.8 kb) that spanned sequences coding for the signal peptide to the second immunoglobulin domain of PDGFRβ. 16 Male and female PDGFRβ+/− mice (n = 6; 3 male) and PDGFRβ+/+ littermates (n = 7; 4 male) were obtained by cryorecovery at the Jackson Laboratory (stock #007846). The cryopreserved embryos were generated from wild type 129S1 (also known as 129S1/SvlmJ) and PDGFRβ+/− 129S4 (also known as 129S4/SvJae) parental strains. 21 The resulting mice therefore have ∼50% genetic background of 129S1 and 129S4 strains. The first generation of mice from this recovery was shipped to our institute and aged prior to being examined. Starting at 12 months of age, mice were selected from each of the two genotypes for acute studies. The total 13 mice were imaged over an eight-month period, and thus mice were aged between 12 and 20 months. However, PDGFRβ+/+ and PDGFRβ+/− experiments were interleaved to ensure that the age ranges between genotypes were comparable. All animals were maintained in standard cages on a 12-h light–dark cycle on standard mouse chow diet.
Surgery
Polished and reinforced thinned-skull windows22,23 were generated under guidance of a stereoscope (SXZ10; Olympus). Anesthesia was induced with isoflurane (Patterson Veterinary) at 4% mean alveolar concentration in 100% oxygen and maintained at 1–2% during surgery. Body temperature was maintained at 37°C with a feedback-regulated heat pad (FHC Inc.). For analgesia, all animals were administered buprenorphine prior to or immediately following the surgery at a concentration of 0.05 mg/kg. The windows were ∼3 mm in diameter and placed over the somatosensory cortex, i.e. windows were centered at 2 mm posterior and 3 mm lateral to Bregma.
In vivo two-photon imaging
Imaging was performed with a Sutter moveable objective microscope (MOM) and a Coherent Ultra II Ti:Sapphire laser source between 1 to 3 days after cranial window surgery. Mice were kept under light isoflurane (0.75–1%), which was provided through medical air (20–22% oxygen and 78% nitrogen, moisturized by bubbling through water; AirGas Inc.) during the imaging period. Body temperature was maintained at 37°C with a feed-back regulated heat pad, and blood serum was labeled by retro-orbital vein injection of 0.03 mL of 2 MDa fluorescein-dextran (FD2000S; Sigma-Aldrich) prepared at a concentration of 5% (w/v) in sterile saline. In a subset of experiments, hypercapnia was induced by substituting medical air for 5% CO2 balanced with air during isoflurane delivery. In each mouse examined, three to four volumetric image stacks were collected before hypercapnic challenge, and then image stacks were again collected from the same areas during hypercapnic challenge. This allowed us to assess the magnitude of diameter change in the same pre-capillary arteriole and capillary segments by dividing diameter during hypercapnia with baseline diameter. Imaging of the hypercapnic brain began 5 min after initiation of CO2 administration and the collection image stacks sets generally required an additional 5 min. The hypercapnic challenge was only given once per mouse, at the end of each experiment.
Blood flow imaging procedures and related analyses have been previously described. 23 Briefly, two-photon imaging of FITC-dextran was performed at 800 nm excitation. Wide-field images were first collected using a 4-X, 0.13 NA objective lens (Olympus UPLFLN 4X) to generate vascular maps of the entire cranial window for navigation and selection of penetrating arterioles. High-resolution imaging of microvasculature was then performed using a 20-X, 1.0 NA water-immersion objective lens (Olympus XLUMPLFLN 20XW). When imaging with the 20-X objective, laser power ranged between 20 and 100 mW exiting the microscope objective, with higher powers required for greater cortical depth. Image stacks were collected across 211 × 211 µm fields, starting at the pia mater and ending at a cortical depth of 150–200 µm. The lateral (xy) and axial (z) point-spread functions of our microscope for in vivo measurements were respectively 0.7 μm and 1.7 μm. This was evaluated by imaging sub-resolution 0.2 µm fluorescent beads pressure injected into cortex in vivo. 24 Lateral sampling (x, y) was 0.41 μm/pixel, and axial sampling (z) was 1 μm/pixel, or roughly half of our point-spread function. All lumen diameter quantifications were made in the lateral plane.
Measurement of vascular dynamics
When the blood plasma is fluorescently labeled, RBCs exclude the dye and appear as dark shadows moving against a fluorescent background. Line-scans placed along the central axis of a microvessel tracks RBC movement and reveals streaks in the resulting space-time plot. The slope of the RBC streaks is related to flow velocity, and was calculated using the Radon transform, as described previously. 25 An RBC velocity time series (1–3 min of data per microvessel) was then calculated by taking successive time windowed portions of the line scans using custom Matlab software. We reported the average RBC velocities over this time-series. Multi-segmented line-scan trajectories were used to sample many microvessels per field of view. 23 The RBC velocity time-series was processed with Fast Fourier Transform to extract the heart-rate frequency.
Vessel diameter measurements and branch order classifications were made in ImageJ software. For diameter measurements, the vessels of interest were first isolated in a maximally projected image that included the entirety of the vessel width in the Z dimension. These images were then analyzed using two approaches. In the first and more conventional approach, we measured the capillary width at one location along the vessel segment. The ImageJ line tool was used to obtain the fluorescence intensity profiles across the capillary width (Analyze tab>Plot profile). The intensity profile was normalized by subtracting the minimum value from all values in the intensity profile, and then dividing each value by the maximum of all values. The full-width at half max (FWHM) of the intensity profile was then calculated in pixels and then converted to micrometers. 23 To reduce human error, three diameter measurements were collected at the same location for individual capillary segments and the average was reported. In a second approach, we collected intensity profiles along the vessel length using a string of equidistant “cross-lines.” The FWHM was then measured from each of the intensity profiles, with an added interpolation to precisely locate the 0.5 value on either side of the normalized intensity profile to achieve subpixel accuracy. Each diameter measurement was separated by ∼2 μm of distance, providing between 6 and 58 separate measurements depending upon the length of the vessel. A visual inspection of the intensity plots was used to identify any outliers, which were excluded from the final mean diameter measurement. Outliers were often the result of cross-lines hitting a nearby vessel or the fluorescent signal being too dim in a region of the vessel. A mean diameter and standard deviation was then calculated from all remaining measurements taken for each vessel. This process was facilitated by a macro written in ImageJ.
Vessel length was measured from z stacks using the Simple Neurite Tracer Plugin in ImageJ (https://imagej.net/Simple_Neurite_Tracer). The length of vessel segments was measured between branch points. The algorithm follows regions of highest signal intensity between the branch points, providing a measure of vessel length in three-dimensions. Branch order classifications were made as follows: First order branches were the first microvessel branch emerging from the descending penetrating arteriole, and each subsequent bifurcation increased branch order by one. We denoted 1–3 branch order as pre-capillary arterioles, and branch order 4 or greater as capillaries.
Immunohistochemistry
All animals were perfusion-fixed through a trans-cardiac route after sacrifice by intraperitoneal injection of Euthasol (Patterson Veterinary). The blood was first cleared by perfusing with ∼100 mL of PBS. Once the fluid leaving the right atrium was clear, the animals were subsequently perfused with 20 mL of 4% (w/v) paraformaldehyde (PFA). The brain was then extracted and post-fixed overnight at 4°C. Brains were mounted and sliced into 50-µm thick coronal sections on a Vibratome series 1000 system and stored in PBS with 0.02% azide at 4°C.
For immunostaining, free-floating brain slices were incubated overnight at room temperature with primary antibodies diluted into an “antibody staining solution” consisting of PBS with 10% (v/v) goat serum (Vector Labs), 2% (v/v) Triton X-100 (Sigma), and 0.02% (w/v) sodium azide (Sigma). The following day, brain sections were washed for 30 min in PBS on an orbital shaker and incubated for 2 h in secondary antibody diluted in antibody staining solution. After secondary staining, slices were washed for 30 min in PBS, mounted on slides, air-dried for 30 min, and finally sealed with Fluoromount-G (Southern Biotechnology Associates Inc.) and a No. 1 glass coverslip (Corning).
To immunostain for pericytes, primary anti-CD13 antibody from rat (M101-3; 1:500 dilution; MBL Life Sciences) was used in conjunction with secondary anti-rat Alexa 594 (A11007; 1:1000 dilution; Invitrogen). Previously, we showed that CD13 labeling, when combined with the morphologic criteria used here, identifies pericytes with greater sensitivity and specificity than other available antibodies, including those for PDGFRβ and NG2. 26 To determine microvessel density in brain slices, anti-collagen IV from rabbit (ab19808; 1:250 dilution; Abcam) was used in conjunction with secondary anti-rabbit Alexa 350 (A11046; 1:200 dilution; Life Technologies). Prior to immunostaining with collagen IV, slices were incubated in PBS with 0.125% trypsin (T4049; Sigma) for 1 h at 37°C followed by a 1-h wash in PBS for antigen retrieval. 26
Quantification of immunohistochemistry
All images from immunohistochemistry procedures were collected using a 10×, 0.3 NA air objective (Olympus UPLFLN10X2) on an Olympus BX53 epifluorescence microscope equipped with a CCD camera (QI Click; QImaging). Images were collected from somatosensory cortex in order to coincide with regions where in vivo imaging was performed. We identified the approximate location of the thinned skull window by staying ∼1–4 mm lateral to the midline on the same brain hemisphere, and within −1.0 to −2.0 mm posterior from bregma. We used the Paxinos Mouse Brain Atlas to locate the general region of the cranial window by matching anatomical features (hippocampus and ventricle shape) to anterio-posterior coordinates. To compare capillary density between genotypes, 400× 400 µm regions of interest (ROI) were selected from the superficial 500 µm of cortex in each collagen IV-stained epifluorescence image collected (two to four images/animal) using ImageJ. The ROIs were selected with the investigator blinded to CD13 staining. The ROIs were then sharpened twice (Process tab > Sharpen), de-speckled three times (Process tab > Noise > Despeckle), and processed using the find edges function (Process tab > Find edges). These filters do not have specific parameter settings for the user to toggle. This processing created an image in which the vasculature was clearly outlined. The processed images were then loaded into AngioTool software, 27 the scale was calibrated to 0.98 pixels/µm in accordance with our microscope collection parameters, and the setting “remove small particles” and “fill holes” were selected. AngioTool provided data on the length of vessels in the ROI.
To determine pericyte coverage, the ROIs used for capillary density measurements were re-examined. The second channel of these ROIs held CD13 staining. The ROIs were converted to 8-bit grayscale in ImageJ, and a threshold was applied using the Otsu Threshold Plugin. The raw integrated signal (number of pixels above threshold) from the thresholded image was calculated to obtain the number of pixels stained by CD13. The same protocol was applied to the collagen-IV fluorescence channel. The area of CD13 staining was then divided by area of collagen IV staining in the same ROIs, and multiplied by 100, to obtain a measurement of % pericyte coverage. This analysis reports the area of vessel covered by pericytes using 2D images in line with other studies. 18
To determine pericyte density, pericyte somata were manually counted in the ROIs. A cell was deemed a pericyte using the following criteria: (1) the cell was CD13-positive and directly adjacent to a collagen IV-labeled capillary, (2) the cell possessed a small and well-defined ovoid cell body, (3) there was at least one process extending from the cell body that was comparable in brightness, but thinner in diameter than the cell body. 26 The total number of pericytes counted for each image was then divided by the total vessel length for the image. Pericyte per vessel length values from each image collected (two images/animal) were averaged together to provide a single number per animal.
Statistics
Comparisons of pericyte number/coverage and capillary density from histology between genotypes were analyzed with two-tailed t-tests using Graphpad Prism version 8. In vivo measurements of RBC velocity, lumen diameter and microvessel length were regressed on condition (mutation vs. control) using linear mixed effect models (LMEMs). The regression models were subsequently expanded to include condition, branch order (pre-capillary versus capillary) and the interaction between condition and branch order. If the interaction term had a P-value less than 0.15, it was kept in the model. Due to right skewness, RBC velocity was natural log transformed prior to regression analyses. In order to account for multiple blood vessel measurements within each mouse, a random intercept term was specified in each model. Estimated marginal means with 95% confidence intervals are reported. Differences in microvessel diameter between normocapnia and hypercapnia were analyzed using a Wilcoxon rank-sum test, and comparisons between genotypes were made using LMEM analysis. All analyses of in vivo imaging data were completed using R version 3.5.1.
Results
To visualize pericytes and the basement membrane of capillaries, we immunostained coronal brain slices for CD13 and collagen IV, respectively. 26 Images were collected from somatosensory cortex (upper 500 μm) of both PDGFRβ+/− and PDGFRβ+/+ mice to compare pericyte number, pericyte coverage and capillary density. We did not detect a decrease in total capillary density in somatosensory cortex of PDGFRβ+/− mice when compared to PDGFRβ+/+ controls (Figure 1(a) to (c)). The protruding ovoid cell bodies of capillary pericytes were clearly visible with CD13 labeling adjacent to the collagen IV-labeled vascular wall. We measured pericyte number by counting pericyte cell bodies, and normalized these counts to capillary length in the same regions of interest (Figure 1(d) and (e)). This revealed a 27% reduction of pericyte number in PDGFRβ+/− mice, compared to wild-type littermates (1.97 ± 0.82 pericyte somata per mm capillary in PDGFRβ+/− vs. 2.72 ± 1.01 pericyte somata per mm capillary in PDGFRβ+/+) (Figure 1(f)). This reduction in pericyte number did not translate into a reduction in pericyte coverage of the collagen IV-stained area (Figure 1(g)). This is in line with the concept that pericytes remodel their extensive processes to fill gaps when capillary coverage is incomplete. 28
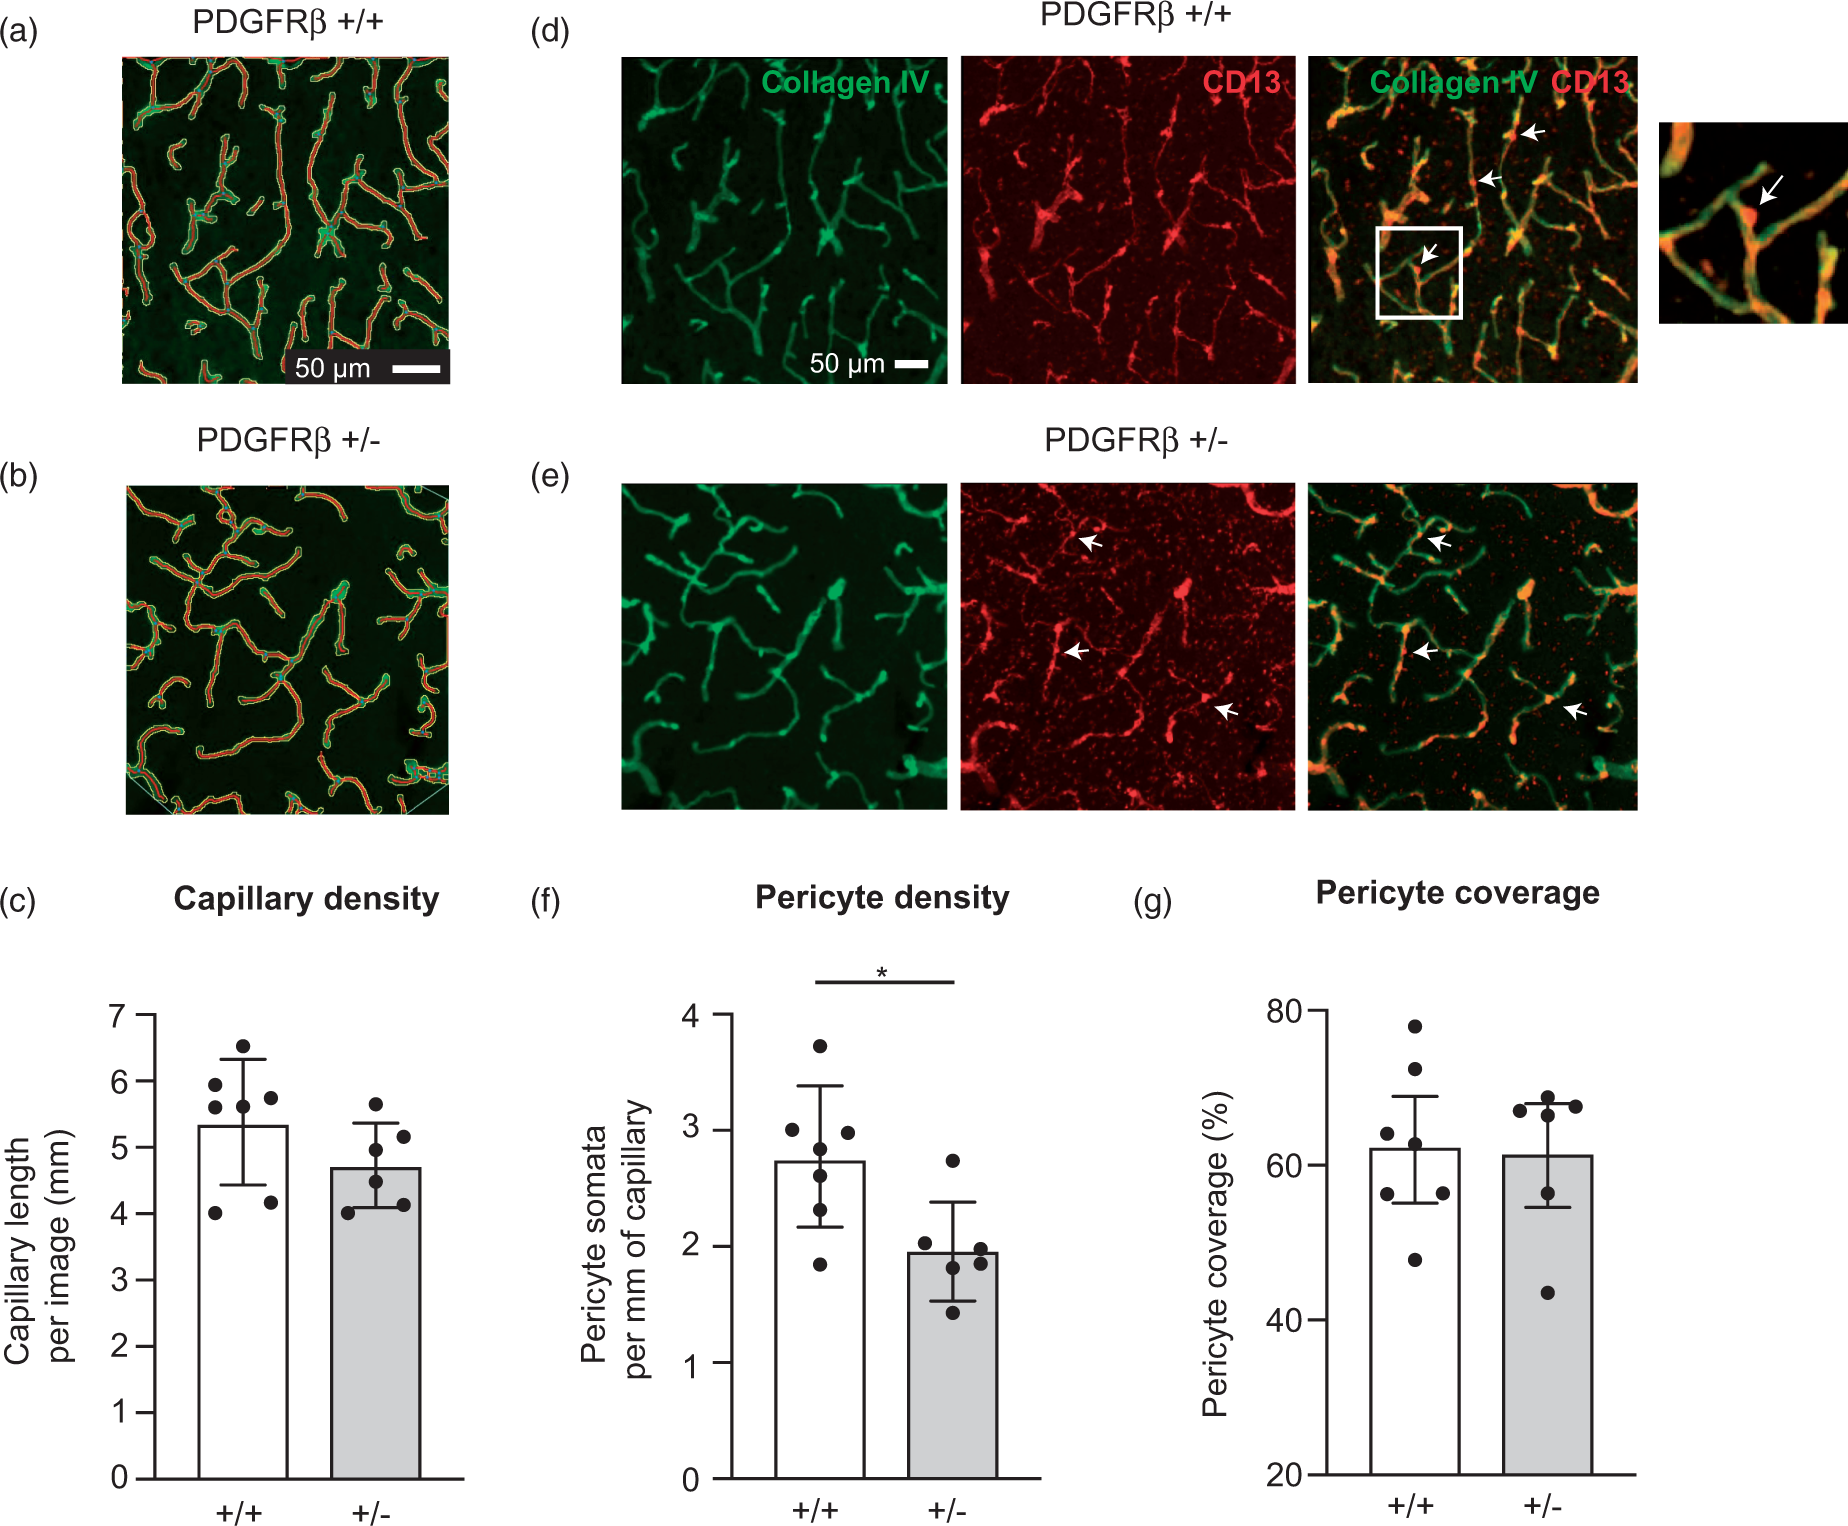
Capillary and pericyte density in aged PDGFRβ+/− mice. (a–c) Comparison of total collagen IV-labeled capillary length between PDGFRβ+/+ (n = 7) and PDGFRβ+/− (n = 6) mice. Images show vascular skeletons created in AngioTool during image analysis. Capillary length = 5.37 ± 0.35 mm and 4.73 ± 0.26 mm per image for PDGFRβ+/+ and PDGFRβ+/− mice, respectively (P = 0.18; unpaired t-test). (d–e) Representative images of collagen IV and CD13 labeled tissues from PDGFRβ+/+ and PDGFRβ+/− mice, with white arrows indicating examples of pericyte somata that would be counted (see inset for magnified view). (f) Number of pericyte somata per unit length of capillary. Pericyte density = 2.72 ± 0.20 pericytes/mm and 1.97 ± 0.176 pericytes/mm for PDGFRβ+/+ and PDGFRβ+/− mice, respectively (*P = 0.02; unpaired t-test). (g) Pericyte coverage of capillaries, calculated from area of CD13 staining and area of collagen IV staining. Pericyte coverage = 63 ± 4% and 62 ± 4% for PDGFRβ+/+ and PDGFRβ+/− mice, respectively (P = 0.88; unpaired t-test). Data presented as mean ± SD.
To understand how a 27% loss of pericyte number affects cerebral blood flow, we imaged vasodynamics of cortical microvessels using in vivo two-photon microscopy. Imaging was performed through thinned skull windows to minimize disruption of the intracranial environment. We focused on microvessels in the upper 200 μm of somatosensory cortex where imaging quality was optimal through a thinned skull. We detected a trend toward increased average basal RBC velocity in PDGFRβ+/− mice compared to wild-type (Figure 2(c) and (d)). This effect was consistent as all six PDGFRβ+/− mice examined had generally higher levels of RBC velocity than PDGFRβ+/+ mice (Supplementary Figure 1(a)). However, the effect did not reach statistical significance using linear mixed effects model analysis (Table 1a, left).
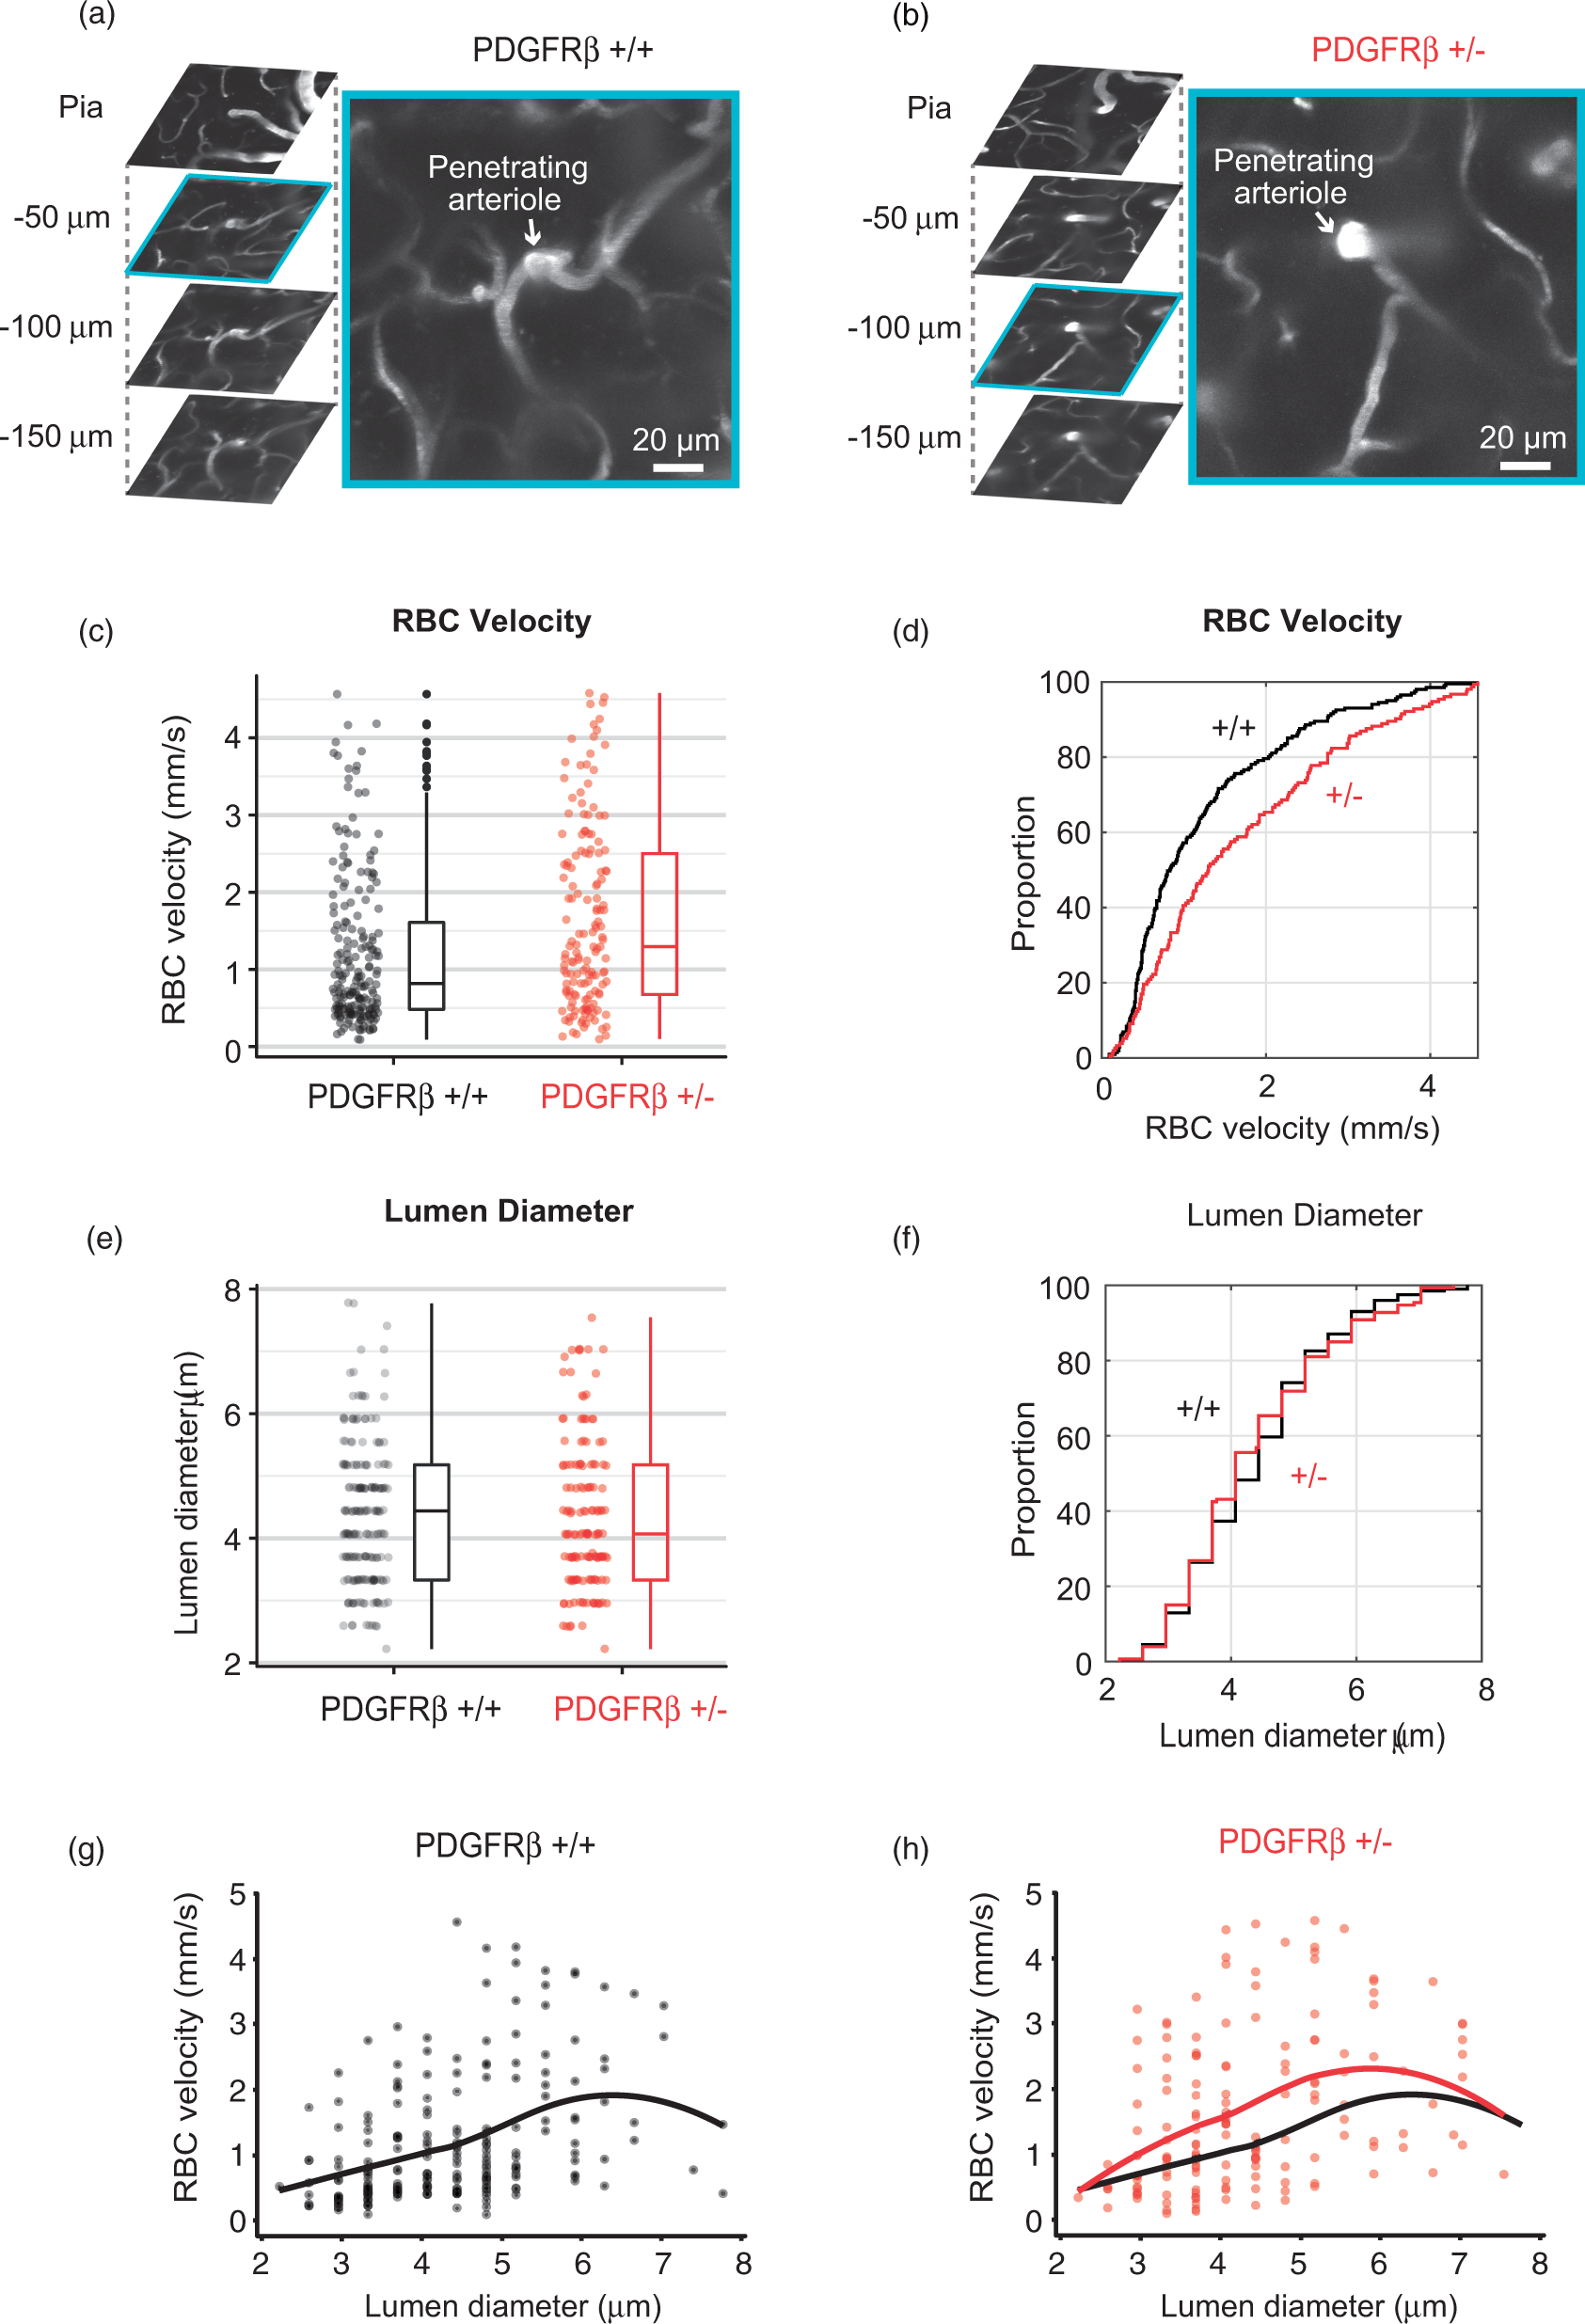
Microvascular flow differences in aged PDGFRβ+/− mice. (a, b) Representative in vivo two-photon image stacks of cortical vasculature from PDGFRβ+/+ and PDGFRβ+/− mice. A magnified view of a penetrating arteriole cross-section and pre-capillary arteriole offshoots (−75 to −100 µm of depth) is shown for both genotypes. (c, d) Scatter plot, box plot, and cumulative distribution plot of RBC velocity between PDGFRβ+/+ (n = 200 capillaries) and PDGFRβ+/– (n = 154 capillaries) mice. (e, f) Scatter plot, box plot, and cumulative distribution plot of microvessel diameter between PDGFRβ+/+ and PDGFRβ+/− mice. (g, h) Scatter plots showing basal RBC velocity as a function of lumen diameter in PDGFRβ+/+ and PDGFRβ+/− mice. Pearson’s correlation: r = 0.45, P < 0.0001, n = 200 for PDGFRβ+/+; r = 0.40, P < 0.0001, n = 154 for PDGFRβ+/−. A localized smoothing curve is overlaid on each scatter plot.
LMEM results, blood vessel velocity and diameter.
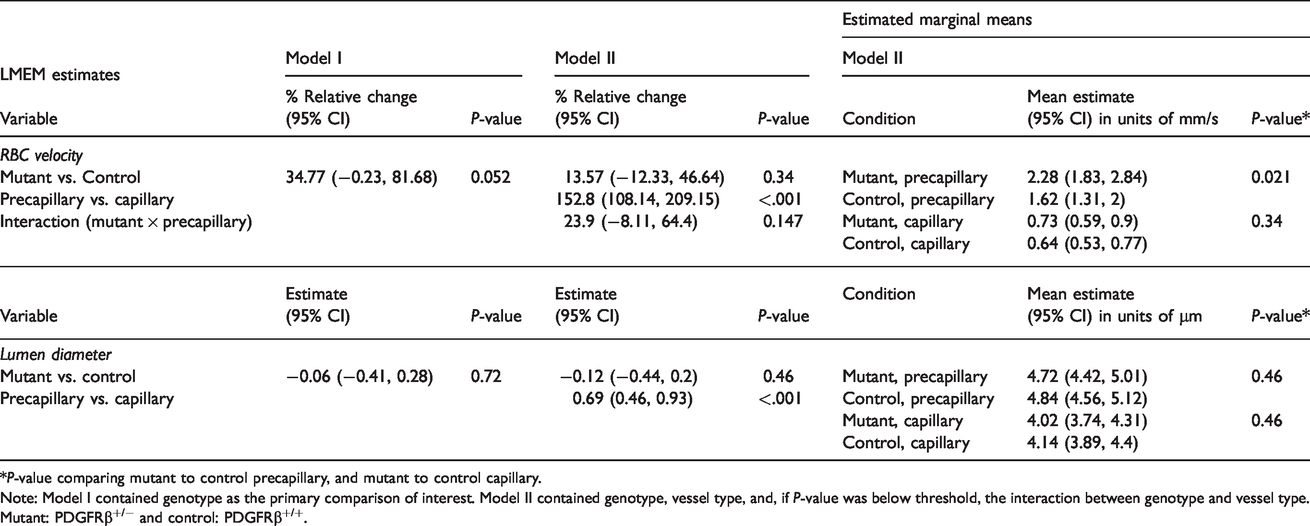
*P-value comparing mutant to control precapillary, and mutant to control capillary.
Note: Model I contained genotype as the primary comparison of interest. Model II contained genotype, vessel type, and, if P-value was below threshold, the interaction between genotype and vessel type. Mutant: PDGFRβ+/− and control: PDGFRβ+/+.
We further compared whether microvessel diameters differed between genotype. Lumen diameter was taken at a single location for each vessel segment coinciding to where RBC velocity was collected. However, no significant differences in lumen diameter could be detected between genotypes (Figure 2(e) and (f), Table 1b left, and Supplementary Figure 1(b)). As expected, there was a weak but significant positive correlation between vessel diameter and RBC velocity with both genotypes, i.e. microvessels of larger diameter flowed at higher rates (Figure 2(g) and (h)). This diameter–velocity relationship was strongest with microvessels that were 3–5 μm in diameter, but absent with vessels beyond 5 μm in diameter, consistent with past studies.29,30 This fundamental vasodynamic relationship provided a quality control for our in vivo measurements.
To determine whether distinct microvascular zones were affected by PDGFRβ+/− mice, we divided our data set into pre-capillary arterioles (1st to 3rd branch order from penetrating arteriole) and capillaries (4th branch order and beyond) (Figure 3(a)). This distinction is important because low order vessels are more likely to be dynamically contractile and are covered by ensheathing pericytes that express α-smooth muscle actin (α-SMA), while higher order vessels are covered by capillary pericytes that express little to no α-SMA.31,32 Pre-capillary arterioles also exhibit higher RBC velocity and slightly larger diameters than capillaries under basal conditions (Supplementary Figure 2). We found that pre-capillary arterioles in PDGFRβ+/− mice exhibited a significantly higher RBC velocity compared to PDGFRβ+/+, whereas capillaries showed a trend toward increased flow velocity, but did not reach statistical significance (Figure 3(b) and Table 1a, right). We did not detect a difference in vessel diameter between genotypes with either pre-capillary or capillary groups (Figure 3(c) and Table 1b, right). To determine whether increased RBC velocity might be due to faster heart rates, we assessed the heart-rate peak from the blood flow velocity frequency spectrum. Heart-rate was not different between PDGFRβ+/− and PDGFRβ+/+ mice (7.31 ± 0.196 Hz vs. 7.51 ± 0.270 Hz; mean ± S.D.). Further, animal age was not a factor leading to increased RBC velocity in PDGFRβ+/− mice, as a similar age range was used for both genotypes (Supplementary Figure 1(c) and (d)).
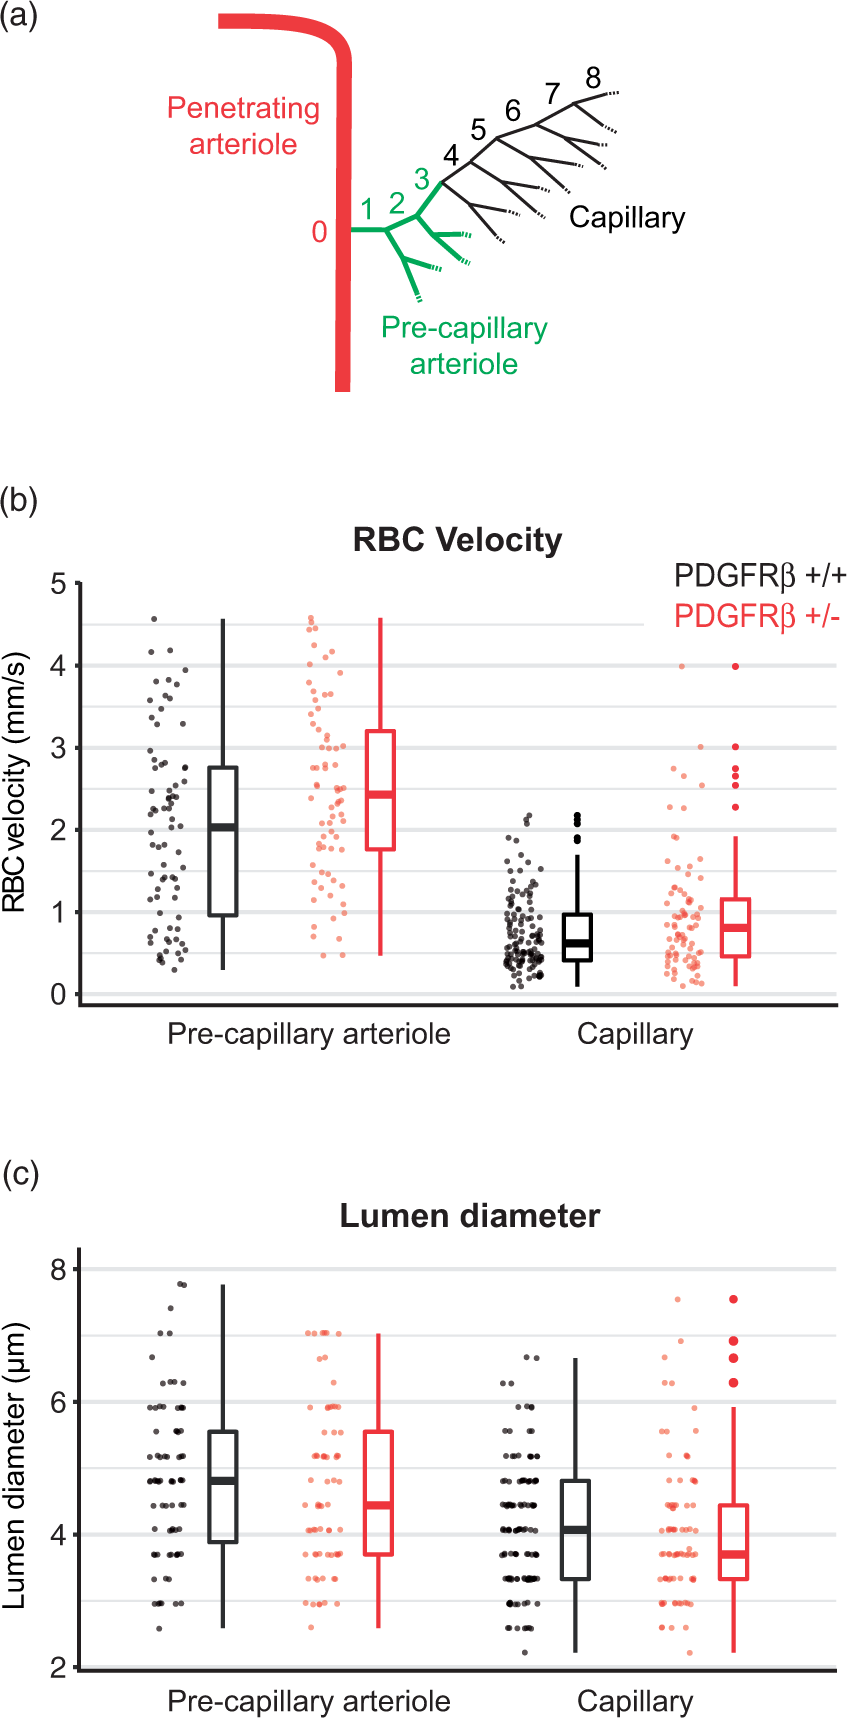
Microvascular flow in pre-capillary arterioles versus capillaries. (a) Schematic showing the division of pre-capillary arterioles (green; 1st–3rd order) and capillaries (black; ≥4th order) branches from a penetrating arteriole. (b) Comparison of RBC velocity between pre-capillary arterioles (n = 75 vessels in PDGFRβ+/+ and 71 vessels in PDGFRβ+/− mice) and capillaries (n = 125 vessels in PDGFRβ+/+ and 83 vessels in PDGFRβ+/− mice). (c) Comparison of lumen diameter between pre-capillary arterioles and capillaries.
Individual brain microvessels can vary in width along their length. Measurement of diameter at single locations along a microvessel might overlook this variance. To address this possibility, we collected a string of diameter measurements along the entire vessel for more comprehensive sampling (Figure 4(a) to (c)). 33 These diameter measurements were averaged to obtain a representative mean diameter for each vessel. However, no difference in mean diameter was detected for either pre-capillary arterioles or capillaries using this rigorous approach (Figure 4(d) and Table 2a). We also compared the standard deviation of diameters, which would be expected to increase if there was greater heterogeneity of microvessel width (Figure 4(e)). The median standard deviation appeared to be slightly higher among the PDGFRβ+/− mice in pre-capillary arterioles. We further measured the length of pre-capillary arterioles and capillaries to test the idea that microvessels in PDGFRβ+/− were shorter and therefore conveyed less resistance. However, we found no difference in microvessel length between genotypes (Figure 4(f) and Table 2b).
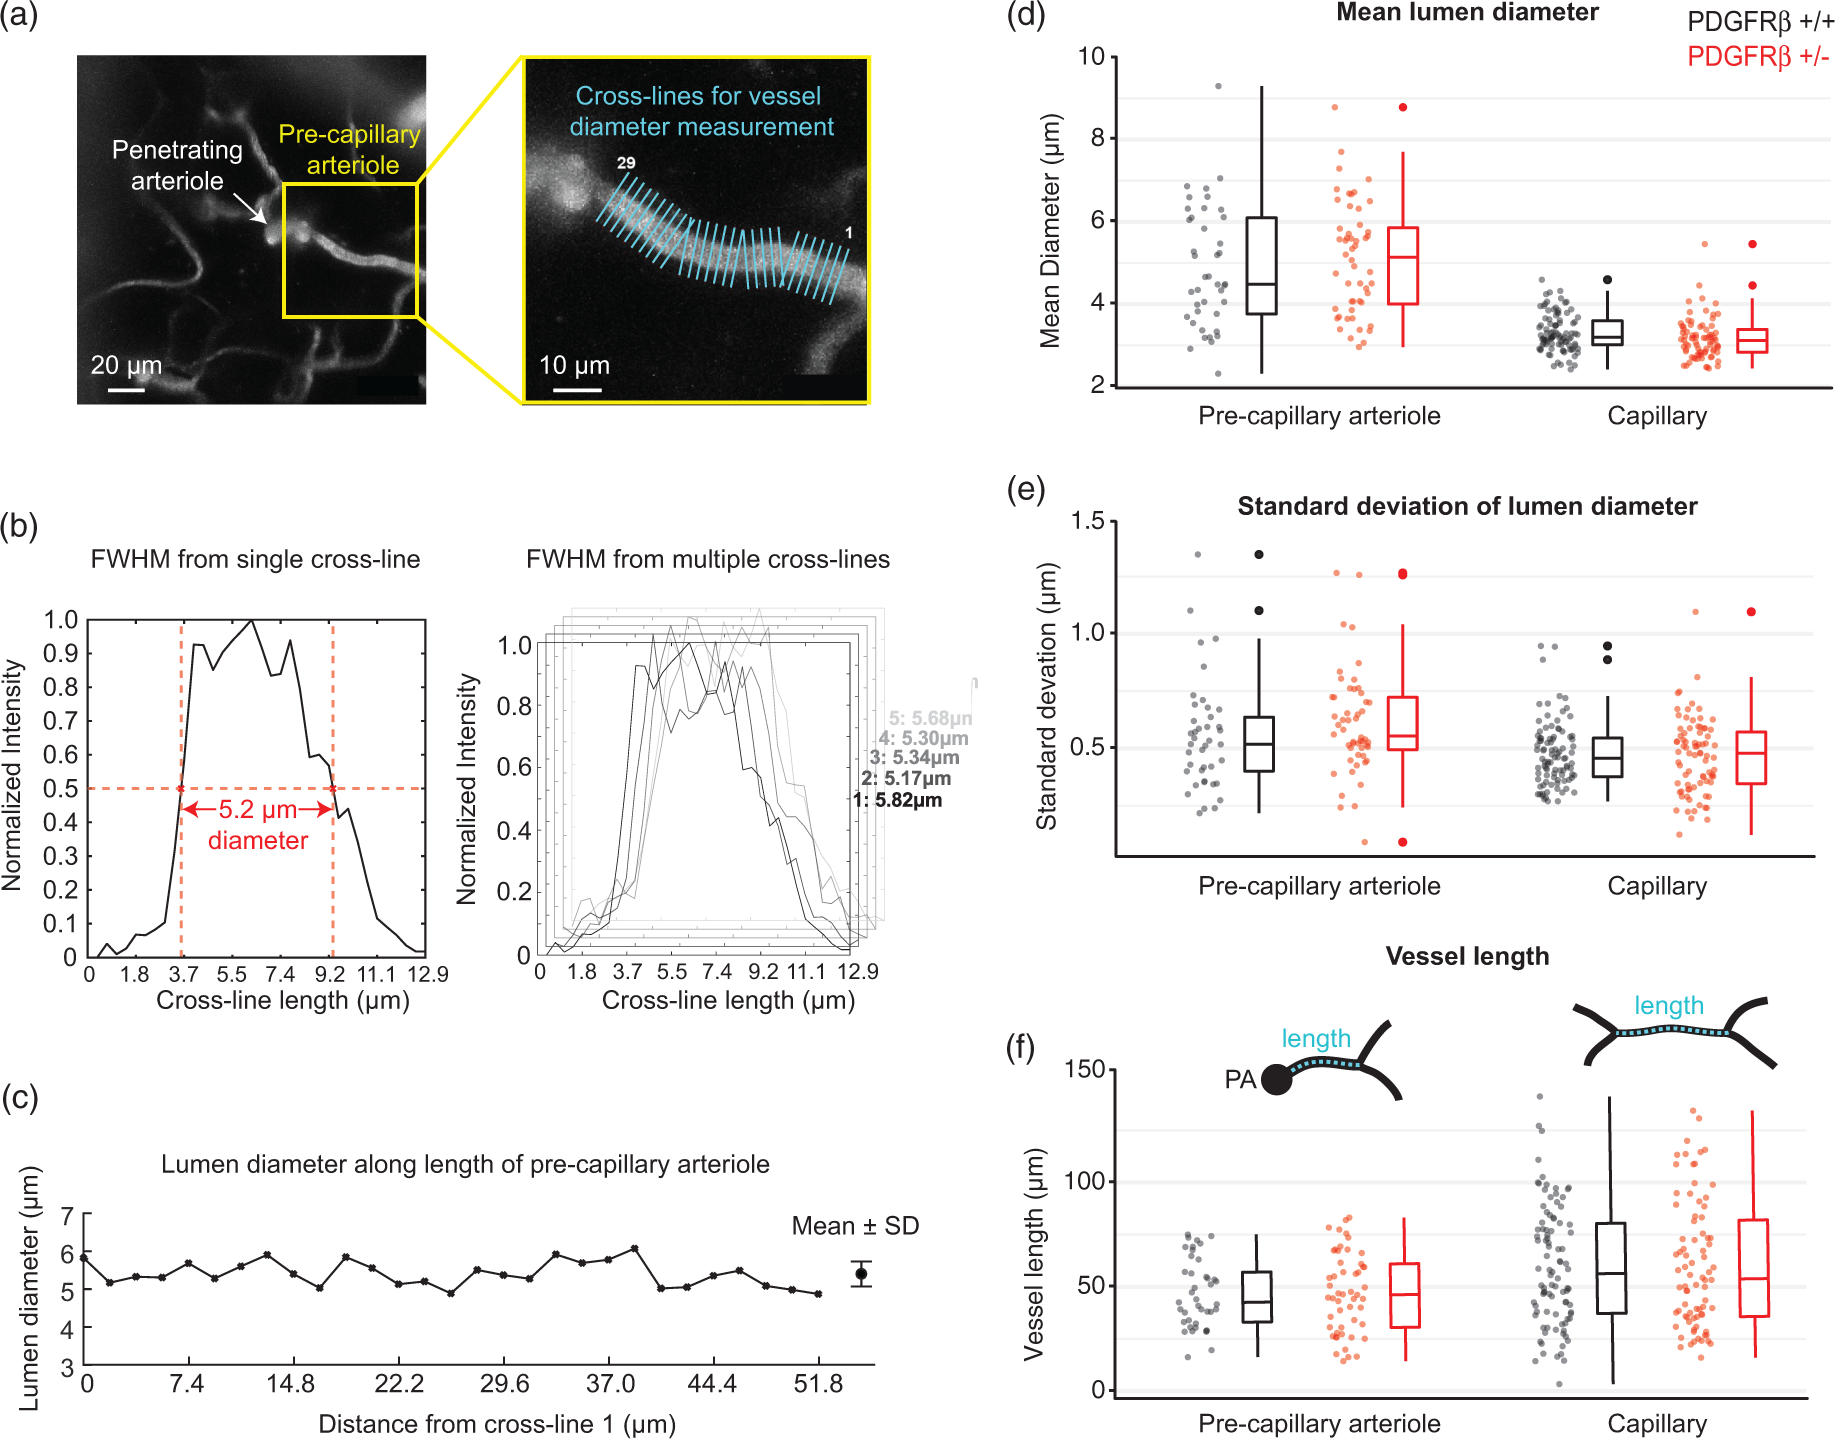
Comparison of mean microvessel diameter and length. (a) Example of a pre-capillary arteriole (from PDGFRβ+/+) with multiple, equidistant cross-lines used to obtain intensity profiles for lumen diameter measurement. (b) Intensity profile for a single cross-line (left) within a string of multiple cross-lines (right). (c) Lumen diameter plotted as function of distance from the first cross-line for the depicted pre-capillary arteriole. All values were averaged to obtain a single mean diameter value per microvessel. (d) Comparison of mean diameter between pre-capillary arterioles (n = 41 vessels in PDGFRβ+/+ and 52 vessels in PDGFRβ+/− mice) and capillaries (n = 94 vessels in PDGFRβ+/+ and 80 vessels in PDGFRβ+/− mice). (e) Standard deviation of diameters for each microvessel examined. (f) Comparison of pre-capillary arteriole and capillary length between genotypes. PA: penetrating arteriole cross-section.
LMEM results, mean blood vessel diameter and length.
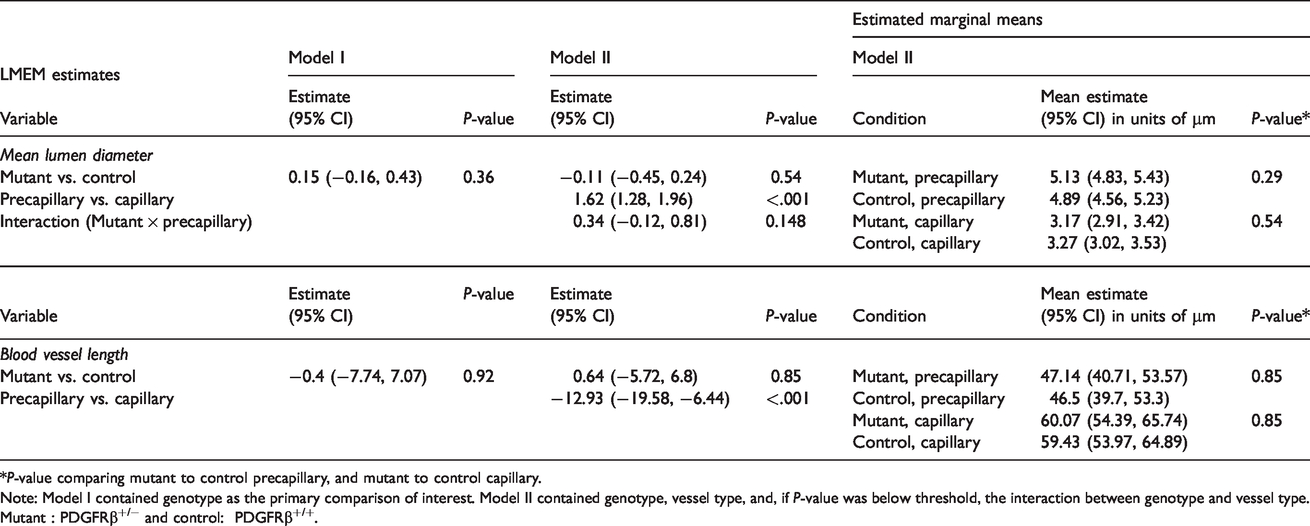
*P-value comparing mutant to control precapillary, and mutant to control capillary.
Note: Model I contained genotype as the primary comparison of interest. Model II contained genotype, vessel type, and, if P-value was below threshold, the interaction between genotype and vessel type. Mutant : PDGFRβ+/− and control: PDGFRβ+/+.
Finally, to determine whether microvascular reactivity was intact in aged PDGFRβ+/− mice, we measured the vessel diameter response to hypercapnia. Although both dilations and constrictions are possible with hypercapnia, we observed an average diameter increase with both pre-capillary arteriole and capillaries when animals were transitioned from normoxic to hypercapnic conditions (Figure 5(a) and (b)), in line with previous studies.34,35 However, the extent of hypercapnic vasodilation observed between PDGFRβ+/− mice and PDGFRβ+/+ mice was not statistically different (Figure 5(c)).

Effect of hypercapnia on microvessel diameter. (a) Example of pre-capillary arteriole reactivity during exposure to hypercapnia (n = 45 vessel from 4 PDGFRβ+/+ mice, and n = 35 vessels from 3 PDGFRβ+/− mice). #P < 0.05 for comparison against normocapnia; Wilcoxon test. P = 0.45 for comparison between genotypes; LMEM analysis. (b) Example of capillary reactivity during exposure to hypercapnia (n = 39 vessels from 4 PDGFRβ+/+ mice, and n = 25 vessels from 3 PDGFRβ+/− mice). #P < 0.05 for comparison against normocapnia; Wilcoxon test. P = 0.54 for comparison between genotypes; LMEM analysis.
Discussion
In this study, we examined the effect of pericyte deficiency on cortical microvascular structure and function in aged PDGFRβ+/− mice. Compared to wild-type littermate controls, we found a 27% loss of pericyte number, i.e. fewer cell somata, but largely intact pericyte coverage of the endothelium. With this extent of pericyte loss, we detected no change in microvascular density, diameter, length or vasoreactivity to hypercapnia. However, an increase in basal blood flow velocity was observed, and was most evident in lower branch order microvessels corresponding to pre-capillary arterioles. Collectively, these results suggest that although cerebrovascular structure and reactivity to hypercapnia are resilient to mild decrease in pericyte number, altered dynamics of basal microvascular flow can still persist.
Our findings have implications for the consequence of mild pericyte loss in the aged brain. Two recent human neuropathological studies quantified numbers of pericyte somata and reported similar levels of pericyte decrease as we have observed in PDGFRβ+/− mice. In one study, Alzheimer’s disease (AD) patients with APOE3 genotype exhibited a 30% decrease in PDGFRβ-positive pericyte somata compared to non-AD controls. 10 This extent of pericyte loss was associated with activation of CypA-MMP9 in pericytes, which is a trigger for BBB breakdown. 36 Another study reported ∼25% decrease in NG2-positive pericyte somata in AD patients. This was associated with greater amyloid β burden, but no difference in microvascular length. 15 Our data from the PDGFRβ+/− mouse model suggest that a 25–30% decrease in pericyte number is sufficient to alter microvascular flow rates, and could evade detection by clinical imaging modalities. With abnormally high flow speeds, oxygen extraction has been predicted to be reduced, as well as the cerebrovascular reserve available to the brain during times of stress or increased metabolic demand. 37 In addition, persistent flow increases may cause chronic alterations to the microvascular wall as seen with hypertension. 38 Future studies are needed to examine how chronically increased capillary flow alters neuronal function or tissue oxygenation.
The reason for increased RBC velocity in PDGFRβ+/− mice remains elusive. The most straightforward explanation is a change in tone at the pre-capillary level, especially considering the importance of the pre-capillary zone in initiation of conductive vascular responses.5,39,40 It was therefore surprising that no obvious lumen diameter changes could be detected. One possibility is the presence of small, heterogeneously distributed dilations within the microvasculature that could have a significant impact on flow resistance if accumulated. We observed a slightly higher standard deviation in diameters of pre-capillary arterioles of PDGFRβ+/− mice, consistent with this idea. However, our ability to detect small differences in microvessel diameter remains limited by the resolution of in vivo optical imaging, and it is possible that small, unresolvable dilations are responsible for increased flow rate. A further challenge is the relatively large variance in microvascular diameter (3–7 μm), which makes it difficult to discern genotype-specific effects in diameter between different mice.
A previous study by Bell et al. used a similar pericyte soma counting approach to evaluate aged, 14–16 months old PDGFRβ+/− mice. By counting NG2-positive somata and normalizing to CD31-positive area, they arrived at a more severe pericyte loss of ∼70%, compared to age-matched wild-type levels. 18 Additionally, a study by Kisler et al. showed no basal flow change in young PDGFRβ+/− mice with 25% reduction in pericyte number and coverage, 19 with age-dependent trajectory toward cerebral hypoperfusion rather than hyperperfusion. 18 The reason why a more severe phenotype was observed by these past studies remains unresolved. Differences in source of the mice may be one explanation for the discrepant findings. Whereas our mice were on equal parts 129S4 and 129S1 backgrounds, mice used in Bell et al. 18 were predominantly kept on the 129S1 background. 18 The 129S1 and 129S4 lines exhibited genetic differences at 5 of 86 randomly selected genetic markers in one study, yet multiple studies show they are phenotypically similar.41,42 In addition to background strain, some of the phenotypic differences we observed could be explained by genetic drift or by differences in the animal environment (such as diet, nesting, and husbandry methods). PDGFRβ signaling appears to be essential for neuroprotection and tissue repair after stroke, 43 suggesting that additional pathologies in PDGFRβ+/− mice induce or exacerbate a cerebrovascular phenotype. Thus, cerebrovascular pathology in PDGFRβ+/− mice can vary between laboratories, highlighting the importance of phenotyping the mouse line on-site prior to investigation.
There are some limitations in this study. First, we did not confirm whether there was a deficiency in expression of PDGFRβ in our mouse line. This was assumed because pericyte loss was detected, albeit less severe than expected. Differences in degree of PDGFRβ expression may underlie variable phenotypes seen between labs. Second, our blood flow and microvascular density measurements were collected only from upper layers of cortex using an approach distinct from the whole brain autoradiographic methods used by Bell et al. 18 This limitation in imaging depth was due to use of the thinned-skull window where light penetration is more restricted. However, our measurements of microvessel density from histological sections were collected over a greater cortical depth and still revealed no difference in capillary density. Third, we did not measure blood pressure or blood gas in our mice, even though studies from Bell et al. 18 did not reveal differences in either of these parameters between aged PDGFRβ+/− mice and wild-type. However, it remains possible that blood pCO2 levels differ in PDGFRβ+/− mice during a hypercapnic challenge. Finally, prior studies in pericyte-deficient mice showed defects in the cerebrovascular response to sensory stimuli.18,19 Here, we found that capillary responses to hypercapnia in PDGFRβ+/− animals were comparable to wild-type, suggesting that vascular reactivity is intact. However, hypercapnia and sensory-evoked vasodilation rely on distinct mechanisms, leaving it open as to whether neural-astroglial signaling during neurovascular coupling is normal with mild pericyte deficiency. Further, our studies tested a relatively strong hypercapnic challenge leaving the possibility that differences could emerge with milder or shorter challenges.
In summary, mild pericyte loss at levels reported in clinical AD can be associated with microcirculatory disturbance despite lack of overt changes to vascular structure and reactivity to hypercapnic challenge. Further studies are needed to understand how increased basal blood flow velocity affects vascular health, oxygen delivery and neuronal function.
Supplemental Material
JCB900543 Supplemental Figures - Supplemental material for Mild pericyte deficiency is associated with aberrant brain microvascular flow in aged PDGFRβ+/− mice
Supplemental material, JCB900543 Supplemental Figures for Mild pericyte deficiency is associated with aberrant brain microvascular flow in aged PDGFRβ+/− mice by Ashley N Watson, Andree-Anne Berthiaume, Anna V Faino, Konnor P McDowell, Narayan R Bhat, David A Hartmann and Andy Y Shih in Journal of Cerebral Blood Flow & Metabolism
Footnotes
Acknowledgements
We thank Kassandra Kisler and Berislav Zlokovic for helpful comments on the manuscript.
Funding
The author(s) disclosed receipt of the following financial support for the research, authorship, and/or publication of this article: Our work is supported by grants to AYS from the NINDS (R21AG063031, R21NS106138, R01NS097775). NRB is supported by the NIA (AG059422). DAH is supported by an NIH-NINDS F30NS096868.
Declaration of conflicting interests
The author(s) declared no potential conflicts of interest with respect to the research, authorship, and/or publication of this article.
Authors’ contributions
Supplemental material
Supplemental material for this article is available online.
References
Supplementary Material
Please find the following supplemental material available below.
For Open Access articles published under a Creative Commons License, all supplemental material carries the same license as the article it is associated with.
For non-Open Access articles published, all supplemental material carries a non-exclusive license, and permission requests for re-use of supplemental material or any part of supplemental material shall be sent directly to the copyright owner as specified in the copyright notice associated with the article.