
Abstract
Predicting tissue outcome early after stroke is an important goal. MRI >3 h accurately predicts infarction but is insensitive to selective neuronal loss (SNL). Previous studies suggest that chronic-stage 11 C-flumazenil PET (FMZ-PET) is a validated marker of SNL in rats, while early-stage FMZ-PET may predict infarction. Whether early FMZ-PET also predicts SNL is unknown. Following 45-min distal MCA occlusion, adult rats underwent FMZ-PET at 1 h and 48 h post-reperfusion to map distribution volume (VT), which reflects GABA-A receptor binding. NeuN immunohistochemistry was performed at Day 14. In each rat, VT and %NeuN loss were determined in 44 ROIs spanning the hemisphere. NeuN revealed isolated SNL and cortical infarction in five and one rats, respectively. In the SNL subgroup, VT-1 h was mildly reduced and only weakly predicted SNL, while VT-48 h was significantly increased and predicted SNL both individually (p < 0.01, Kendall) and across the group (p < 0.001), i.e. the higher the VT, the stronger the SNL. Similar correlations were found in the rat with infarction. Our findings suggest GABA-A receptors are still present on injured neurons at the 48 h timepoint, and the increased 48 h VT observed here is consistent with earlier rat studies showing early GABA-A receptor upregulation. That FMZ binding at 48 h was predictive of SNL may have clinical implications.
Introduction
Predicting ischemic damage early after stroke is an important goal. Tissue infarction, i.e. pan-necrosis, can be accurately predicted by T2-weighted magnetic resonance imaging (MRI) as early as 3 h after stroke onset.1–3 A different type of neuronal damage, namely selective neuronal loss (SNL), has recently attracted renewed interest because it frequently affects the penumbra salvaged by early reperfusion (see Baron et al. 4 for review). SNL can follow either global or focal cerebral ischemia, 4 but here our focus will be post-stroke SNL. It consists of patches or more linear areas with few or no remaining neurons but preserved extracellular matrix and blood vessels, associated with local inflammation in the form of microglial activation and astrocytosis. 4 Given the current thrombectomy era where complete or near-complete recanalization is achieved in over 80% of patients with large vessel occlusion, 5 it would be important to predict the occurrence of SNL from the early post-recanalization stage in order to devise preventative therapies.
So far, however, no in vivo imaging approach has been shown to reliably predict SNL. 4 Thus, pathologically proven SNL was not detected on acute-stage or chronic-stage T2-weighted MRI in the rat.6–9 Molecular imaging targeting neuronal binding sites may hold greater promise. Thus, studies in baboons, 10 cats 11 and man 12 have consistently suggested that early-stage positron emission tomography (PET) using 11 C-flumazenil (FMZ) – a ligand selective for the central benzodiazepine receptor (cBZR), which is a component of the exclusively neuronal GABA-A receptor 13 – may predict infarction. In addition, chronic-stage FMZ-PET has been shown to be a reliable marker of SNL in the rat, 7 and has been widely used to map SNL in both non-human primates 14 and stroke patients.15–18 However, to this day, it is unknown whether early-stage FMZ can predict SNL. Here we make the hypothesis that early FMZ-PET quantitatively predicts SNL in rodents.
To test this hypothesis, dynamic FMZ-PET was obtained twice, at 1 h and 48 h, following transient 45 min distal middle cerebral artery (MCA) occlusion (MCAo) in spontaneously hypertensive rats (SHRs), a stroke model previously shown to induce either or both SNL and infarction on post-mortem.19,20 We then obtained NeuN immunohistochemistry at day 14 post-reperfusion to map neuronal damage. Kinetic modelling of dynamic FMZ-PET was carried out to obtain total distribution volume (VT), an index of specific binding, in a template of regions-of-interest (ROIs) covering the whole cerebral gray matter, 19 and an index expressing both extent and severity of neuronal damage was obtained from NeuN immunohistochemistry in the same set of regions-of-interest (ROIs) according to our previously validated semi-quantitative method.19,21 Both within- and across-subjects correlations between NeuN and FMZ VT values were assessed across the set of ROIs to test the hypothesis that altered local FMZ binding would predict eventual SNL in the same brain region.
In addition to VT, kinetic modeling also yielded the rate constant of transport from plasma to tissue (K1), an index of FMZ brain penetration closely related to local perfusion.10,11,22–24 As an ancillary analysis, we therefore tested the hypothesis that local perfusion changes may also predict SNL, because neuronal damage is a function of the severity of hypoperfusion during occlusion,15,19 and persistent post-recanalization hypoperfusion 25 as well as hyperperfusion26,27 are known to be potentially involved in neuronal death.
Methods
Overall study design
Adult male SHRs (n = 6) underwent 45-min distal MCAo 28 and FMZ-PET scans were initiated 1 h and 48 h post-reperfusion. The rationale for using this MCAo model, rat strain and MCAo duration has been discussed extensively in Hughes et al. 19 Voxel-based kinetic analysis of the FMZ dynamic PET images allowed mapping of VT and K1. Following perfusion-fixation at Day 14, immunohistochemistry using NeuN as neuronal marker was performed as described earlier. 19 For each timepoint, FMZ VT and K1 values obtained in 44 ROIs spanning the affected hemisphere and normalised to the unaffected hemisphere were compared to corresponding %NeuN loss values obtained in the same set of ROIs by means of correlation analysis.
This study was approved by the University of Cambridge Animal Welfare and Ethical Review Body. To comply with UK Home Office regulations, the study was designed to use the minimum number of animals required for scientifically sound results. To this end, the FMZ-NeuN relationship was to be tested not only across the group of subjects, but also within animals and according to a longitudinal design to increase power. Accordingly, a sample of six rats was judged adequate. All animals were treated in accordance with the UK Animals (Scientific Procedures) Act 1986 and the University of Cambridge Animal Welfare and Ethical Review Body.
Detailed accounts of the generic anaesthetic, surgical, PET and post-mortem procedures have been published previously,19,20,29 so only a summary will be given here.
The experiments have been reported in compliance with the ARRIVE guidelines (https://www.nc3rs.org.uk/arrive-guidelines).
Experimental procedures
General
Male ∼ 3-month-old SHRs weighing 280–330 g (Charles River, UK) were anaesthetized with N2O/O2 (0.7/0.3 L/min), augmented with isoflurane (4% for induction and 2% thereafter). Body temperature was maintained at 37.0 ± 0.5°C using a heated pad, and oxygen saturation was monitored using an oximeter. The main physiological variables, including arterial PO2, PCO2, pH, HCO3 and O2 saturation remained within normal ranges. Although not measured in these rats in order to avoid the added procedural complications – including blood loss – related to femoral artery cannulation, blood pressure is known to be significantly elevated by three months of age in SHRs.30,31
Transient MCAo
The distal clip MCAo model 28 as implemented in our laboratory was used to induce cortical SNL.19,20,29 As part of this model, 28 a loose ligature was placed around the right common carotid artery (CCA). The right MCA was exposed via a 2-mm burr hole and occluded with a micro-aneurysm clip (No 1, Johnson & Johnson), and the right CCA was permanently occluded. After 45 min, the clip was removed and the wound closed. As explained elsewhere, 19 restoration of blood flow was verified visually.
FMZ-PET
The 1-h post-reperfusion FMZ PET study was carried out while the animal was kept under anaesthesia as detailed above; for the PET study carried out 48 h after transient MCAo, animals were reanaesthetised as described above. For each FMZ-PET scan, a venous cannula was inserted in the tail vein for tracer delivery and the head was positioned in a purpose-built plastic frame incorporating ear bars and a bite bar at the centre of a microPET P4 scanner (Concorde Microsystems, Knoxville, TN). 11 C-FMZ was produced at very high specific activities from 11 C-iodomethane using a modified captive solvent method. High specific activity 11 C-FMZ (mean 219 MBq/nmol at injection time; range: 55–304 MBq/nmol) was injected as a 1 ml bolus. The mass of administered 11 C-FMZ was deliberately made as small and as similar as possible in all rats (mean: 1.4 nmol/kg; range 0.72-4.79 nmol/kg) by adjusting the injected activity (∼80 MBq). The PET data were acquired in list mode over 75 min post-injection, and subsequently binned into the following time frames: 10 × 0.5 + 5 × 1 + 15 × 2 + 7 × 5 min. Prior to emission scanning, an 11 min coincidence mode 68Ge transmission scan with a rotating point source was acquired for attenuation correction.
During FMZ PET data acquisition, three arterial blood samples ∼100 µl were taken from the femoral artery at 30, 40 and 60 min respectively. Samples were weighed and the activity assayed in a Genie 2000 well counter (Canberra Industries, Meriden, CT) cross-calibrated to the microPET P4. This allowed a metabolite-corrected input function to be determined by scaling a previously obtained FMZ metabolite-corrected arterial population curve (average from four rats) using the arterial blood samples taken during each scan.
Image processing
Images were reconstructed using the PROMIS 3D filtered backprojection algorithm (Kinahan and Rogers, 1989), implemented in-house for data from the microPET P4 scanner, into 180 × 180 × 151 voxels, with a voxel size of 0.5 × 0.5 × 0.5 mm3. A Hann window cutoff at the Nyquist frequency was incorporated into the Colsher and ramp reconstruction filters to give a spatial resolution of ∼2.3 mm FWHM. Corrections were applied for background, randoms, dead time, normalisation, attenuation, decay and sensitivity.
For each scan, an early (i.e. perfusion-weighted) PET image was obtained by summing the 0–5 min frames and this image was manually co-registered using the MPI Tool software package (Max Planck Institute, Cologne, Germany) to a T2-weighted MRI template obtained in a healthy SHR of similar age as used in this study. This allowed the dynamic PET images to be resliced into a standard 3D space using SPM2 (www.fil.ion.ucl.ac.uk/spm).
Using the dynamic PET images and metabolite-corrected input function as inputs, for each scan a K1 map was produced using the basis pursuit spectral analysis algorithm implemented in DEPICT (http:/www.bic.mni.mcgill.ca/∼rgunn/software.html), while Logan plot analysis implemented in PMOD (http://www.pmod.com/) was used to produce the VT map.
Post-mortem procedures
Following perfusion-fixation,
19
brains were harvested and postfixed in 4% paraformaldehyde (4°C), then transferred to phosphate-buffered saline containing 30% sucrose. Coronal sections (40 µm) spanning from bregma +3.7 to –6.8µmm were obtained and placed in Trizma (Sigma-Aldrich, St Louis, MO)
In order to assess SNL, consecutive sections were labeled with NeuN, a neuron-specific immunostain, as described in detail in Hughes et al. 19 Non-specific staining was negative in all studies.
ROI analysis of NeuN and FMZ
In order to allow within-subject comparison of the distribution of NeuN and FMZ VT and K1, we used the method described in detail elsewhere,19,21 where the same cytoarchitectonic-based ROI template extracted from Paxinos and Watson’s stereotaxic atlas 33 is used for the analysis of both data sets.
The template was applied onto eight coronal sections spanning the MCA territory in the antero-posterior direction and selected at the following locations relative to the bregma: +2.70, +1.00, −0.26, −0.92, −2.12, −3.14, −4.52 and −6.04 mm. 33 In total (per hemisphere), the ROI template comprised 39 cytoarchitectonally distinct cortical ROIs, four caudate/putamen ROIs and one thalamic ROI (44 ROIs in total).
The eight sections of interest were digitized at low magnification (×1.6) using the Lucia software and a digital Leica camera. The ROI template was then applied onto the eight sections, taking note of any tissue shrinkage and/or post mortem processing-related distortion. Digital images of each section with the superimposed ROIs were then acquired. The pathology within each ROI and each animal was scored using our validated visual assessment method.19,21 Briefly, for each ROI, two experienced scorers, blinded to the PET data, independently rated NeuN pathology, using a visual grading scale aimed to integrate pathology across the ROI. This scale comprises both a Severity score (0–10; 0 = normal NeuN staining relative to homologous ROI on unaffected side, 10 = maximally reduced NeuN staining, i.e. no stained neurons at all; with 1–9 being intermediate) and an Area score (0–10; 0 = no NeuN staining loss in any part of the ROI, 10 = whole ROI affected by NeuN staining loss, with 1–9 being intermediate extent relative to the corresponding contralateral ROI). For each ROI, the Area score was then multiplied by the Severity score, to yield an overall NeuN score expressing both the extent and degree of staining loss in the ROI, ranging from 0 to 100 (0 meaning normal; 100 meaning maximal pathology present throughout the entire ROI). Excellent inter-observer reproducibility for this scoring procedure has been reported before. 19 The scores provided by the two scorers were averaged to produce a final score for each ROI in each subject.
The eight coronal sections of the MRI template matching the eight anatomical sections used for the NeuN analysis were selected, the ROI template was imported onto these eight MRI sections, and the ROIs were then applied onto the co-registered FMZ maps to automatically obtain the mean VT and K1 value across the voxels present in each ROI.
Statistical analysis
In order to reduce inter-subject variability and to match the NeuN scores which express the staining loss within each ROI relative to the unaffected side, all VT and K1 ROI values were first normalized to the corresponding ROI values in the unaffected hemisphere.
Within-subject changes in normalised VT or K1 were assessed across the 44 ROI values against neutral, separately for each time-point, and then between-timepoints comparisons were performed. Data distribution was assessed using Lillieforth-corrected Kolmogorov–Smirnov normality tests. If distribution was normal, paired t-tests were used, and if distribution was significantly (p < 0.05) non-normal, non-parametric Wilcoxon sign rank tests were used.
The same approach was used to assess across-subject changes. To this end, for each of the 44 ROIs, we calculated the mean VT and K1 value across the rats, and then tested the obtained set of 44 mean ROI values first against neutral, and then between the two time-points. Again, Lillieforth-corrected Kolmogorov–Smirnov normality tests were performed, and depending on the results, paired t-tests or non-parametric Wilcoxon sign rank tests were used.
Given the inherently non-normal distribution of NeuN scores (range: 0–100%), the relationships between NeuN scores and normalised FMZ VT or K1 values were assessed across the 44 ROIs using non-parametric Kendall correlation. This was applied both to within-subject and across-subjects correlations, the latter using mean ROI values across the group.
Two-tailed p values were obtained, and whenever required, correction for multiple tests was applied to assess statistical significance (see Results). For the sake of completeness, trends will also be indicated for within-subject correlations.
Results
No subject died throughout the protocol, and all six subjects included in the study will be reported below.
NeuN results
The NeuN findings have been published previously. 19 In short, NeuN revealed isolated cortical SNL of varying severity in five rats and frank infarction in the remaining subject (rat 6). These findings are illustrated in Figure 1 and summarized in Table 1.
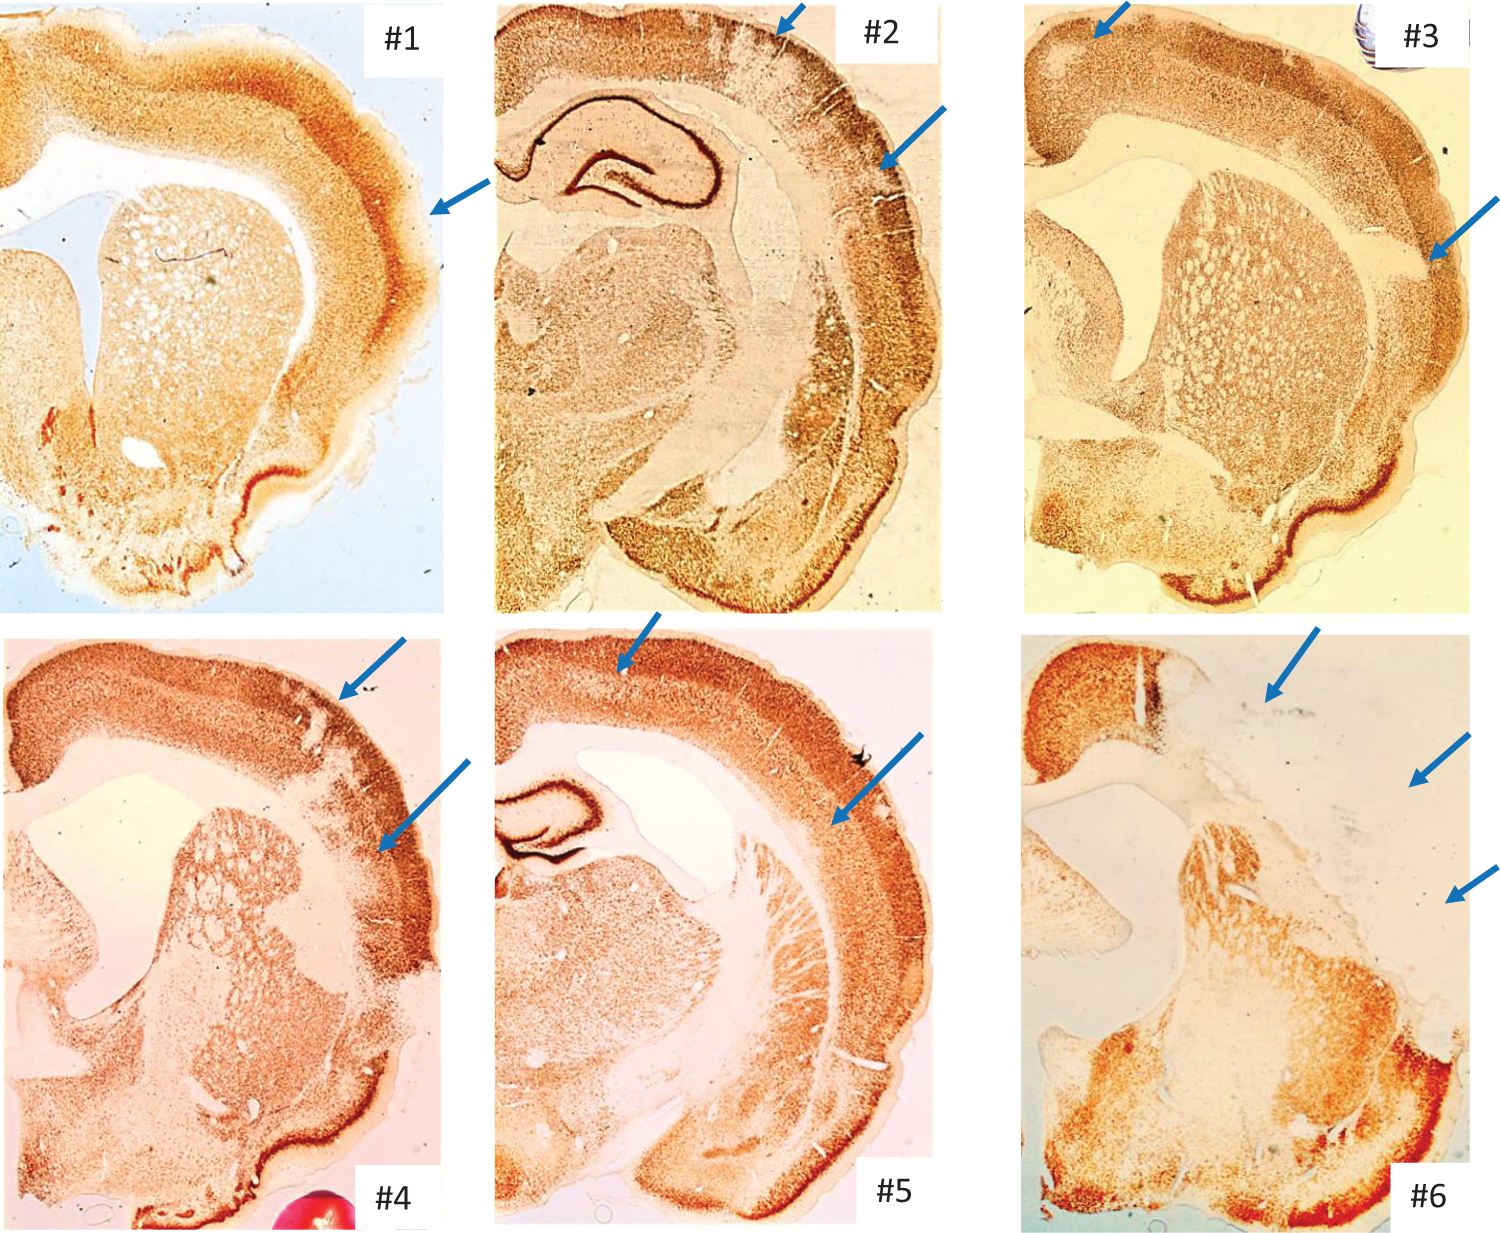
Illustrative NeuN coronal sections for each of the six study rats, showing patches of selective neuronal loss of varying intensity in rats 1–5, and extensive cortical infarction in rat 6.
Summary of pathology findings (degree of SNL or infarction, with the number of ROIs with significant damage out of 44 shown in brackets), and non-parametric correlations (Kendall’s tau) between NeuN scores and FMZ-PET variables in each rat (n = 44 ROIs per subject), and across rats 1–5 (shown in italics; see Methods and Results).
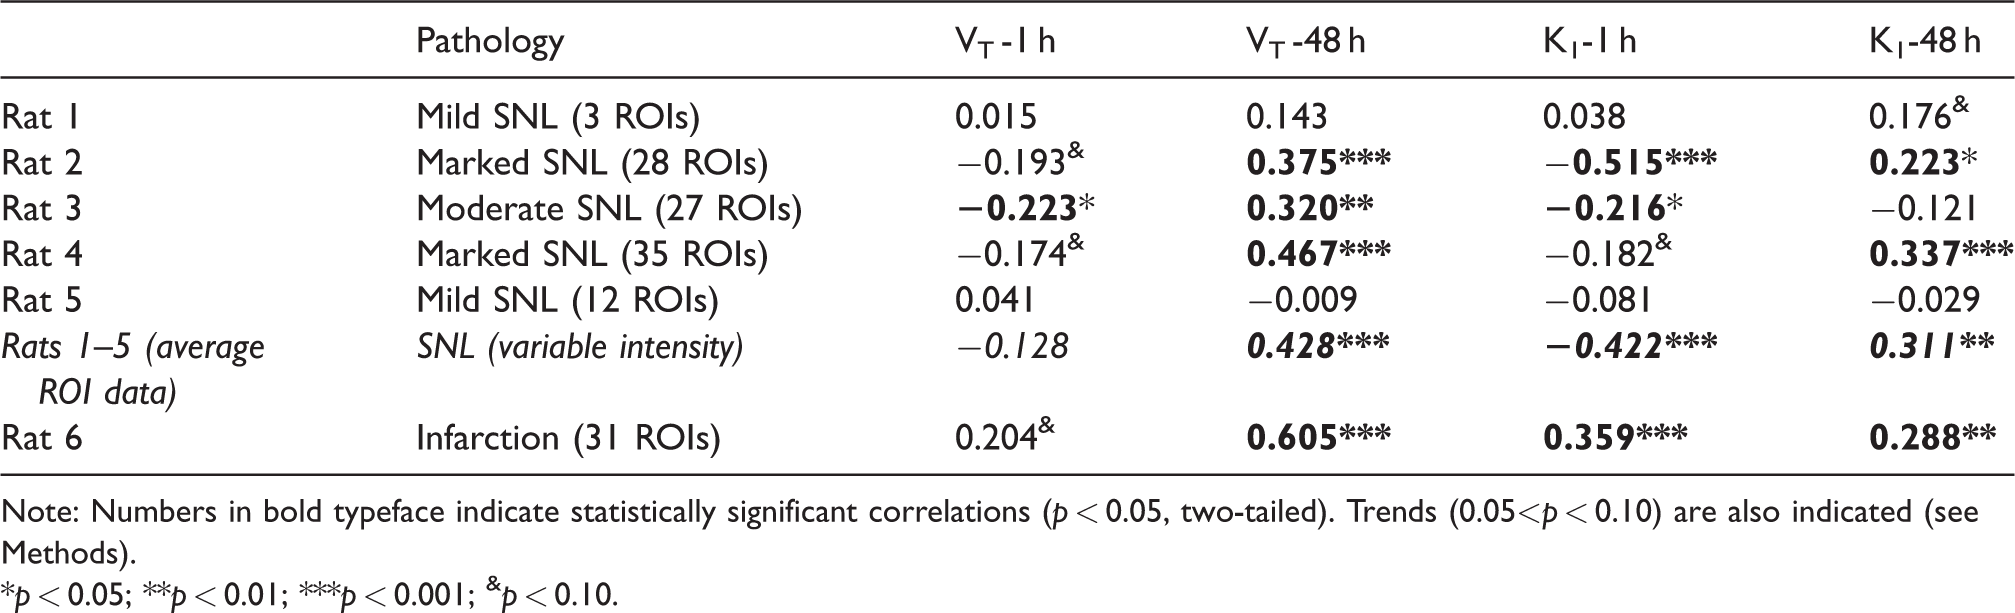
Note: Numbers in bold typeface indicate statistically significant correlations (p < 0.05, two-tailed). Trends (0.05<p < 0.10) are also indicated (see Methods).
*p < 0.05; **p < 0.01; ***p < 0.001; &p < 0.10.
FMZ VT results
In order to test our hypothesis which specifically relates to SNL (see Introduction), rat 6 that exhibited frank infarction – as opposed to isolated SNL in the remaining five rats – was analyzed separately.
We first assessed VT values for the group of five subjects with isolated SNL, following the approach detailed in Methods. As the mean normalized VT-1 h dataset significantly deviated from normality (p = 0.043), non-parametric tests were used for all VT and K1 analyses, for the sake of consistency. Furthermore, because three statistical tests were to be performed on the VT dataset – namely, assessment of each timepoint against neutral, and between-timepoint comparison, Bonferroni correction for multiple tests was applied. Accordingly, p < 0.017 was considered significant. Relative to neutral, normalised VT-1 h (mean and SD: 0.965 ± 0.042) was mildly but significantly decreased (p < 0.001; Wilcoxon), while VT-48 h (1.038 ± 0.041) was equally mildly but significantly increased (p < 0.001; Wilcoxon). Finally, VT-48 h was significantly higher than VT-1 h (p < 0.001; Wilcoxon). Figure 2(a) illustrates these findings.
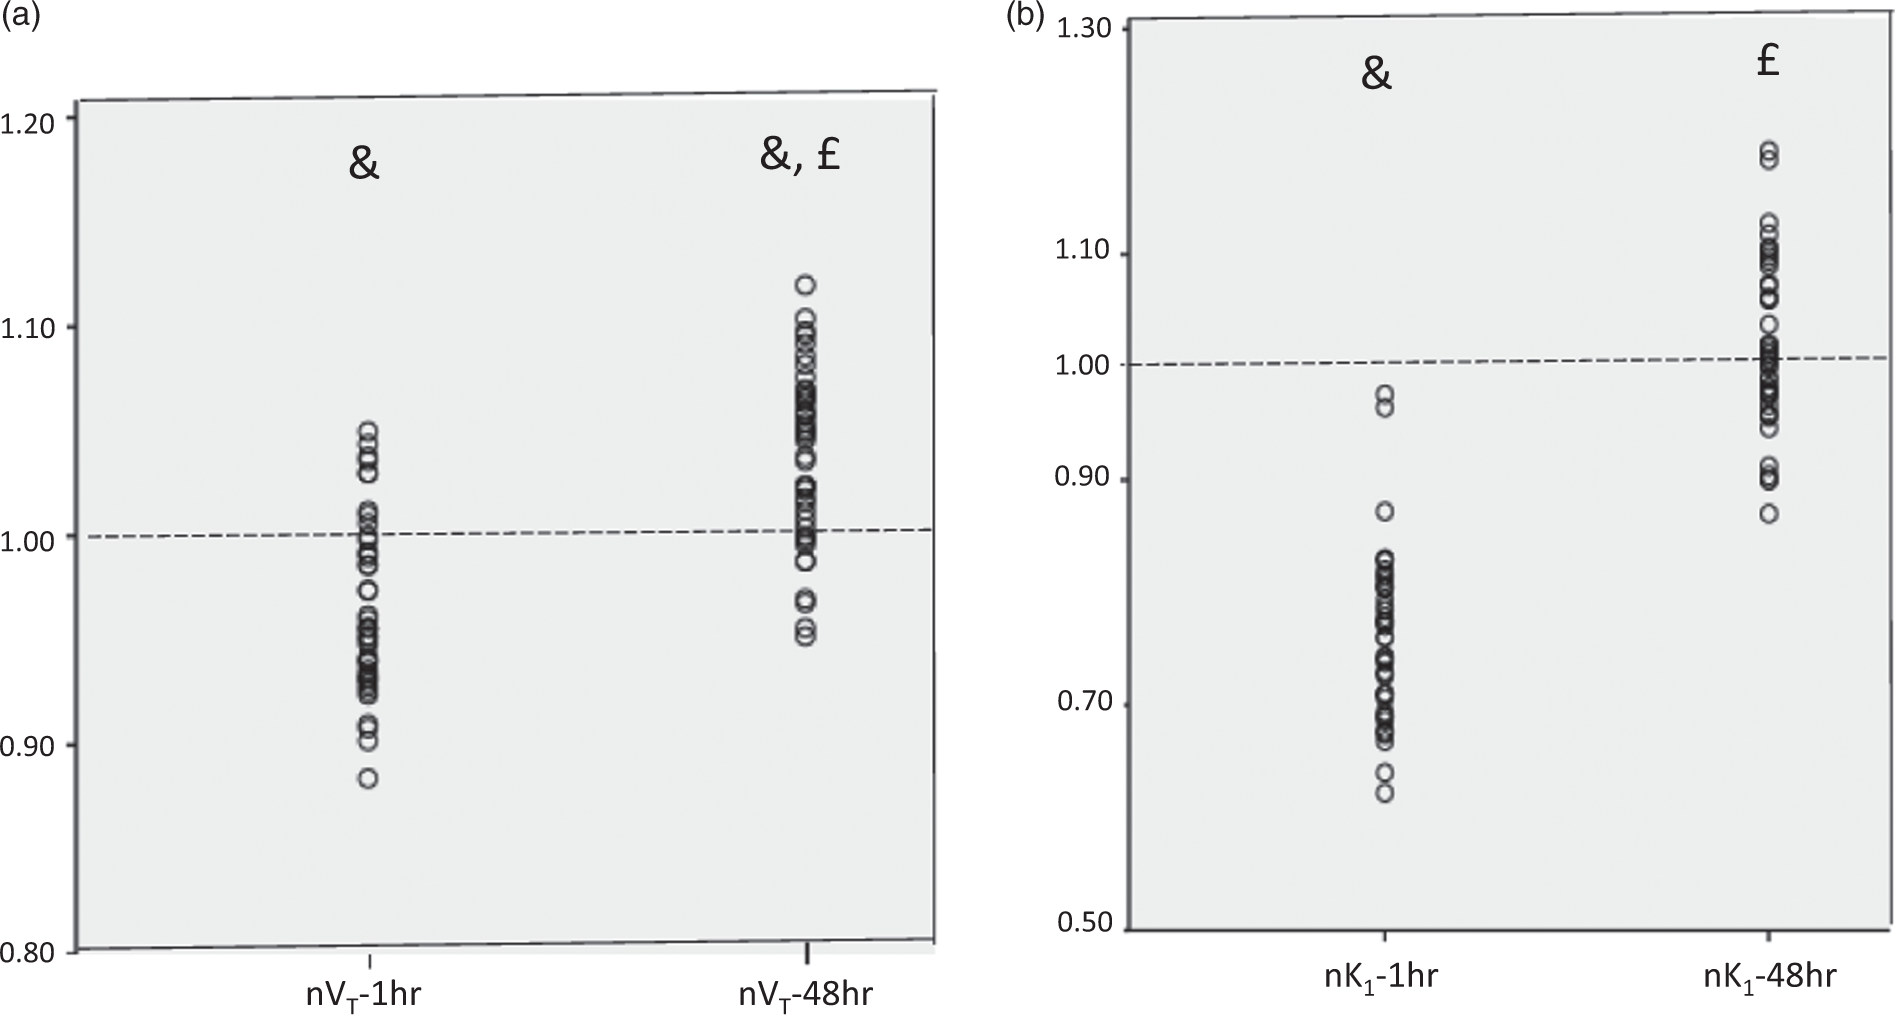
FMZ normalised VT values (a) and K1 values (b) obtained in the set of 44 ROIs at 1 h and 48 h after reperfusion in the five rats with isolated selective neuronal loss (see Results). Each datapoint shown is the average of the five rats for each of the 44 ROIs. nVT and nK1: normalised VT and K1 data; &p < 0.001 vs. unity; £p < 0.001 vs. data obtained at 1-h post-reperfusion (see Results for details).
For both time-points, the VT values for Rat 6 were normally distributed, and accordingly paired t-tests were used. As above, Bonferroni correction for multiple tests was applied, and p < 0.017 considered significant. Across the 44 ROIs, the within-subject analysis of normalised VT-1 h showed a small, non-significant reduction (0.977 ± 0.073, range: 0.81–1.12; p = 0.037), whereas normalised VT-48 h was markedly increased though with substantial between-ROI variability (1.408 ± 0.177; p < 0.001). The difference between the two time points was also highly significant (p < 0.0001).
FMZ VT-NeuN correlations
Within-subject correlations
Table 1 summarizes the Kendall correlations (computed across the n = 44 ROIs) found between the normalised VT values (VT-1 h and VT-48 h) and the NeuN scores in each individual rat. In total, out of 12 correlations tested across the six rats, five (i.e. 42%) were significant at the 5% threshold. Statistical trends (0.05<p < 0.10) were present for three additional corrrelations. Overall, VT-1 h showed weakly or borderline negative correlations in all three rats with substantial SNL, i.e. rats 2–4, such that the lower the VT, the worse the SNL. Conversely, in the same three rats normalised VT-48 h strongly positively correlated with NeuN scores, such that the higher the VT, the worse the ischemic damage, i.e. inverted relative to 1-h data. To illustrate the latter finding, the within-subject relationship between normalised VT-48 h and SNL scores is plotted for rat 4 in Figure 3(a). In rat 6 with infarction, there was a trend for a positive correlation between NeuN scores and normalised VT-1 h, and a strongly significant positive correlation with normalised VT-48 h (Table 1)
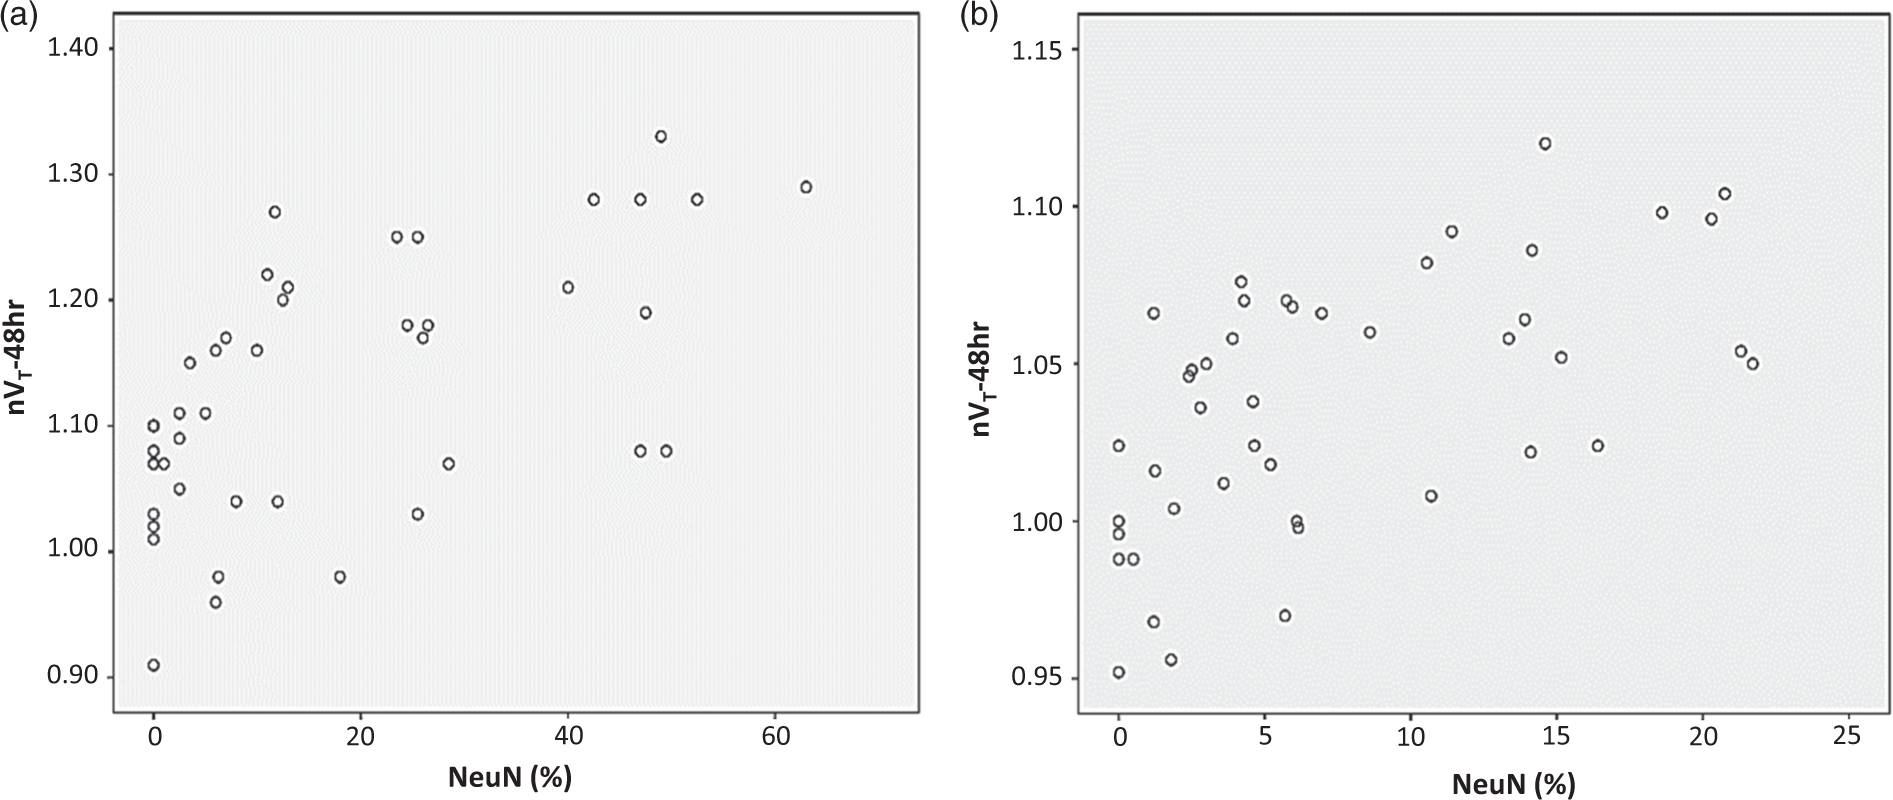
Relationship between normalised FMZ VT-48 h and SNL scores, illustrated for rat 4 (a) and across rats 1–5 with isolated SNL (b). Both plots show a highly significant positive correlation (Kendall p < 0.001 for both), such that the higher the VT-48 h, the more severe the SNL.
Across-subjects correlations
As explained above, rat 6 was excluded from this analysis because it had clear infarction. The results for the 5 rats with isolated SNL are shown in Table 1. Normalised VT-1 h was negatively correlated with NeuN scores, but this did not reach statistical significance (p = 0.22). Consistent with the within-subject findings, normalised VT-48 h predicted SNL intensity with high statistical significance (p < 0.001), such that the higher the VT, the more severe the SNL. This strong relationship is depicted in Figure 3(b).
To illustrate the above findings, Figure 4 displays parametric VT maps obtained at both time-points and corresponding NeuN sections in rat 4 (marked SNL) and rat 6 (infarction).
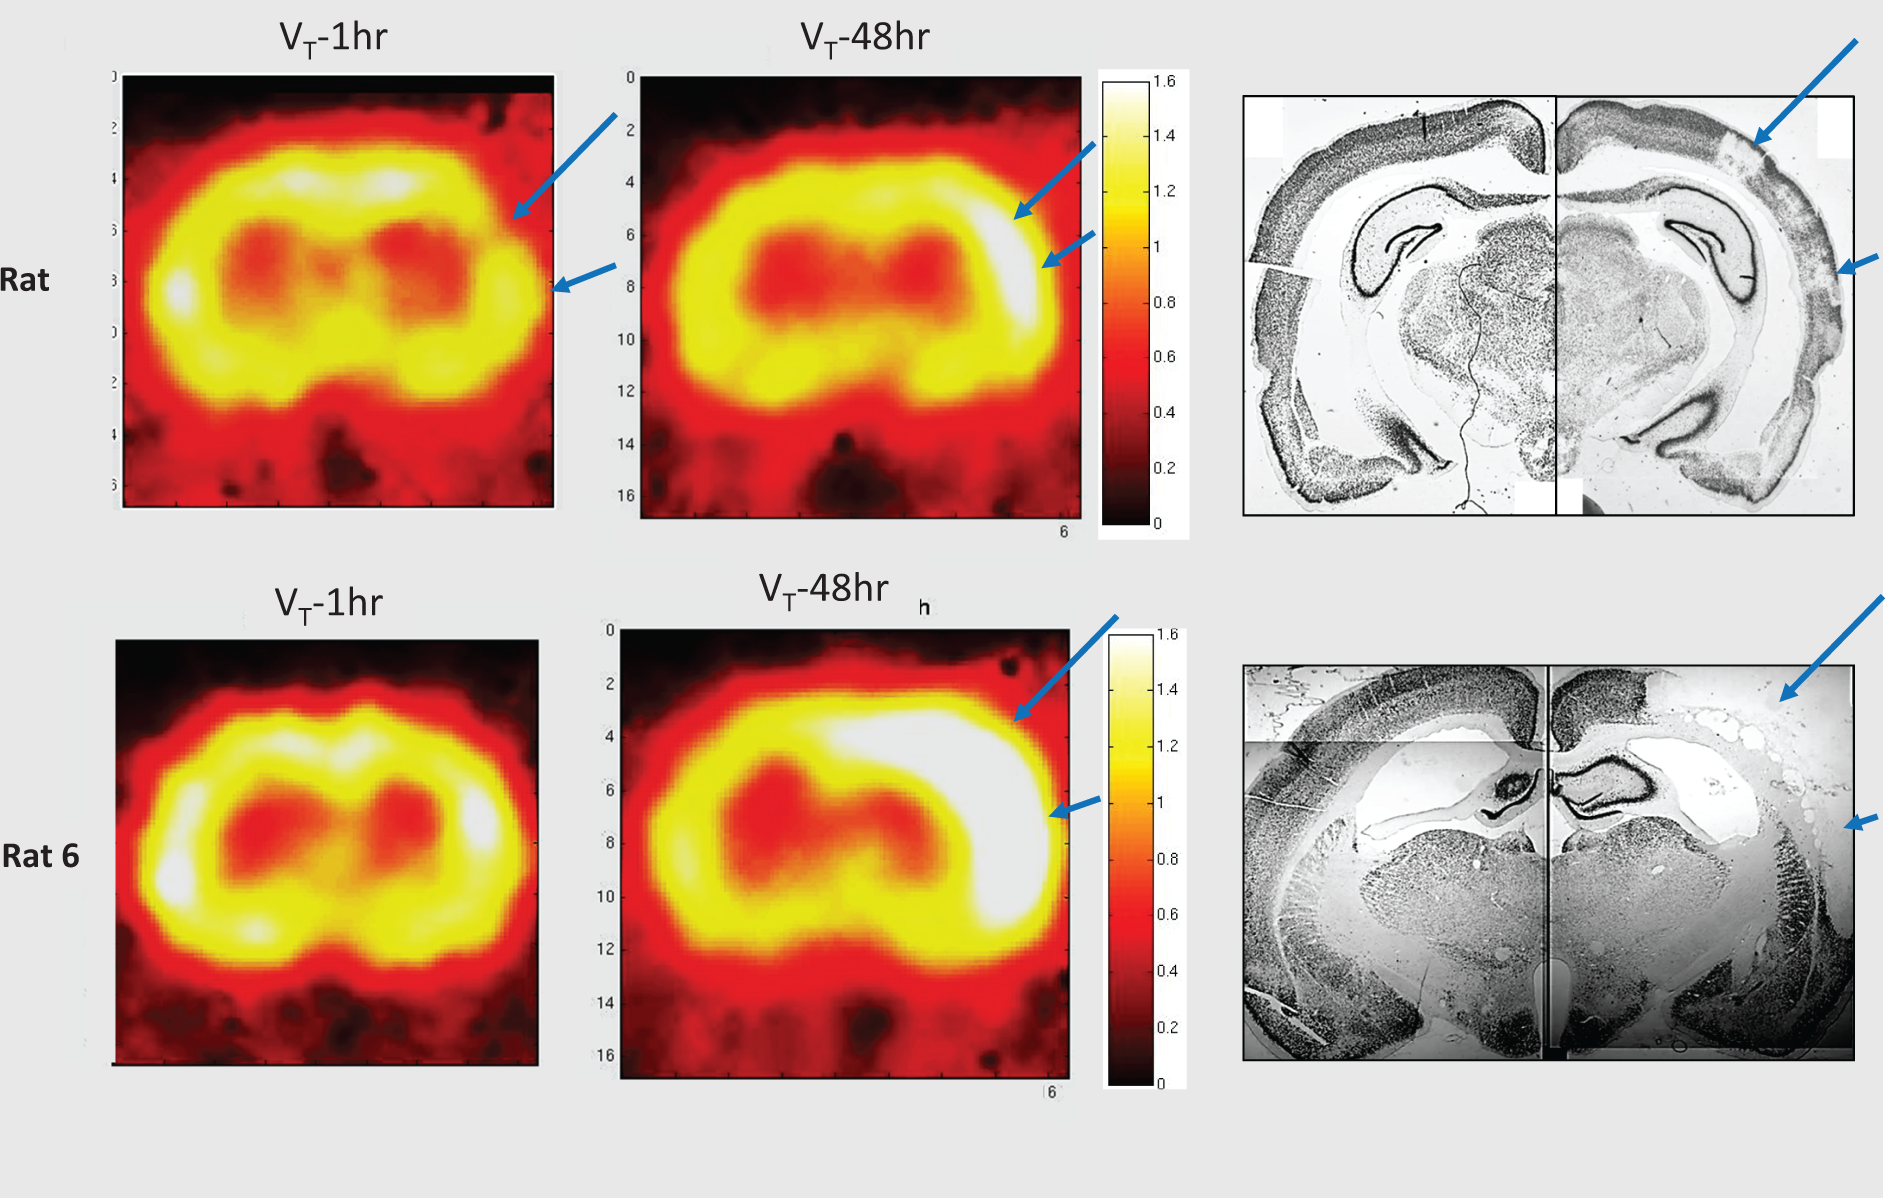
Parametric FMZ VT-1 h and VT-48 h maps and corresponding NeuN sections in rat 4 (isolated SNL) and rat 6 (infarction), showing reduced VT-1 h and increased VT-48 h both predicting ultimate cortical SNL in rat 4, and markedly increased VT-48 h predicting ultimate cortical infarction in rat 6 (blue arrows). The pseudocolor scales to the right of the VT maps represent absolute VT values (unitless), and the range of colors was selected specifically to highlight the changes in the affected hemisphere; thus, the whitish areas apparent in the unaffected hemisphere at the 1 h timepoint are in fact within the normal range.
FMZ K1 results and correlations with NeuN data
Across the five rats with isolated SNL, normalised K1 values did not deviate from normality for either time-point. As with VT, Bonferroni correction for multiple tests was applied, and p < 0.017 was considered significant. Relative to neutral, normalised K1-1 h (0.760 ± 0.074) was markedly and significantly (p < 0.001; Wilcoxon) reduced, while K1-48 h was not different from neutral (1.019 ± 0.074; p = 0.192) (Figure 2(b)). There was a highly significant difference between the two time points (p < 0.001, Wilcoxon).
All three rats with substantial SNL (i.e. rats 2–4) showed significant negative correlations between NeuN scores and normalised K1-1 h values, such that the lower the K1, the worse the SNL. This relationship was highly significant for the data averaged across the five rats (Table 1). At 48 h, a positive correlation, i.e. inverted relative to 1-h data, was present for rats 1, 2 and 4 as well as across the 5 rats, such that now the higher the K1, the worse the SNL. This inverse behaviour between 1 h and 48 h average K1 versus NeuN is illustrated in Figure 5.
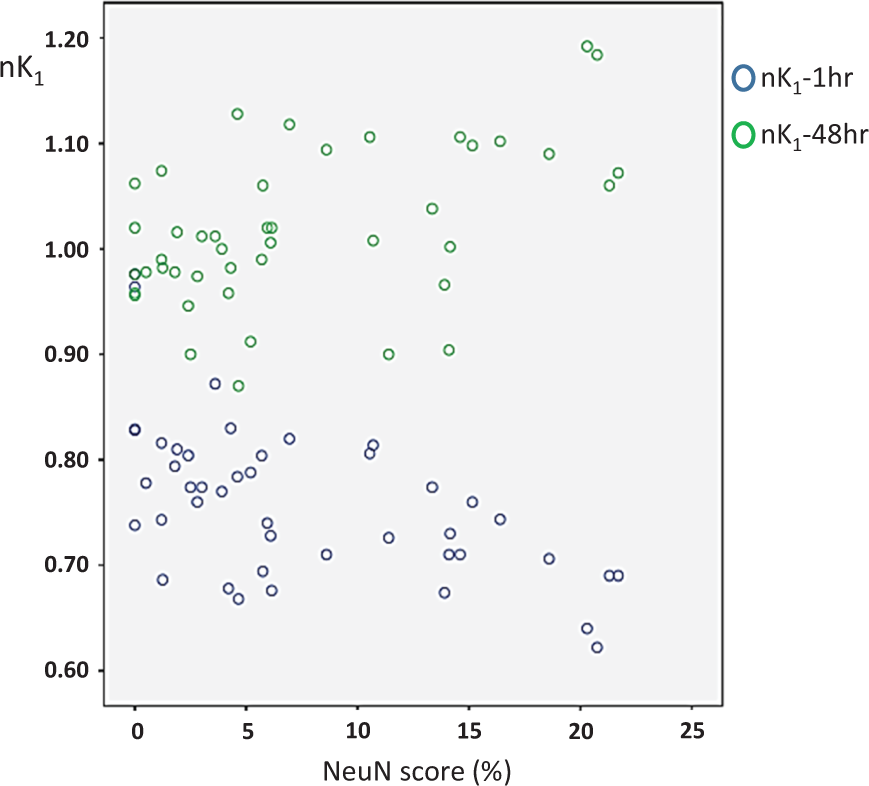
Relationship between normalised K1 obtained at 1 h and 48 h (blue and green circles, respectively) and mean NeuN scores (average values across the five rats, n = 44 ROIs). At 1 h, there was a significant negative correlation, such that the lower the K1, the worse the SNL, which inverted at 48 h (see Table 1 and Results for details).
In rat 6, the normalised K1-1 h and K1-48 h datasets were normally distributed. K1-1 h was slightly and non-significantly increased across the 44 ROIs (1.046 ± 0.201; p > 0.10; paired t-test), and showed a significant positive correlation with NeuN scores (Table 1). A statistically significant correlation in the same direction was found at 48 h, at which time point normalised K1 was markedly increased (1.328 ± 0.208, p < 0.001; significantly higher than K1-1 h, p < 0.0001; paired t-tests).
Discussion
Our primary aim here was to test the hypothesis that early-stage FMZ-PET predicts cortical SNL after ischemic stroke. To this end, adult spontaneously hypertensive rats underwent brief temporary distal MCA occlusion, FMZ-PET was obtained at both 1 h and 48 h after reperfusion, and neuronal damage was assessed post-mortem at day 14. Using a validated approach allowing quantitative assessment of both FMZ binding and tissue damage (determined from voxel-wise PET data kinetic modelling and visually-scored NeuN staining loss, respectively) in the same set of ROIs covering the whole hemisphere, we found mild but significant FMZ binding decreases at the 1 h post-MCAo timepoint across the five rats with isolated SNL, that were weakly predictive of tissue outcome in those rats with substantial SNL but not across the group. Conversely, FMZ binding at 48 h was significantly increased and strongly predicted SNL severity in the same three individual rats as well as across the group, such that the higher the binding, the more severe the neuronal loss. The findings were similar though generally more conspicuous in the single rat with ultimate tissue infarction.
In rats showing isolated SNL at day 14, only mild FMZ binding decreases were present at the hyperacute, 1-h post-reperfusion timepoint (maximum average decrease: 12% relative to contralateral hemisphere, see Figure 2(a)), and reduced FMZ binding only weakly predicted final tissue damage. This suggests that, in the rat, post-synaptic GABA-A receptors present on neuronal membranes remain largely intact early after a severe temporary ischemic episode, even though many neurons may already be markedly affected or even necrotic. Intuitively, such a behaviour would be biologically expected for a membrane protein. Three previous rodent studies have assessed FMZ binding within hours following focal cerebral ischemia34–36; however, none assessed SNL as tissue outcome. Although similar to our study no frank binding defects were observed in any of these earlier studies, the reported FMZ binding changes have been somewhat inconsistent. In rats subjected to 2-h temporary MCAo, Rojas et al. 35 found unchanged 11 C-FMZ uptake (assessed 20–30 min after tracer administration) up to 8 h following reperfusion, even within areas found to be necrotic at 24 h. In Schirrmacher et al.’s rat study, using endothelin-1-induced long-lasting MCA territory ischemia11,36C-FMZ binding measured at 6 and 23 h was also unchanged, although inspection of the PET images suggests slightly increased cortical uptake. Finally, in Abe et al.’s rat study using 3H-FMZ in vitro autoradiography, ligand binding was increased 3 h after permanent MCAo in areas destined to pan-necrosis. 34 Findings in higher species have been more consistent, as all reported reduced 11 C-FMZ binding in relation to follow-up tissue infarction (SNL again not assessed). In a study in cats, FMZ uptake determined 3 h after transient MCAo by means of a single PET scan acquired 60 min following tracer administration was moderately reduced in areas destined to be infarcted. 11 In three clinical studies also from the Heiss group, markedly reduced FMZ uptake (again obtained by means of a single data acquisition performed 30–60 min after tracer administration) present in PET studies performed 3–16 h after stroke onset consistently predicted final infarction, whereas areas exhibiting only mildly reduced or normal FMZ uptake were not infarcted at follow-up.12,23,37 Likewise, in pigs, significant FMZ uptake defects were found 2 h after focal endothelin-1-induced brain ischemia in over half of the experimental subjects, which was assumed to reflect early necrosis. 38 Note, however, that kinetic modelling was not performed in any of the above cat, pig or human studies, i.e. tracer uptake was measured at a single time-point after tracer administration. Accordingly, it is feasible that in persistently ischemic conditions (i.e. in the absence of recanalization) with very low tracer delivery, FMZ uptake may be significantly decreased without truly reduced specific binding, or that small reductions may be overestimated. However, in two patients from the above human studies, FMZ uptake was unaffected despite substantial hypoperfusion, 12 arguing against this hypothesis. Thus, species differences may exist, whereby in man and pigs, but not to the same extent in rats and cats, GABA-A receptors may be lost very early in association with neuronal death.
In contrast, our findings of significant cortical FMZ binding increases at 48 h after reperfusion are consistent with several previous studies. Thus, two earlier PET studies in rats found moderately but significantly higher cortical FMZ uptake (kinetic modelling again not performed) in the affected relative to contralateral areas 24 h after either 2-h temporary proximal filament-induced MCAo 35 or photochemically induced MCAo, 39 both within and surrounding the eventual infarct. Likewise, the above-mentioned endothelin-1 rat study reported unchanged cortical FMZ binding 23 h after MCA occlusion, but PET images shown as illustration in fact suggest slightly increased tracer uptake. 36 Our findings are also consistent with Abe et al.’s in vitro autoradiography study in rats that found increased cortical 3H-FMZ specific binding (statistical results not presented) 24 h following 3-h proximal MCA occlusion, including within necrotic areas. 34 Taken together, the above findings and ours point to the presence in rodents of increased subacute-stage cortical FMZ binding predicting infarction (all studies) or SNL (our study). Two discrepant studies, however, deserve to be mentioned. One of the above studies that found unchanged cortical FMZ uptake up to 8 h after permanent proximal MCA occlusion reported markedly reduced uptake at 24 h. 35 And an in vitro autoradiographic study in mice found 3H-FMZ binding to be unchanged at days 1 and 3 following 30-min proximal MCAo within striatal areas that displayed almost total neuronal loss at post-mortem. 40 The discrepancy between the latter mouse study and our rat study may relate to the markedly different severity of SNL achieved and/or to fundamental differences in GABA-A receptor density and functional role between cortical and striatal areas. 41
The most important finding from our study is that, consistent with our hypothesis, FMZ binding at the 48-h timepoint predicted SNL, such that the higher the binding, the more severe the SNL. Given that so far no in vivo imaging method has been shown to predict SNL, including standard MRI (see Introduction), our findings are novel and may have clinical implications. Similar but more conspicuous findings applied to pan-necrosis (namely, rat 6), but since T2-weighted MRI can reliably predict infarction early after stroke, our observations do not have obvious clinical relevance.
One significant caveat regarding the potential clinical implications of our finding regarding 48-h FMZ-PET is the absence of reports showing increased subacute-stage FMZ binding in higher species including man. As a matter of fact, FMZ at 48-h post-stroke has been reported in one non-human primate study, 10 and no instance of increased FMZ binding was observed at this timepoint only (two measurements, both clearly reduced within as well as around the infarct). This discrepancy with the findings in rodents again suggests possible species-related differences that will need to be addressed in future studies. To our knowledge, no human study assessing FMZ binding around 48 h post-stroke has been published so far.
What mechanisms could underly the FMZ binding increases found 48 h post-stroke? The most straightforward mechanism would be increased GABA-A receptor density from receptor upregulation or externalization or synapse sprouting, secondary to the acute ischemic insult. This interpretation would be supported by the in vitro 3H-FMZ autoradiography findings described above. 34 If correct, this would mean that the degree of receptor upregulation is a positive early marker of neuronal death. A related hypothesis to explain the higher FMZ binding would involve increased affinity with unchanged receptor density as a result of altered cBZR environment, e.g. affecting endogenous ligand tissue levels. A whollly different hypothesis, however, would entail increased tracer delivery, and in turn enhanced tissue uptake, which would be supported by the significant hyperperfusion suggested by the increased K1 values observed in our study (Figure 2(b)). Accordingly, post hoc analysis of our dataset showed a significant correlation between VT-48 h and K1-48 h in the group of rats with isolated SNL (Pearson r = 0.425, p < 0.01; N = 44 ROIs), as well as in rat 6 with infarction (r = 0.497, p < 0.001). This hypothesis appears however unlikely. Firstly, a mismatch between focal post-ischemic hyperperfusion and reduced FMZ uptake has been reported previously in both cats 11 and stroke patients. 23 Secondly, in the above-mentioned in vitro autoradiography study, 34 normal or even increased 3H-FMZ binding was present in such experimental conditions (namely, post-mortem) that ligand delivery becomes irrelevant. Finally, the in vitro binding of 3H-muscimol, which directly binds to the GABA-A receptor, was also increased within necrotic areas three days following cortical photothrombosis in rats 42 as well as bilateral common carotid occlusion in gerbils. 43
On top of intense microglial activation, a degree of tissue infiltration by blood-borne leukocytes is expected from day 2 post-MCAo onwards. 44 Although to our knowledge leukocyte infiltration within areas of SNL has not been assessed so far, if present it would be expected to be much milder than in areas of actual infarction. Accordingly, prominent leukocyte infiltration may have been present at 48 h in rat # 6, which showed extensive tissue infarction. Interestingly, this rat also exhibited the largest increase in FMZ binding (Figure 4). One may therefore ask whether the finding of increased FMZ binding at 48 h, particularly in rat #6, and likewise that consistently reported in earlier literature (see above discussion), may partly reflect FMZ binding to leukocytes. To our knowledge, the in vitro binding of flumazenil (previously known as Ro-151788) to leukocytes has not been reported so far. However, in one study, 45 consistent with previous work,46,47 FMZ exerted no effect on a wide array of immune markers of neutrophils, suggesting it does not meaningfully bind to leukocytes. This probably reflects the fact that, in sharp contrast with benzodiazepines, FMZ is a specific ligand of the central BZR and as such has no affinity for the so-called “peripheral’” BZR (also called TSPO),48,49 which is heavily expressed in post-stroke immune and inflammatory processes, 50 including neutrophil migration and adhesion. 51 Accordingly, 11 C-FMZ was found not to express specific binding to brainstem regions in a rat model of brainstem encephalitis expressing marked MA,52,53 in-keeping with the consistent observation that the local distribution of 11 C-PK11195 and 11 C-FMZ binding within and around brain infarcts in mice and baboons in vivo was entirely distinct.10,39
The main limitation of the present study is the small sample. However, similar sample sizes are commonplace in PET studies given the cost and human resources required. Note that the small sample is balanced by the powerful longitudinal design, whereby each rat had FMZ-PET studies at two timepoints followed by post-mortem obtained 14 days post-stroke. Furthermore, for data analysis, we used a template of 44 ROIs from which both PET data and validated NeuN neuronal damage scores could be extracted, allowing robust within-subject statistical analysis. As discussed in our previous similar studies,19,54 the marked differences in spatial resolution and slice thickness between the PET and NeuN datasets, potentially causing some degree of mismatch in the co-registration to the selected coronal sections extracted from the Paxinos atlas, is another limitation intrinsic to our method. The errors introduced by these differences did not however prevent statistically significant correlations between the two datasets, which would likely have been stronger had a method existed for perfect coregistration of PET and post-mortem images. To this end, hybrid PET/MR scanners 55 could be used as the simultaneous acquisition of PET data and anatomical information would improve the precision of measurements and coregistration with post-mortem sections, and also can be applied to larger species with anatomy and physiology closer to human. 56 A third limitation is that we assessed FMZ binding at two time points only, namely 1 h and 48 h after transient MCAo, as it was considered unsafe for the animal’s welfare to add a third PET study, involving another lengthy anesthetic period, in between the 1 h and 48 h time-points. Consequently, although FMZ PET at 48 h was predictive of subsequent SNL while 1 h FMZ-PET was not quite predictive, we are unable to comment whether FMZ PET at intermediate time-points would have had stronger predictive power than the 1-h timepoint, and in turn cannot comment on how early FMZ PET could predict SNL. Interestingly, as already pointed out, previous studies suggest that FMZ uptake may already be increased at 24 h post-MCAo in tissue destined to infarction,34–36,39 while of the three studies that assessed even earlier time-points, two found no change in FMZ binding35,36 but one reported binding increases already present at 3 h post-MCAo. 34 These observations suggest that increased FMZ-PET may be present and predict SNL already from 24 h post-MCAo or perhaps even earlier. This issue should be addressed in future investigations given the potentially important clinical but also therapeutic implications, as therapy aimed at curbing or preventing SNL could be more efficient if started very early. Importantly, better understanding of the actual time-course of SNL by means of sequential post-mortem studies would help plan interventions with the most appropriate timing. Currently, such knowledge is quite limited.4,40
Conclusion
Capitalizing on its longitudinal design allowing within-subject analysis, this study revealed significant but only mild decreases in FMZ binding 1 h after reperfusion that were only weakly predictive of substantial SNL. Conversely, and consistent with our hypothesis, FMZ binding at 48 h was strongly predictive of the severity of local SNL, such that the higher the binding, the more severe the neuronal loss. This in turn suggests that FMZ PET early after recanalization in stroke patients may predict the occurrence of SNL, opening the opportunity of trials of interventions aiming to prevent or limit SNL within the rescued penumbra. However, further studies are needed at this stage to investigate whether significant species differences exist in the behaviour of GABA-A receptors or flumazenil binding in the early stages following an ischemic insult.
Footnotes
Funding
The author(s) disclosed receipt of the following financial support for the research, authorship, and/or publication of this article: This work was supported by MRC grant G0001219 to J-CB. Part of the equipment used in these experiments was purchased through an unrestricted research grant from Pfizer Ltd to JSB. PSJ is funded by the Cambridge Biomedical Research Centre (BMRC). JLH was funded by an MRC Research Studentship. JSB and DKM are supported by the BMRC.
Acknowledgements
The authors are grateful to Théotime Nadot for help with the statistical analysis.
Declaration of conflicting interests
The author(s) declared no potential conflicts of interest with respect to the research, authorship, and/or publication of this article.
Authors’ contributions
JLH: design, data acquisition, data analysis, manuscript editing.
JSB: protocol design, data acquisition, manuscript editing.
PSJ: data analysis, manuscript editing.
DW: data analysis, manuscript editing.
DKM: protocol design, manuscript editing.
FIA: protocol design, manuscript editing.
TDF: protocol design, data acquisition, image processing, data analysis, manuscript editing.
J-CB: concept, protocol design, data analysis and interpretation, manuscript drafting.