
Abstract
This positron emission tomography (PET) study aimed to further define selectivity of [11C]Ro15-4513 binding to the GABARα5 relative to the GABARα1 benzodiazepine receptor subtype. The impact of zolpidem, a GABARα1-selective agonist, on [11C]Ro15-4513, which shows selectivity for GABARα5, and the nonselective benzodiazepine ligand [11C]flumazenil binding was assessed in humans. Compartmental modelling of the kinetics of [11C]Ro15-4513 time-activity curves was used to describe distribution volume (
Introduction
Imaging studies of benzodiazepine receptors over the past 20 years have revealed different levels of binding in patients with anxiety and panic disorders, alcoholism, schizophrenia, epilepsy, and other disorders (Malizia et al, 1998; Lingford-Hughes et al, 2010; Busatto et al, 1997; Hammers et al, 2001). There is increasing knowledge about the six different subtypes of the GABA-benzodiazepine receptor, their locations in the brain, and their functional implications. For instance, knock-in and knockout genetic manipulations in mice have shown that the GABA-benzodiazepine receptor subtype containing the α1 subtype is important in sedation and sleep, the α2/3 subtype is involved in anxiety, and the α5 in learning and memory (Möhler et al, 2002). In the light of these discoveries, it is important to study the role of these receptor subtypes in humans. Neuroimaging, in particular positron emission tomography (PET) and single-photon emission tomography (SPET) imaging with receptor-selective ligands, remains the only way of quantifying benzodiazepine receptors in the human brain
[11C]flumazenil with PET is the most commonly used
Although the distribution of [11C]Ro15-4513 binding is consistent with relatively greater labelling of the α5 subtype, the affinity of [11C]Ro15-4513 is only an order of magnitude greater for the α5 over other subtypes. Given the abundance of the α1 subtype throughout the brain, it is important to assess the contribution of α1 binding to [11C]Ro15-4513 binding. This study compares the binding of [11C]Ro15-4513 with that of [11C]flumazenil in the presence and absence of zolpidem, a compound with selectivity for the α1 receptor subtype that is > 5,000-fold over that for the α5 subtype (Hanson et al, 2008; Langer et al, 1992). Unlike classical benzodiazepines, the sedative/hypnotic effect of zolpidem occurs at much lower doses than the other pharmacological effects attributed to benzodiazepine-site action, such as anticonvulsant activity and muscle relaxation (Sanger, 2004).
After predosing with Zzolpidem or placebo, one group of healthy volunteers was scanned with [11C]Ro15-4513 and another group with [11C]flumazenil. Our hypothesis was that, because [11C]flumazenil labels the α1 subtype, its binding would be reduced by zolpidem. In contrast, we hypothesised that [11C]Ro15-4513 binding would not be altered by zolpidem in α5-rich regions such as the hippocampus, whereas in α1-rich regions with limited or no α5, such as the cerebral cortex and thalamus, [11C]Ro15-4513 binding might be reduced. To further resolve contributions of α1 and α5 subtypes to the [11C]Ro15-4513 signal, we applied spectral analysis (Cunningham and Jones, 1993) to both [11C]Ro15-4513 and [11C]flumazenil data sets to deduce the spectral band of the GABA-benzodiazepine α1 subtype. The range obtained was used to determine the occupancy by zolpidem of the GABA α1 subtype from the [11C]Ro15-4513 data using the Lassen plot (Lassen et al, 1995; Cunningham et al, 2010).
Materials and methods
This study was approved by a NHS Research Ethics Committee, the Administration of Radioactive Substances Advisory Committee and local NHS Research and Development. It was conducted in accordance with Good Clinical Practice—International Conference on Harmonisation guidelines.
Design
There were two separate randomised double-blind placebo-controlled studies, each with six healthy volunteer participants. The study procedures were identical apart from the PET ligand used: [11C]flumazenil for one study and [11C]Ro15-4513 for the other. Positron emission tomography scans were performed twice for each participant, once after zolpidem and once after placebo, with at least a week between scans. Binding of the ligand was compared between the two conditions.
Subjects
Healthy male volunteers (age mean ± s.d.: [11C]Ro15-4513: 44 ± 6 years; [11C]flumazenil: 43 ± 4 years) underwent 2 PET scans at least a week apart, after zolpidem or placebo, the order of which was randomised. They were all screened with urinalysis for illicit drugs of abuse, had no current or previous significant physical or mental disorders, had taken no psychotropic drugs in the last month, nor were regular benzodiazepine users.
Zolpidem and Measures
Zolpidem (20 mg) or an identical placebo was administered 90 minutes before radioligand injection and at the start of the PET scan. Plasma zolpidem levels were measured at the time of PET ligand injection.
The following tasks provided a measure of the effect of zolpidem on brain function. Saccadic eye movements to a target were measured using electrooculography as described previously (Lingford-Hughes et al, 2005). The subject was asked to fixate on a red light as it appeared on the screen mounted 67 cm in front of him. Data were then collected for 48 eye movements of 15° to 40° and a main sequence curve obtained, the measurement for peak velocity being the interpolation at 35°. Verbal memory was tested with learning and delayed recall of a list of 20 words (Nutt et al, 2007), with the list presented at the start of the scan and recall 30 minutes later.
Positron Emission Tomography Method
[11C]Ro15-4513 was synthesised by
A bolus injection of [11C]flumazenil (mean ± s.d.: 476 ± 11 MBq in 1.0 ± 0.16 mL) or [11C]Ro15-4513 (mean ± s.d.: 495 ± 18 MBq in 3.3 ± 0.49 mL) was administered through an intravenous cannula sited in the dominant antecubital fossa vein. No significant differences in cold mass injected, with paired
We used a Siemens ECAT EXACT HR+ (CTI/Siemens, model 962; Knoxville, TN, USA) scanner with an axial field of view of 15.5 cm. Subjects were positioned such that the transaxial images were parallel to the intercommissural line. A total of 63 transaxial image planes were acquired as 2.42-mm slices with a reconstructed axial resolution of 5.4 mm and a transaxial resolution of 5.6 mm (Spinks et al, 2000). A 10-minute transmission scan was acquired before every emission using a single rotating photon point source of 137Cs for subsequent attenuation and scatter correction.
[11C]Ro15-4513 scans comprised 24 dynamic time frames (1 × 30, 4 × 15, 4 × 60, 2 × 150, 10 × 300, 3 × 600 seconds) and [11C]flumazenil scans comprised 20 time frames (1 × 30, 4×15, 4×60, 2 × 150, 2 × 300, 7 × 600 seconds) of data which, after corrections for attenuation, random coincidences, and scatter, were all reconstructed using filtered backprojection. The three-dimensional emission data were Fourier-rebinned (Defrise et al, 1997) into two-dimensional data sets to increase the speed of reconstruction.
Each subject had a radial arterial cannula inserted in the nondominant wrist to allow continuous counting of blood radioactivity concentration for the first 15 minutes of the experiment using a bismuth germanate counter. Discrete samples were also taken 4, 6, 8, 10, 20, 35, 50, 65, 80, and 90 minutes after injection. An aliquot of each discrete sample was rapidly centrifuged to obtain corresponding plasma and radioactivity concentrations. The continuous blood counts were corrected using the estimated plasma/blood ratio to derive the plasma radioactivity profile. The plasma was further analysed for radiolabeled metabolites using a semiautomated analysis system, consisting of an on-line solid-phase sample enrichment column and high-performance liquid chromatography. The amount of [11C]Ro15-4513 or [11C]flumazenil in the plasma at a given time point was calculated as a percentage of all radioactive components separated by high-performance liquid chromatography added to the radioactivity present in the solid-phase extraction fraction, to produce a final plasma input function derived for radioligand-binding quantification. These calculations were carried out using Clickfit, in-house software running in Matlab (The Mathworks, Natick, MA, USA).
All subjects had T1-weighted magnetic resonance imaging with a Philips 1.5-T Gyroscan Intera scanner (Philips, Best, The Netherlands) to produce structural images for reference.
Image and Blood Analysis
Reconstructed PET images were analysed on a Sun SPARC workstation (Sun Microsystems, Mountain View, CA, USA) using Analyze AVW version 8.1 (Biomedical Imaging Resource, Mayo Clinic, Rochester, MN, USA), Matlab 6 and 6.5 (The Mathworks), and SPM5 (available through http://www.fil.ion.ucl.ac.uk/spm/; FIL, 12 Queen Square, London, UK).
Regions of interest were placed on the images using a probabilistic map which defined 83 regions (Hammers et al, 2007). A list of these regions is given in Appendix 1. Each structural magnetic resonance image was coregistered to the PET add image, a sum of all counts acquired during the scan, using a rigid-body technique. This coregistered magnetic resonance imaging was then normalised to the ‘Montreal Neurological Institute' space (International Consortium for Brain Mapping (ICBM)/MNI) using a bias-corrected segmentation in SPM5. Using the reverse parameters of this normalisation, the probabilistic map could be warped to fit the coregistered structural magnetic resonance imaging and hence the add image and the original PET dynamic. The goodness of fit of each object map to the individual brain was checked visually before regional sampling using the region of interest tool in Analyze 8.1. From the probabilistic map, we identified regions with wide differences in α1 and α5 distribution: the cerebellum, occipital cortex, and thalamus, which contain high α1 levels and very low α5 levels, and limbic regions such as the hippocampus, nucleus accumbens, amygdala, and anterior cingulate cortex with high α5 levels and lower α1 levels (Fritschy and Möhler, 1995; Lingford-Hughes et al, 2002).
Modelling
Parametric maps of total volume of distribution (
The regional kinetics of uptake of [11C]Ro15-4513 only were computed from brain and plasma time-activity curves (TACs) using one-tissue and two-tissue compartment models, using Clickfit. Having estimated the delay, the models used fixed blood volume (
Spectral Analysis
To further elucidate the pharmacokinetics of [11C]Ro15-4513, Clickfit was again used to carry out spectral analysis of each regional TAC collected from the original PET dynamics. Spectral analysis (Cunningham and Jones, 1993; Turkheimer et al, 1994) convolves the arterially derived metabolite-corrected plasma input function with a first-order poly-exponential, without specifying the number of tissue compartments, to fit the TAC for any region, under the assumptions of system linearity and time invariance. The impulse response function (IRF) is described as IRF(
In the case of two specific binding sites, the total volume of distribution
Occupancy Plots
Occupancy data were derived graphically, as described by Lassen et al (1995) (Cunningham et al, 2010), using the vectors of the regional volumes of distribution in baseline,
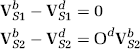
If the imaging ligand has two binding sites and the blocking drug is selective for only one of these binding sites, VTb and VTd may be written as follows:
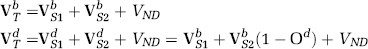
Therefore, we can draw two plots for the fractional volumes of distribution defined above:
The specific volume of distribution of [11C]Ro15-4513 relative to each subtype was derived using spectral analysis with the assumption that a given spectral range corresponded to binding to a single site. In addition, we made the further assumption that, although the blocking drug will change the positions of the spectral peaks, the volume of distribution of the imaging ligand relative to the binding to the site not targeted by the cold drug will be the same in the baseline and postdrug PET studies. Both assumptions were tested using zolpidem blocking data, as reported in the ‘Results' section. The 83 region atlas (Appendix 1) provided a large number of regional volumes of distributions for use in the plots. The gradient of a linear regression through the points on the axes,
Statistical Analysis
Two-tailed Student's
Results
One [11C]Ro15-4513 pair of scans was not analysable after a subject dropped out of the study, so we report here the remaining five. There was no significant difference in zolpidem levels in the two groups, although only three blood samples were successfully acquired in the [11C]Ro15-4513 cohort (mean ± s.d.: [11C]Ro15-4513
Compartmental Modelling of [11C]Ro15-4513
Compartmental modelling was applied to all [11C]Ro15-4513 regional data, estimating kinetic parameters and goodness of fit, represented by the Akaike information criteria. All data for the placebo group are shown in Table 1, presented as mean ± s.d. for both models. All rate constants are expressed as seconds−1.
Comparison of the kinetic rate constants obtained using different compartmental models to determine Ro15-4513 binding in the brain
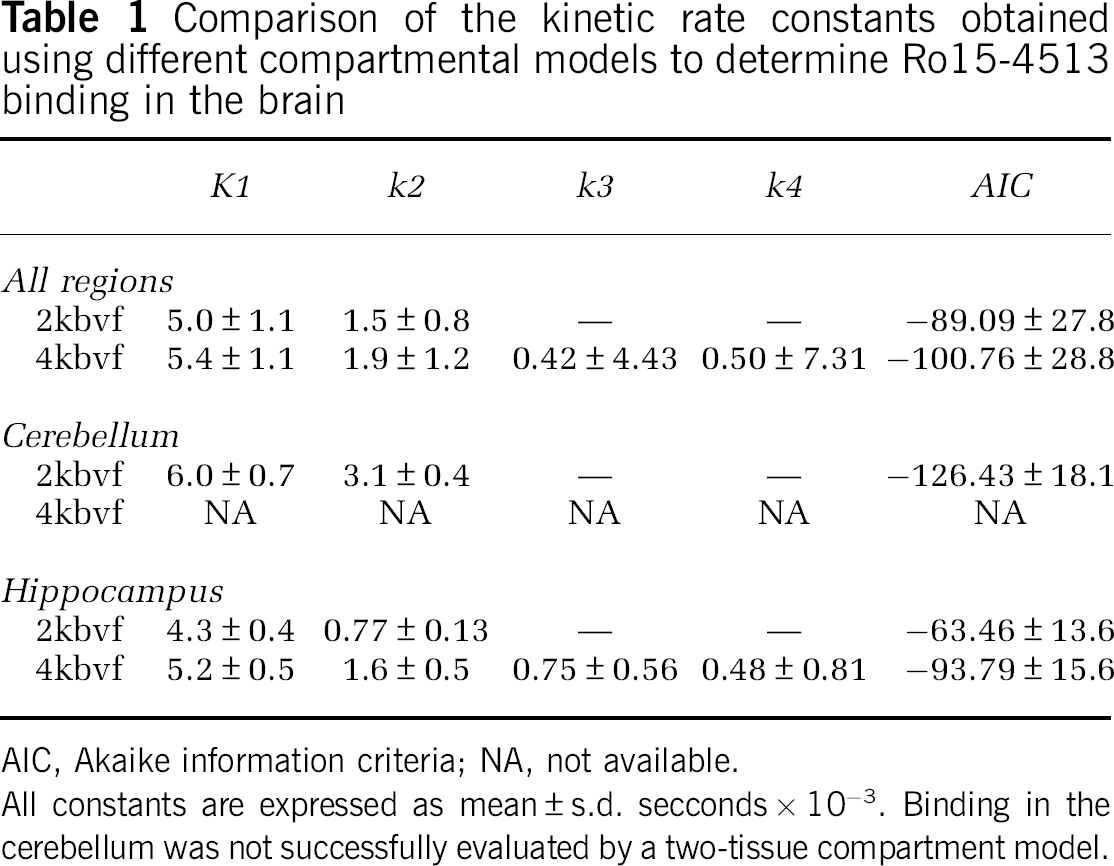
AIC, Akaike information criteria; NA, not available.
All constants are expressed as mean ± s.d. secconds × 10−3. Binding in the cerebellum was not successfully evaluated by a two-tissue compartment model.
Using a one-tissue compartment model with fixed
The two-tissue compartment model (4kbvf), yielded, on average, higher estimates for
Kinetic modelling of TACs from regions rich in GABARα1 receptors gave differing results compared with regions rich in GABARα5 receptors. In the GABARα1-rich cerebellum, the one-tissue compartment model fitted TACs almost as well as did the two-tissue compartment model (Akaike information criteria better in 3 of 5 individuals, average 6.8% more negative), but the two-tissue model produced consistently very small negative estimates of either or both
Although the estimates of rate constants differed significantly, as did the fits of the curves, similar overall
Spectral Analysis
[11C]Ro15-4513 scans. (
[11C]Flumazenil scans. (
Spectral Analysis: Assessment of Spectral Peaks
The distribution of spectral peaks in different regions was identified using Clickfit. Each region yielded a different spectrum of peaks, each peak position representing one of 100 values of β, described in the ‘Materials and methods' section. These results were pooled and a summed peak height for each peak was calculated for each region and each PET tracer in the presence or absence of zolpidem. The average height for each β-value was not representative of the true peak distribution, because the peaks are discrete and the spectral analysis algorithms assign consecutive values for those peaks not matching a predefined β.
There was a clear average peak height decrease with zolpidem for both ligands. For [11C]Ro15-4513, the differences were seen between 0.0020 and 0.0030 seconds−1. With [11C]flumazenil, the decreases were seen at faster rates, between 0.0030 and 0.0050 seconds−1 (data not shown).
To further investigate the source of these differences, a smaller number of brain regions with high and low α1 levels were selected for further analysis. Figures 3 and 4 illustrate data for the cerebellum and hippocampus after [11C]Ro15-4513 and [11C]flumazenil, respectively. As zolpidem is a GABARα1 agonist, it was expected that regions with high α1 levels and low levels of other GABA receptor subtypes should show a greater change in peak profile than areas with lower α1 levels. In the cerebellum, a region with almost solely high α1 levels, the fast kinetic profile for [11C]Ro15-4513 without zolpidem represents α1 subtype binding (average height = 0.00306 seconds−1; range of peaks 0.0030 to 0.0040 seconds−1, see Figure 3A). Zolpidem reduced average [11C]Ro15-4513 peak height, lessening the contribution of those curves to the IRF and spreading their range (average height = 0.00185 seconds−1; range of peaks 0.0020 to 0.0060 seconds−1, Figure 3A). The effect of zolpidem was estimated for this band of peaks in the cerebellum, to assess proposed α1 blockade. There was a significant decrease in
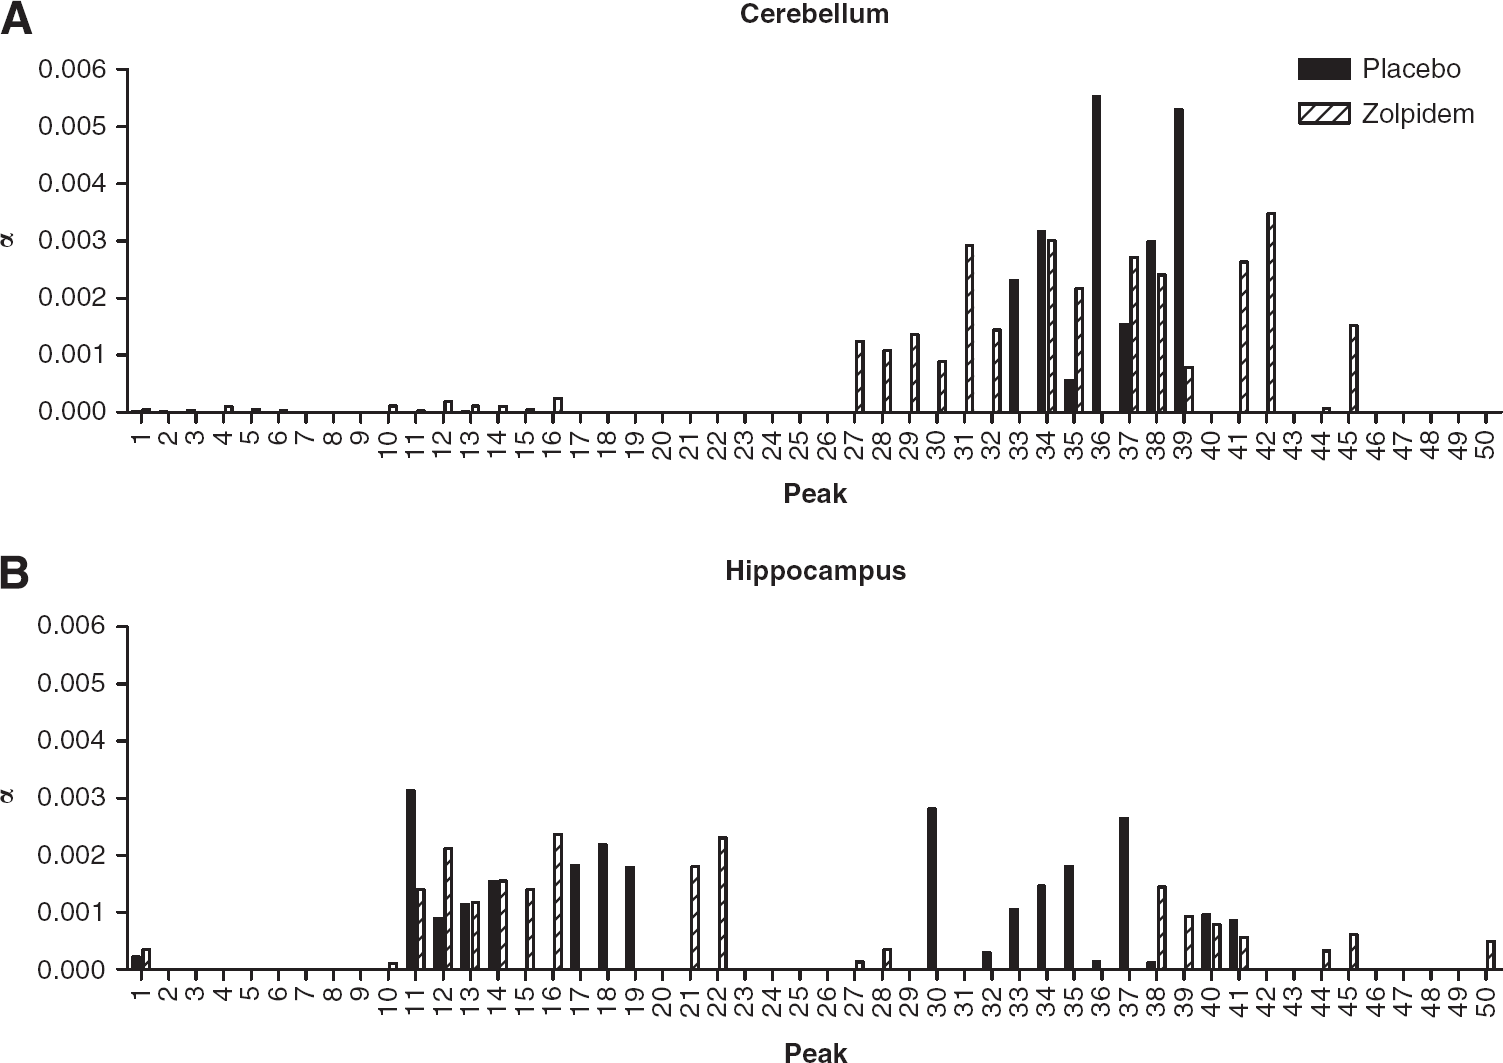
Comparison of [11C]Ro15-4513 spectral analysis results in (
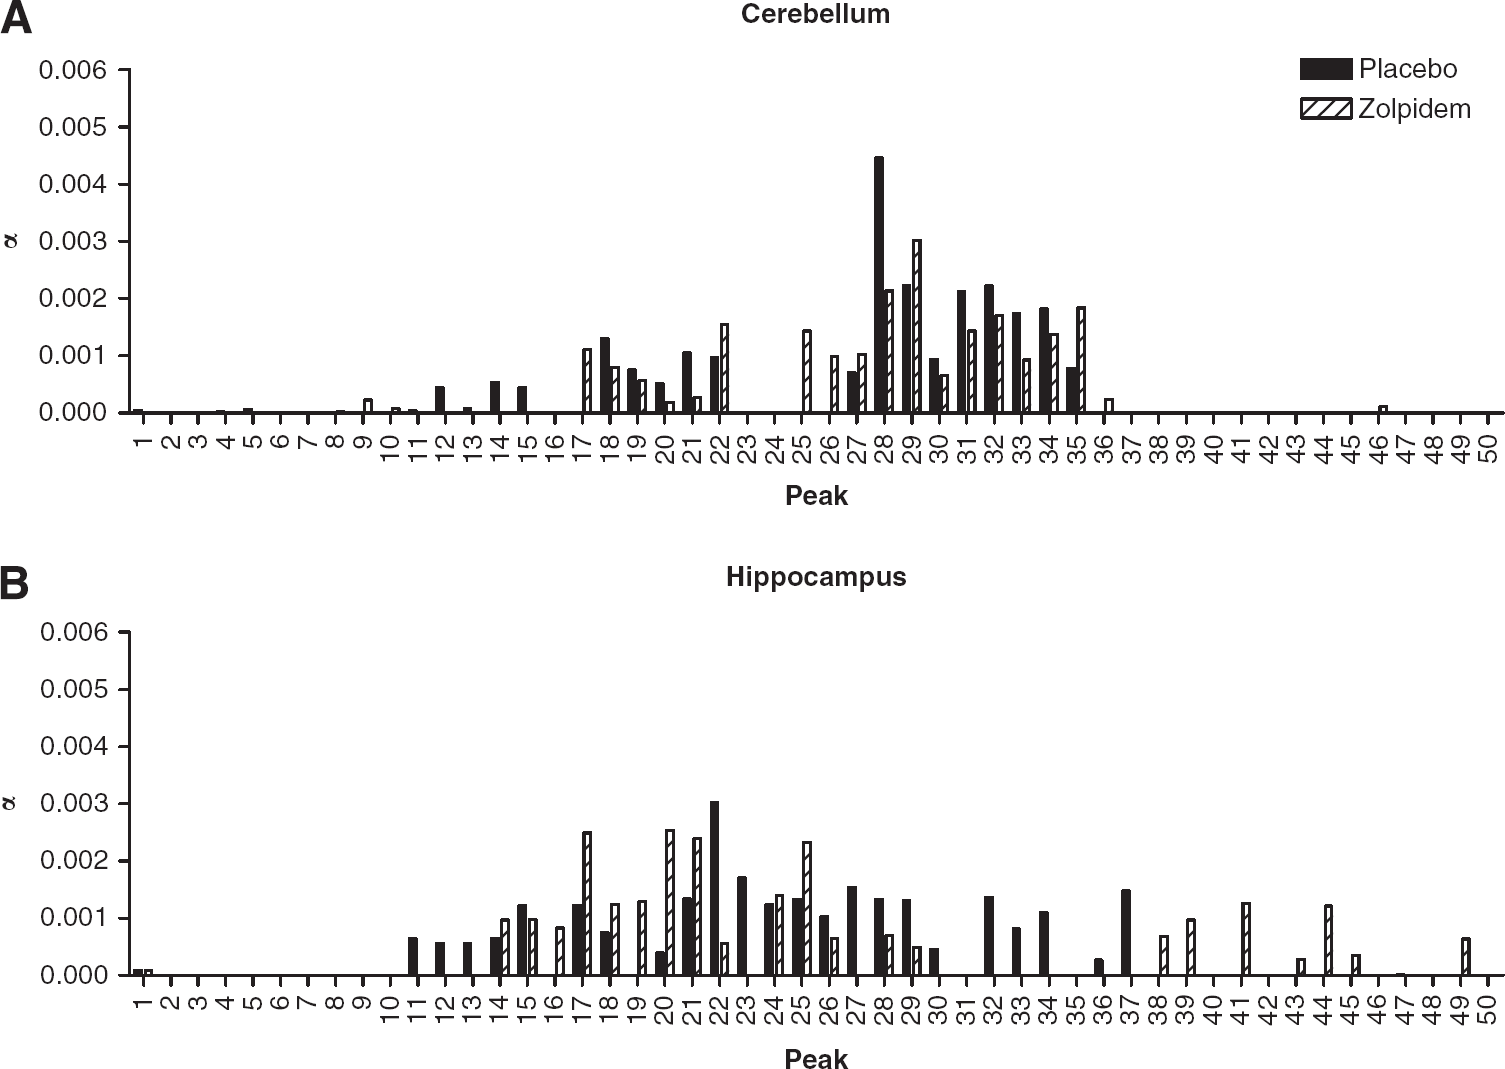
Comparison of [11C]flumazenil spectral analysis results in (
In contrast, in the hippocampus, a region with high α5 levels but also containing the α1 subtype, there are two clear ranges of kinetic components of [11C]Ro15-4513 (see Figure 3B). The fast component in the placebo scan (average height = 0.00122 seconds−1; range of peaks 0.0025 to 0.0045 seconds−1) is reduced and broadened in the presence of zolpidem (average height = 0.00065 seconds−1; range of peaks 0.0020 to 0.0060 seconds−1). This reduction in
Comparable results for spectral analysis of [11C]flumazenil in the cerebellum and hippocampus are shown in Figure 4. Although there are no clear distinctions between fast and slow kinetic components, there are differences in estimates of
Occupancy Estimation
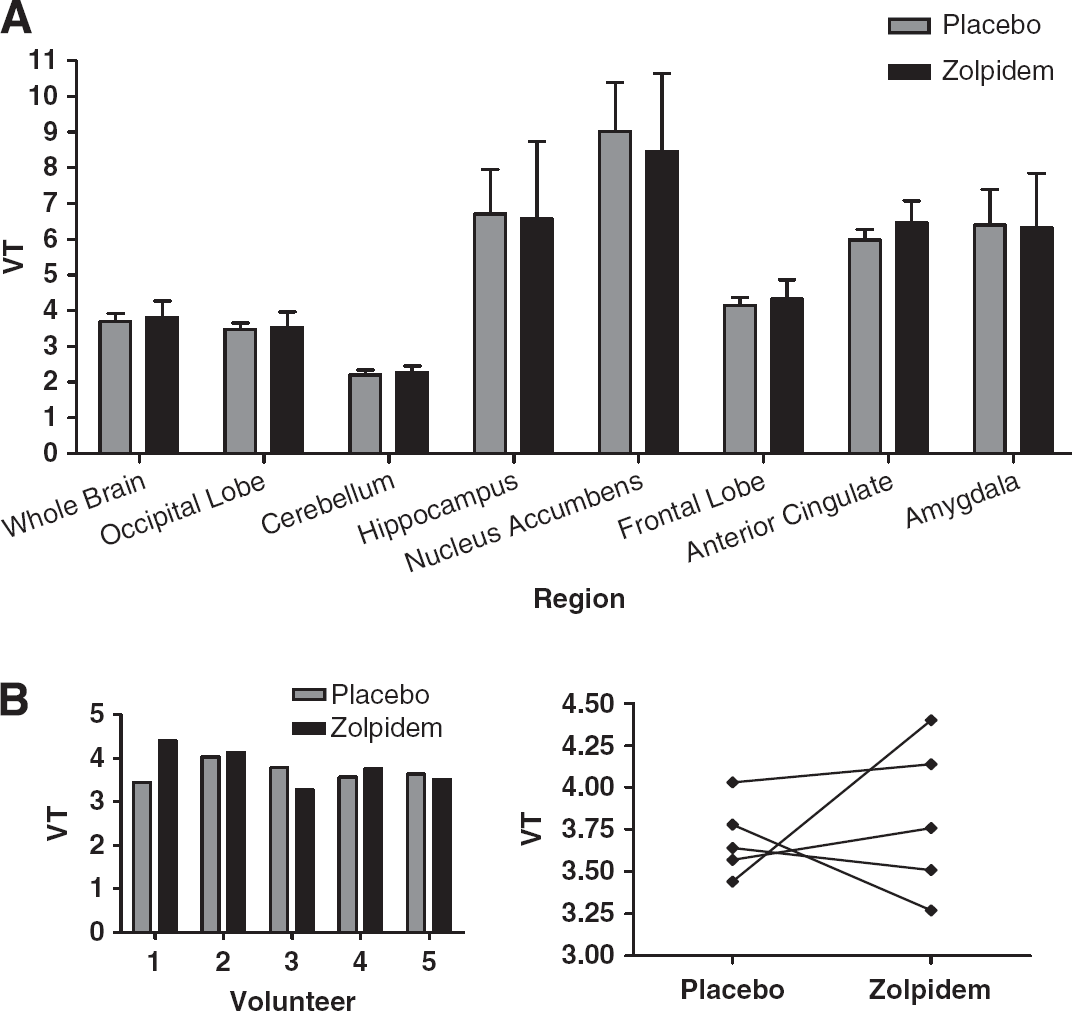
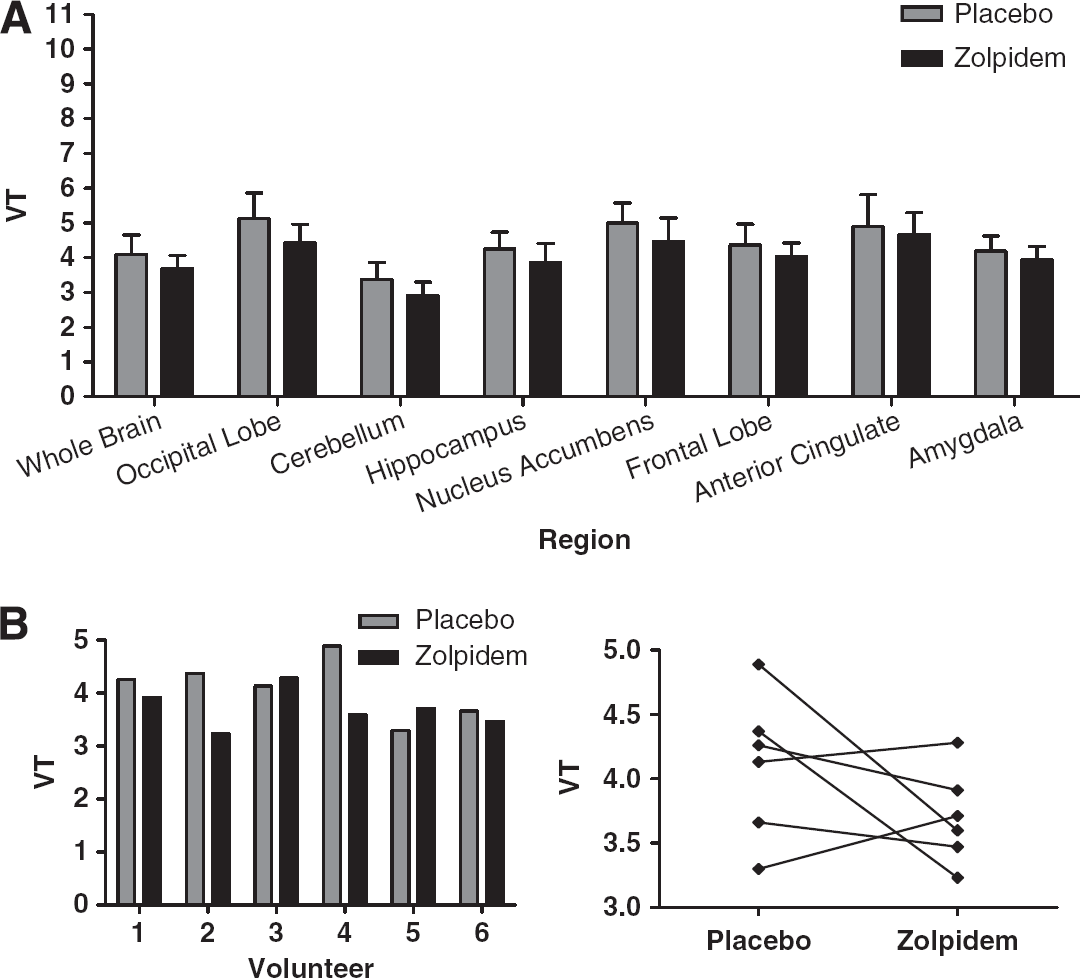
The lack of effect on average
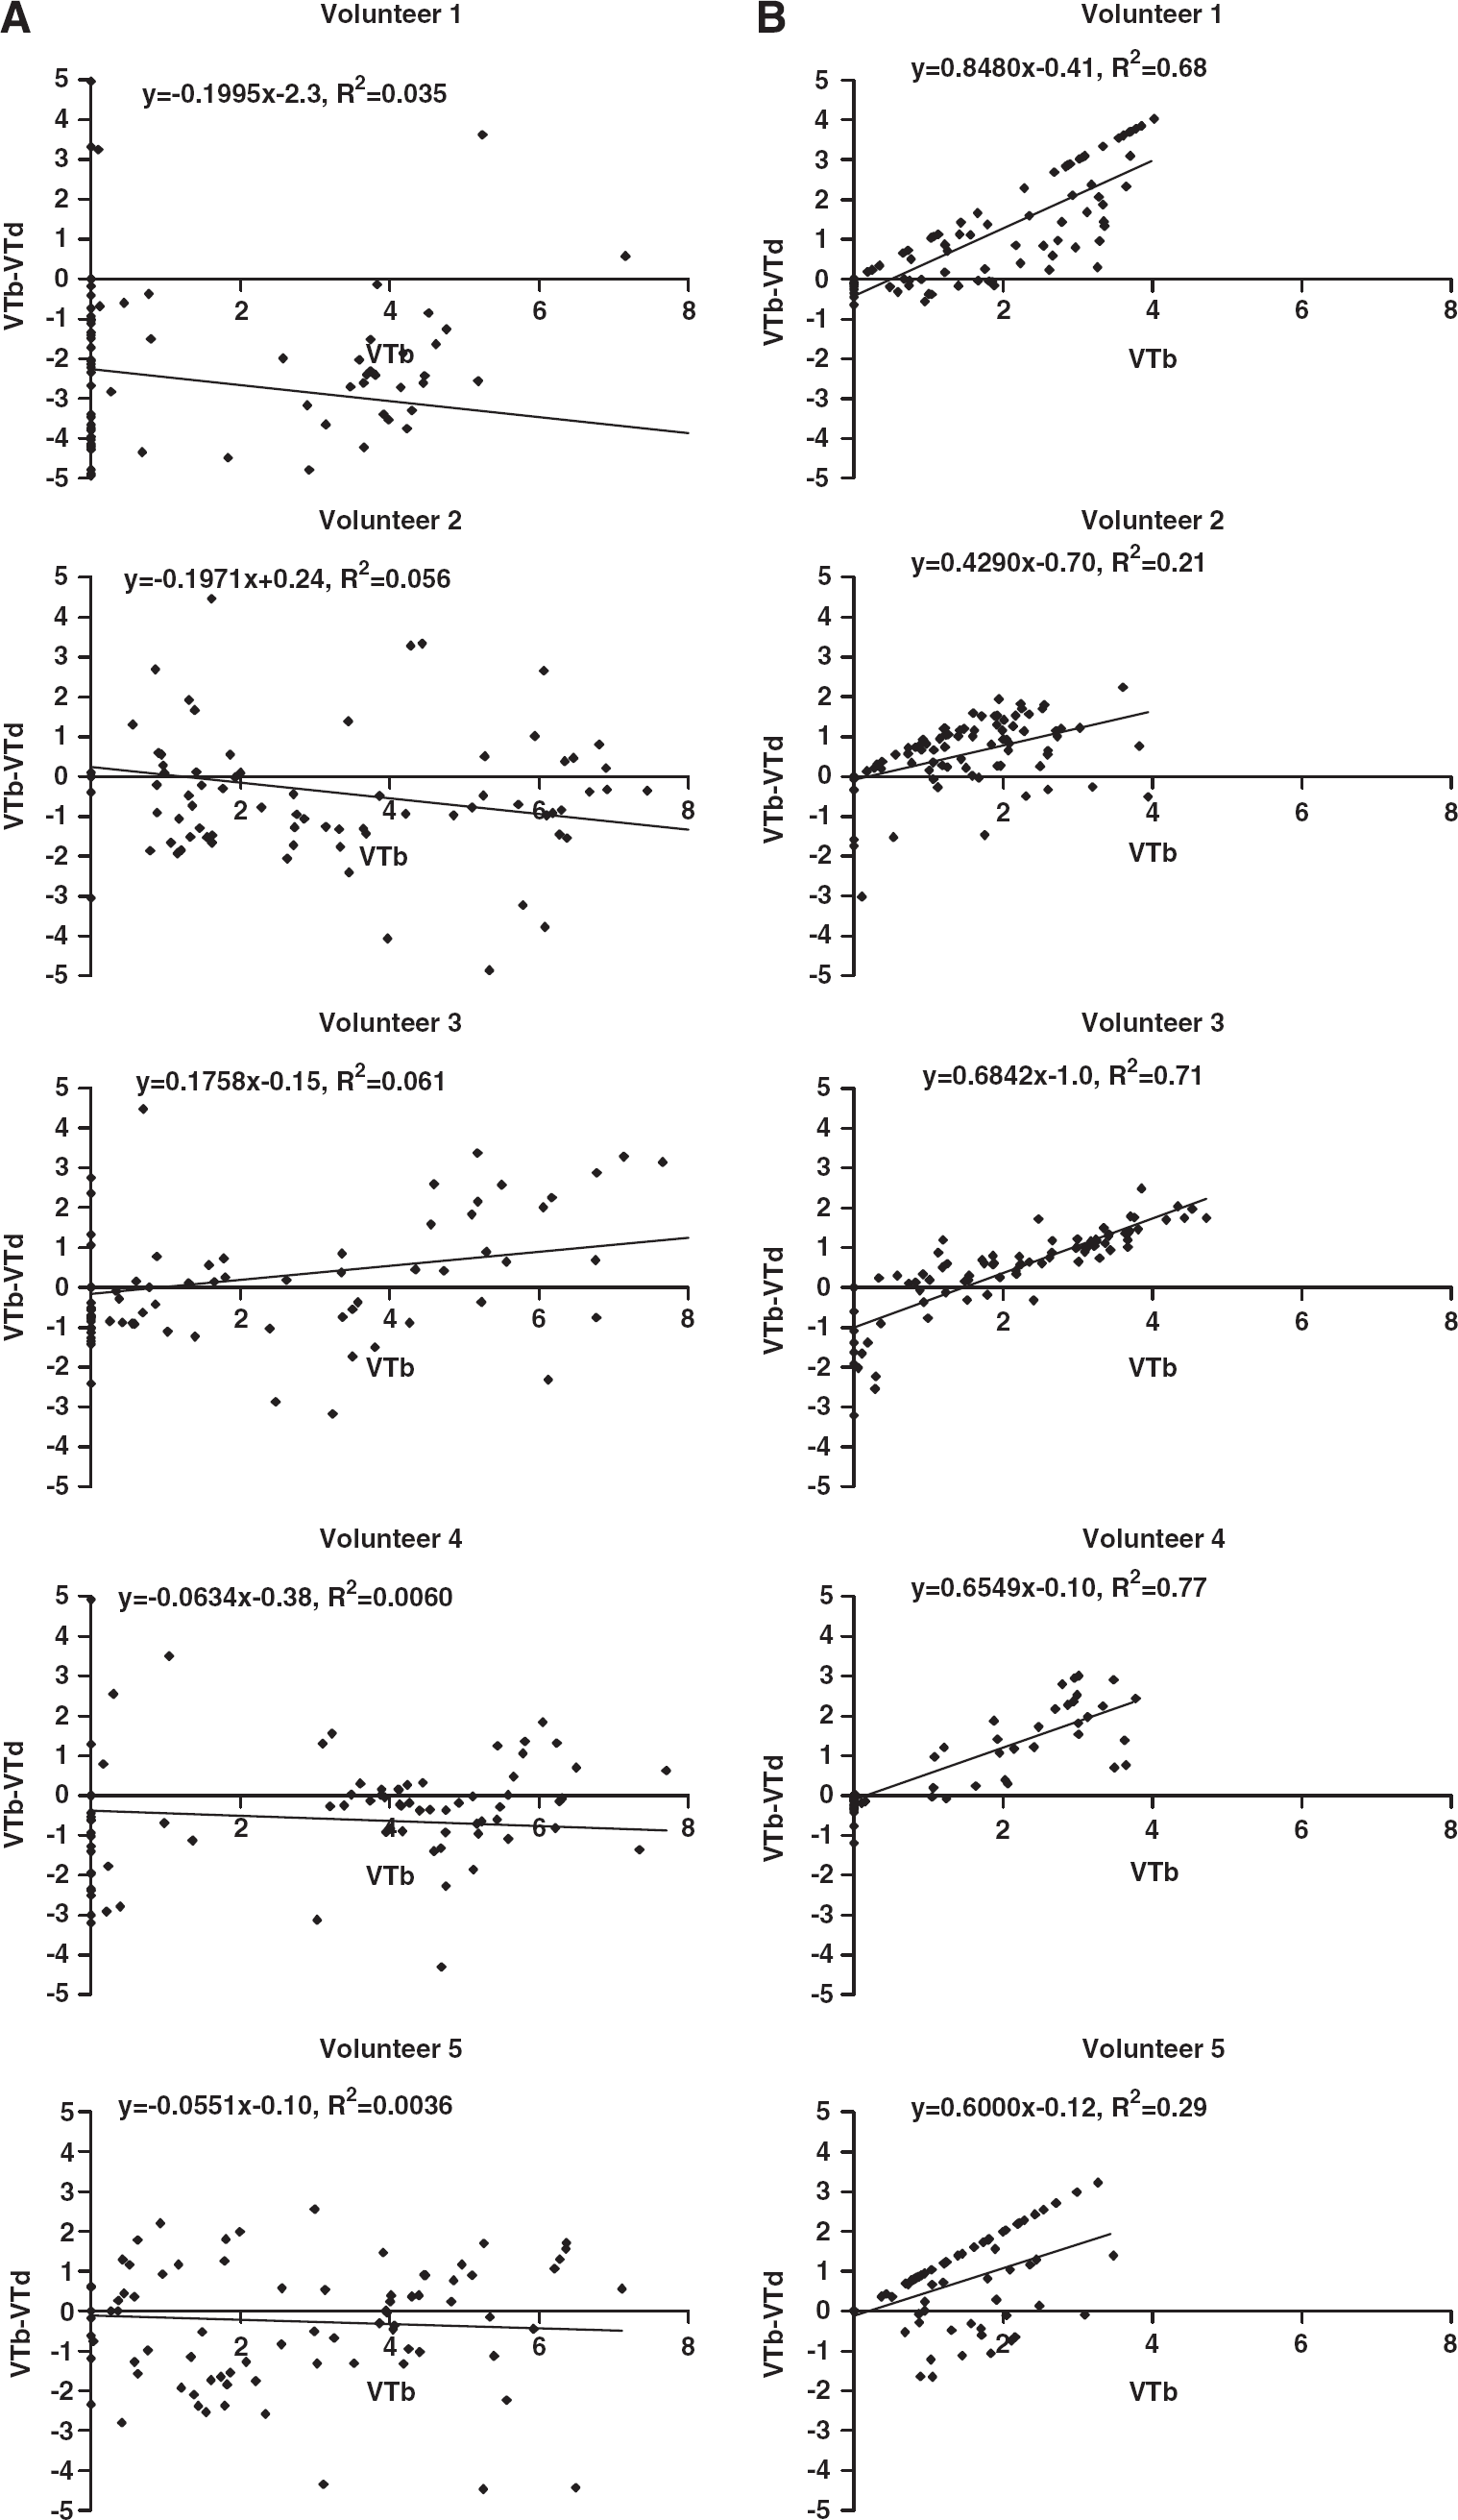
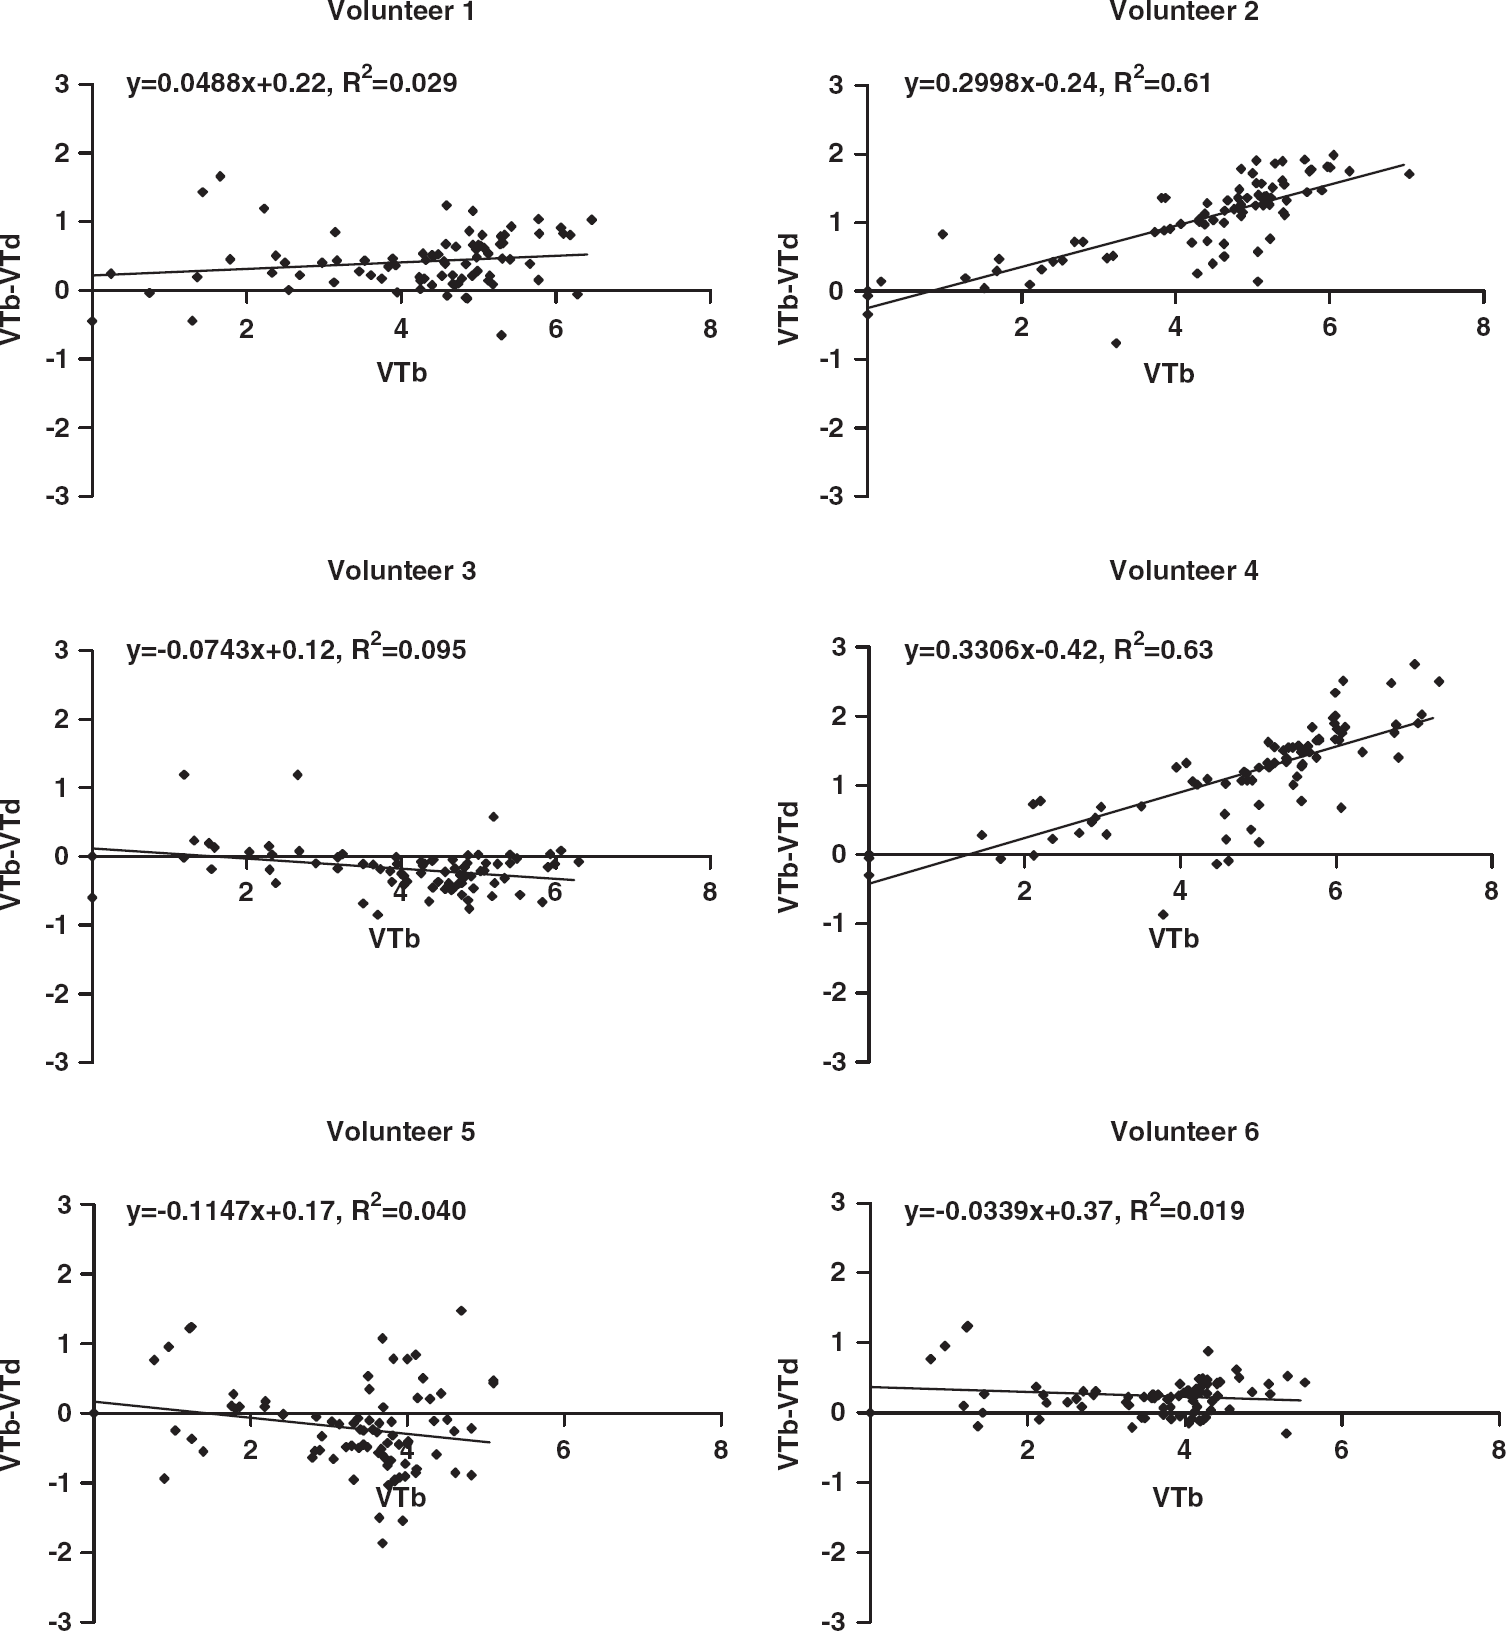
Occupancy plots using the fractional volume of distribution in baseline and postdrug studies, according to equation (2), are shown for each subject. (
Occupancy was also estimated using plots for each of the six volunteers in the [11C]flumazenil cohort. The results are shown in Figure 6. VT was calculated by voxel-wise spectral analysis described earlier. Only 2 volunteers showed data fitted significantly by regression, giving zolpidem occupancy estimates of 30 and 33%.
Occupancy plots for the [11C]flumazenil cohort, showing
Discussion
We have shown that zolpidem significantly reduced [11C]flumazenil VT in the whole brain by ~10%, whereas there is no reduction in [11C]Ro15-4513 VT. These results suggest that the GABARα1 binding of [11C]Ro15-4513 does not significantly affect overall VT, whether estimated by spectral analysis to produce parametric maps of VT, or by compartmental modelling. However when frequency components of spectra derived from [11C]Ro15-4513 images, proposed to reflect binding to the α1 subtype, are used to estimate VS, occupancy by zolpidem is shown to range from 43% to 85%. The dose of zolpidem was shown to be clinically relevant as it induced sedation and significantly impaired saccadic eye movement performance and word list recall.
The difference in binding properties of nonselective ligands in regions with differing populations of receptor subtypes ought to be demonstrable by applying various compartmental models. We hypothesised that more complex models would be required where there are multiple subtypes compared with brain regions with predominantly one subtype. One- and two-tissue compartmental models showed similar variability between individuals, but a different quality of fit to the data depending on region. In the cerebellum, an α1-rich region, one-tissue compartment models provided the best fit for observed data, with higher
Both [11C]flumazenil and [11C]Ro15-4513 bind to more than one GABA α receptor subtype. Flumazenil binds with similar affinity (~ 1 nmol/L) to α1, α2, α3, and α5 GABA-benzodiazepine receptors and lower affinity at α4 and α6 subtypes (Sieghart, 1995). Ro15-4513 has 10- to 15-fold higher affinity for the α5 subtype (0.7 nmol/L) compared with all remaining subtypes (Hadingham et al, 1993). Conventional compartmental modelling does not, in practical terms, accurately describe the complex pharmacodynamics when multiple receptor subtypes are present, especially when the different subtypes behave differently kinetically and are present in varying ratios depending on the brain region. In this study, compartmental modelling of [11C]Ro15-4513 was not sensitive enough to detect changes in lower-affinity binding to α1 the subtype. Despite the usefulness of these models to show different regional kinetics, they are pharmacological simplifications and not suitable for accurately describing nonselective ligands in quantitative analyses, although a two-tissue compartment model was proposed as effective in all regions by Asai et al (2009). Given that no one-compartmental model adequately represented the kinetics of tracer binding in all tissues, and that there are multiple specific binding sites, we suggest this imposes limitations on using the reference region approach for α5-rich regions because it violates its underlying principle that the volume of distribution of nontarget bound ligand is the same in target and reference tissues (Lammertsma and Hume, 1996). The pons is often used as a reference region, given the lack of suitable region devoid of benzodiazepine receptors, but the low binding in the pons is not sufficient to fully meet the assumptions of the reference tissue model. Therefore, binding in regions of interest is underestimated and/or additional steps have to be taken to more accurately estimate such specific binding levels (Litton et al, 1994; Klumpers et al, 2008; Asai et al, 2009).
In this study, spectral analysis consistently yielded higher estimates of VT relative to compartmental modelling. The whole-brain spectral profiles, using all 83 regions defined in the atlas (Appendix 1; Hammers et al, 2007), showed that with both [11C]flumazenil and [11C]Ro15-4513, zolpidem reduced the height of peaks in certain frequency ranges. Subtype differences could not be immediately inferred from these spectral frequency components, a problem compounded by complexity of the range of subtype ratios in the large number of brain regions included in the analysis. Unfortunately, the spectrum for [11C]flumazenil proved too homogeneous for separation of peaks based on regional receptor subtype density. However, for [11C]Ro15-4513 images, in α5-rich regions such as the hippocampus and nucleus accumbens, we found a high-affinity binding site with a slower kinetic profile, consistent with the fitting of data from these regions with two-tissue compartment models. This slow component was not affected by zolpidem administration, and was therefore attributed to high-affinity binding to the α5 subtype. In addition, in both α5-rich and α5-poor regions, there was a fast kinetic component present that was significantly reduced after zolpidem administration, most likely representing specific binding with lower affinity to the α1 subtype. The intersubject variability of specific volume of distribution defined using these spectral bands was lower than for the total volume of distribution,
Confirmation of these subtype-specific frequency components in [11C]Ro15-4513 images may be provided with further study using α5-specific blockade. Until that is done, we cannot absolutely exclude that α2 and α3 subtypes may have contributed to the spectra we have taken to represent α5. In addition, there are no drugs selective for α2 and/or α3 available. More broadly, these spectral band-pass methods may be useful to further sharpen analytical tools for
Benzodiazepine agonists have previously been believed to exert their effects when occupying only a relatively small number of receptors in humans. This is based on [11C]flumazenil PET and [123I]iomazenil SPET studies showing sedation or sleep is associated with clonazepam (0.03 mg/kg) at 15% to 23% occupancy, with diazepam (30 mg) at 24%, with alprazolam (2 mg) at 16%, and with midazolam (50 mcg/kg) at 17% to 35% or (6 mg/h) at 20% to 30% (Shinotoh et al, 1989; Pauli et al, 1991; Videbaek et al, 1993; Malizia et al, 1996; Fujita et al, 1999). Zolpidem is the only licensed benzodiazepine subtype-selective drug with appropriate pharmacokinetics we were able to give to humans though, as it is an agonist, this limited the dose we were able to give safely. Abadie et al (1996) reported that 20 mg oral zolpidem resulted in 20% to 29% occupancy of benzodiazepine receptors assessed with [11C]flumazenil PET. We report that using [11C]flumazenil, although occupancy cannot be directly estimated, the relatively small global decreases of ~10% in
It was notable that for both PET ligands, there was high intersubject variability of the effect of zolpidem on ligand binding. This is consistent with report by Abadie et al (1996) who also used 20 mg zolpidem with [11C]flumazenil PET and described ‘spurious' intersubject variability including increases in [11C]flumazenil binding in the presence of zolpidem as we saw in some of our subjects. Therefore, it seems that subject heterogeneity is commonly seen when investigating the GABA system, of which one consequence has been some studies require large numbers of individuals. It is not clear what contributes to the variability of [11C]flumazenil and [11C]Ro15-4513 binding but because both ligands bind to several different benzodiazepine subtypes, it is possible that relatively small variations in receptor density ratios have a role. For instance, with [11C]Ro15-4513, the greater contribution to binding potential is proposed to come from the high-affinity GABARα5 component, which will be sensitive in ratio to the ubiquitous GABARα1 component. Similarly, it is possible that different subtypes are differentially affected by changes in endogenous GABA levels. It is for this reason that we have developed this technique with [11C]Ro15-4513 to describe the contribution of benzodiazepine receptor subtypes to this variability. This method results in an importantly consistent spread of positive occupancy estimations across all individuals.
We believe this development and application of spectral band-pass methods will help characterise benzodiazepine receptor subtypes as compounds with appropriate relative affinities become available. The use of nonselective ligands to show
Footnotes
Acknowledgements
The authors acknowledge the scan expertise and support provided by Hammersmith Imanet. This paper is dedicated to the memory of Dr Ralph Myers, father, mentor, and friend.
The authors declare no conflict of interest.