
Abstract
Studies in humans suggest that regions that show maximal increases in brain oxygen extraction fraction (OEF) in the hours following an ischemic episode are those most vulnerable for infarction and are often, although not always, associated with the final site of infarction. To clarify this issue, we followed the hemodynamic and metabolic characteristics of regions with an initially maximally increased OEF and compared them with the ultimately infarcted region in an experimental stroke model. Positron emission tomography (PET) was used to obtain functional images of the brain prior to and following reversible unilateral middle cerebral artery occlusion (MCAO) in 11 anesthetized baboons. To model early reperfusion, the clips were removed 6 h after occlusion. Successive measurements of regional CBF (rCBF), regional CMRO2 (rCMRO2), regional cerebral blood volume, and regional OEF (rOEF) were performed during the acute (up to 2 days) and chronic (>15 days) stage. Late magnetic resonance imaging (MRI) scans (coregistered with PET) were obtained to identify infarction. Reversible MCAO produced an MRI-measurable infarction in 6 of 11 baboons; the others had no evidence of ischemic damage. Histological analysis confirmed the results of the MRI investigation but failed to show any evidence of cortical ischemic damage. The lesion was restricted to the head of the caudate nucleus, internal capsule, and putamen. The infarct volume obtained was 0.58 ± 0.31 cm3. The infarcts were situated in the deep MCA territory, while the area of initially maximally increased OEF was within the cortical mantle. The mean absolute rCBF value in the infarct region of interest (ROI) was not significantly lower than in the highest-OEF ROI until 1–2 days post-MCAO. Cerebral metabolism in the deep MCA territory was always significantly lower than that of the cortical mantle; decreases in CMRO2 in the former region were evident as early as 1 h post-MCAO. In the cortical mantle, the rOEF was initially significantly higher than in the infarct-to-be zone. Subsequently, the OEF declined in both regions. The differences in the time course of changes in CMRO2 and OEF between these two regions, with the eventually infarcted area showing earlier metabolic degradation and in turn decline in OEF, presumably underlie their different final outcomes. In conclusion, following MCAO, the region that shows an early maximal increase in the OEF is both topographically and physiologically distinct from the region with final consolidated infarction if reperfusion is allowed at 6 h. This high OEF, although indicative of a threatened condition, is not an indicator of inescapable consolidated infarction and is thus a situation in which therapy could be envisaged. Whether or not it is at risk of infarction and thus constitutes one target for therapy remains to be seen.
Keywords
In clinical studies of stroke, positron emission tomography (PET) has been of invaluable use in mapping both hemodynamic and metabolic parameters (Lenzi et al., 1982; Wise et al., 1983; Frackowiak and Lammertsma, 1985; Baron, 1991). One major finding in these studies has been the frequent observation of an area in which there is a high oxygen extraction fraction (OEF) that persists up to 4 days following the ictus in some cases (Wise et al., 1983; Frackowiak and Lammertsma, 1985; Ackerman et al., 1989; Baron, 1991; Marchai et al., 1993). Because a high OEF reflects an inadequate oxygen supply in relation to underlying metabolic needs, it is implicit that the higher the OEF, the greater the risk of hypoxia and the tissue becomes more and more in a situation of increased jeopardy. Wise et al. (1983) reported that brain regions in which the OEF was initially elevated were consistently associated with an eventual infarction that in turn caused a secondary fall in OEF to abnormally low values. There are, however, certain exceptions to these observations and some brain regions that show an initially elevated OEF may not inevitably progress to infarction (Powers et al., 1985; Ackerman et al., 1989; Baron et al., 1989; Furlan et al., 1994). Accordingly, regions of high OEF most probably represent tissue that is at risk, but concrete sequential data to support this hypothesis are lacking. Thus, it is important to clarify the relationship between OEF and final consolidated infarction, especially if PET is ever to be used as a tool for patient selection in therapeutic trials. As of today, it is not certain whether the area with maximal OEF increase early after stroke is ineludibly destined to be infarcted, or if it is only at risk, i.e., still amenable to therapy.
In contrast to human studies that provide only discrete time points of the highly dynamic changes in ischemic brain physiology, studies in nonhuman primates are optimal to address these issues because they allow both acute and sequential studies (Yonas et al., 1988; Tenjin et al., 1992; Monsein et al., 1993; Pappata et al., 1993; Touzani et al., 1995) with controlled reperfusion and computed tomography/magnetic resonance imaging (MRI) infarct mapping in the chronic stage (Spetzler et al., 1983; Sette et al., 1993).
We have carried out one such a study in the acute (first hour) and chronic stages following a 6-h temporary occlusion of the middle cerebral artery (MCAO) in the anesthetized baboon. We chose a reversible occlusion model because it mimics the clinical situation in which, ideally, early PET measurements may be made and continued during therapeutic or occasionally spontaneous MCA recanalization (Fieschi et al., 1989). The experimental data obtained by Tenjin et al. (1992), Pappata et al. (1993), and Heiss et al. (1994) suggested that remarkable dynamic changes in the OEF in the acute stage of an ischemic episode may be region dependent. Therefore, in the present investigation, the following question was asked: Is the area with maximal OEF irreversibly destined to consolidated infarction, or does it represent only vulnerable tissue? To this end, we compared the topography of the region with early maximally elevated regional OEF (rOEF) with that which represents the final consolidated infarct and compared the time course of hemodynamic and metabolic changes in these two regions.
METHODS
Experiments were performed in 11 adolescent male baboons (Papio anubis) with body weights ranging from 7 to 16 kg. The baboons were housed in individual cages maintained at 24°C with 50% relative humidity on a 12-h/12-h light/dark cycle and were fed commercial chow supplemented with fresh fruits and water ad libitum. The evening prior to investigation, all solid foods were withdrawn.
Anesthesia
The baboons were tranquilized initially with a short-acting barbiturate (methohexital 20 mg/kg i.m.; Brietal, Lilly), and subsequent to the placement of catheters in the external saphenous veins, anesthesia was induced by the administration of etomidate (3 mg/kg i.v.; Hypnomidate, 125 mg/ml, Janssen). The hypnotic effects of etomidate were potentiated by Clonidine (80 μg, infused intravenously over 10 min; Catapressan, Boehringer Ingelheim). Following the administration of atracurium (0.5 mg/kg i.v.; Tracrium, Wellcome) so as to achieve adequate muscular relaxation, endotracheal intubation was performed. All baboons were placed on intermittent positive-pressure ventilation with periodic hyperinflation to minimize atelectasis. A fixed respiratory rate (20 min−1) was employed and the tidal volume adjusted so as to maintain normocapnia (Paco2 39–41 mm Hg). In every case, anesthesia was maintained with 67% nitrous oxide in oxygen (humidified at 38°C) along with continuous intravenous infusions of etomidate (0.3 mg/kg-h) and atracurium (0.75 mg/kg-h). Under this maintenance anesthetic regimen, MABP remained remarkably stable throughout the entire duration of the studies. During surgical interventions, anesthesia was supplemented with isoflurane (0.5–1.5%; Forene, Abbott); isoflurane was discontinued at least 90 min before any PET measurement. Prior to the placement and removal of the stereotaxic ear bars, atropine sulfate (0.25 mg i.v.) was administered. All baboons received an intravenous perfusion of heparin (50 IU/h at 3 ml/h) starting 2 h before the occlusion and continued until 1 h after the reperfusion period.
MCAO
The transorbital approach to the right MCA described by Hudgins and Garcia (1970) was employed. Following enucleation, a small craniectomy was performed using a high-speed saline-cooled dental drill to expose the right MCA. The dura was opened and the arachnoid dissected to allow placement of two microvascular clips: one on the proximal part of the main MCA trunk and the other on the orbitofrontal branch. During this procedure, warmed saline was used to reduce the possibility of vascular spasm. The occlusion was temporary (6 h), and both the occlusion and the reperfusion phases were verified by Doppler sonography. Reconstruction of the orbit under aseptic conditions allowed a complete postoperative recovery in all baboons and permitted long-term survival, with the exception of one baboon that died at day 3 due to postoperative complications.
Postoperative care
Before recovery from the final surgical intervention, a blood transfusion was given (250 ml of concentrated erythrocytes; hematocrit > 80%; hemoglobin 20 g/L, preceded by 2 mg dexamethasone i.m.; Soludecadron). In all instances, neostigmine (0.5 mg i.v.; Prostigmine) was administered to reverse the effects of atracurium before the baboons were weaned from the ventilator. Antibiotic treatment with cephamandole was continued over 5 days (15 mg/kg i.m. daily; Kefandol).
Physiological monitoring
End-tidal CO2 and N2O concentrations were monitored continuously by an infrared adsorption analyzer (5200 CO2 monitor; Ohmeda). Inspired oxygen concentrations were continuously measured by an electrochemical system (Ohmeda). Following the percutaneous insertion of a catheter into each femoral artery, blood samples were withdrawn periodically for the measurement of Paco2, Pao2, pH, and hemoglobin concentrations (ABL 300; Radiometer). Hematocrit and blood glucose concentrations (glucose oxidase method; Beckman) were also measured frequently. Total blood loss due to sampling and the surgical intervention was estimated to be of the order of 70 ml. As a vehicle for intravenous anesthetic agents, physiological fluids (saline or Ringer lactate) were infused intravenously (˜50 ml/h, over 14 h). A urethral catheter was inserted and urine output measured (˜500–800 ml over 14 h). Metabolic acidosis, defined as a base deficit of >3 mEq/L, was corrected by NaHCO3 administration. A physiological recording system (Hewlett Packard) was used to monitor the ECG, heart rate, and arterial pressure both by a Plethysmograph and directly by a strain gauge system. Body temperature was maintained within normal limits (37–38°C) by heating blankets. Following the end of each PET session, the baboons were allowed to recover fully and were returned to their cage.
PET procedures
A control PET measurement was performed ˜2 weeks prior to the occlusion. Two further measurements were made during the occlusion (MCAO + 1 h and MCAO + 4 h) and another at 1 h following the reperfusion phase (MCAO + 7 h). Additional PET studies were performed at 1–2 days post-MCAO and again between 15 and 50 days postocclusion (Fig. 1). We used the four-ring, seven-slice LETI TTV03 PET device (CEN, Grenoble, France) with an intrinsic spatial resolution of 5.5 × 5.5 × 9 mm [x, y, z] (Mazoyer et al., 1990). To obtain reproducible head positioning (both inter- and intraanimal), the baboon's head was fixed in a specially designed frame with ear bars being placed in the external bony auditory canal and checked by a radiogram. External laser beams allowed us to select seven planes [-27 to +45 mm relative and parallel to the canthomeatal (CM) line] for imaging, according to an anatomical PET atlas (Riche et al., 1988). A 68Ga-68Ge transmission scan was performed prior to each PET session. With use of the 15O2 steady-state technique (with measured attenuation correction), successive inhalations of 15O2-labeled CO, O2, and CO2 allowed parametric imaging of the regional cerebral blood volume (rCBV), blood volume-corrected regional cerebral oxygen metabolism (rCMRO2), regional CBF (rCBF) and the rOEF to be obtained (Frackowiak et al., 1980; Sette et al., 1989). A calculation was performed to obtain the rCBF/rCBV image.
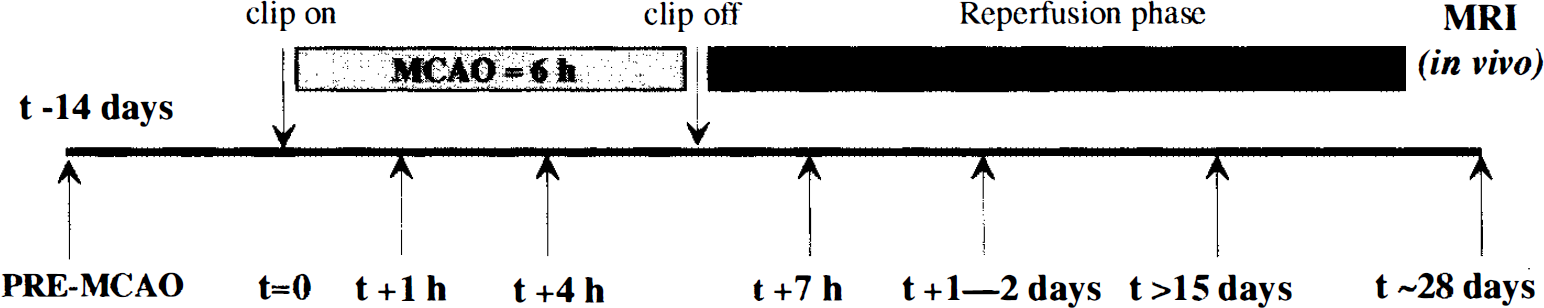
Timing of the positron emission tomography (PET) studies (arrows) and magnetic resonance imaging (MRI) measurements. MCAO, middle cerebral artery occlusion.
Morphological imaging
In the chronic stage (>16 days after MCAO), the baboons underwent an MRI procedure in vivo (slice thickness 3 mm, ̅T2 scan; Signa 1.5 T, General Electric, Milwaukee, WI, U.S.A.) to establish the presence, topography, and size of a hyperintense signal, taken to represent approximately the final infarct (Sette et al., 1993). The same positioning procedure as that described for the PET study was employed during these examinations, which allowed us to obtain superimposable images for both procedures.
Regions of interest
Region of interest based on highest OEF at MCAO + 1h. In accordance with the literature (Pappata et al., 1993), we chose a region of interest (ROI) based on a computer-generated isocontour (88% of the maximal pixel value) that delineated the highest-OEF area in the 1-h post-MCAO PET image. In this objective ROI procedure, the threshold (88%) was adjusted from that used by Pappata et al. (1993) to allow for improved spatial resolution of the PET camera and so as to result in similar surface areas of interest (see Results). This ROI was constantly most prominent on the basal ganglia plane situated parallel to and +21 mm above the CM line (Fig. 2). The plane chosen represents most of the territory supplied by the MCA and showed the highest OEF with the most typical and striking changes as well as the area of infarcted tissue (see following). This highest-OEF ROI, where the phenomenon of misery perfusion was maximal, was copied by a computer mirror function onto the contralateral hemisphere. Subsequently, both these ROIs (on the ipsilateral and contralateral hemispheres) were transposed by an image analysis system to the PET images of all other parameters (i.e., CBF, CMRO2, CBV, and CBF/CBV images) obtained on the same plane and at all times studied.
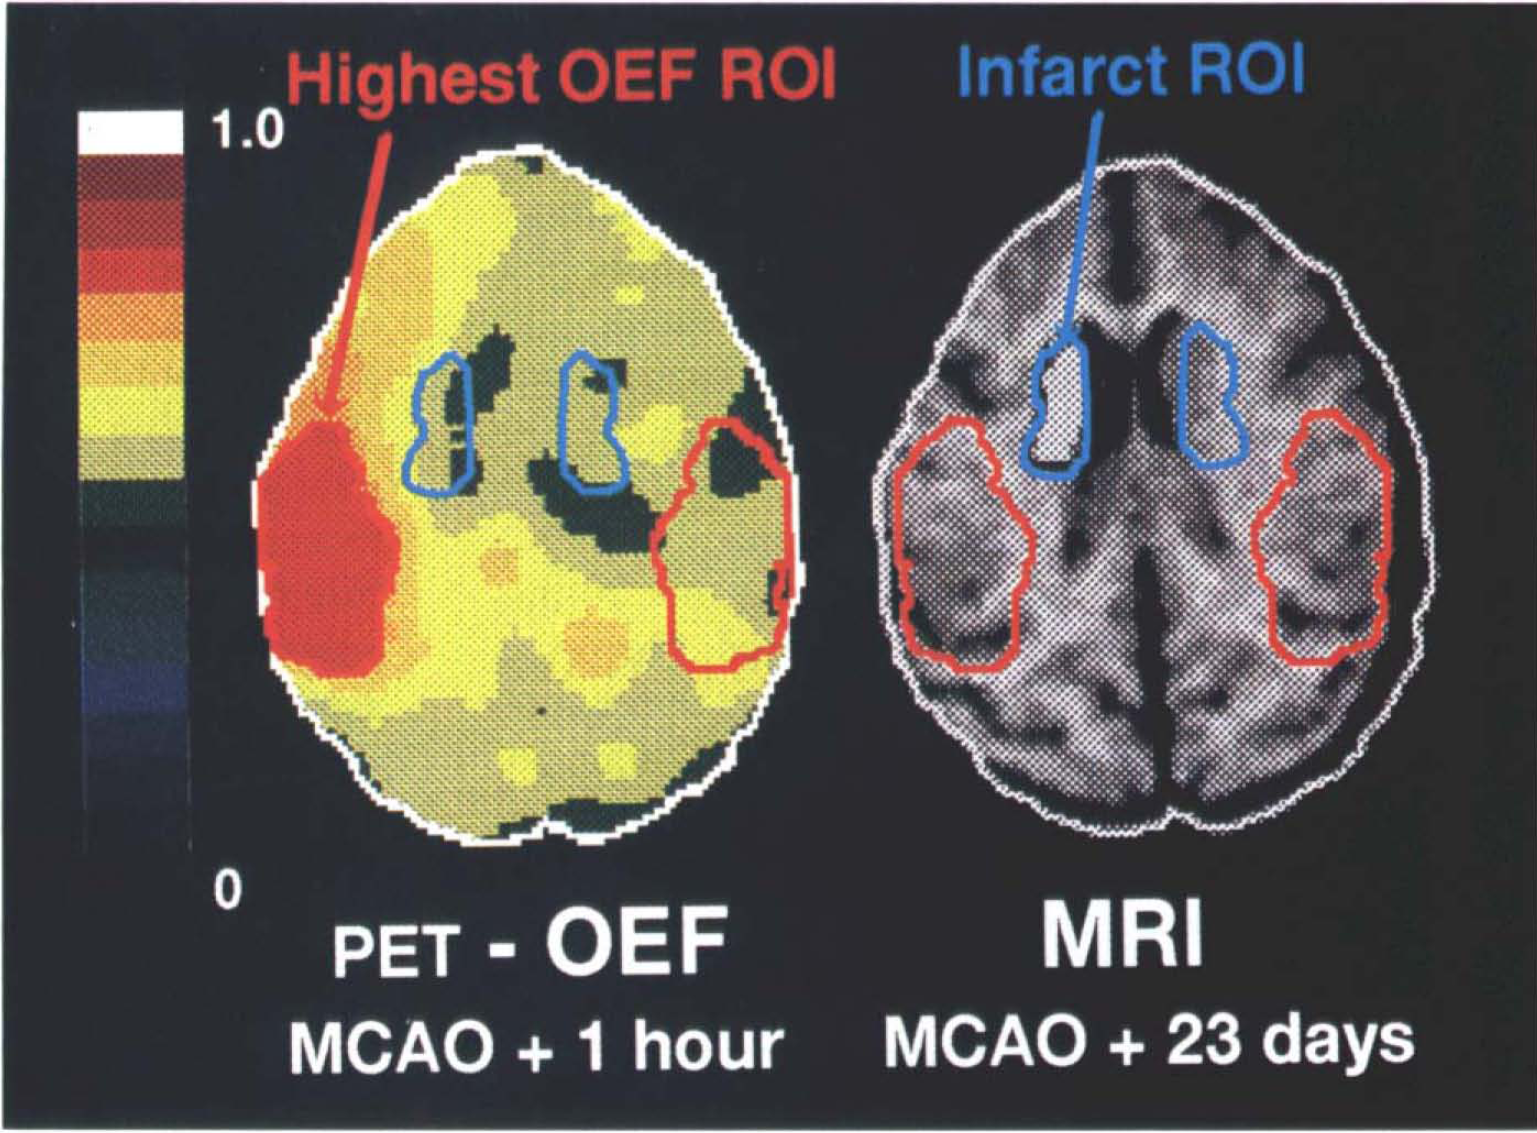
Illustration of the region-of-interest (ROI) placements in baboon no. 10, showing the positron emission tomography image of the oxygen extraction fraction (OEF) obtained at middle cerebral artery occlusion (MCAO) + 1 h and the chronic stage magnetic resonance image (MRI ̅T 2 ) obtained (in vivo) at MCAO + 23 days. The axial cuts were taken parallel to and + 21 mm above the canthomeatal plane. The OEF image is represented with respect to a pseudocolor scale for pixel values between 0 and 1.0. The highest-OEF ROI (identified by a computer-generated isocontour equal to 88% of the maximal pixel value) is shown together with the contralateral mirror image counterpart. The contrast for the infarct ROI shown on the MR image was chosen to highlight the hyperintense ̅ 2 T signal; note also a relative dilatation of the adjacent lateral ventricle. The highest-OEF ROI is essentially restricted to the cortical mantle, while the infarct was always located in the deep MCA territory (right basal ganglia).
ROI based on consolidated infarct. The MR images (coregistered with PET) were used to select the plane on which a hyperintense area was readily demonstrable. Again, this region was located on the basal ganglia plane (CM + 21 mm). These images, standardized to the same pixel size as the PET image, were displayed on a video device to determine an irregularly shaped ROI (presumably representative of the infarct) that followed a computer-generated isocontour determination of density changes in the MRI hyperintense area and for which the computer provided the area in square centimeters. The infarct ROI was then copied by a computer mirror function procedure onto the contralateral hemisphere with respect to the midline (Fig. 2). As before, following computer-assisted superimposition of the MRI and PET images, the ROIs were transposed onto the corresponding PET parametric images. The values for these functional parameters were then calculated for the infarct ROI on these images for both hemispheres and for all PET studies.
Neuropathology
Approximately 4 weeks after MCAO, the baboons were curarized, ventilated, and deeply anesthetized with 2–3% isoflurane. Heparin (5,000 IU) was administered intravenously to facilitate exsanguination. The baboons were placed in the supine position, the thorax opened through a midline incision, and a cannula inserted into the ascending aorta via the left ventricle. After incising the right atrium and clamping the descending aorta, heparinized saline (5 L) was perfused at the baboon's mean arterial pressure until the perfusate from the right atrium was bloodless. Thereafter, 8 L of FAM (formaldehyde 40%/glacial acetic acid/absolute methanol 1:1:8) was perfused at the same pressure to fix the brain in situ. Following decapitation, the head was placed in the FAM fixative at 4°C for a minimum of 24 h. The brain was removed from the skull and immersion-fixed in FAM for a further 7 days minimum before being transferred to a 70% solution of alcohol.
Based on the MRI data, a single block of tissue (in which the infarct was located) was cut and embedded in paraffin wax. Coronal sections 15 μm thick were taken with reference to a stereotaxic atlas of the baboon's brain (Riche et al., 1968) and stained with hematoxylin and eosin for examination of infarct topography by conventional light microscopy. In addition, a standard image analyzer was used to map the contour of healthy tissue. The surface area of the lesion was subsequently calculated by subtraction from the contralateral hemisphere (Touzani et al., 1995; Young et al., 1995). Infarct volume was calculated by integration over 10 equidistant slices that encompassed the whole lesion. In this study, the histological results were intended to confirm the infarct seen on the MRI data; a three-dimensional reconstruction and matching of histological and MRI data were not possible because of the different orientations of the cuts as well as the shrinkage and collapse effect related to the histological procedure.
Data analyses
Physiological and biochemical data were evaluated by analysis of variance (ANOVA) followed by Tukey's test. ANOVA with repeated measurements was also used to identify any interaction between the functional parameters measured with respect to time, region, and/or ipsilateral/contralateral side differences. A Student paired t test (without Bonferroni correction in this descriptive approach) was employed to analyze the side-to-side differences and to compare the two ROIs. Mean ± SD values are given throughout the text and figures. In addition, changes in the asymmetry ratios for individual PET parameters at a given time postocclusion were assessed for their statistical significance with respect to the preocclusion 95% confidence limits.
RESULTS
Group characteristics
Six-hour reversible MCAO in healthy young anesthetized baboons produced readily demonstrable MRI changes suggestive of infarction (confirmed by subsequent neuropathology in each animal) in only 6 of 11 baboons (Table 1). Of these six baboons, one died 3 days after the occlusion due to postoperative complications and one other failed to complete the full PET protocol (due to technical difficulties) and was therefore excluded from the final PET analysis. Thus, overall, four baboons with both readily delineated changes in the MRI and complete PET protocol were available for this study (Group 1). The remaining baboons showed no evidence of infarction in four (one of which was excluded for PET device failure just after MCAO) and questionable MRI changes in one; this set of four “control” baboons will be referred to as Group 2 (Table 1).
Inclusion criteria for the study
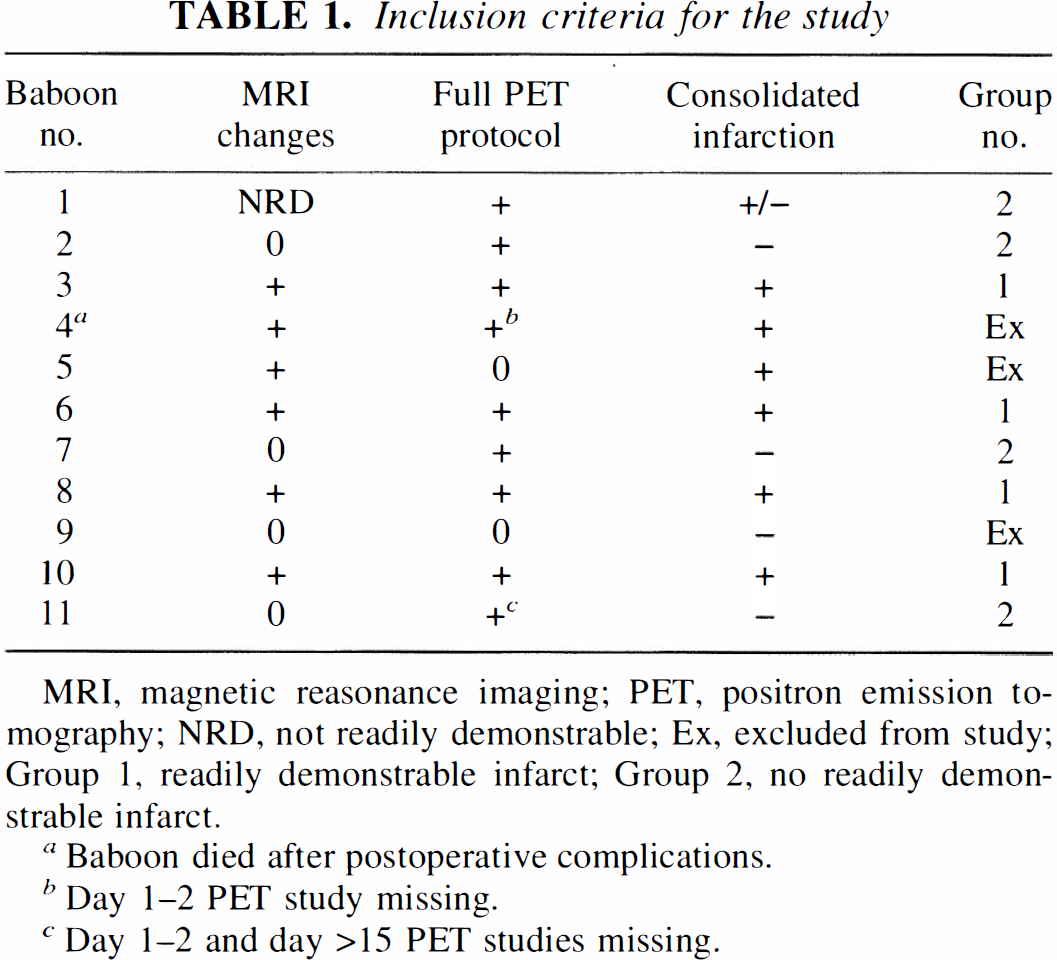
MRI, magnetic reasonance imaging; PET, positron emission to mography; NRD, not readily demonstrable; Ex, excluded from study; Group 1, readily demon strable infarct; Group 2, no readily demonstrable infarct.
Baboon died after postoperative complications.
Day 1–2 PET study missing.
Day 1–2 and day >15 PET studies missing.
Neurological deficit and pathology
All baboons recovered consciousness within 20 min after etomidate anesthesia was discontinued. There was only slight contralateral hemiparesis in the upper limb and visual field defects in the remaining eye. Turning of head, shoulders, and eye to the right (“neglect”) was commonly observed. All baboons showed prompt neurological improvement readily discernible within a 24- to 48-h recovery period. During the days after MCAO, the baboons were alert and exhibited normal feeding and grooming behavior.
To allow confirmation of adequate infarct imaging by MRI procedures, we used light microscopy on brain sections stained with hematoxylin and eosin. Of the 11 baboons, 4 showed no evidence of gross macroscopic damage and readily demonstrable changes on MRI (Table 1). The remaining seven animals all showed a consolidated infarct including the animal that died due to postoperative complications. The six animals with chronic infarction had only small consolidated infarcts (mean ± SD volume = 0.58 + 0.31 cm) located in the head of the caudate nucleus, internal capsule, and putamen (see Fig. 3). The baboon with the smallest infarct (0.2 cm) is the one with questionable MRI findings. In no instance was there evidence of a consolidated infarct in cortical regions (i.e., the region associated with the highest changes in OEF noted in the PET studies). Figure 3 illustrates the topography of the MRI and histological mapping of the consolidated infarct, showing good correspondence for the two methods employed.
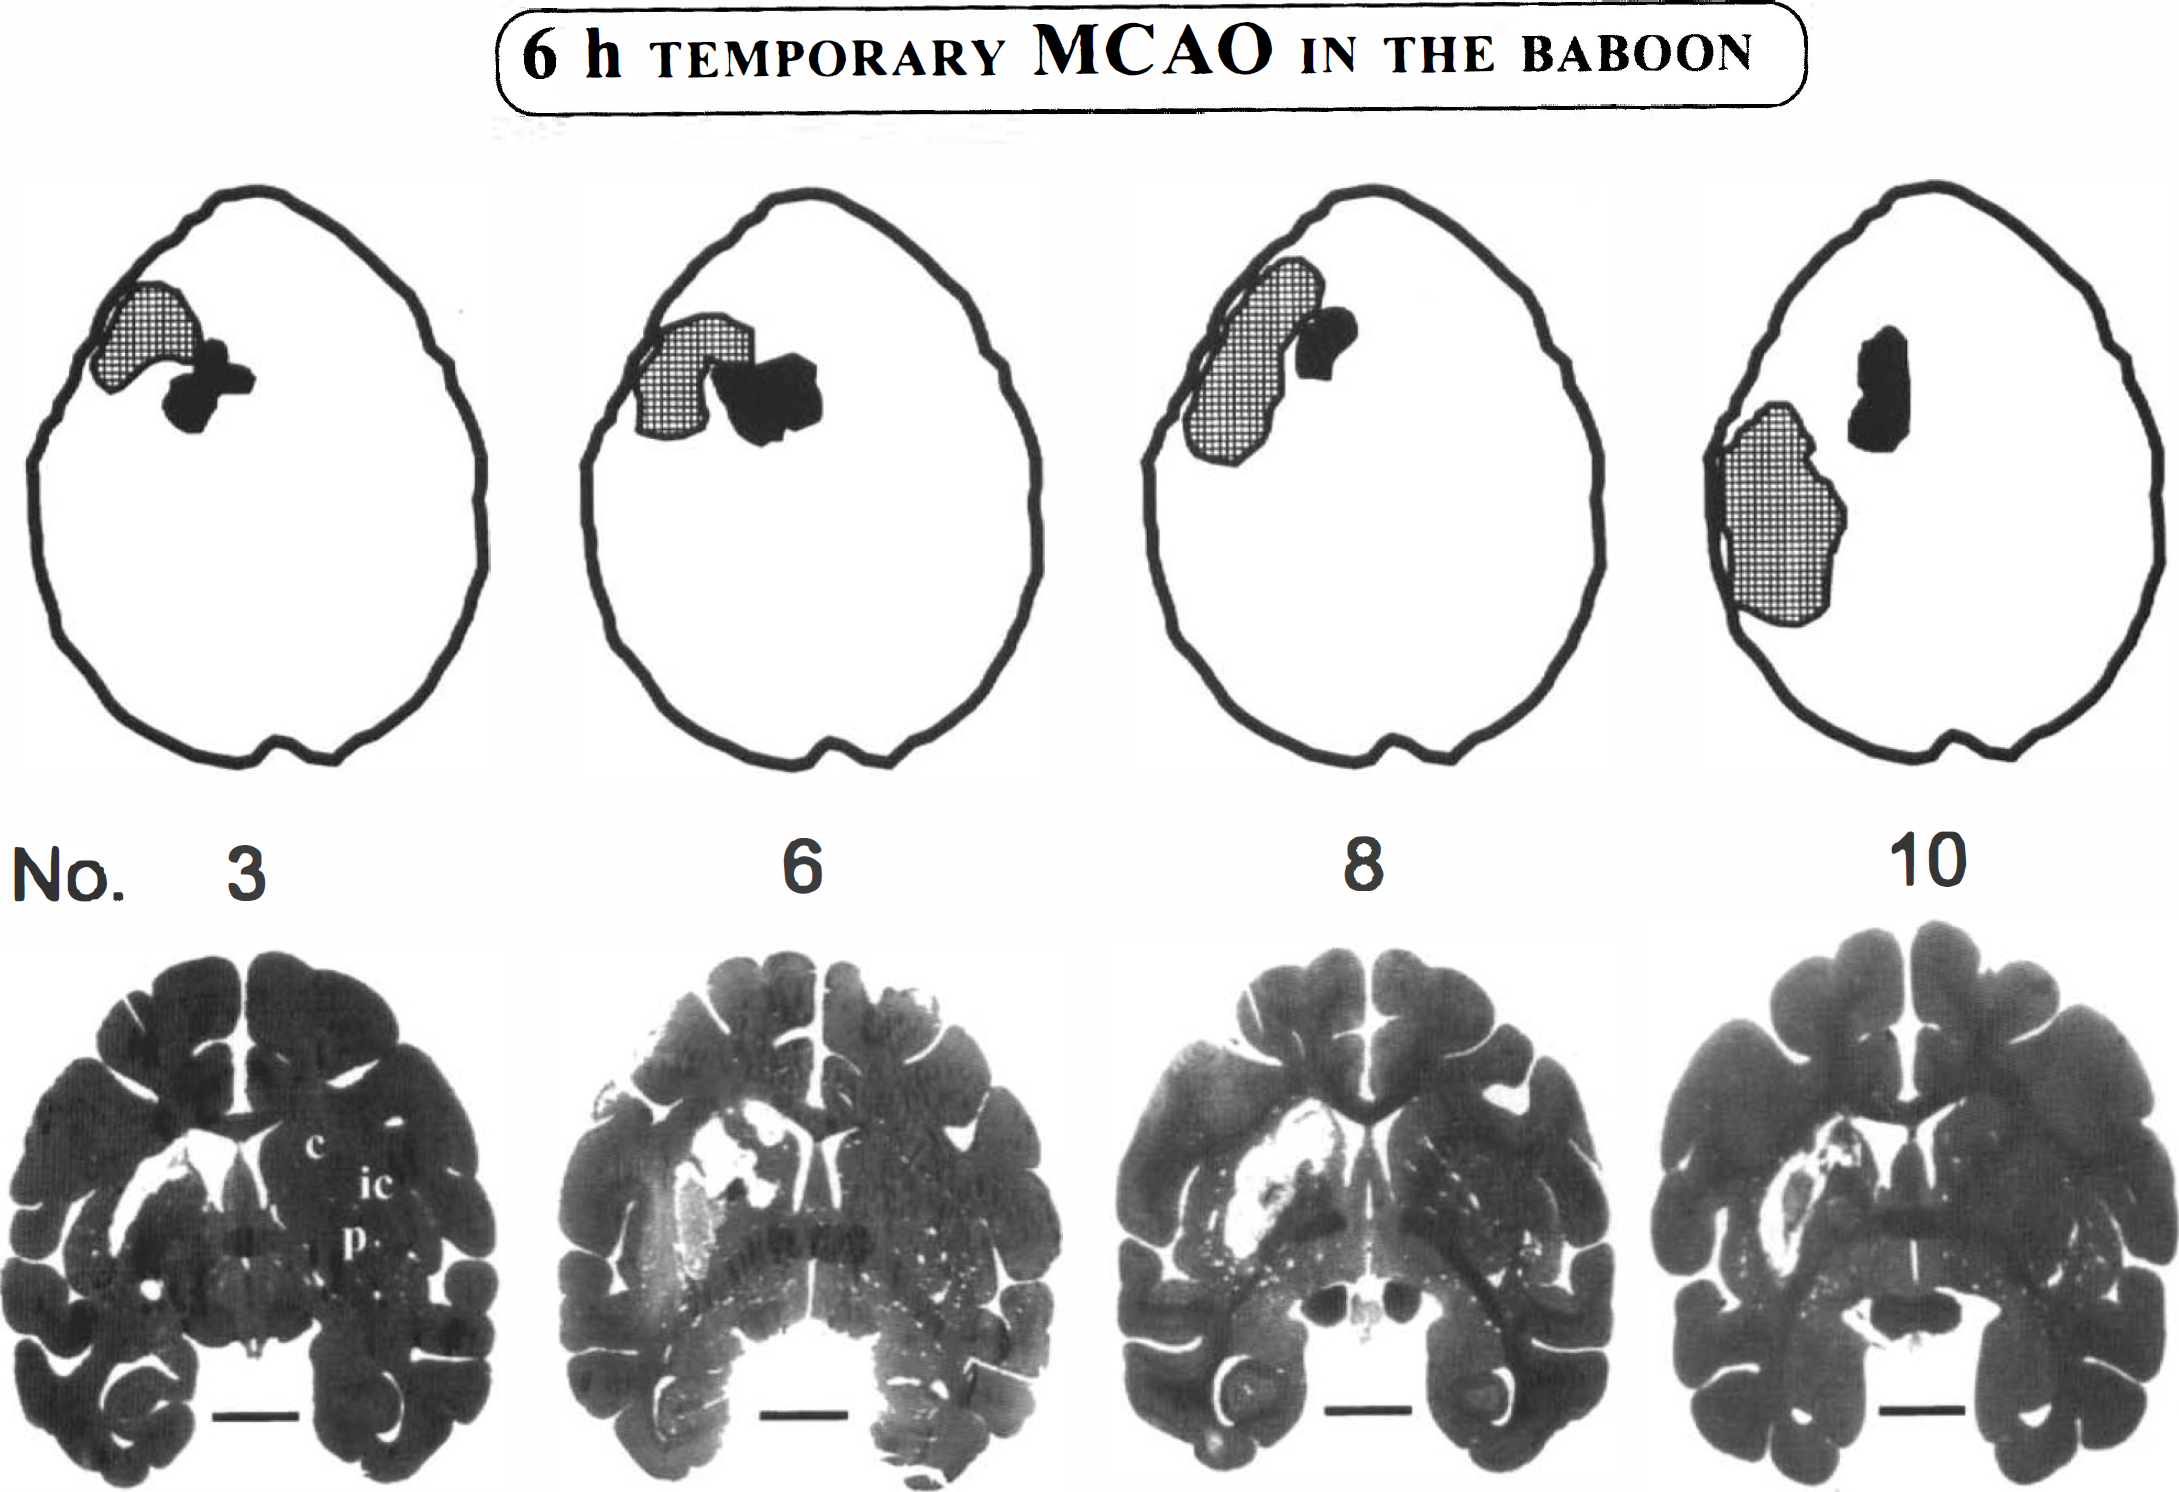
Schematic topographical distribution of the regions of interest used in the investigation for the four baboons in Group 1. The hatched area includes values corresponding to an isocontour of 88% of the maximal pixel value obtained for the oxygen extraction fraction (OEF) at postocclusion. The filled area represents the region of final infarction as determined by magnetic resonance imaging (MRI) techniques. On these axial cuts (obtained at the level of the lateral ventricles and basal ganglia; see Fig. 2 for orientation) that are representative of the positron emission tomography images and coregistered MRI scans, there was no measurable overlap of the two regions.
Physiological and biochemical data
The physiological and biochemical data for the four baboons in Group 1 are presented in Table 2. No significant differences were noted for any of these measured parameters with respect to time (ANOVA).
Physiological and biochemical parameters measured before and after 6 h of temporary middle cerebral artery occlusion (MCAO) in anesthetized baboons: Group 1
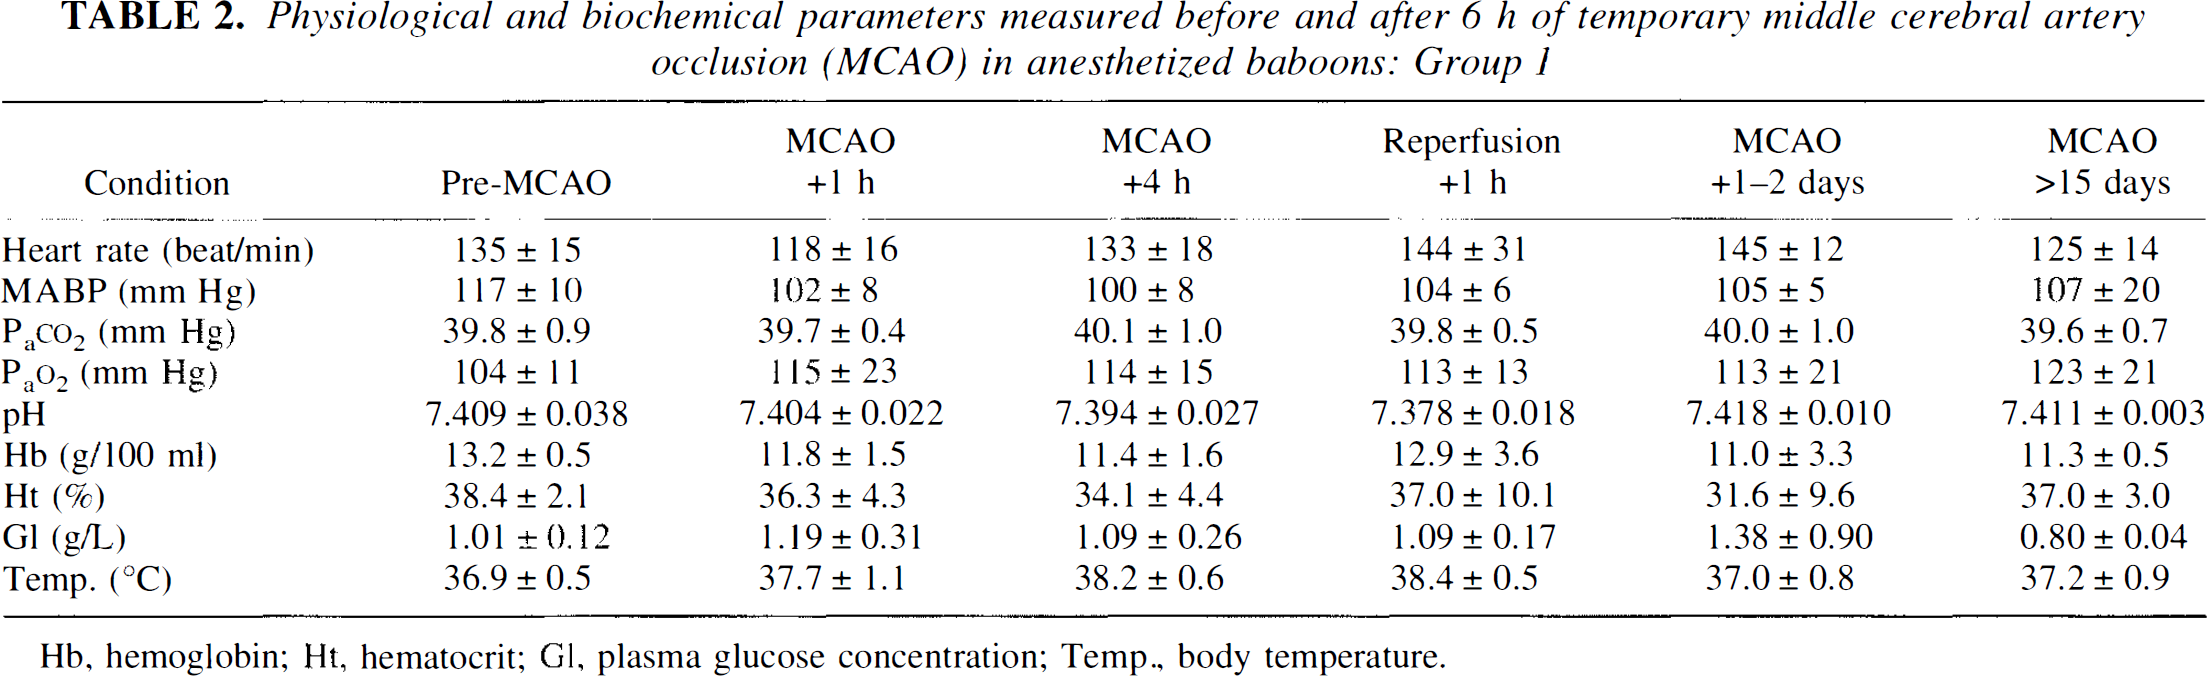
Hb, hemoglobin; Ht, hematocrit; Gl, plasma glucose concentration; Temp., body temperature.
Size and topographical distribution of ROIs
In all baboons, high OEF was prominent in the MCAO + 1 h image. In both groups, the highest-OEF ROI was essentially located on the cortical mantle. In Group 1, it was topographically distinct from the infarct ROI that was located in the deep MCA territory (see Figs. 2 and 3). At MCAO + 1 h, there was no significant difference in the area of highest OEF between Group 1 and Group 2 (3.29 ± 1.21 and 3.47 ± 1.41 cm2, respectively). The area of the infarct ROI was 1.28 ± 0.54 cm2.
Group 1
Absolute and side-to-side asymmetry indexes for ROIs. The data are shown in Tables 3–5. Figure 4 illustrates the PET functional images of CBF, CMRO2, and OEF, obtained in the anesthetized baboon before and following 6 h of reversible MCAO. For clarity, the ROIs have been omitted from the color figures. Figures 5 and 6 show the time course of the individual values (including the CBF/CBV ratio) for each baboon.
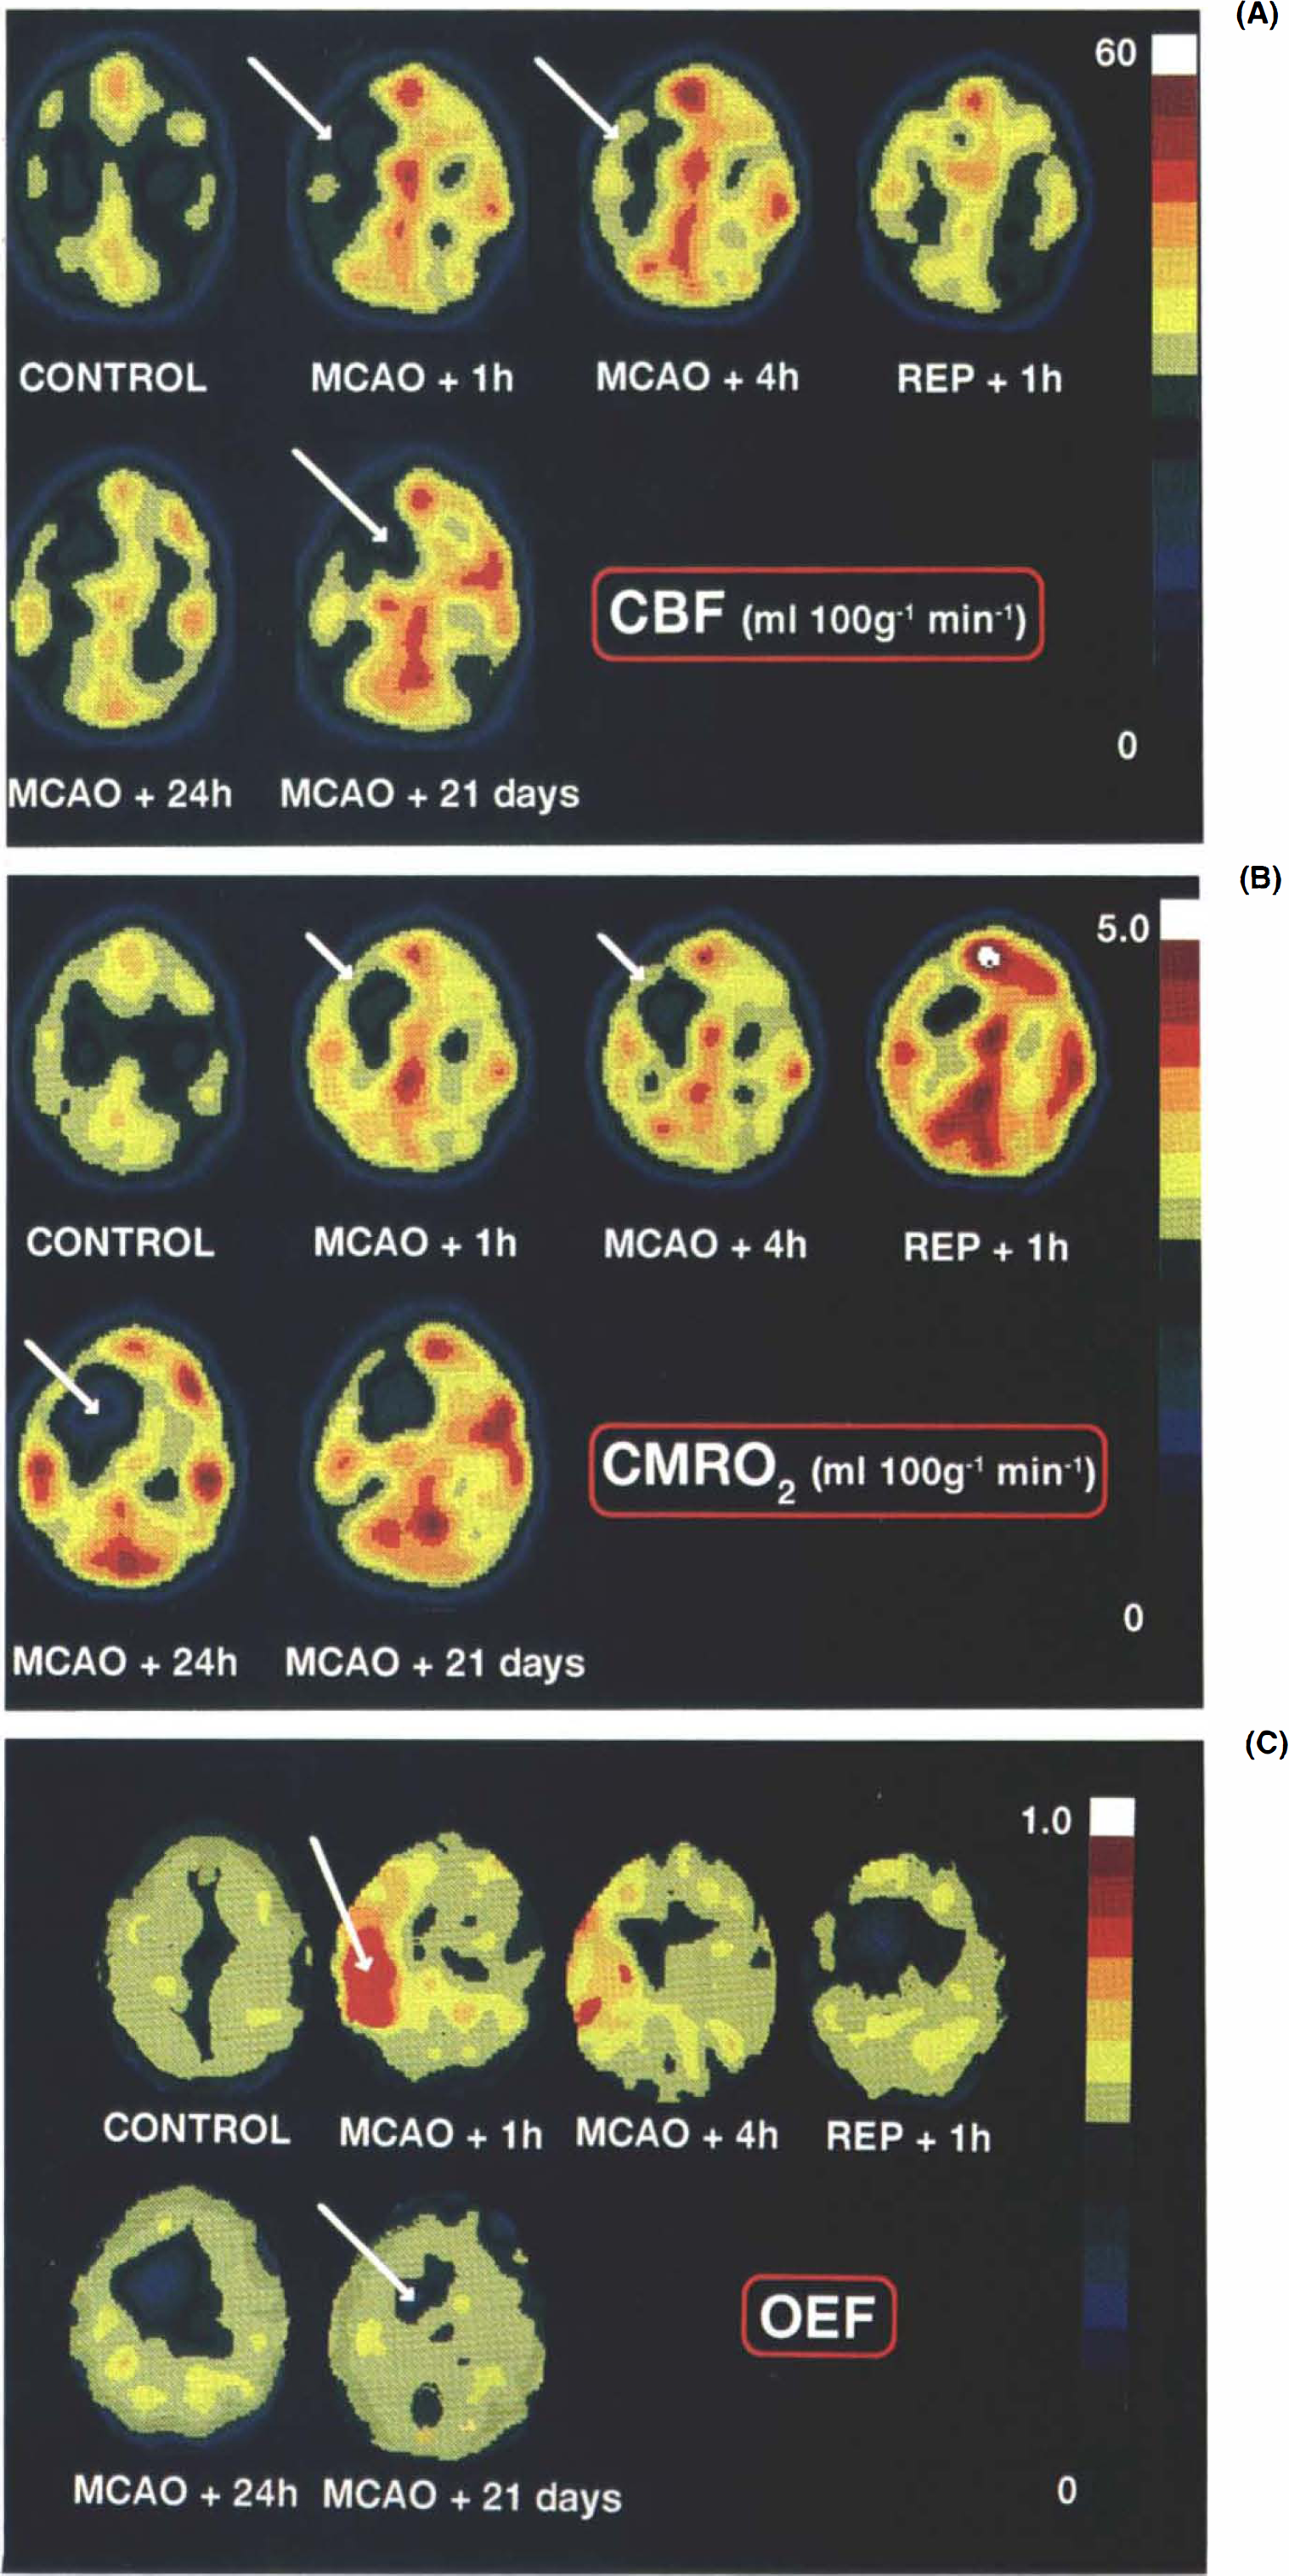
a: Evolution of changes in CBF before and after 6-h, right middle cerebral artery occlusion (MCAO) in the anesthetized baboon (no. 10), The images are presented with respect to the pseudocolor scale shown on the right for pixel values between 0 and 60 ml 100 g−1 min−1, and the axial cuts were taken parallel to and +21 mm above the canthomeatal plane. The control study was performed at least 2 weeks prior to the occlusion and other positron emission tomography measurements made during and after MCAO (see Fig. 1 for timing protocol). The arrow shows a reduction in CBF over the whole of the MCA territory in the MCAO + 1 h image with some spontaneous reperfusion (REP) occurring in the cortex even while the microvascular clips were still in place (MCAO + 4 h). For this baboon, magnetic resonance imaging procedures revealed the presence of infarction only in the right basal ganglia region while the cortex remained unaffected. This area (indicated by an arrow on the MCAO + 21 day image) exhibited low flow at all times except in the early postreperfusion phase, b: Evolution of changes in CMRO2 before and after 6-h, right MCAO in the anesthetized baboon. Pixel values range from 0 to 5.0 ml 100 g−1 min−1. At MCAO + 1 h and + 4 h, cortical values for oxygen metabolism remained unchanged (arrows), while the deep MCA territory showed a significant reduction in CMRO2 levels when compared with the contralateral side. Clip removal failed to restore this hypometabolic region to normal values. At MCAO + 24 h, the value in the ischemic core (arrow) was 1.31 ml 100 g−1 min−1. See (a) for further details, c: Evolution of changes in the oxygen extraction fraction (OEF) before and after 6-h, right MCAO in the anesthetized baboon. Pixel values range from 0 to 1.0 (dimensionless). Note the area of increased OEF (arrow) at MCAO + 1 h, a phenomenon that was evident in all baboons studied and persisted until the artery was reperfused. Head of arrow corresponds to the region that showed ultimate infarction at MCAO + 21 days. See (a) for further details.
Functional parameters measured before and after 6 h of temporary middle cerebral artery occlusion (MCAO): Group 1—ipsilateral hemisphere
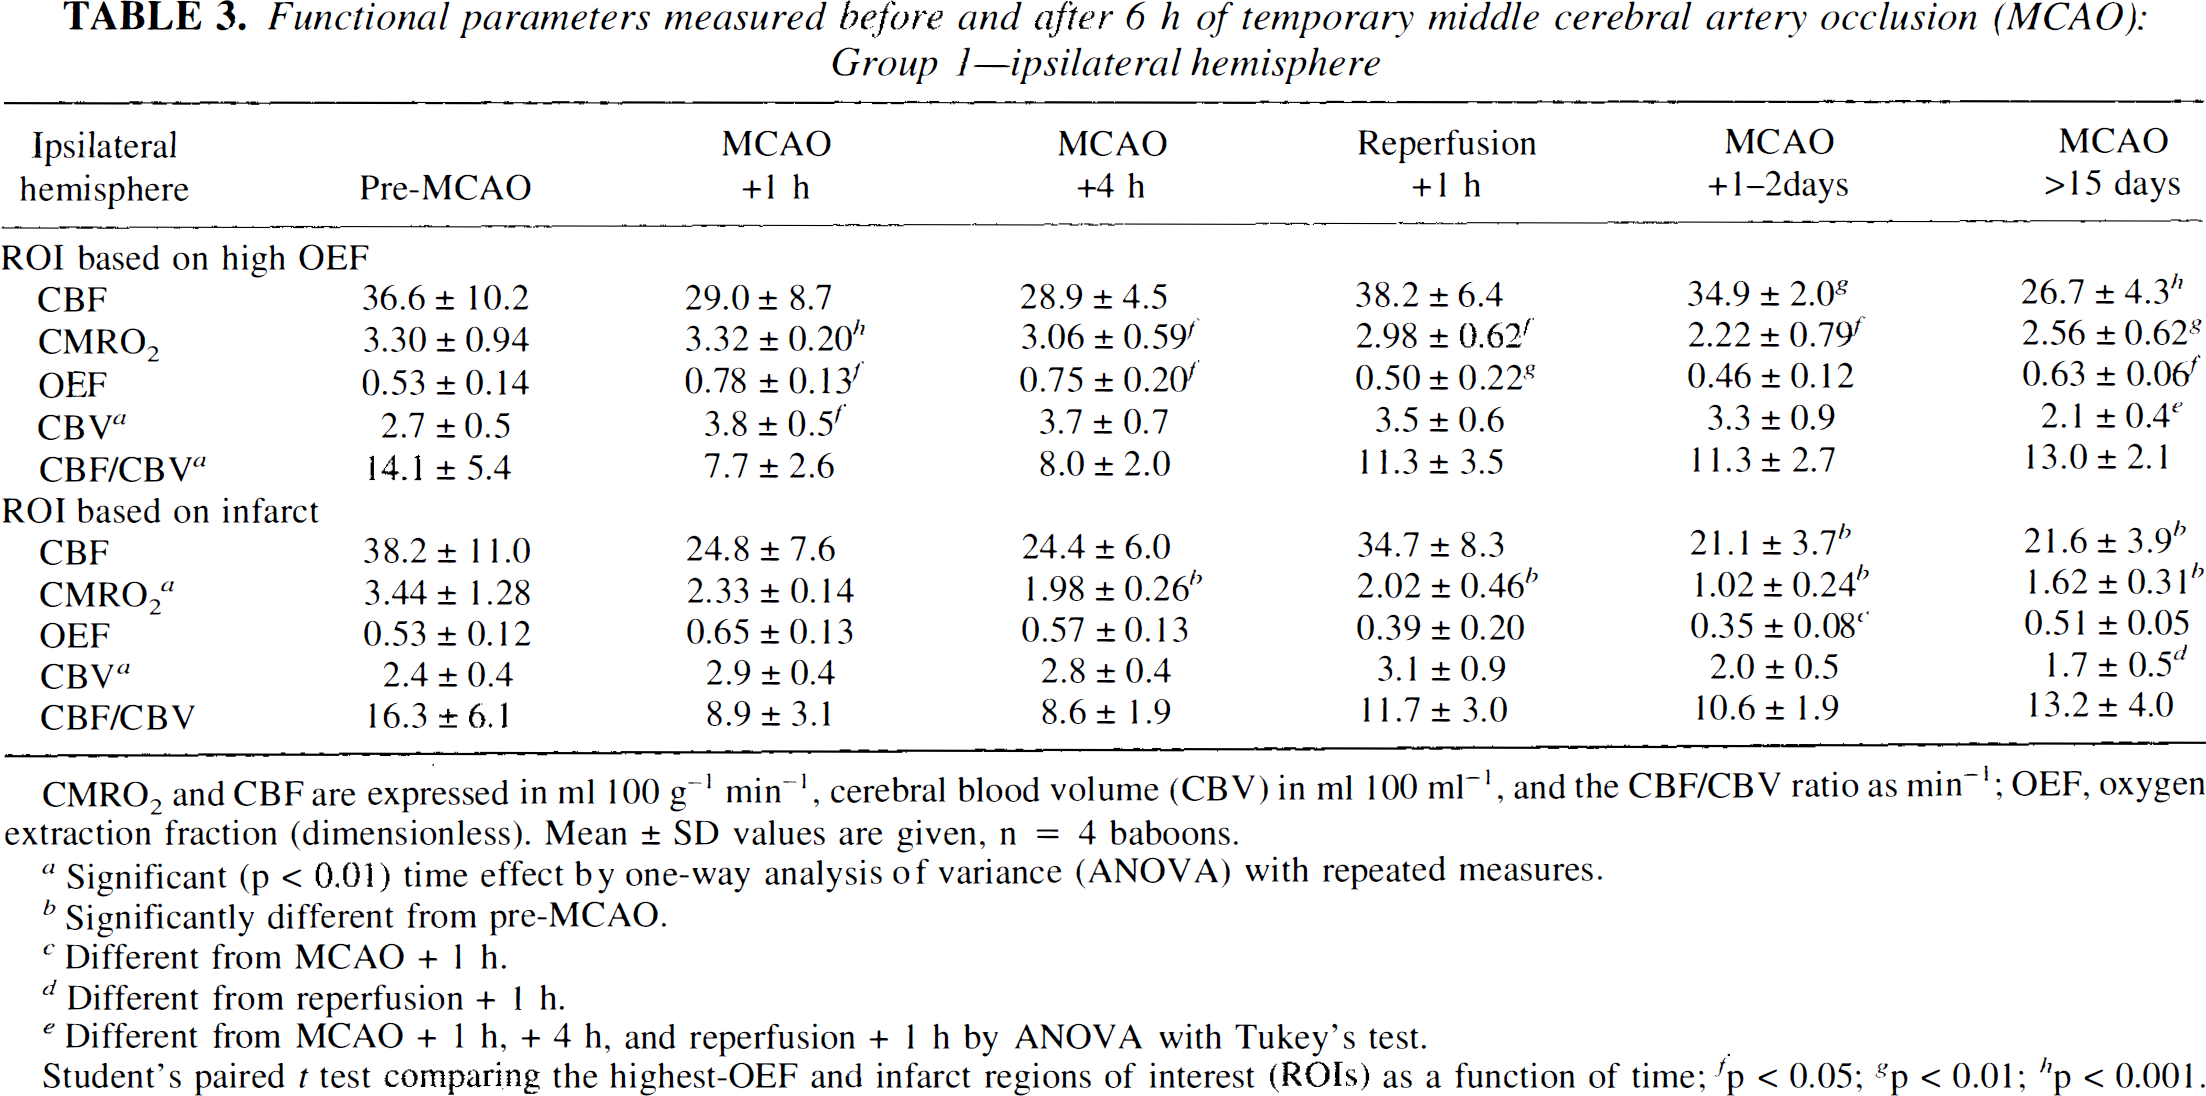
CMRO2 and CBF are expressed in ml 100 g−1 min−1, cerebral blood volume (CBV) in ml 100 ml−1, and the CBF/CBV ratio as min−1; OEF, oxygen extraction fraction (dimensionless). Mean ± SD values are given, n = 4 baboons.
Significant (p < 0.01) time effect by one-way analysis of variance (ANOVA) with repeated measures.
Significantly different from pre-MCAO.
Different from MCAO + 1 h.
Different from reperfusion + 1 h.
Different from MCAO + 1 h, + 4 h, and reperfusion + 1 h by ANOVA with Tukey's test.
Student's paired t test comparing the highest-OEF and infarct regions of interest (ROIs) as a function of time; fp < 0.05; g p < 0.01; hp < 0.001.
Functional parameters measured before and after 6 h of MCAO: Group 1—contralateral hemisphere
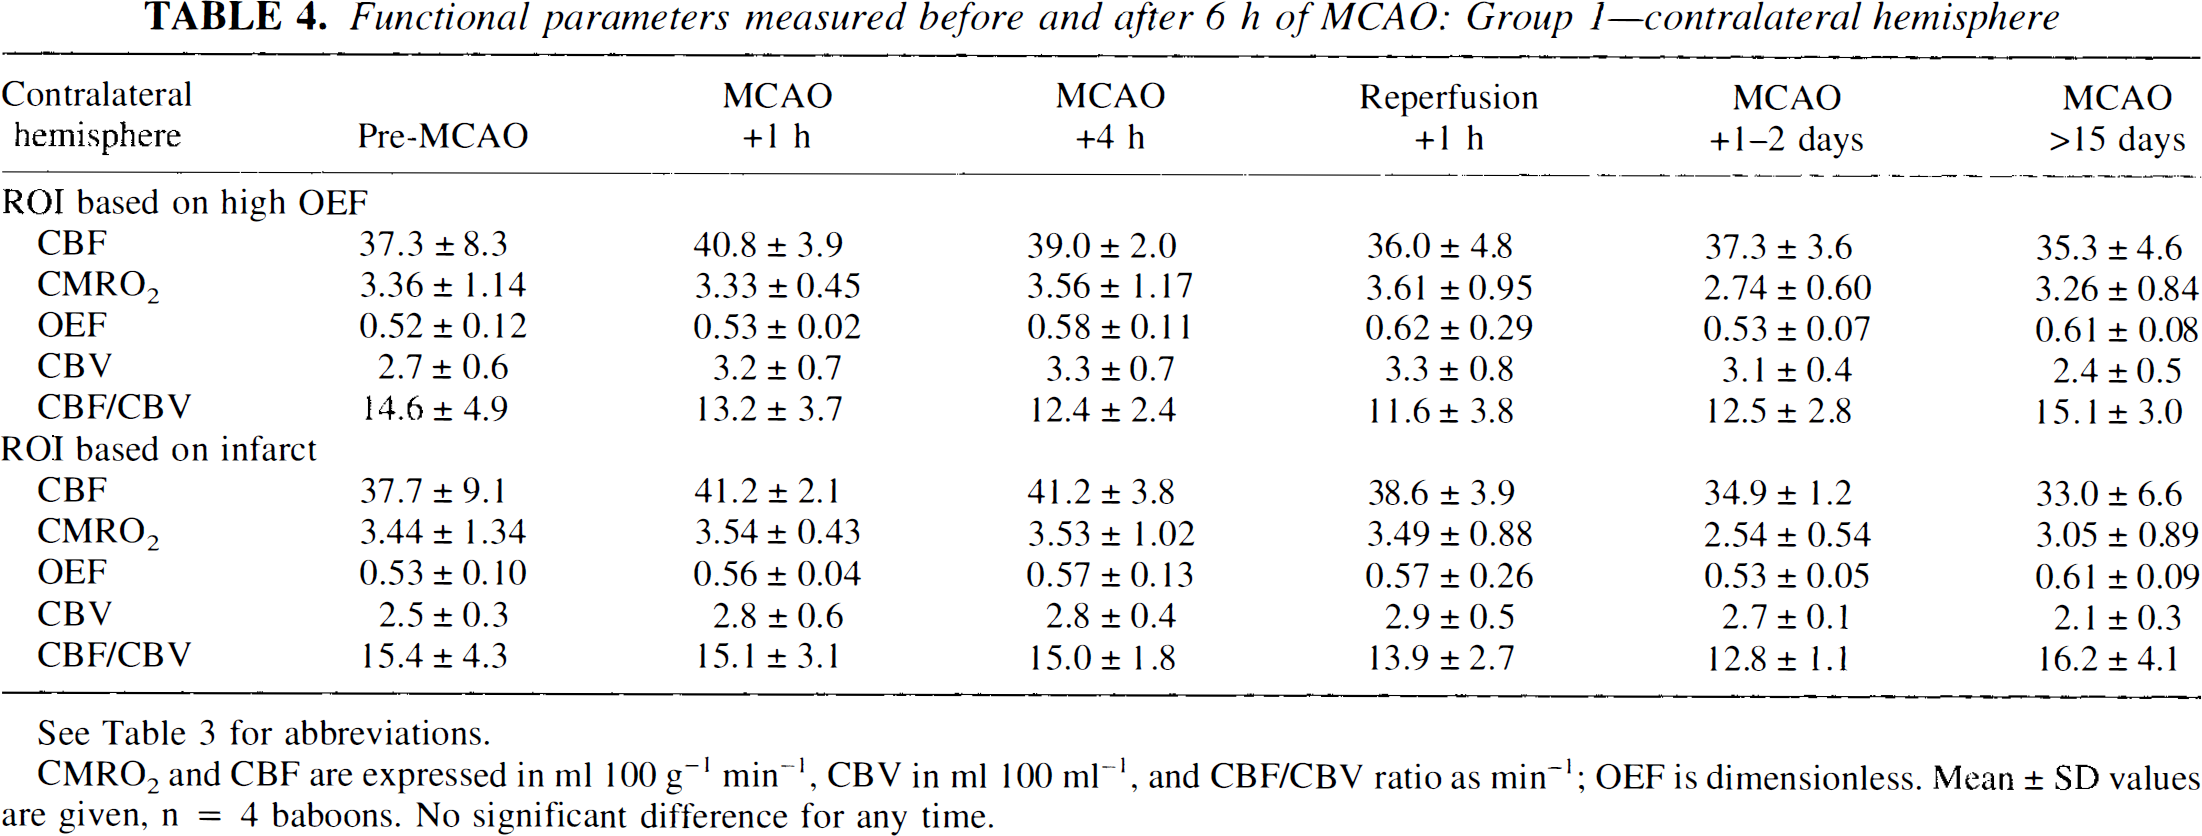
See Table 3 for abbreviations.
CMRO2 and CBF are expressed in ml 100 g−1 min−1, CBV in ml 100 ml−1, and CBF/CBV ratio as min−1; OEF is dimensionless. Mean ± SD values are given, n = 4 baboons. No significant difference for any time.
Mean asymmetry index values expressed as ipsilateral/contralateral side ratio obtained before and after 6 h of temporary MCAO in anesthetized baboons—Group 1
See Table 3 for abbreviations.
Mean ± SD values are given, n = 4 baboons.
p < 0.05, bp < 0.01, relative to control pre-MCAO values, by Student's paired t test.
< 0.05, d < 0.01, ep < 0.001 by Student's paired t test comparing the highest-OEF and infarct ROIs as a function of time.
ROI based on highest OEF. Tables 3 and 4 show the absolute values (mean ± SD) obtained in the highest-OEF ROI for the ipsilateral and contralateral hemispheres, respectively, before and after MCAO. Because of large variance due to the small sample number and interanimal variability, we decided to normalize the data obtained with respect to contralateral homologous values since no significant contralateral effects could be evidenced by repeated-measures ANOVA on time effect (except for a significant widespread reduction of CBV at the latest measurement, indicating the side-to-side ratios for CBV for that specific time should be interpreted with caution). As such, the data will be discussed in terms of the asymmetry index values (i.e., the ipsilateral/contralateral side ratios; see Table 5 and Fig. 5). By this approach we were able to evidence more clearly the effects due to MCA occlusion, which were assessed statistically by comparing the values at each time post-MCAO with control values (paired t tests).
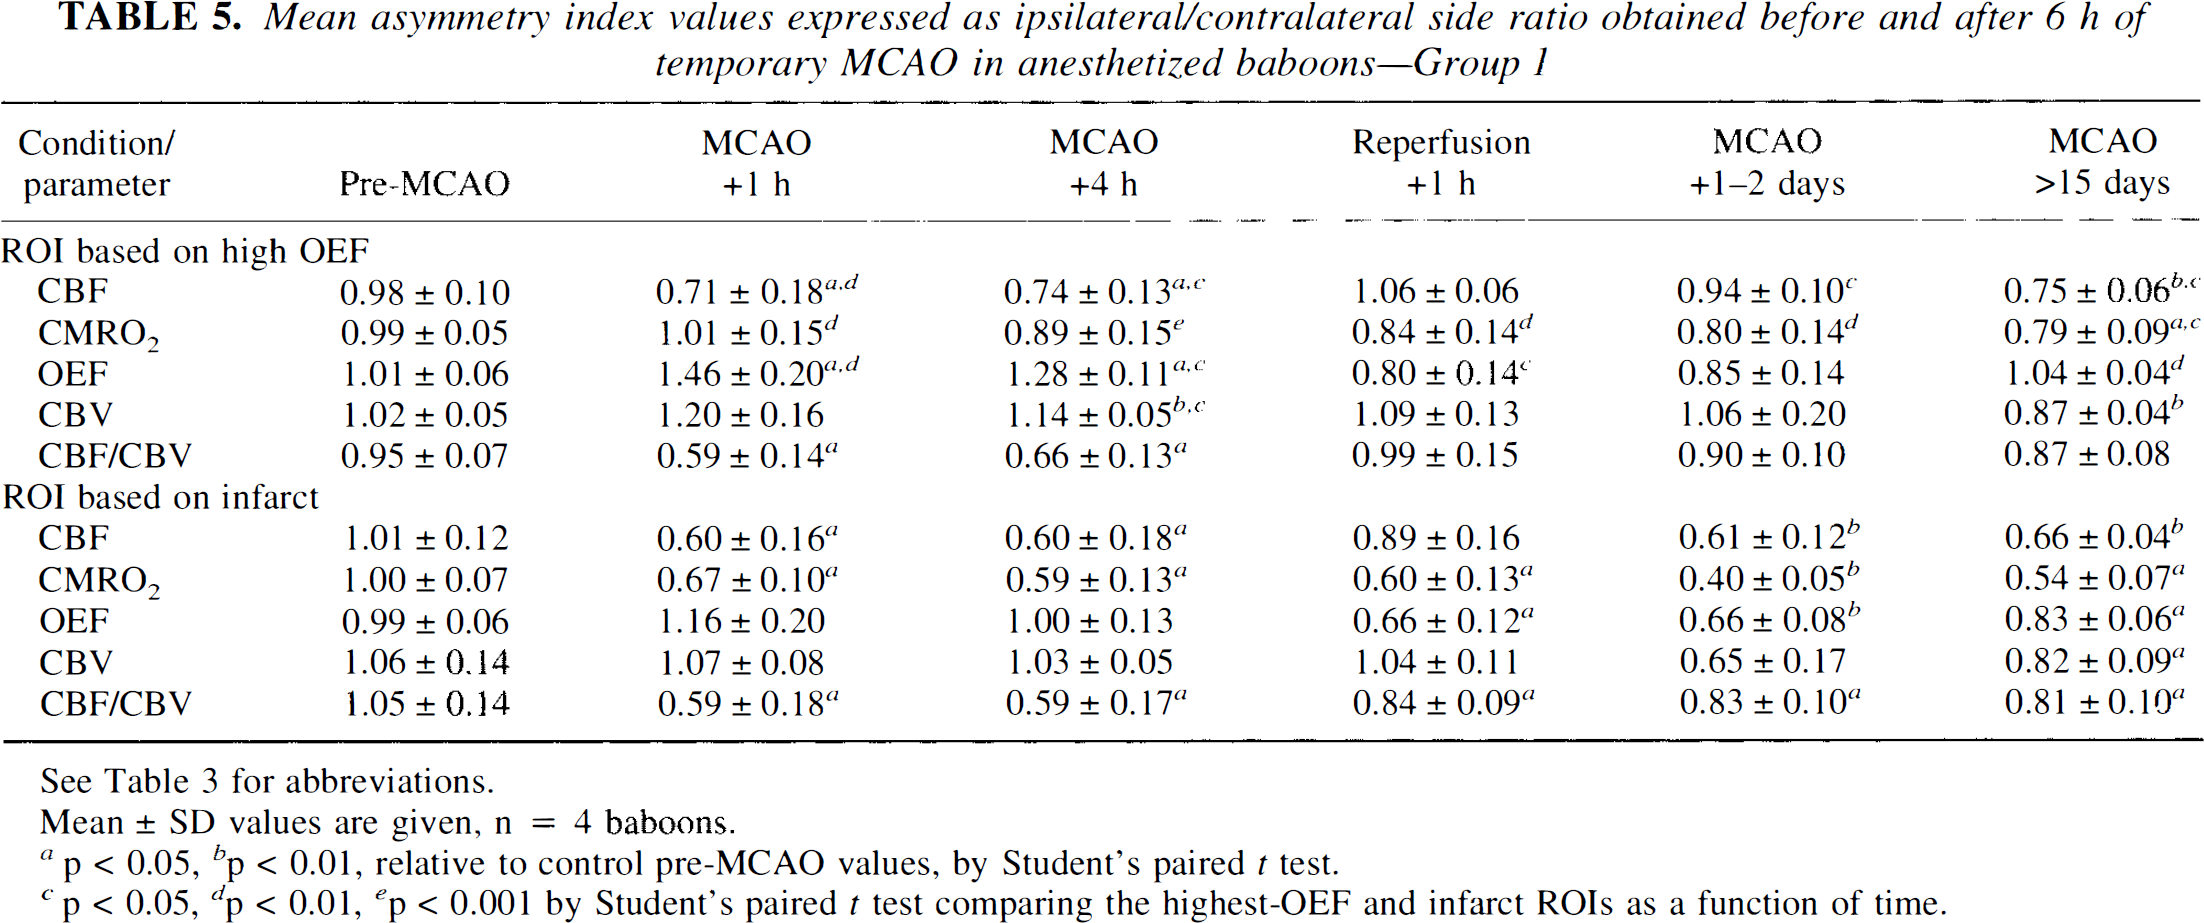
Asymmetry ratios for the highest-oxygen extraction fraction (OEF) region of interest (ROI) [cortical middle cerebral artery (MCA) territory] expressed as the ipsilateral/contralateral mirror image before and after 6 h of temporary MCA occlusion (MCAO) in the anesthetized baboon (Group 1). Data are shown for individual baboons that had a magnetic resonance imaging-identifiable necrotic lesion. The highest-OEF region was obtained by a computer-generated isocontour (88% of the maximal pixel value) in the 1-h post-MCAO positron emission tomography image and subsequently transferred to the other measured parameters and for each time interval,
rOEF indexes were maximal at MCAO + 1 h. This elevated rOEF was still present at MCAO + 4 h (though to a lesser extent) and then tended to remain at control levels or slightly below following reperfusion until the latest PET study (see Fig. 5c).
rCBF indexes were significantly reduced at MCAO + 1 h and + 4 h. Following removal of the clips, rCBF values returned to, or were slightly above, normal and remained stable over the next 24–48 h (Fig. 5a). The final PET study, however, revealed a moderate but significant reduction in rCBF.
No significant change in rCMRO2 indexes was noted either during the acute stage or at any time thereafter except for a small but significant decrease at the last PET study. One notes, however, that this trend, though not significant, was already present at 24–48 h (Fig. 5b).
rCBV indexes were elevated during the period of occlusion (though significantly so for MCAO + 4 h only); at the terminal study, they were mildly but significantly lower than pre-MCAO values. The index for the CBF/CBV ratio fell markedly during the period of occlusion, but returned to near normal after MCA reopening (Fig. 5d).
ROI based on MRI infarct. Tables 3 and 4 show the absolute values obtained by PET in the ipsilateral and contralateral hemispheres, respectively. Again, we have presented the data in terms of the ipsilateral/contralateral ratios since no global effects were noted in the contralateral hemisphere (see Table 5 and Fig. 6), except for the final measurements of rCBV.
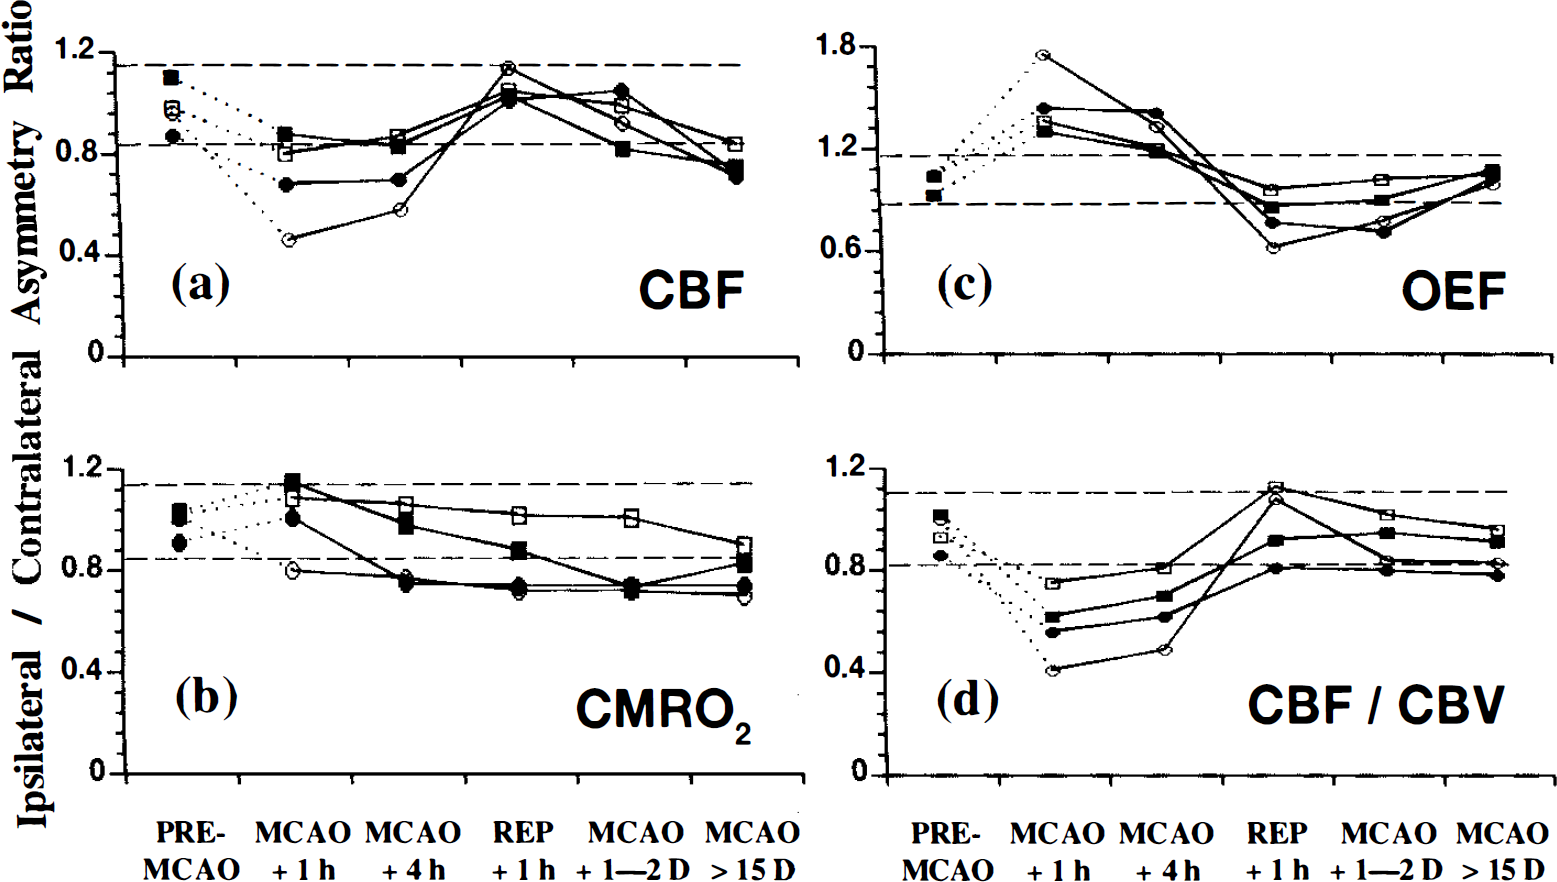
Asymmetry index ratios for the infarct region of interest (ROI) [deep middle cerebral artery (MCA) territory] expressed as the ipsilateral/contralateral mirror side image before and after 6 h of temporary MCA occlusion (MCAO) in the anesthetized baboon (Group 1). The infarct ROI was defined by an irregular contour based upon the hyperintense magnetic resonance imaging ̅T 2 signal (see legend to Fig. 5 for further details and see also Fig. 3 for the topographical location of the infarcts).
In the infarct ROI, the ratio for the rOEF showed a trend for an increase at MCAO + 1 h, and in one baboon only, the OEF value lay outside the 95% confidence limits for the pre-MCAO measurements (Fig. 6c). At MCAO + 4 h, the OEF had returned to essentially normal values. During the reperfusion phase, the rOEF value declined significantly and remained at low levels until the end of the study.
During occlusion, the index for rCBF remained significantly lower than pre-MCAO levels. Reperfusion restored temporarily these values toward normality, but the subsequent two PET studies again showed a marked and significant fall in the rCBF index values (see Table 5 and Fig. 6a).
When compared with the pre-MCAO index values, rCMRO2 declined significantly as early as 1 h postocclusion, and a significant and sustained reduction in oxygen metabolism, unaffected by reperfusion, was noted up until the final PET measurement (Fig. 6b). Of note is the deterioration in the CMRO2 ratio from reperfusion + 1 h to MCAO + 1–2 days.
CBV indexes remained stable throughout most of the investigation, although a significant reduction was noted at the last PET measurement. The CBF/CBV ratios were markedly reduced during occlusion and showed a partial return toward normal values after reperfusion (see Table 5 and Fig. 6d).
Comparison of highest-OEF and infarct ROIs on ipsilateral hemisphere. We compared the absolute values for PET variables between the two ROIs (Table 3). There was a significant difference in rCBF only for the time periods MCAO + 1–2 days and MCAO >15 days, where rCBF was maintained in the highest-OEF ROI relative to the infarct ROI. In contrast, the rCMRO2 showed significant differences at all times after occlusion, where rCMRO2 was maintained in the highest-OEF ROI but was consistently reduced in the ROI that evolved toward infarction. In terms of the rOEF values, significant differences between the two regions existed at MCAO + 1 h and MCAO + 4 h where the rOEF was more elevated in the highest-OEF ROI than in the infarct ROI. After reperfusion, the OEF returned to normal in the highest-OEF ROI, while in the infarct ROI, it deteriorated considerably in the acute stage and then returned to normal, although still at significantly lower values than in the highest-OEF ROI. At MCAO + 1 h, rCBV was significantly greater in the highest-OEF region when compared with the infarct ROI. The values for the CBF/CBV ratio changed in parallel in the two regions at all time intervals studied.
Comparison of the index values between the two ROIs is shown in Table 5. As compared with the infarct ROI, the highest-OEF ROI was characterized by significantly higher OEF, CBF, and CMRO2 indexes at 1 h, 4 h, and 1–2 days after MCAO and higher CBF and CMRO2 indexes in the chronic stage.
Group 2
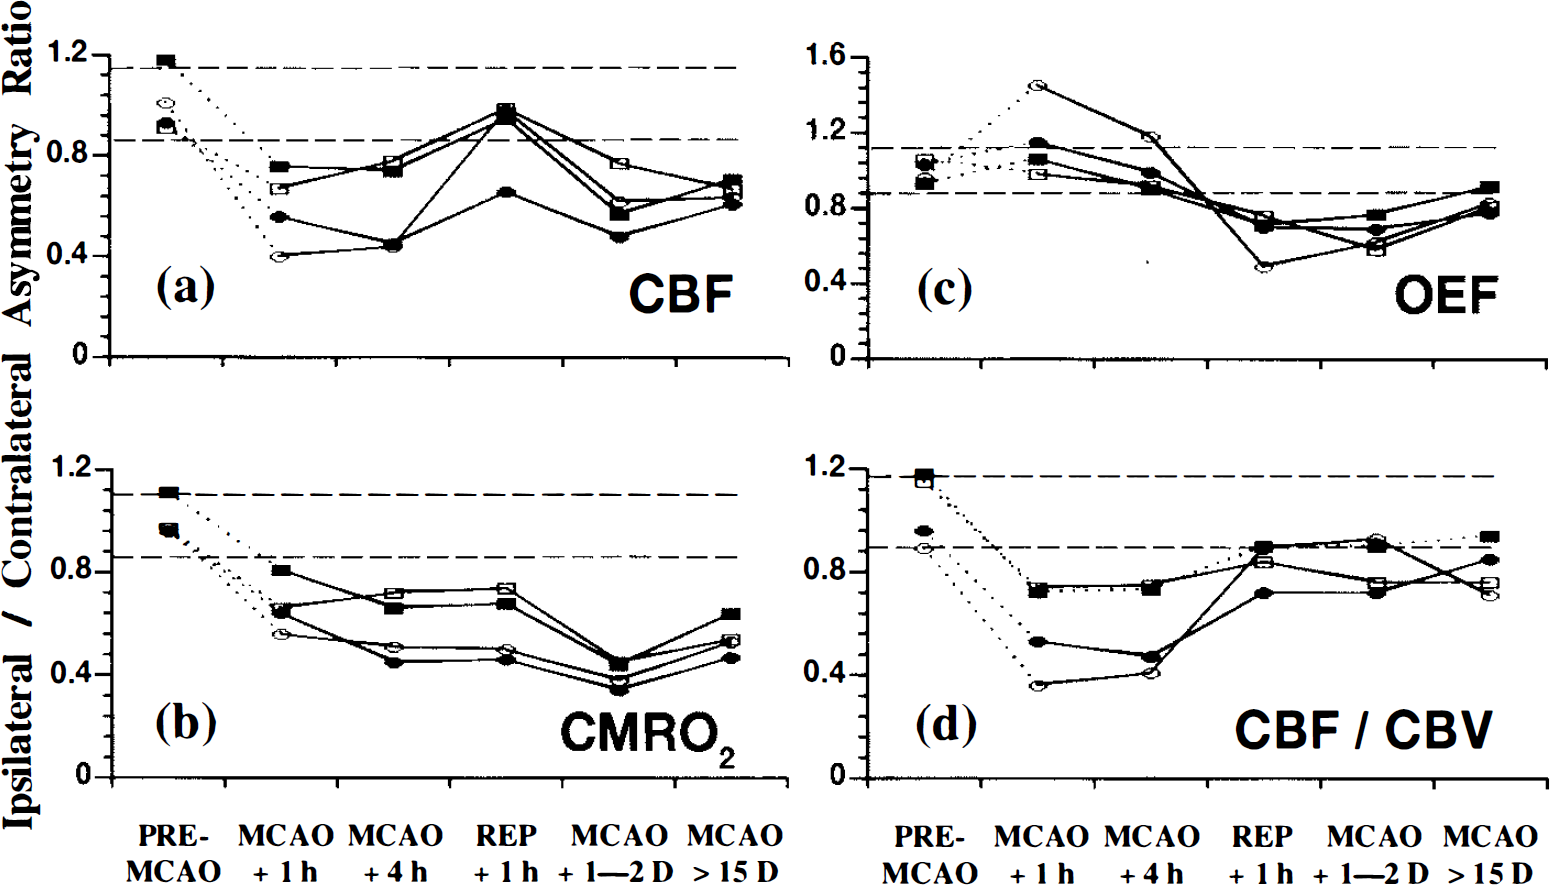
There was no significant difference between the physiological and biochemical parameters of the two groups (data not shown). The profile of changes in the parameters measured at MCAO + 1 h in the highest-OEF ROI (the only ROI available for analysis) was similar to that of Group 1. The individual data are illustrated in Fig. 7. Across the four baboons, the OEF index was significantly increased (p < 0.01) and CBF values significantly reduced (p < 0.05), while the CMRO2 was not significantly lower than the pre-MCAO levels. The time course of changes in these parameters was also comparable in both groups (see Fig. 6), with the notable exception that there were no significant changes in the value of CMRO2 at any time point studied, including the chronic stage, in this “control” group (see Fig. 7).
Asymmetry ratios for the highest-oxygen extraction fraction (OEF) region of interest [cortical middle cerebral artery (MCA) territory] shown for individual baboons that had no readily demonstrable changes in the magnetic resonance imaging procedure (Group 2). (see Fig. 5 for further details) (●), baboon no. 1; (▪), baboon no. 2; (ˆ), baboon no. 7; (▪), baboon no. 11. Note that the CMRO2 values remain essentially stable throughout the entire study (cf. Fig. 5b).
DISCUSSION
The main message from this study is that the area with maximally increased OEF observed 1 h after MCAO is both topographically and physiologically distinct from that region that will undergo consolidated infarction, if reperfusion is allowed 5 h later. Thus, the highest-OEF area is not inevitably bound to, but may only be “at risk” for, consolidated infarction—the most important determinant of clinical outcome after MCA territory stroke (Brott et al., 1989).
Topographically, the infarcted area corresponded to the deep MCA territory (i.e., the striatocapsular area), whose increased vulnerability is well known (Crowell et al., 1981; Plets, 1981; Marinkovic et al., 1985; Meier-Ruge et al., 1992) and the highest-OEF area to the MCA cortical territory (see Fig. 3). This observation was based on comparison of coregistered PET and chronic MRI, and we confirm here, histologically, the validity of assessing consolidated infarction (if of sufficient size) with chronic-stage MRI.
We documented the effects of MCAO based on side-to-side ratios because no significant contralateral alterations in any of the measured parameters were noted at any time (except for a late change in CBV). The absence of contralateral cerebral metabolic depression is in agreement with the reports of Tenjin et al. (1992) and Pappata et al. (1993) with respect to early-stage MCA territory infarction, while a lack of delayed metabolic changes [as proposed by Andrews (1991)] might be explained by the relatively small infarcts obtained in the present study.
Although the early rOEF was maximal in the cortical mantle and significantly higher there than in the deep MCA territory (see Tables 3 and 5), it nevertheless exhibited an overall trend (significant in one baboon) for a transient increase in the latter region 1 h after MCAO. Possibly, in the infarct-to-be area, there was, very early in the course of postocclusion events, a severe and progressive metabolic deterioration, driving the rOEF back toward normal values. This interpretation would concur with the baboon studies of Pappata et al. (1993), though tissue outcome was not evaluated in that study.
Our finding that the highest-OEF area escaped infarction (provided reperfusion took place) is in apparent conflict with the Wise et al. (1983) study in which it was concluded that an initially high rOEF always predicted poor tissue outcome (as assessed by low rOEF and low rCMRO2 in the subacute stage). However, in none of their patients did these investigators document the existence of reperfusion. Other clinical and experimental investigations are more consistent with our present findings. Baron et al. (1987) and Powers et al. (1985) each reported anecdotally on one patient in whom areas with extremely high rOEF escaped infarction at follow-up. In cats subjected to permanent MCAO, Heiss et al. (1994) also mentioned one atypical animal in which the area with initially increased OEF did not deteriorate metabolically at follow-up.
We found that despite efficient reperfusion in both the highest-OEF and the ultimately infarcted areas, their outcome was radically different. This suggests that, regarding the latter, either reperfusion did not prevent further deterioration in an already irreversibly damaged tissue, or it actually induced additional tissue injury that led to irreversible lesions. However, because this latter scenario was not observed in the highest-OEF area, reperfusion injury would not appear to be universal (if it exists at all), and quite to the contrary, reperfusion may well have salvaged the area of highest-OEF tissue (Young et al., 1995). The fall in the rOEF after reperfusion does not appear to be predictive of tissue outcome since it was observed in both types of tissues, but rather reflects the changing balance between prevailing CBF and CMRO2.
After the first postreperfusion study, the rCBF in the eventually infarcted area exhibited a secondary reduction, together with a further decline in rCMRO2, while both variables remained essentially stable in the highest-OEF area. This phenomenon of “delayed hypoperfusion” in partially reperfused but irreversibly injured tissue has been reported before (Michenfelder and Milde, 1990), but its interpretation has been debated. Although it could reflect some deleterious after-effects of reperfusion, the fact that the rCMRO2 was already significantly reduced before reperfusion set in would suggest, to the contrary, that following reperfusion there occurs a progressive recoupling of perfusion with the markedly lowered metabolic needs. A similar situation has been noted previously in macaque monkeys with temporary MCAO where Crowell and Olsson (1972) showed a lack of carbon black filling of the vessels in the core of the infarct despite a recanalized MCA. It is possible that in our study the use of heparin may have contributed to improved microcirculation by restricting capillary-obstructing polymorphonuclear leukocytes, thereby limiting a no-reflow phenomenon, and have thus resulted in small infarcts (del Zoppo et al., 1991; Okada et al., 1994).
In the highest-OEF region, the average CBF remained above the penumbral range and the average CMRO2 was not significantly reduced at any time during the occlusion. This profile, which confirms with the definition of “oligemia” rather than true “ischemia” (Lassen, 1990; Baron, 1991), would be compatible with the consistently good tissue outcome. This moderate reduction in perfusion in the cortical area presumably reflects an efficient collateral supply—although our “snapshot” measurement may have missed initially more pronounced hypoperfusion. In contrast, the ultimately infarcted area initially exhibited significantly lower rCBF values at all times after occlusion than the highest-OEF area and the rCMRO2 was likewise significantly reduced (Tables 3 and 5). Nevertheless, at the individual level (Fig. 5b), significant hypometabolism did develop in the highest-OEF area (MCAO + 4 h) in two of our baboons. This finding is consistent with the work of Pappata et al. (1993), who also reported progressive metabolic deterioration in two of five baboons in the highest-OEF area. Thus, because oligemic tissue is hypoxic, it may deteriorate over time and reperfusion may have saved it further deterioration and possibly even infarction.
The initial reduction in rCBF in the infarct-to-be region was on average only ˜40% relative to the preocclusion measurement with an absolute value around 25 ml 100 g−1 min−1 (Table 3; Fig. 6a). This value is higher than would be expected based on previously established thresholds for infarction (Astrup et al., 1981; Jones et al., 1981; Lassen, 1990), but it may have been overestimated due to the small infarct size relative to the spatial resolution of the PET camera.
The coupled reduction in both rCBF and rCMRO2 that affects the highest-OEF area in the chronic stage might be explained by two different, though possibly associated, phenomena: “incomplete infarction,” unnoticed on chronic-stage MRI scans (Weiller et al., 1993; Garcia et al., 1995; Nakagawara et al., 1995); and a diaschisis phenomenon as a result of a deep-seated infarct (Feeney and Baron, 1986; Baron, 1989; Sette et al., 1993). There is some evidence that selective, partial neuronal loss may affect penumbral areas in the cat (Mies et al., 1983; Strong et al., 1983). However, studies on human postmortem material indicate neuronal loss only exceptionally extends more than a few millimeters from the borders of the established infarct (Nedergaard et al., 1986; Torvik and Svindland, 1986; Nedergaard, 1988). Furthermore, the lack of significant CMRO2 reduction in the highest-OEF area of the baboons in Group 2 (Fig. 7) would speak strongly in favor of the “diaschisis” mechanism, as the selective neuronal loss mechanism, if any, should have affected both groups in the same manner.
In conclusion, following MCAO, the region that shows an early maximal increase in the OEF is both topographically and physiologically distinct from the region with final consolidated infarction if reperfusion is allowed at 6 h. This high OEF, although indicative of a threatened condition, is not an indicator of inescapable consolidated infarction and is thus a situation in which therapy could be envisaged. Whether or not it is at risk of infarction and thus constitutes one target for therapy remains to be seen.
Footnotes
Abbreviations used
Acknowledgment:
We thank Mr. C. Le PoèUc and Mr. P. Lochon of the Cyclotron Unit at Cyceron and Ms. N. Ravenel and Mr. V. Beaudouin of the Computer Department. A special mention to Mr. G. Huguet for his assistance with the care of the animals and to Ms. A. Brocquehaye for her technical expertise. We are also most grateful to the radiographers of the University Hospital of Caen, in particular Mr. Dominique Luet, for assistance with the MRI scanning procedures.