
Abstract
The functioning of cerebral cortex depends on adequate tissue oxygenation. MRI-based techniques allow estimation of blood oxygen levels, tissue perfusion, and oxygen consumption rate (CMRO2), but do not directly measure partial pressure of oxygen (PO2) in tissue. To address the estimation of tissue PO2, the oxygen mass transfer coefficient (KTO2) is here defined as the CMRO2 divided by the difference in spatially averaged PO2 between blood and tissue, and is estimated by analyzing Krogh-cylinder type models. Resistance to radial diffusion of oxygen from microvessels to tissue is distributed within vessels and in the extravascular tissue. The value of KTO2 is shown to depend strongly on vascular length density and also on microvessel tube hematocrits and diameters, but to be insensitive to blood flow rate and to transient changes in flow or oxygen consumption. Estimated values of KTO2 are higher than implied by previous studies, implying smaller declines in PO2 from blood to tissue. Average tissue PO2 can be estimated from MRI-based measurements as average blood PO2 minus the product of KTO2 and CMRO2. For oxygen consumption rates and vascular densities typical of mouse cortex, the predicted difference between average blood and tissue PO2 is about 10 mmHg.
Introduction
Maintenance of adequate tissue oxygenation is essential for normal function of the cerebral cortex, and inadequate oxygen supply can cause irreversible damage. Methods to measure or estimate oxygen levels are needed in order to evaluate the metabolic status of cortical tissue under various conditions, particularly when oxygen delivery is impaired. Under experimental conditions, direct measurements of tissue oxygen levels can be made1,2 using microelectrodes3–9 or phosphorescence lifetime imaging.10–13 These techniques have the advantage of yielding measurements of local PO2 (partial pressure of oxygen) on microscopic scales, but are invasive and technically demanding. Non-invasive techniques based on magnetic resonance imaging (MRI) provide data on blood oxygen levels 14 and on tissue perfusion 15 at millimeter scales. 16 On the assumption that blood oxygen levels measured using BOLD (blood oxygen level dependent) MRI mainly reflect the oxygen content of venous blood, the rate of tissue oxygen consumption (CMRO2) can be deduced as the product of the perfusion and the decrease in blood oxygen content relative to arterial blood. 17 However, tissue oxygen levels are not directly measured by these techniques.
Theoretical analyses of oxygen transport to tissue can be used to deduce tissue oxygen levels from data on blood oxygen levels and oxygen consumption rate in tissue. Such an approach was introduced by Krogh 18 a century ago. The Krogh cylinder model can be used to predict the variation of PO2 with distance from a single capillary with known PO2, assuming a fixed rate of oxygen consumption in the tissue. Numerous subsequent studies have extended this approach to take into account factors that were neglected in the original model, and to consider more complex microvascular geometries. This topic has been the subject of several reviews.19–21
With regard to oxygen delivery in the cerebral cortex, a variety of theoretical approaches have been used. Some investigators have used Krogh-cylinder-type models,22,23 while others have used models based on three-dimensional capillary network structures.24–27 Such models can be used to predict spatial distributions of PO2 in tissue on the scale of tens of µm. However, these approaches have not been widely adopted by investigators using MRI to study cerebral blood flow and metabolism, possibly because spatially resolved approaches are relatively complex to implement and yield predicted variations in PO2 on length scales that do not match the resolution of MRI-based observations.
In several models for oxygen transport to cortex, the tissue domain is treated as a single well-mixed compartment with a uniform PO2. In some of these analyses, the tissue PO2 is assumed to be nearly zero, and oxygen efflux from the capillary is assumed to be proportional to the PO2 of blood in the capillary.28–31 However, the assumption of tissue PO2 near zero is inconsistent with existing theoretical and experimental information. In other model studies,17,32 a uniform non-zero tissue PO2 is assumed. In these models, the oxygen content of the capillary is considered to be a function of position and time, and the rate of oxygen transport from blood to tissue is assumed to be proportional to the difference between capillary and tissue PO2 levels.
In the models just described, a mass transfer coefficient is introduced to describe the proportionality between the oxygen efflux from blood and the vessel-to-tissue PO2 difference. This coefficient has been defined in several studies17,31,32 as the product (PS) of the permeability (P) and surface (S) area of the vessel wall. While the use of a PS product is appropriate for solutes for which the vascular endothelium is the main barrier to transport, this is not the case for oxygen, which passes readily through cell membranes, being a non-polar, lipid-soluble molecule. In reality, radial gradients of PO2 are present within the microvessels and the surrounding tissue, and are not concentrated at the vessel wall.
The goal of the present study is to define an oxygen mass transfer coefficient (KTO2) relating the rate of oxygen efflux from blood to the difference between average microvessel PO2 and average tissue PO2, to estimate its magnitude in the cerebral cortex based on the physics of oxygen diffusion in blood and in tissue, to determine its dependence on other physical, geometrical and mass transport parameters, and to show how it can be used to estimate average tissue PO2 from average blood PO2 and CMRO2.
Methods
Definition of KTO2
For the purposes of this analysis, the oxygen mass transfer coefficient is defined as

Under steady-state conditions, the rate of oxygen efflux from blood vessels equals the rate of oxygen consumption in the tissue, and in that case

The oxygen consumption rate CMRO2 is often expressed in units of cm3O2 · (100 cm3 · min)−1 or cm3O2 · (100 g · min)−1. For consistency, the same units are here used for JO2, and KTO2 values are given in units of cm3O2 · (100 cm3 · min · mmHg)−1.
Other studies17,32 have used a definition of the mass transport coefficient based on the difference in oxygen concentrations between plasma and tissue. However, diffusive oxygen transport is driven by gradients in partial pressure, which are not necessarily equivalent to gradients in concentration (i.e. the product of oxygen solubility and partial pressure), because the solubility differs between plasma and tissue. A definition based on concentration difference therefore has limited applicability.
Blood and tissue mass transfer coefficients
In analyzing the determinants of KTO2, the effects of the intravascular and extravascular domains can be quantified by defining


Estimation of tissue mass transfer coefficient using Krogh cylinder model
The Krogh cylinder model has been used in a number of analyses of oxygen transport in the microcirculation.18,19,34 In this model, a single capillary with radius rc is assumed to supply oxygen to a concentric cylindrical region of surrounding tissue with radius rt (Figure 1(a) and Table 1). It is assumed that the tissue cylinder is surrounded by a parallel array of equivalent units, and so the diffusive flux of oxygen across the outer surface of the tissue cylinder is zero. For the present analysis, steady-state conditions are assumed and a fixed rate M0 of oxygen consumption is assumed in the tissue region, implying that CMRO2 = M0(1 – rc2/rt2) where CMRO2 is the average oxygen consumption rate expressed per unit volume including the intravascular volume. Diffusion in the axial direction is neglected, on the basis that the radius of the cylinder is much less than its length, and axial gradients and fluxes are therefore relatively small. Fick’s second law of diffusion implies that
Schematic representations of vascular configurations analyzed. (a) Krogh-type model. The central cylinder represents the capillary, with radius rc, length L, and blood flow rate Qcap, surrounded by the tissue cylinder with radius rt (light gray). Vertical arrows indicate the diffusive efflux JO2 of oxygen from the capillary into the tissue. The flux across the outer tissue boundary is assumed to be zero. (b) Vascular network derived from observations of rat cortex.25,35 Tissue domain is 150 × 160 × 140 µm. (c) Vascular network derived from observations of mouse cortex.
36
Overall dimensions of tissue domain are 609 × 609 × 662 µm; some avascular parts of the domain are excluded from the analysis. Reference parameter values.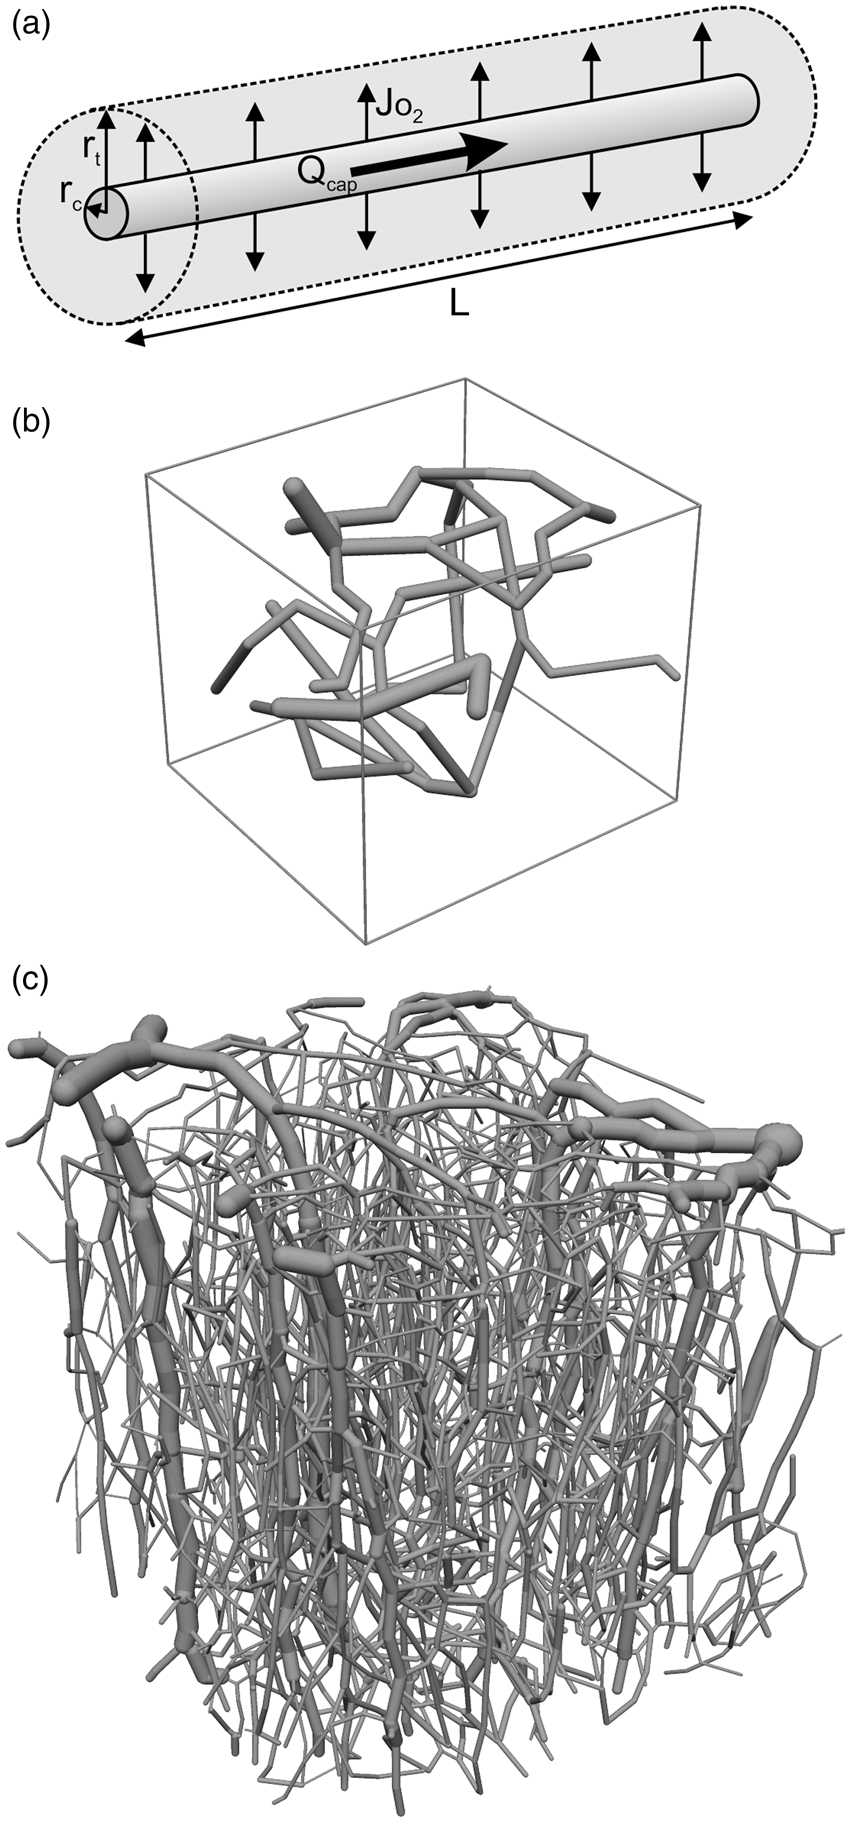


The PO2 averaged over the tissue region (


Estimation of tissue mass transfer coefficient for realistic network structures
The Krogh cylinder model represents an idealized configuration of a capillary and surrounding tissue, and does not take into account the irregular geometry of the microvasculature and the contribution of arterioles to oxygen delivery. Therefore, additional simulations were performed with a small network derived
25
from corrosion casts of rat cortex
35
and an extensive network derived from two-photon microscopy of mouse cortex
36
(Figure 1(b) and (c) and Table 1). Within the tissue domain, the PO2 satisfies

Estimation of capillary mass transfer coefficient
Hellums et al.38,39 analyzed radial oxygen gradients within capillaries and showed the importance of intravascular resistance to oxygen diffusion. More recently, Lucker et al.
23
examined the effect of hematocrit and red blood cell velocity on tissue oxygen levels in a tapered tissue region with dimensions derived from the mouse cerebral cortex, with a central capillary of internal radius 2 µm. The results of detailed numerical simulations were closely approximated by an analytical model in which the intravascular mass transfer coefficient satisfies

Simulations of nonlinear and time-dependent effects
The preceding analyses are for steady-state conditions, with uniform fixed oxygen consumption rates. Further numerical simulations were performed using a Krogh-cylinder geometry to examine other factors influencing KTO2. A single equation was used to describe mass transport in the tissue and capillary domains. In cylindrical polar coordinates (r, θ, z), where z is the distance along the vessel in the flow direction


Time-dependent effects might influence KTO2 values. For simulations of oxygen transport during transient changes in blood flow rate and oxygen consumption, CBF and CMRO2 are assumed to follow the typical time courses shown in Figure 2(c) of Buxton.
42
Predicted tissue and capillary mass transfer coefficients. (a) Tissue mass transfer coefficient derived from Krogh cylinder model, as a function of capillary density, for three values of capillary radius as indicated. Inset shows function f(δ) defined in equation (9), where δ = rc/rt. Points 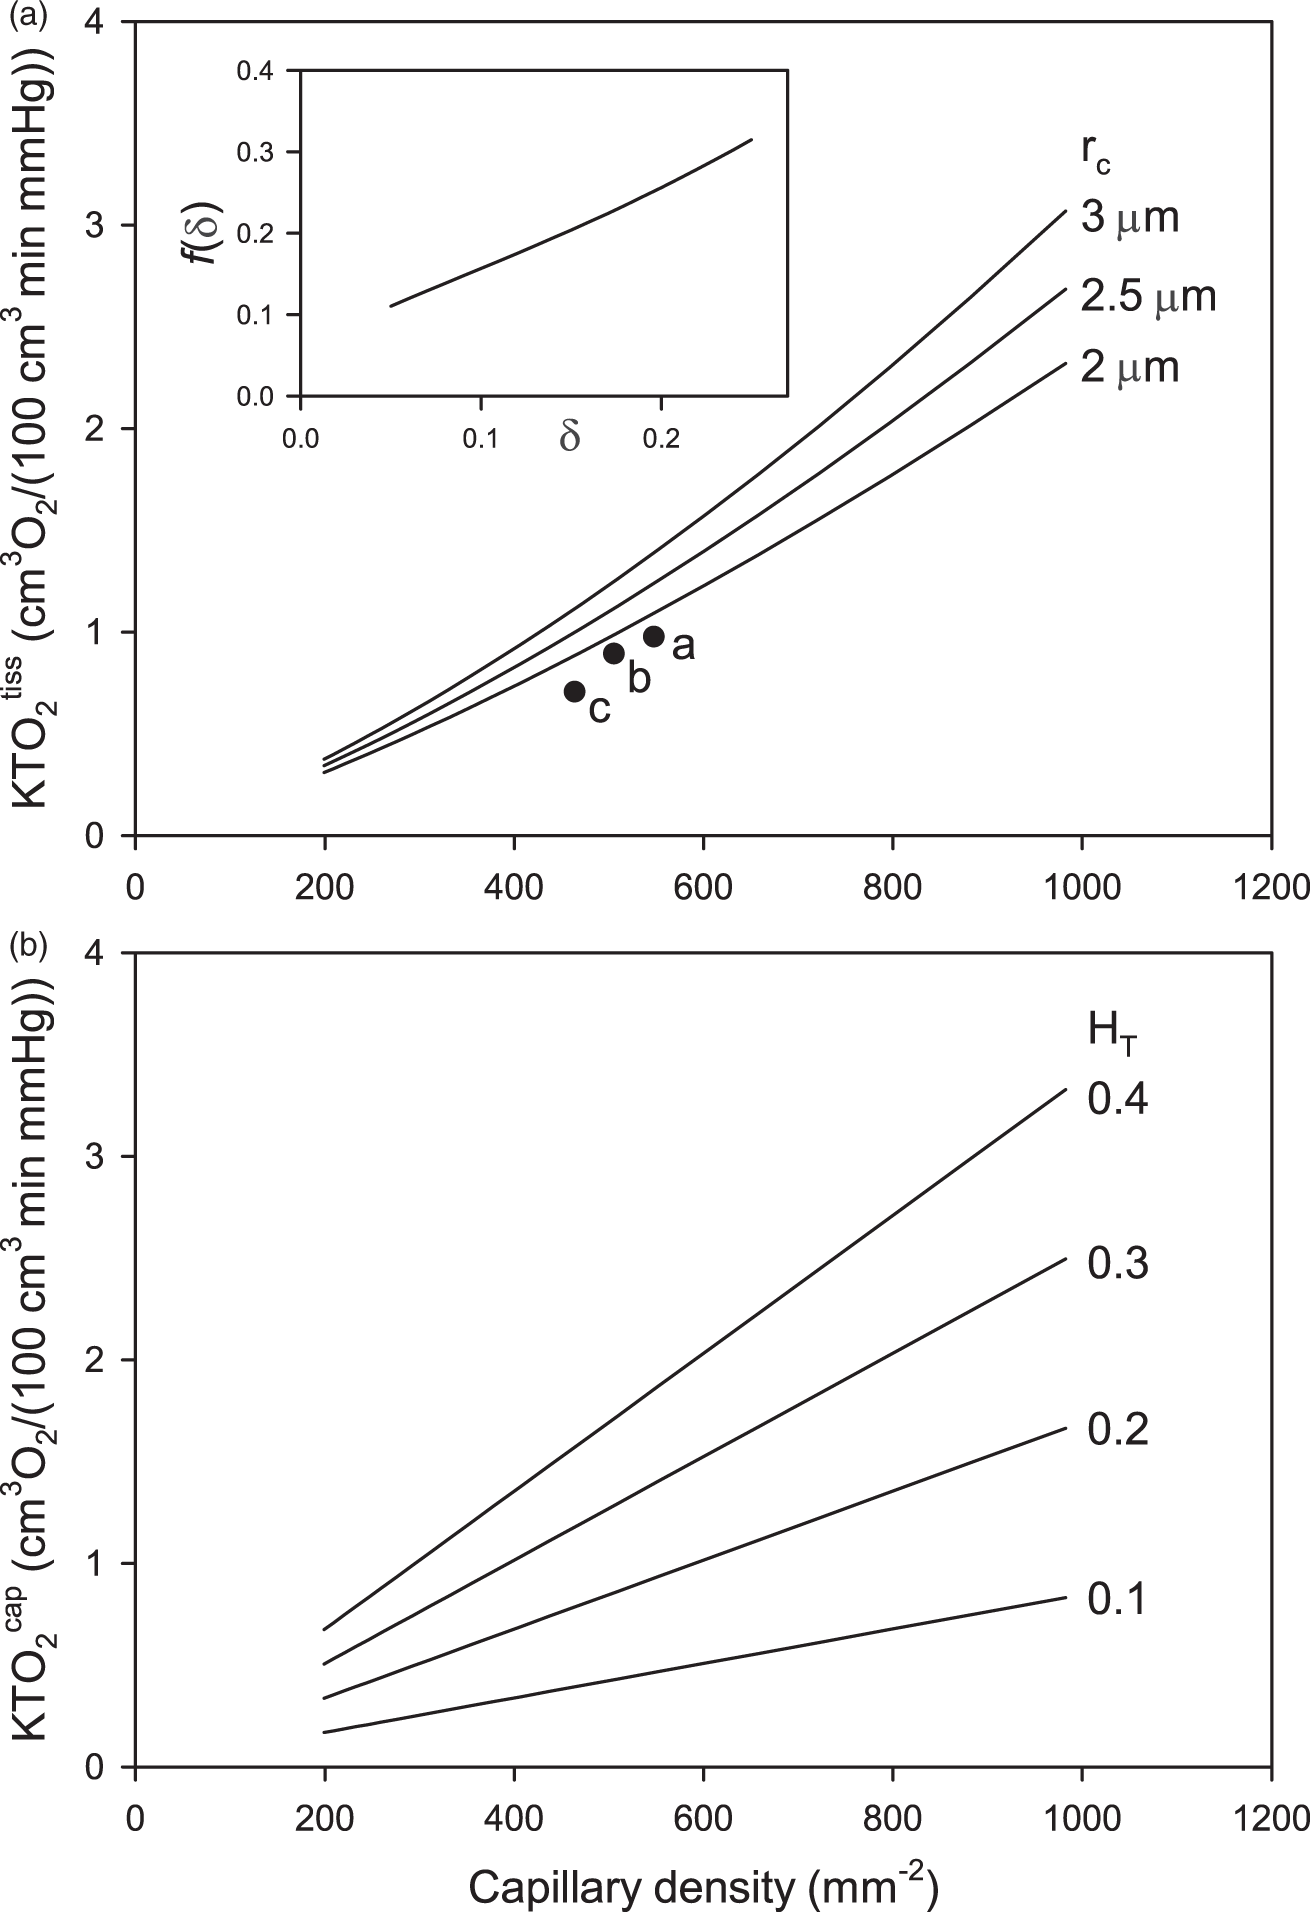
Intravascular oxygen transport processes are not represented in detail in these simulations. Instead, the intravascular diffusion coefficient Dcap is set to an artificially high value to ensure uniform PO2 within each vessel cross-section, and the intravascular mass transport coefficient defined in equation (11) is applied in the form of a step change of PO2 at r = rc, proportional to the diffusive flux on that boundary. The assumed uniform velocity vRBC within the capillary in equation (12) does not accurately represent plasma velocity, but resulting errors are negligible because oxygen dissolved in plasma is a very small fraction of the total. Equation (12) was solved using FlexPDE (Version 6.50, PDE Solutions Inc., Spokane WA), a finite-element-method solver.
Parameter values
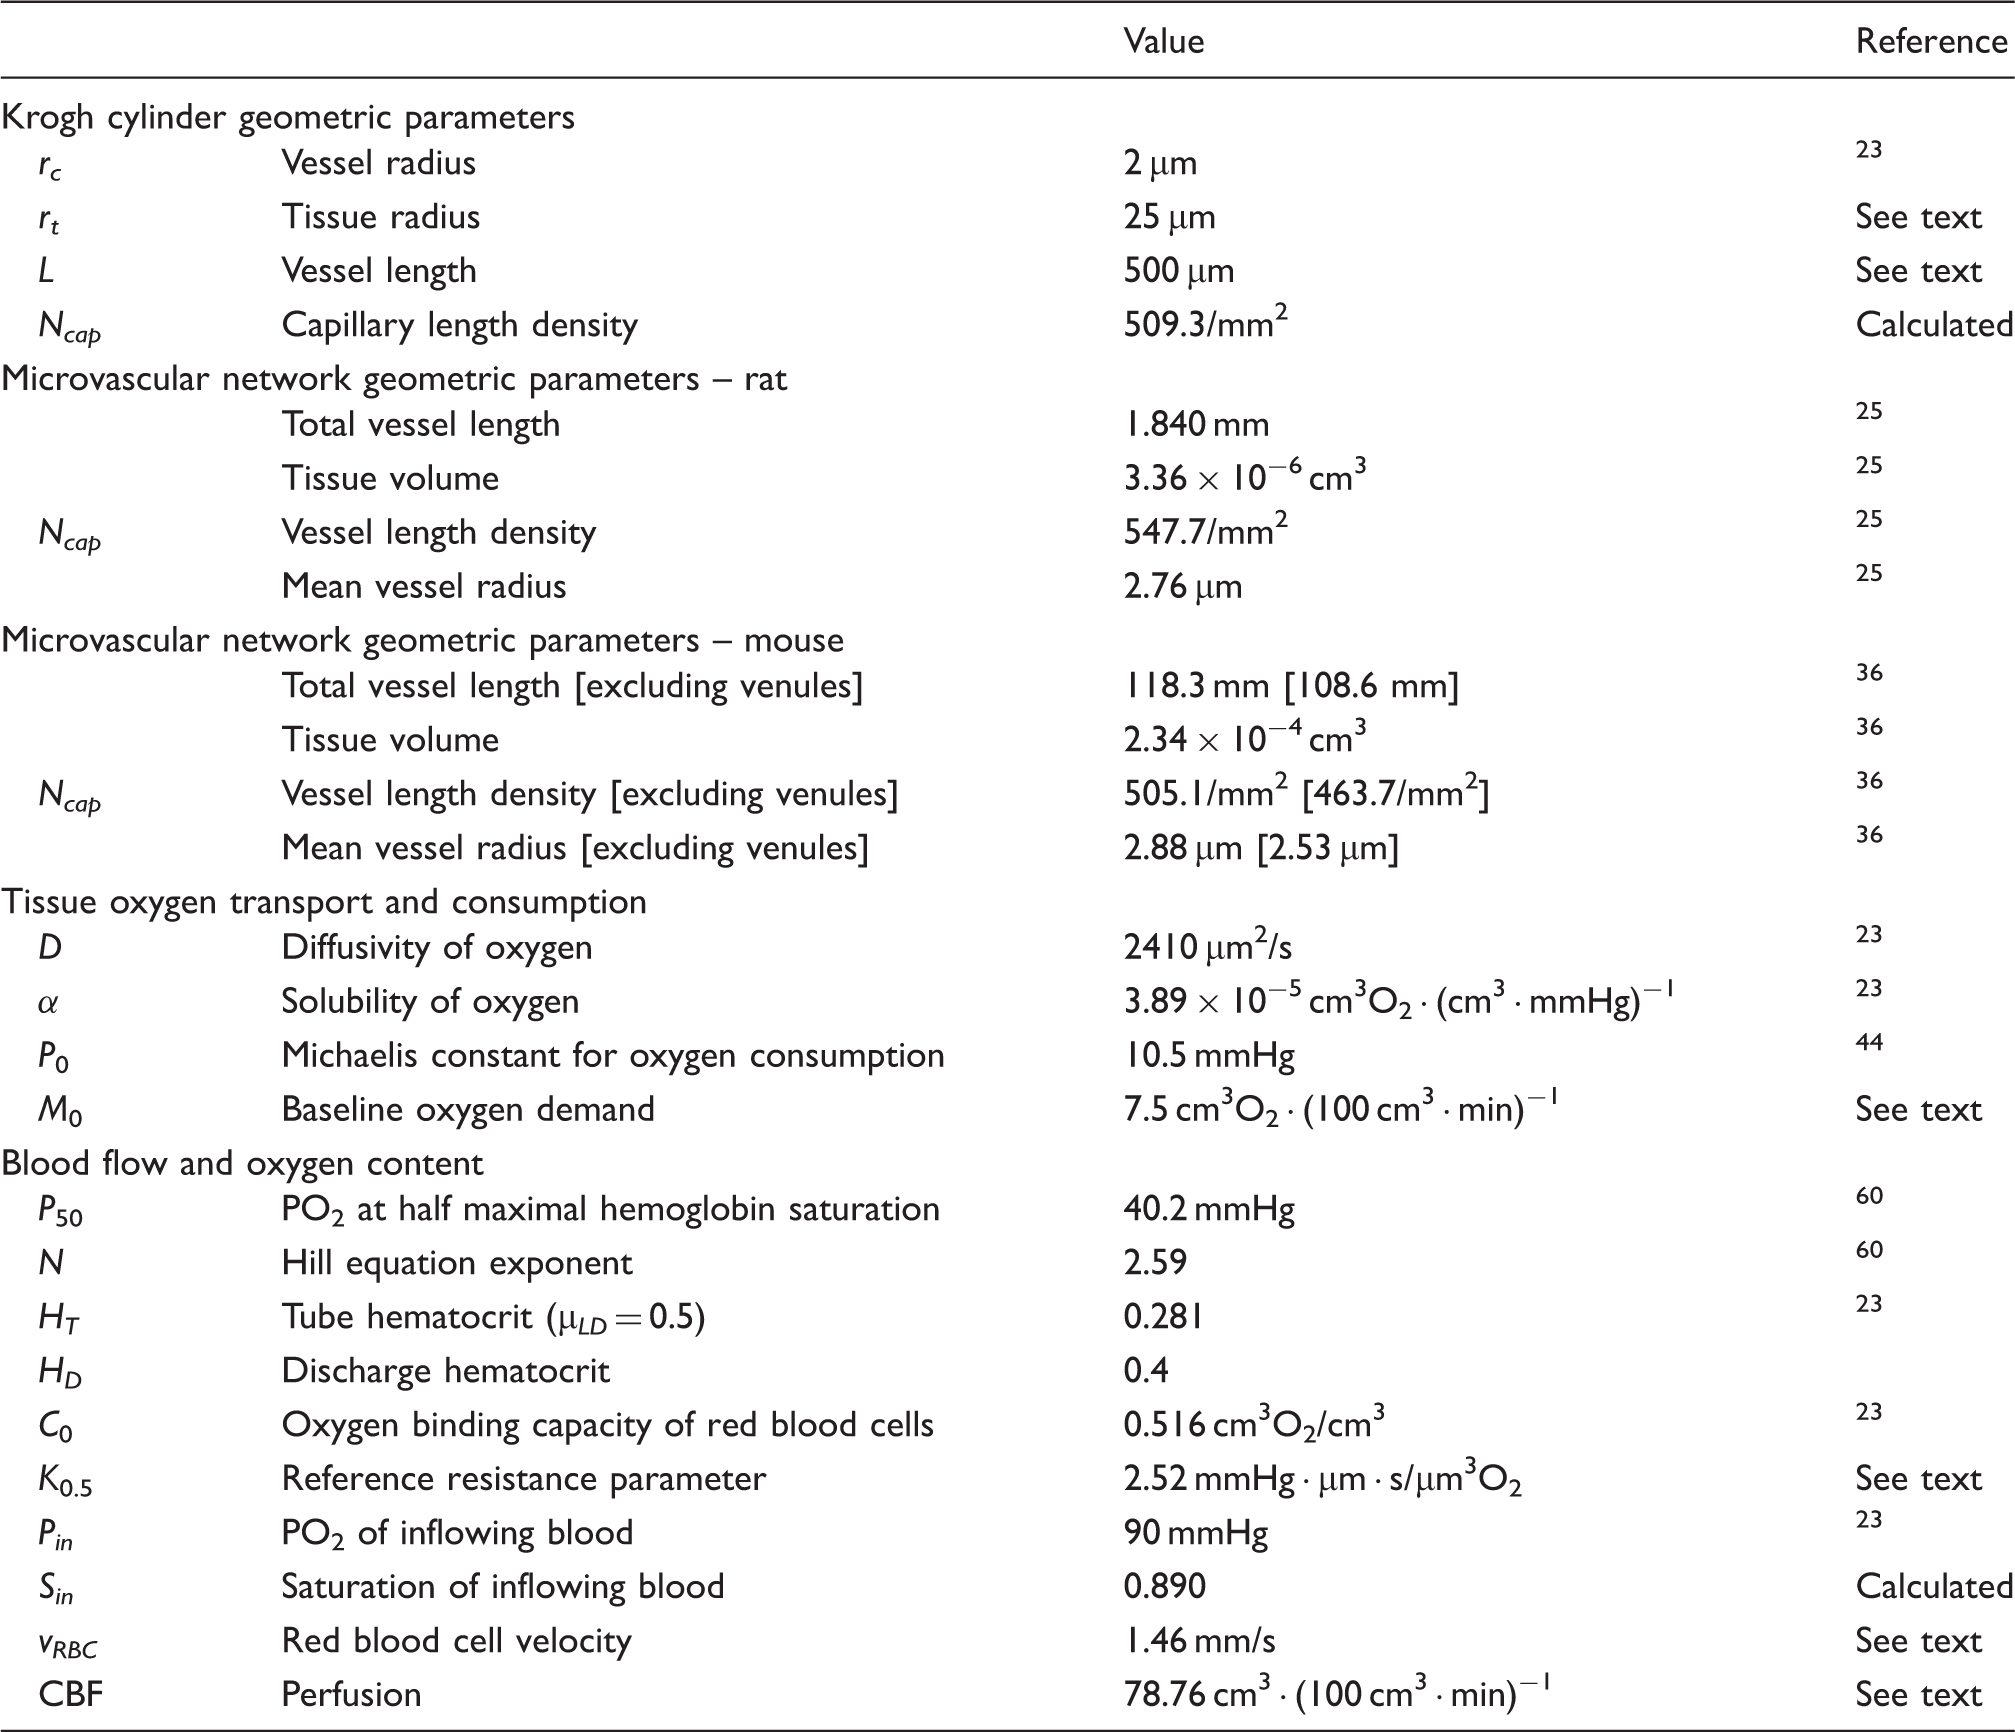
Table 1 lists assumed parameter values, chosen to represent typical conditions in the normal mouse cerebral cortex. The tissue cylinder radius rt = 25 µm corresponds to a capillary density Ncap = 509/mm2, close to the value in the observed mouse network (Table 1). The assumed capillary radius of 2 µm is in the observed range and matches that used in the simulations of Lucker et al. 23 An overall capillary length of 500 µm is assumed; as discussed below, changing this value has little effect on the results if the red blood cell velocity is changed in proportion.
Geometrical parameters for the two observed network structures were computed from network data files. The assumed oxygen diffusivity and solubility in tissue are based on measurements made at body temperature. 43 In previous work, 25 the Michaelis constant for oxygen uptake was assumed to be 1 mmHg. In the present study, a much higher value, 10.5 mmHg, is assumed, based on more recent in vivo studies. 44 As a consequence, the oxygen consumption rate M according to Michaelis–Menten kinetics is significantly less than the oxygen demand M0, even at typical levels of tissue PO2. For example, at a tissue PO2 of 40 mmHg, M/M0 = 0.80 according to equation (13). The oxygen demand M0 is chosen to yield oxygen consumption rates CMRO2 of about 6 cm3O2 · (100 cm3 · min)−1, similar to the observed values in non-anesthetized mice.45,46
As a consequence of the Fåhraeus effect, the tube hematocrit HT is lower than the discharge hematocrit HD. These quantities are related to the mean flow velocity
To establish the red blood cell velocity, we assume that the oxygen extraction fraction (OEF) is approximately 0.4, based on observed values46,48 ranging from 0.35 to 0.45. The relationship OEF = CMRO2/(CBF · Sin · HD · C0) implies, with the above parameter values, that the tissue perfusion is CBF = 81.66 cm3 · (100 cm3 · min)−1. When adjusted for the contribution of dissolved oxygen, the result is CBF = 78.76 cm3 · (100 cm3 · min)−1. The perfusion satisfies
Results
Equations (9) and (11) indicate that the length density of capillaries in tissue (Ncap) is a key determinant of the tissue and capillary mass transfer coefficients
Figure 2(a) also includes values of
Results of steady-state simulations using the Krogh cylinder model with Michaelis–Menten oxygen uptake kinetics are shown in Figure 3. Results were obtained for a range of CBF values using the finite-element method. At relatively high CBF values, the CMRO2 is insensitive to CBF. When CBF drops below a critical level (here about 25 cm3 (100 cm3 · min)−1), convective oxygen delivery is no longer sufficient to meet demand and CMRO2 declines. Oxygen extraction, defined as E = 1 – Sout/Sin where Sin and Sout are the inflowing and outflowing hemoglobin saturation values, declines as expected with increasing perfusion. The mass transfer coefficient is virtually constant, KTO2 ≈ 0.54 cm3O2 · (100 cm3 · min · mmHg)−1, over this range of CBF values.
Effect of cerebral blood flow (CBF) on oxygen transport parameters, based on Krogh cylinder model and Michaelis–Menten oxygen uptake kinetics in tissue, for parameters shown in Table 1. (a) Average tissue oxygen consumption rate. (b) Oxygen extraction fraction. Dashed curve shows prediction of Buxton and Frank formula.
28
(c) Oxygen mass transfer coefficient.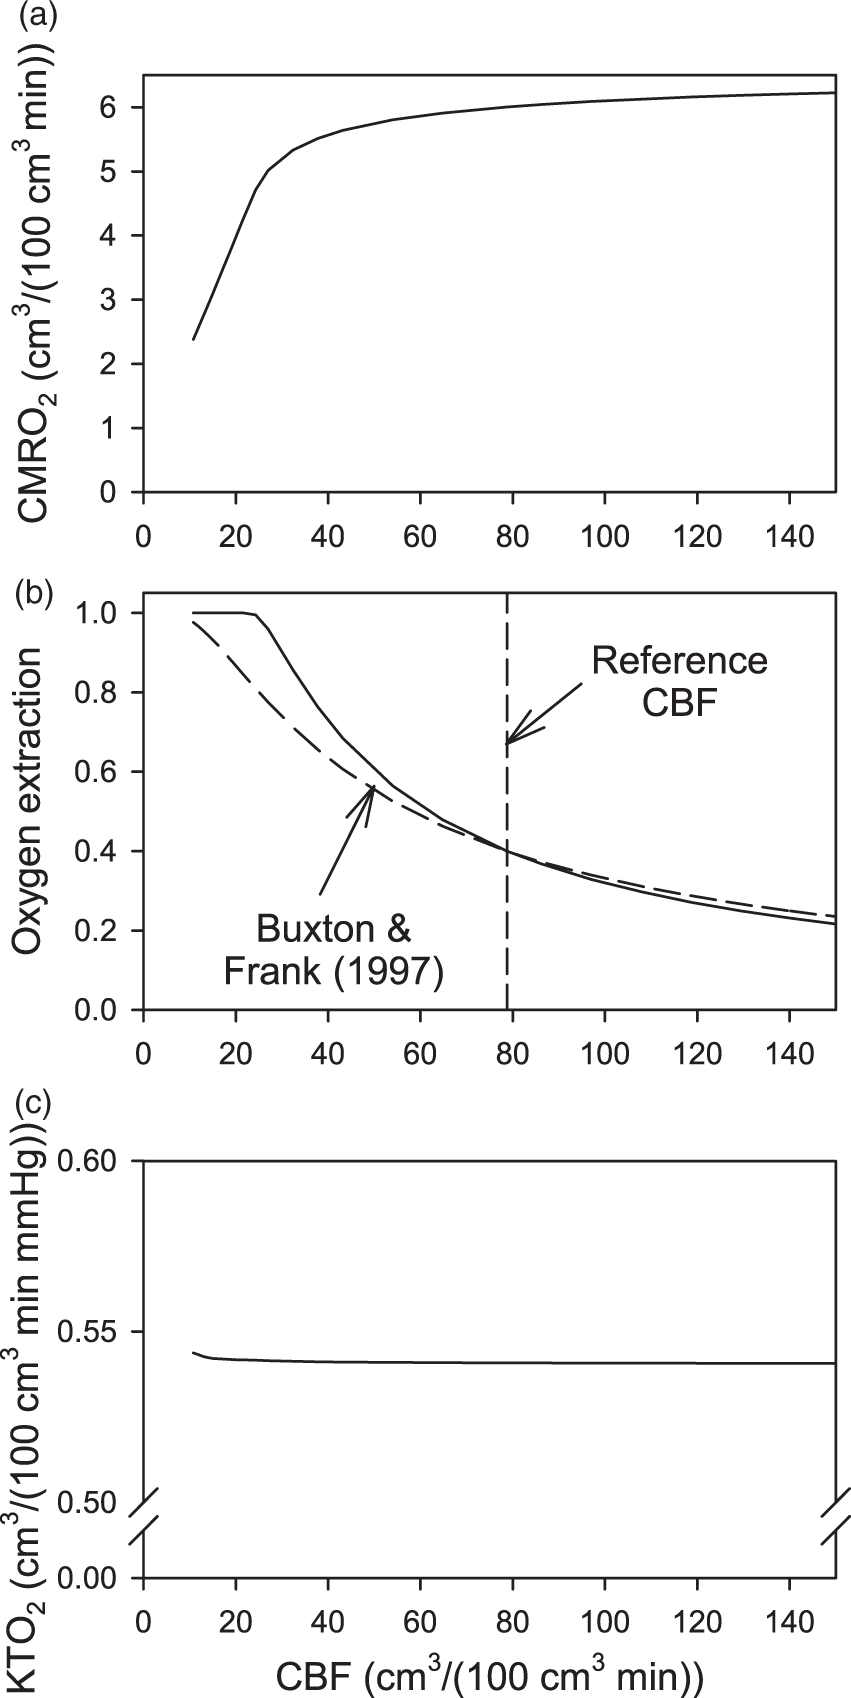
In several previous analyses of oxygen transport to cortical tissue, the effect of CBF (f) on extraction (E) has been modeled by the formula of Buxton and Frank28,49,50

Figure 4 shows results of simulations using the Krogh cylinder model assuming time-dependent blood flow and oxygen demand.
42
Two different scenarios are considered for the variation in oxygen demand, with same flow variation in both cases. In the first scenario (Figure 4(b)), the oxygen demand is assumed to vary in parallel with the flow, with the fractional increase in demand being 50% of the fractional flow increase. In the second scenario (Figure 4(c)), the oxygen demand is assumed to vary as shown by Buxton.
42
With this assumption, the increase and decrease in oxygen demand precede the associated changes in blood flow rate. These scenarios give variations in flow and oxygen consumption that are similar in amplitude and time-scale to experimentally observed behaviors.
51
The precise form of these variations is not important for the goal of assessing their effects on the mass transfer coefficient.
Variation of oxygen levels during simulated neural stimulation, using Krogh cylinder model, assuming variations in blood flow rate and oxygen consumption.
42
Solid bars represent the period of stimulation. (a) Variation of relative flow rate and oxygen demand. Oxygen demand curve (b): demand varies in parallel with flow, increase in demand is 50% of increase in flow. Oxygen demand curve (c): from Buxton.
42
(b, c). Predicted variations in 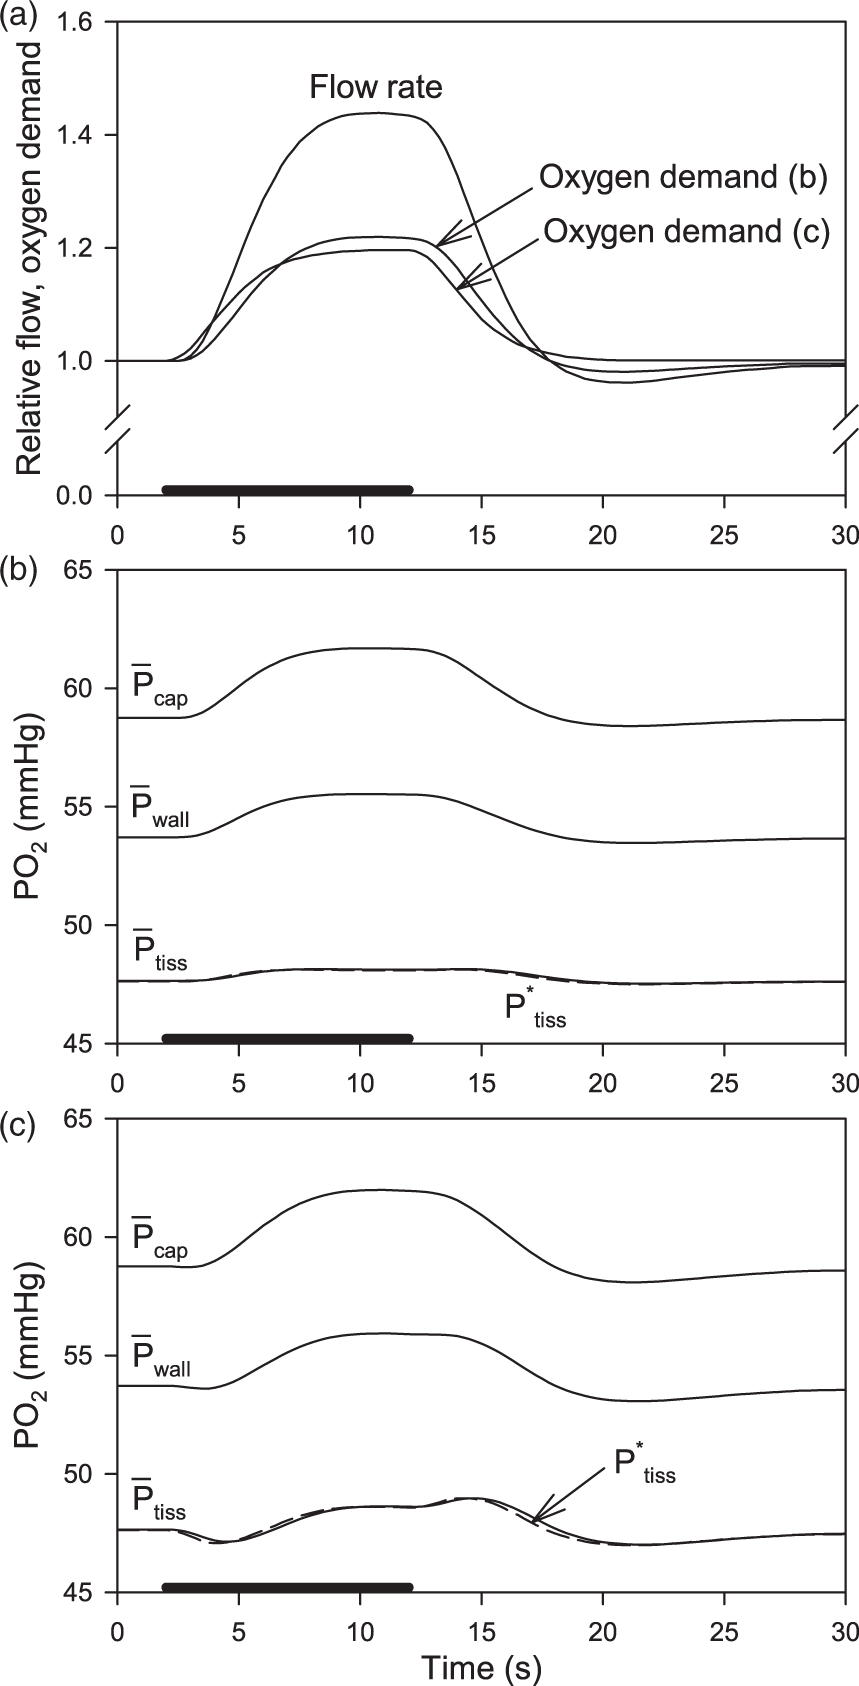
Before the onset of stimulation, the oxygen levels are at steady state, with
During the period of stimulation, the values of the mass transfer coefficients do not vary appreciably from the above values (∼0.1% variations, data not shown). The increase in CMRO2 during stimulation results in proportional increases in
During transient changes in oxygen levels, the oxygen flux JO2 through the vessel wall equals the sum of the rate of oxygen consumption in the tissue and the rate of change of the amount of oxygen dissolved in the tissue. However, the second contribution is relatively small for the rates of change of PO2 assumed here. If a rate of change of 1 mmHg/s is assumed, then the ratio of second contribution to the first is approximately 
Discussion
Under normal conditions, the oxygen supply available to intact brain cortex exceeds requirements
22
and functional activity is essentially independent of tissue PO2. But if blood perfusion and/or oxygenation are reduced, whether as a result of systemic hypoxia or local pathology, then the impact on cerebral function depends on the change in tissue PO2. The overall goal of this work is to provide a basis for estimating tissue PO2 from oxygen transport parameters that can be measured non-invasively, typically by MRI-based methods. The work focuses on the relationship between the average tissue PO2 (

Estimates of oxygen mass transfer coefficients.
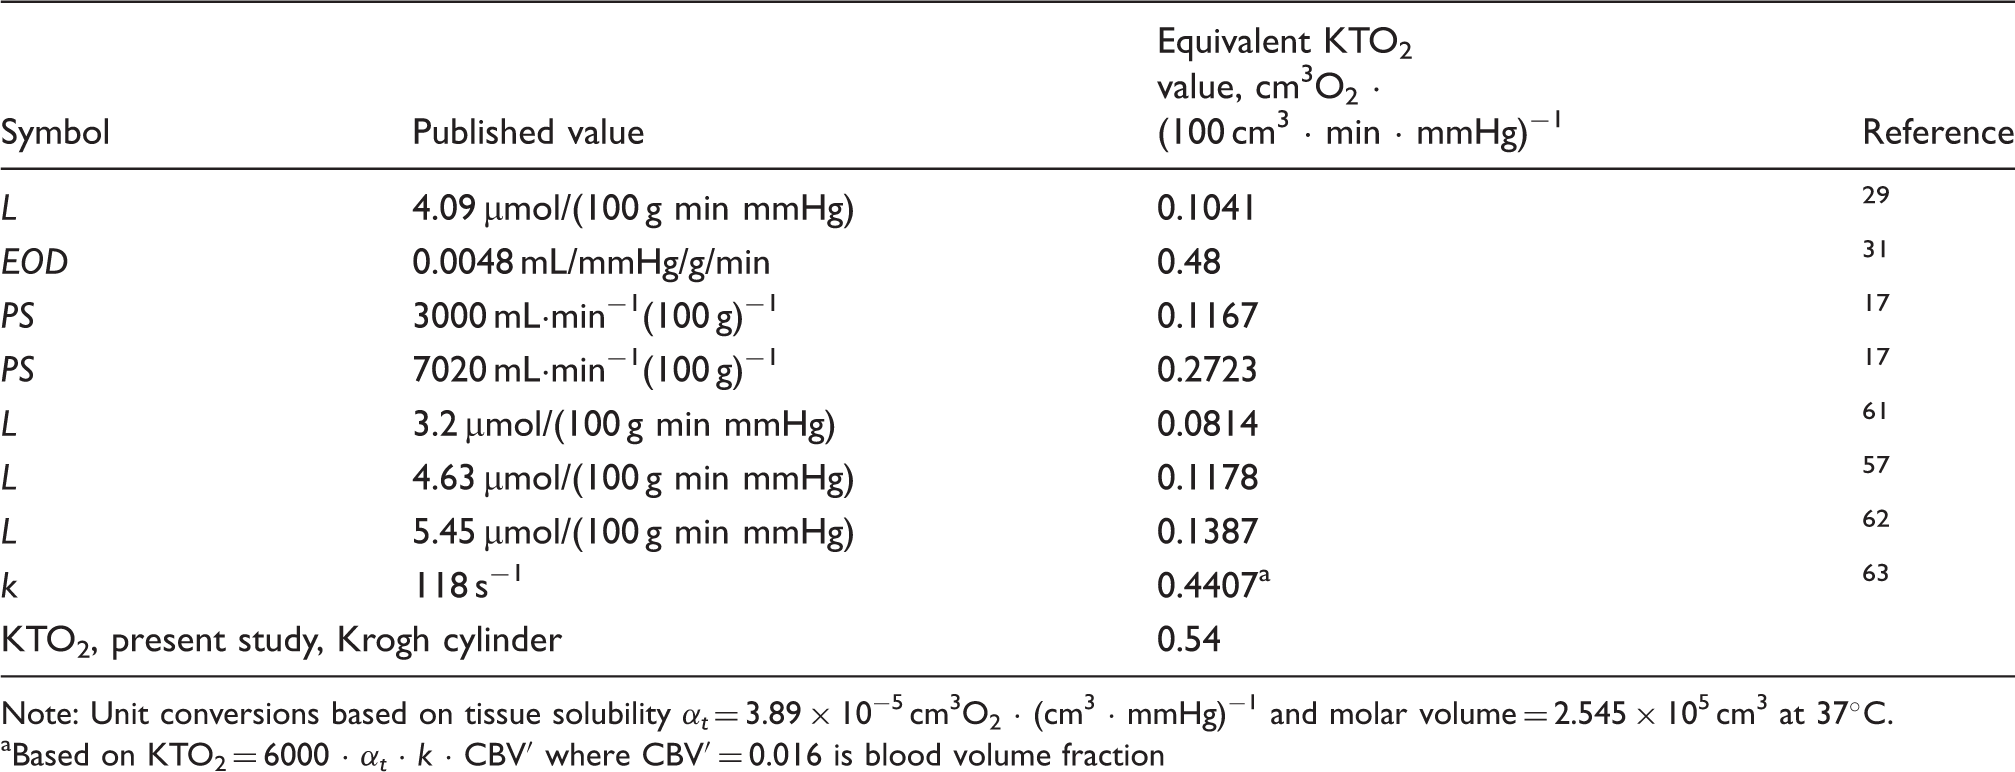
Note: Unit conversions based on tissue solubility αt = 3.89 × 10⁻⁵ cm3O2 · (cm3 · mmHg)−1 and molar volume = 2.545 × 105 cm3 at 37℃. aBased on KTO2 = 6000 · αt · k · CBV′ where CBV′ = 0.016 is blood volume fraction
According to the present results, KTO2 values are highly dependent on the vascular density in tissue, expressed as vessel length per unit volume, with a less sensitive dependence on vessel diameter (Figure 2). This implies that KTO2 is not, as has sometimes been assumed, proportional to vessel surface area per tissue volume. Such an assumption would be justified if the vessel wall was the main barrier for oxygen transport, which is not the case; significant radial gradients in PO2 are present both within capillaries and in extravascular tissue.
A further finding is that KTO2 has a significant dependence on capillary tube hematocrit HT (Figure 2(b)). With decreasing HT, the length density of red blood cells within the capillary decreases. This reduction in the amount of capillary length available for oxygen delivery from red blood cells causes a corresponding reduction in the capillary mass transport coefficient
The Krogh cylinder model is an idealized representation of microvascular geometry. In realistic microvascular networks, the distribution of distances from points in the tissue to the nearest vessel is broader than given by the Krogh model, and this would be expected to cause a decrease in
Further numerical simulations using a finite-element method were performed to explore the effects of CBF, Michaelis–Menten oxygen uptake kinetics, and time-dependent CBF and CMRO2 on KTO2. Values of KTO2 were found to be essentially unaffected by variations in CBF (Figure 3(c)). During transient variations in vessel PO2 or oxygen demand, the radial profile of PO2 differs from the steady-state profile, equation (6), and so KTO2 values might be expected to fluctuate. However, for variations of CBF and CMRO2 occurring over a period of seconds, KTO2 values computed from equation (1) were virtually constant. Moreover, the difference between JO2 and CMRO2 was small, such that equation (16) provides a good approximation to
The present study predicts higher values of KTO2 than stated previously. Given that the decline in PO2 from blood to tissue is inversely proportional to KTO2, this finding has the important implication that tissue PO2 levels do not differ as much from blood PO2 as previous models have suggested. For example, for a typical cortical CMRO2 value of 6 cm3O2 · (100 cm3 · min)−1, the present theory predicts a blood-to-tissue difference of 11 mmHg for reference parameter values.
Although the results presented here are based on parameter values for mice and rats, the approach is applicable to other species, including humans. Vascular length density in human cortex is about 30% lower than in mice, 54 implying a corresponding reduction in KTO2 (Figure 2). However, CMRO2 values are also lower in human than in mouse cortex by a similar factor, 55 and according to equation (1) the blood-to-tissue difference in PO2 may therefore be similar in humans to that estimated above for mice. Pronounced variations in vascular density are observed through the successive layers of primate cortex, which are correlated with variations in metabolic demand 56 and imply corresponding variations in KTO2.
Experimental measurements of tissue PO2 in cerebral cortex vary considerably. Erecinska and Silver
1
cite values in the range 20 to 40 mmHg in various species. Other studies have shown baseline values of 18 mmHg,
57
25 mmHg
6
and 33 mmHg
51
in rodent cortex. The present model predicts a higher value,
An important limitation of the present work is that it considers only the average value and not the distribution of tissue PO2. The existence of radial gradients in the tissue implies non-uniformity in tissue PO2. Moreover, the distributions of PO2 levels in realistic network geometries are much broader than predicted from Krogh-cylinder type models. 25 Although hypoxia is not expected in healthy brain under normoxic conditions, deficits in oxygen supply or distribution may lead to regions of hypoxia in cortex even when the average tissue PO2 is well above the hypoxic range. Heterogeneity in network structure and in blood flow distribution within microvascular networks tends to broaden the distribution of tissue PO2 and increase the likelihood of tissue hypoxia. Although local acute regulation of blood flow is believed to be largely independent of tissue oxygen levels,22,58 mechanisms of structural adaptation of vessel diameters may be oxygen dependent and may play a critical role in maintaining uniform oxygenation of the healthy cortex and avoiding maldistribution of flow that could lead to local tissue hypoxia even with adequate overall perfusion. 59
Funding
The author(s) disclosed receipt of the following financial support for the research, authorship, and/or publication of this article: This work was supported by the National Institutes of Health grants U01 HL133362 and R01 MH111359.
Declaration of conflicting interests
The author(s) declared no potential conflicts of interest with respect to the research, authorship, and/or publication of this article.
Authors’ contributions
TS conceived and carried out the study and wrote the text. SS and DB provided the vascular geometry of mouse cortex and conceptual guidance. KB developed the finite-element model. All authors edited the text.