
Abstract
Negative blood oxygenation–level dependent (BOLD) signal observed during task execution in functional magnetic resonance imaging (fMRI) can be caused by different mechanisms, such as a blood-stealing effect or neuronal deactivation. Electrophysiological recordings showed that neuronal deactivation underlies the negative BOLD observed in the occipital lobe during visual stimulation. In this study, the metabolic demand of such a response was studied by measuring local metabolite concentration changes during a visual checkerboard stimulation using functional magnetic resonance spectroscopy (fMRS) at 7 Tesla. The results showed increases of glutamate and lactate concentrations during the positive BOLD response, consistent with previous fMRS studies. In contrast, during the negative BOLD response, decreasing concentrations of glutamate, lactate and gamma-aminobutyric acid (GABA) were found, suggesting a reduction of glycolytic and oxidative metabolic demand below the baseline. Additionally, the respective changes of the BOLD signal, glutamate and lactate concentrations of both groups suggest that a local increase of inhibitory activity might occur during the negative BOLD response.
Keywords
Introduction
Functional magnetic resonance imaging (fMRI) is based on a proxy of the measurement of neuronal activity, usually relying on the blood oxygen–level dependent (BOLD) signal. BOLD signal depends on three physiological variables, namely the cerebral blood flow (CBF), cerebral blood volume (CBV), and the oxygen consumption (CMRO2). Most task-related BOLD–fMRI studies measure an increase of the BOLD signal compared to baseline (positive BOLD response; PBR), which is usually associated with an increase of neuronal activity. 1 However, a sustained negative BOLD signal (negative BOLD response; NBR) has been observed in several circumstances both in humans2,3 and animals. 4 Several hypotheses have been proposed to explain the mechanism underlying the NBR, among which the two main ones are: (i) a blood stealing process where the blood flow is relocated from less demanding area to more CBF-demanding regions 5 or (ii) a neuronal deactivation.6–8 Additionally, an NBR attributed to other mechanisms has also been observed in rodents, where some subcortical areas have shown a decrease of BOLD concurrent with an increase of neuronal activity and a decrease in CBV 9 or an increase in CMRO2 that exceeds the arterial blood compensation during seizures in hippocampus. 10 Nevertheless, the NBR triggered by a central checkerboard appears to be linked to a decrease of spontaneous neuronal activity, both local field potential (LFP) and multiunit activity (MUA), as shown by simultaneous electrophysiological recordings in macaque monkey.6,11
As discussed in Mangia et al., 12 there are several mechanisms that can result in suppressed neuronal firing in the neocortex such as (i) a reduction of afferent (excitatory) input (see Priebe and Ferster 13 and references therein), (ii) a disfacilitation causing a decrease of intracortical processing 14 or (iii) an increase of local active inhibition on excitatory neurons (see Roux and Buzsáki 15 and references therein). In terms of metabolic demand, the first case is expected to induce a reduction of energy metabolism.12,16 Although a reduction in metabolic demand is less intuitive for the second and third case, a reduction of metabolic costs would also be expected based on the smaller percentage of GABAergic neurons, which represent 15–30% of the total population, 17 and the smaller fraction of energy consumed compared to glutamatergic neurons. 18 Therefore, two to three times smaller amplitude of the NBR relative to that of the PBR6,19–21 is likely due to the compensation from relative small energy demands of increased local GABAergic activity.
The analysis of the BOLD signal is widely used by the neuroscientific community to understand brain functions, but the complexity of the coupling between metabolism, vasculature and neuronal activity might lead to a difficult data interpretation. In our context, it is still not clear whether the mechanisms responsible for the NBR are just the opposite of the mechanisms triggering the PBR. To shed light on those mechanisms, we used 1H functional magnetic resonance spectroscopy (fMRS) and fMRI comparing metabolite changes during PBR and NBRs in the visual cortex in two cohorts of volunteers. Although the overall decrease of metabolism during the NBR should be observed, we hypothesized that the amplitudes and directions of the metabolite concentration changes are not simply the inverse of the changes observed during the PBR. Additionally, the results obtained should provide information on which type of neuronal suppression is the most favorable during the NBR.
Methods
Participants
Two groups of healthy participants took part in this study: one group of 20 participants (5 females, 21.9 ± 1.3 years old) was scanned while viewing the positive BOLD (posBOLD) inducing stimulus and another group of 21 participants (10 females, 22 ± 3.8 years old) was scanned while viewing a negative BOLD-inducing stimulus (negBOLD). All participants were right-handed and presented good or lens-corrected vision. They all provided written informed consent and this study was approved by the local ethics committee (Commission d’Éthique de la Recherche sur l’Être Humain du Canton de Vaud). The Federal and Local guidelines (Human Research Act, RS 810.30) were followed throughout the study.
MR acquisition
All participants were scanned on a head-only 7-Tesla/68 cm MRI scanner (Siemens Medical Solutions, Erlangen, Germany) using a home-built 1H quadrature transmit/receive surface coil covering the occipital lobe. The quality of the B1 field in the occipital area was evaluated with a SA2RAGE sequence 22 (repetition time (TR) = 2400 ms, echo time (TE) = 0.79 ms, matrix 128 × 128 × 64, 2.0 × 2.0 × 2.5 mm3 voxels). A “localizer” functional MRI (fMRI) experiment was acquired with sinusoidal echo-planar imaging (EPI) (EPI, coronal–oblique acquisition, TR = 2000 ms, TE = 27 ms, matrix 106 × 106 × 26, 2 × 2 × 2 mm3 voxels) covering the occipital area, followed by structural image using the MP2RAGE anatomical scan 23 (TR = 5500 ms, TE = 1.84 ms, first inversion TI1 = 750 ms, second inversion TI2 = 2350 ms, matrix 152 × 152 × 144, 1.2 × 1.2 × 1.2 mm3 voxels). A low-resolution MP2RAGE acquisition was selected in order to minimize the total acquisition time. Based on the localizer fMRI results (statistical maps were calculated online using vendor-provided software), the voxel of interest (VOI) was carefully placed in the occipital region showing the highest/lowest BOLD signal. After optimization of the flip angle, first- and second-order shims were adjusted with fast, automatic shim technique using echo-planar signal readout for mapping along projections (FAST(EST)MAP, shim volume: 20 × 20 × 20 mm3).24,25 OVS bands were placed around the VOI to suppress outer signal. 1H-MR spectra were acquired using the semi-adiabatic SPECIAL sequence (Xin et al.,; 26 TR = 7500, TE = 16 ms, VOI = 18 × 18 × 18 mm3, 88 × 2 scans). A small VOI was chosen in order to avoid partial volume contribution. This was especially important in the negBOLD group as the negative response, which is of smaller amplitude, is surrounded by positive BOLD signal. An additional spectrum without water suppression was also acquired for absolute metabolite quantification at the end of the scan session (two averages). The total time spent inside the scanner for each participant was ∼65 min.
Paradigm
During the functional acquisitions, the posBOLD group was stimulated with a full-screen radial checkerboard (viewing angle = 16°, distance from screen = 75 cm, inset in Figure 1(a)) and the negBOLD group with a small central checkerboard (viewing angle = 2°, distance from screen = 75 cm, inset in Figure 1(b)), both flickering at a frequency of 3.3 Hz. During the fMRI localizer run, a block design task was used with a flickering checkerboard (stimulation period (STIM), 10 s) alternating with a gray screen (REST 20 s), repeated 12 times. The same stimulation was used for the fMRS run with different timings (starting with 2 min REST and four alternate periods of 5 min STIM and REST; 22 min total). During the entire task, the participants were asked to focus on a central crossed changing its color from dark red to light red to ensure their compliance.
fMRI results (p < .001 uncorrected) of representative participants in (a) the posBOLD group and (b) the negBOLD group. The inset images represent the checkerboards used to trigger the PBR and NBR. The red scale represents the PBR and the blue scale represents the NBR. The H1-MRS VOIs are showed in green. An example of the fMRI acquisition slab is delineated in yellow. (c) Percentage change of BOLD signal inside the VOI used for fMRS for both the posBOLD and negBOLD groups. Each dot is a subject. The bar indicates the standard deviation (d) Linewidth change of the NAA peak measured as the FWHM of STIM-REST. (e) Percentage of voxels showing a positive (red) or negative (blue) signal in both posBOLD and negBOLD groups. The error bars represent the standard deviation. (f) Pooled averaged spectra of the last three minutes both STIM and REST periods for the posBOLD group in order to illustrate the BOLD effect on the NAA peak height and FWHM.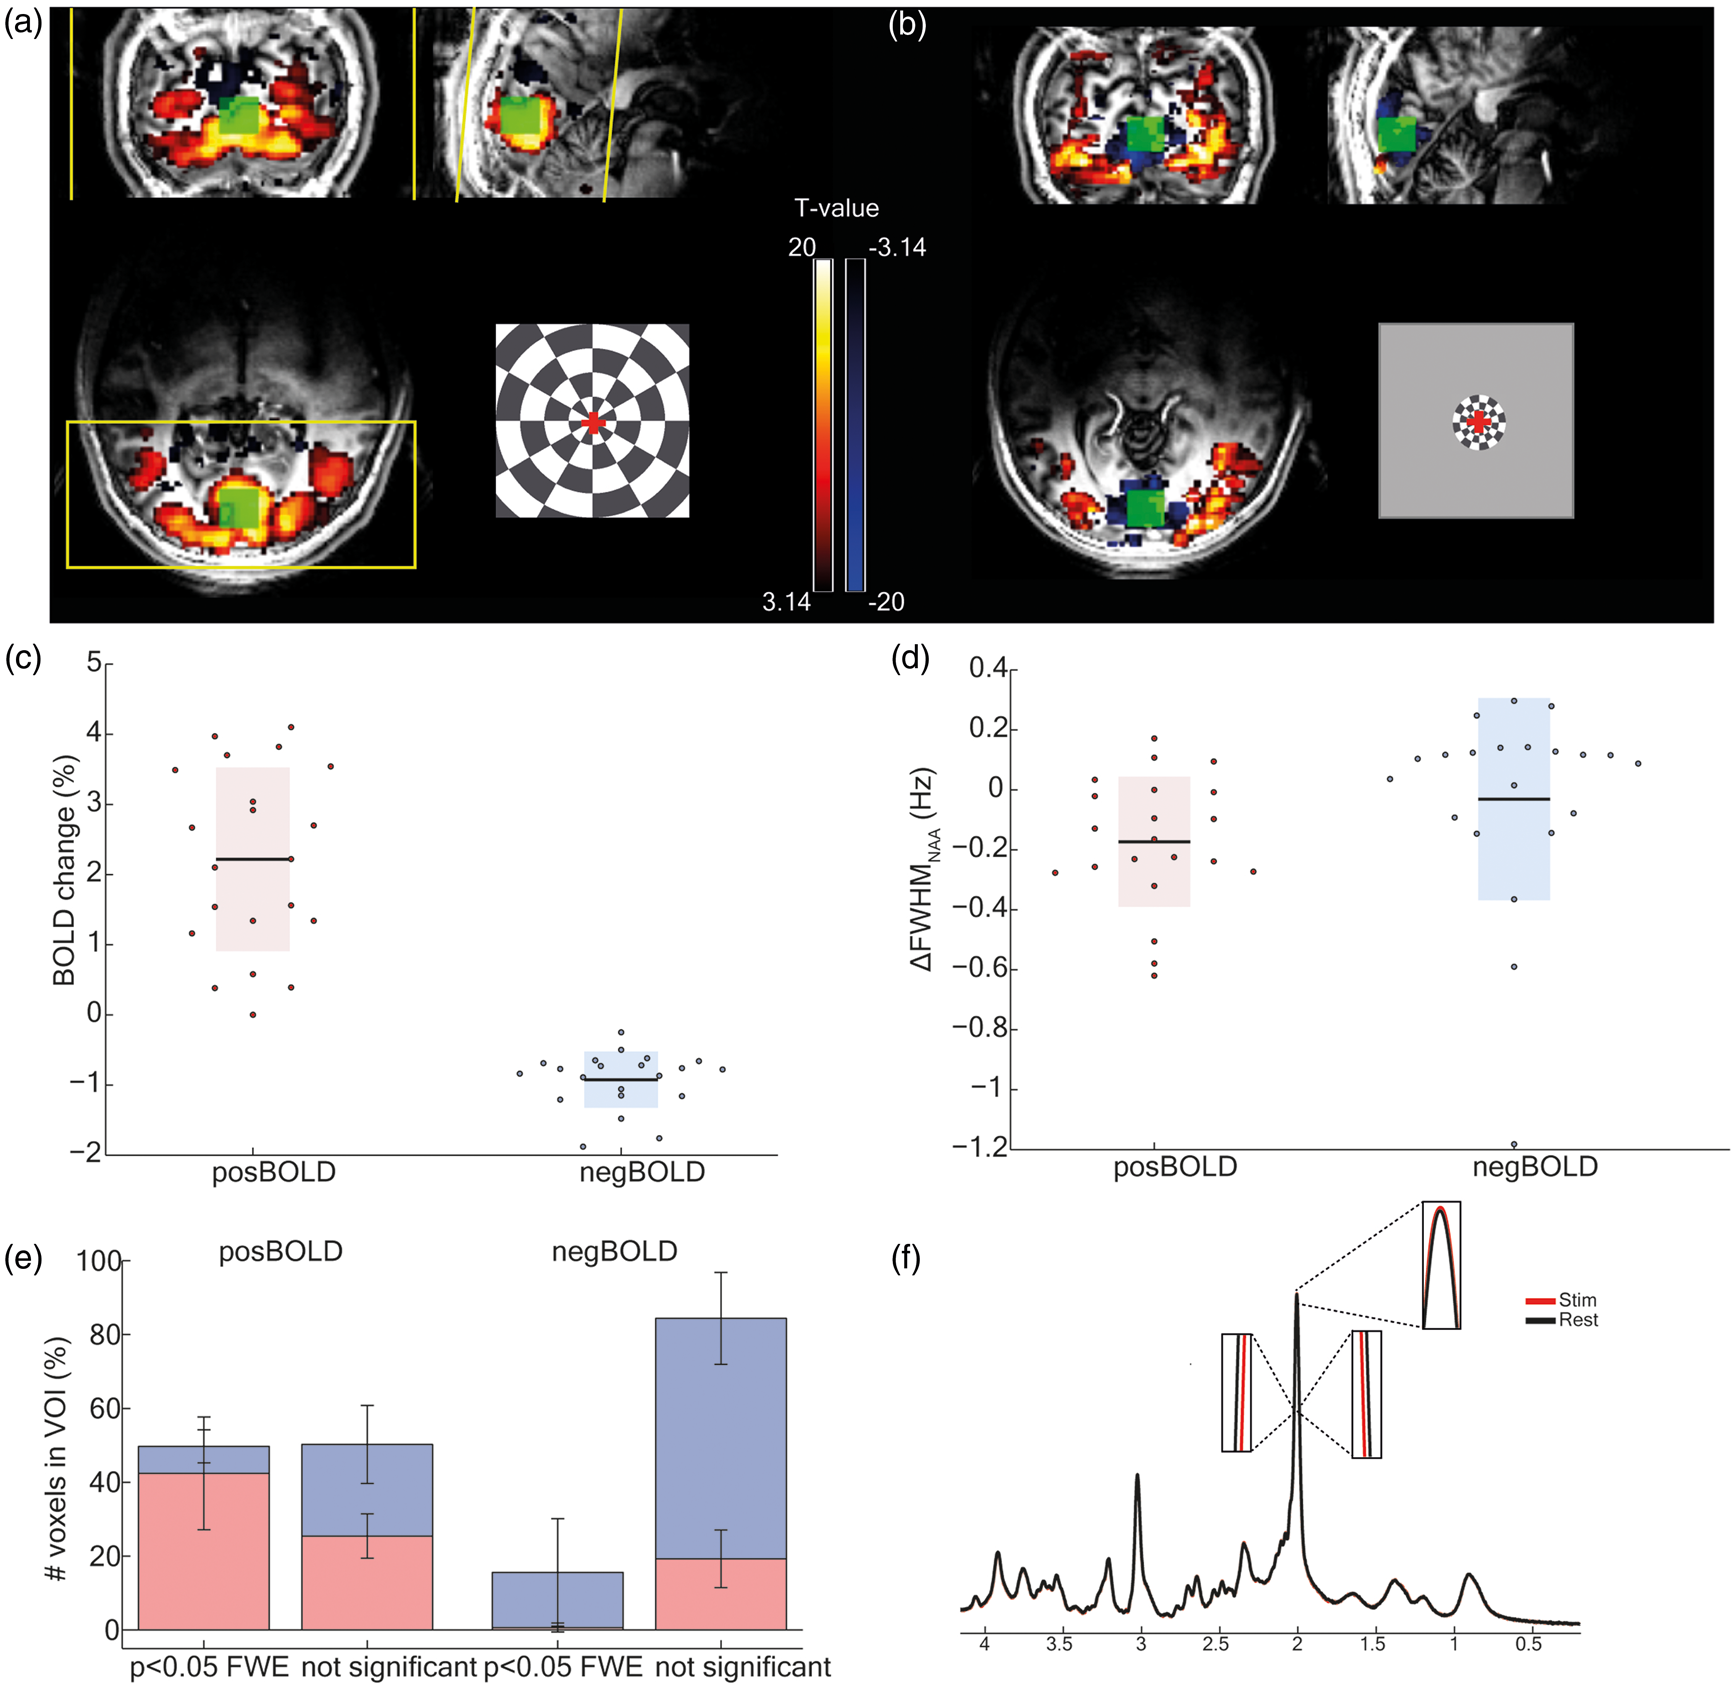
fMRI data processing
Offline, the localizer EPI data were corrected for slice timing and motion. All the processing was performed using SPM12 (www.fil.ion.ucl. ac.uk/spm), except the motion correction which was performed with FLIRT (part of the FSL package; Jenkinson et al. 27 ). To remove the effect of large veins on the estimation of the BOLD response amplitude, a vein mask was created based on multiscale vessel enhancement filtering from the unsmoothed reference volume of each EPI data set.28,29 Statistical parametric maps were obtained from a general linear model, including the STIM timing as regressor of interest and motion estimates as nuisance regressors. To compute the percent signal change inside the VOI, the regression coefficient map of the paradigm was divided by the map representing the constant term of the regression. The mean percent BOLD signal change was then extracted using the matching fMRS VOI as a mask (green box in Figure 1(a) and (b)) from which voxels corresponding to large veins were removed. In addition, the fractions of statistically significant (p < 0.05 family-wise error (FWE) corrected) and nonsignificant voxels inside the same VOI for both groups were computed.
fMRS data processing
All processing steps were performed with home-built Matlab (R2014a, The MathWorks, Inc. USA) functions. All individual spectra were checked for quality and removed in case of motion or lipid contaminations. An average of 12.8 and 11.5 spectra were removed per dataset for the posBOLD and negBOLD groups, respectively. The spectra were corrected for phase differences and small B0 drifts were compensated by aligning the total creatine peak (3.03 ppm). The spectra were averaged in three different ways: (1) The last 3 min of the first and second STIM periods were averaged together for each participant as well as the last 3 min of the second and third REST periods. (2) The last 3 min of the first and second STIM periods were pooled and averaged across all participants, similarly for the last 3 min of the second and third REST periods. (3) For the metabolites showing significant concentration changes, time courses were created by averaging every eight spectra together to obtain 22-time points.
Both STIM and REST averaged spectra were corrected for linewidth changes due to T2* changes (see Figure 1(f)) during positive and negative BOLD signal changes 30 as it has been shown that such effect could affect the statistical outcome. 31 The correction was performed by computing the full-width at half maximum (FWHM) difference (STIM-REST) of the N-acetylaspartate (NAA) peak. The FWHM difference was then used to correct the corresponding averaged spectra by applying exponential line broadening. The SNR of both STIM and REST averaged spectra were matched by adding white noise.
All spectra were fitted and quantified using LCModel (Stephen Provencher, Inc., Oakville, ON, Canada) with a basis set including 20 simulated metabolites spectra using published chemical shift and J-coupling values 32 and an experimentally measured macromolecular baseline from the occipital lobe. 33 The LCModel analysis was performed from 0.2 ppm to 4.2 ppm. The unsuppressed water spectra were used as an internal reference for absolute quantification. Fourteen metabolites quantified with a Crámer–Rao lower bound (CRLB) below 30% were considered for further analysis.34–36
Statistical analysis
To investigate which metabolites significantly changed during the positive and negative BOLD signal changes, paired two-tailed t-tests were computed for each metabolite between the STIM and REST averaged periods for each group using MATLAB. The false discovery rate (FDR) method 37 was applied to control for false positive errors for the 14 metabolites.
Results
To assess the BOLD signal changes, localizer fMRI data sets were acquired using the two checkerboard paradigms. Both PBR and NBR were observed in visual areas 1 and 2 (BA17 and BA18) of their respective groups (p < 0.05 FWE-corrected; Figure 1(a) and (b)) at a single subject level. As the checkerboard stimulus did not fill the visual field entirely, even for the posBOLD case, there were NBRs also in the posBOLD acquisitions in areas V2–V3, although much more superior than in the negBOLD runs. The PBR of the posBOLD group spread more laterally than the negative response of the negBOLD group. Notice that even though the spatial extent of the NBR was smaller than in the posBOLD case, the VOI of the negBOLD group did not contain substantial positive BOLD signal (Figure 1(e)). The positive BOLD amplitude (mean = 2.3%, SD = 1.2%, posBOLD group) was more than twofold (−2.6 ± 1.8, ratio ± SD) higher in amplitude than that of the negative BOLD (mean = −0.9%, SD = 0.4%, negBOLD group; Figure 1(c)).
To assess the BOLD effect on the metabolites the linewidth was measured from the NAA peak and changed, for most of the participants, according to the direction of the BOLD fMRI signal changes (Figure 1(d); posBOLD: mean = −0.18 Hz, SD = 0.21 Hz; negBOLD: mean = −0.03 Hz, SD = 0.32).
To assess metabolite changes during the two paradigms studied, 1H MR spectra were acquired from the visual cortex and analyzed by LCModel after correcting for the BOLD effect on metabolite linewidths.
To ensure that both posBOLD and negBOLD groups had a similar metabolite concentration at baseline (first REST period), 14 unpaired t-tests were computed between both groups and no statistically significant differences were found.
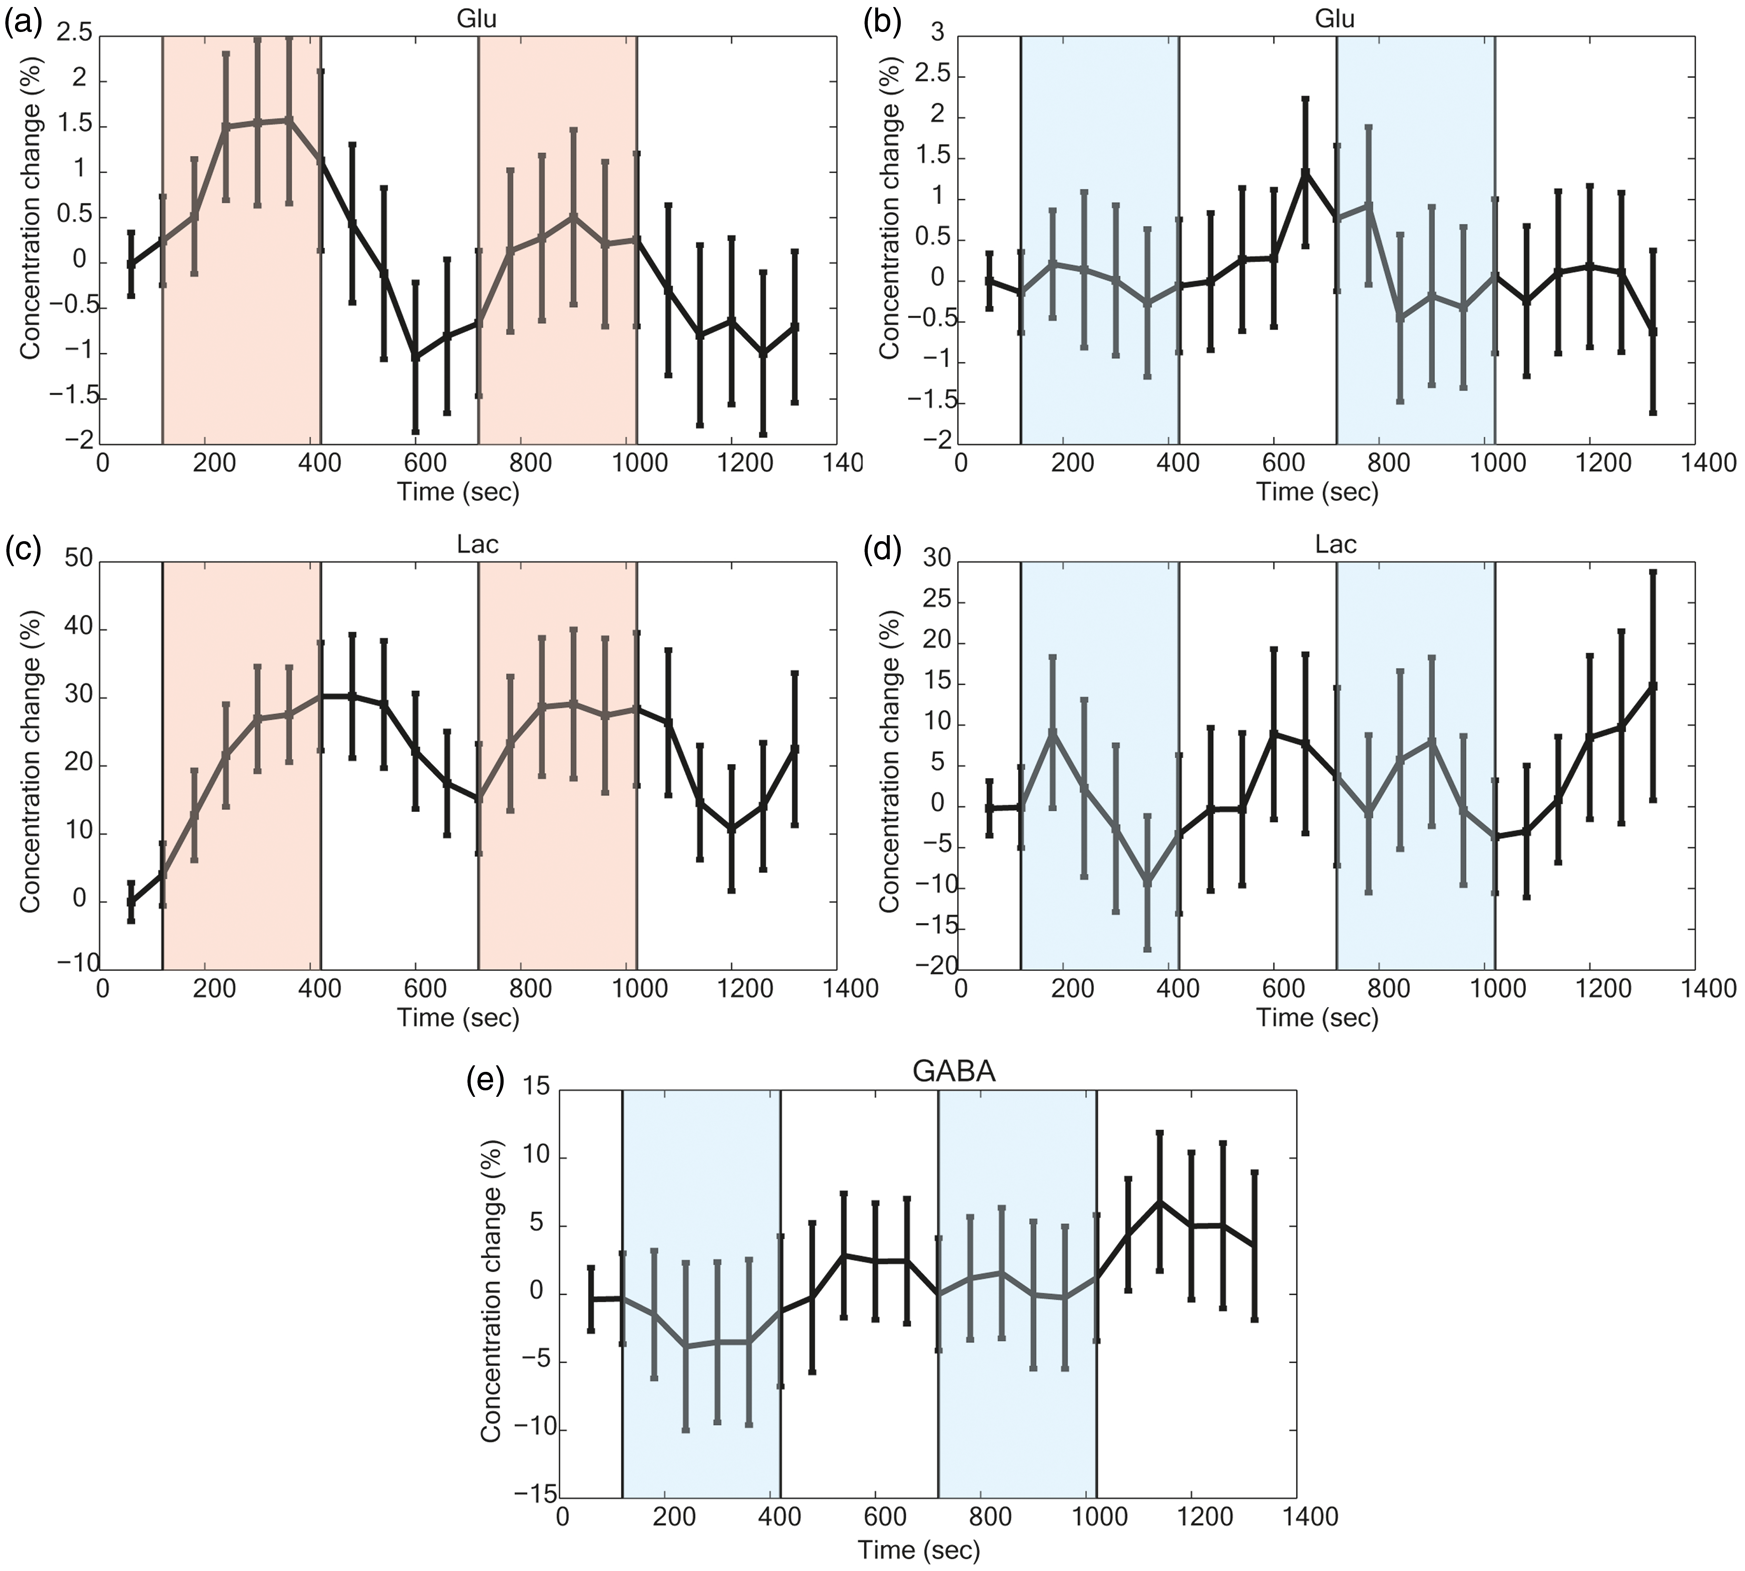
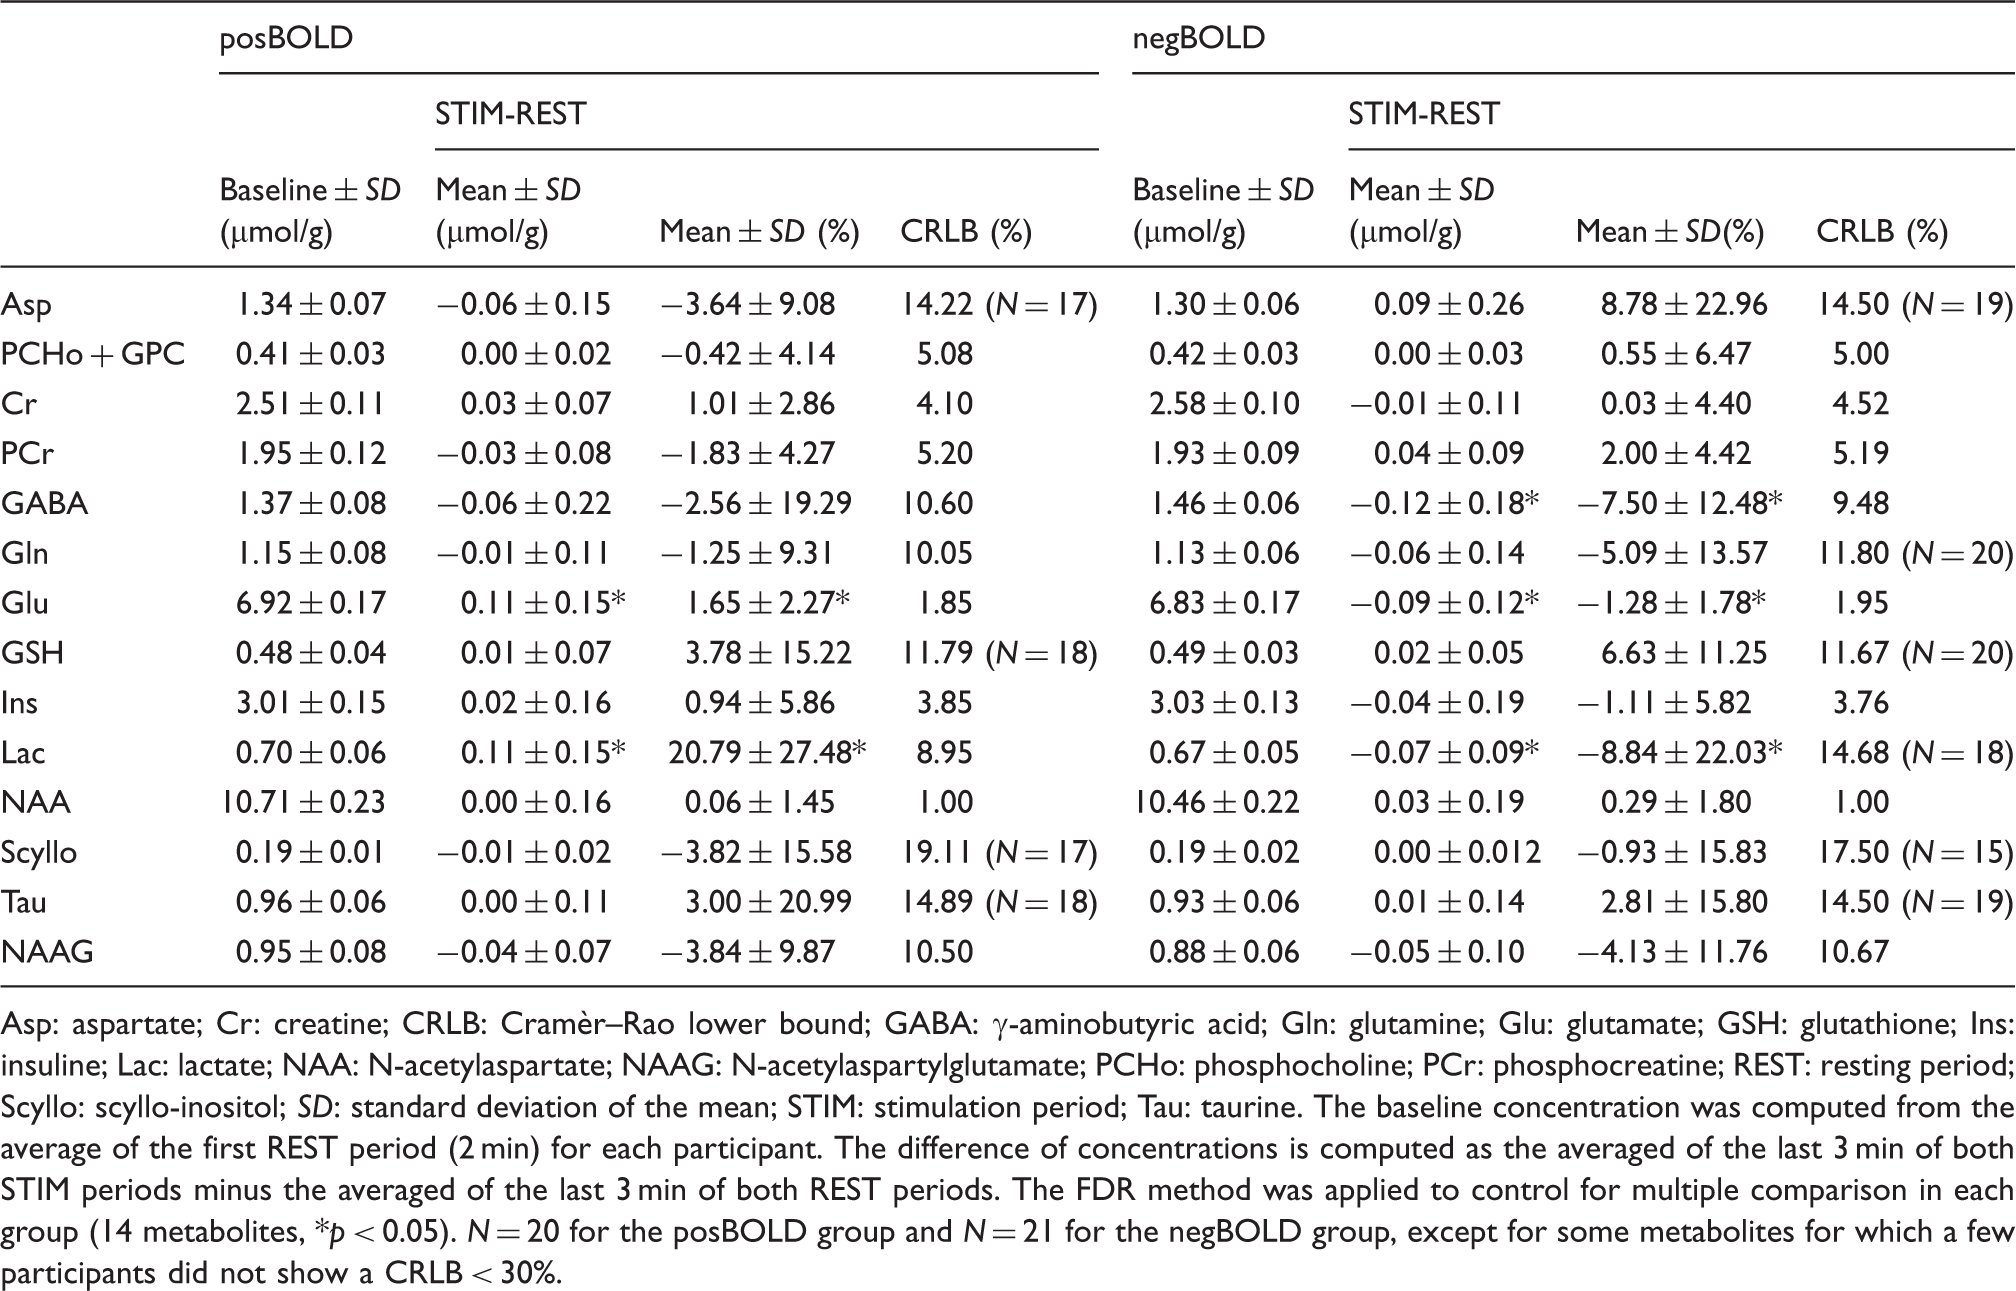
For the posBOLD group, statistically significant (p < 0.05 FDR-adjusted for 14 metabolites) increases of [Glu] (+0.11 µmol/g) and [Lac] (+0.11 µmol/g) where observed in the difference of the last 3 min of the STIM and REST periods (Table 1). None of the other changes reached statistical significance. These changes were apparent after linewidth correction for the BOLD effect in the difference spectra of the REST and STIM pooled spectra (Figure 2(a)). The time courses of [Glu] and [Lac] (Figure 3(a) and (c)) showed increasing concentration during the STIMs. When subtracting the STIM from the REST spectrum in the negBOLD group, differences were noted at the chemical shift of Glu, Lac, and GABA (Figure 2(b)). Upon analysis with LCModel, these changes were considered significant (p < 0.05 FDR-adjusted for 14 metabolites) with decreases for [Glu] (−0.09 µmol/g), [Lac] (−0.07 µmol/g) and [GABA] (−0.12 µmol/g) (Table 1). Both [Glu] and [Lac] appeared to gradually decrease during the stimulus, while [GABA] appeared to reach a plateau (Figure 3(b), (d) and (e)). The ratio of percentage concentration changes for PBR/NBR was over twofold (−2.4 ± 3.3; ratio ± SD) for Lac and smaller (−1.3 ± 2.1; ratio ± SD) for Glu.
Pooled averaged spectra of the last three minutes both STIM and REST periods for the (a) posBOLD and (b) negBOLD groups. STIM* is the linewidth corrected spectra. Only the posBOLD group was corrected for the BOLD effect as the effect was too small in the case of the negBOLD group. The bottom spectra represent the difference of individual spectra corresponding to the statistically significant metabolites. Time courses of the metabolites: (a and b) Glu, (c and d) Lac, and (e) GABA for the posBOLD (left graphs) and the negBOLD (right graphs) groups. The color-shaded areas are the periods of checkerboard stimulation. A moving average window of four-time points was applied to all the time courses. The error bars represent the standard error of the mean across participants. Analysis of the metabolite concentrations and their changes during the checkerboard stimulations for both posBOLD and negBOLD groups. Asp: aspartate; Cr: creatine; CRLB: Cramèr–Rao lower bound; GABA: γ-aminobutyric acid; Gln: glutamine; Glu: glutamate; GSH: glutathione; Ins: insuline; Lac: lactate; NAA: N-acetylaspartate; NAAG: N-acetylaspartylglutamate; PCHo: phosphocholine; PCr: phosphocreatine; REST: resting period; Scyllo: scyllo-inositol; SD: standard deviation of the mean; STIM: stimulation period; Tau: taurine. The baseline concentration was computed from the average of the first REST period (2 min) for each participant. The difference of concentrations is computed as the averaged of the last 3 min of both STIM periods minus the averaged of the last 3 min of both REST periods. The FDR method was applied to control for multiple comparison in each group (14 metabolites, *p < 0.05). N = 20 for the posBOLD group and N = 21 for the negBOLD group, except for some metabolites for which a few participants did not show a CRLB < 30%.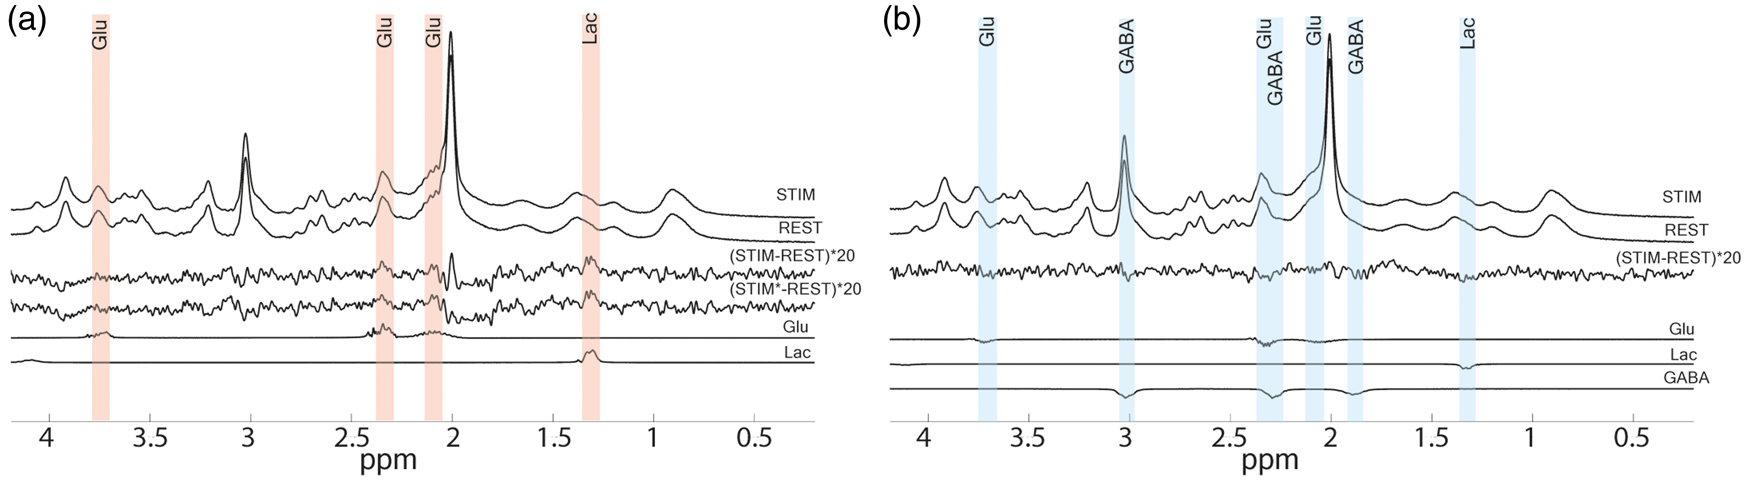
Discussion
The present study reports for the first-time metabolite changes associated with the NBR in the visual cortex. Contrary to the increase of [Glu] and [Lac] observed during the PBR, a decrease of these metabolites was ascribed to the NBR for which a tentative decrease of [GABA] was also found.
Robust PBR and NBRs were observed in the fMRI localizer data at a single-subject level in an extended area around the calcarine sulcus, corresponding to areas V1 and V2, which is consistent with previous reports where the NBR has been consistently shown to be about two to three times smaller than the positive response.6,19–21 The positive BOLD amplitude in the fMRI data was 2.6 ± 1.9 times larger than the negative BOLD amplitude (Figure 1(c)).
Several mechanisms have been proposed to explain the origin of the NBR. Among them, the “blood steal” effect is ascribed to a redirection of the blood to adjacent regions showing an increase of CBF.5,20,38,39 Additionally, voxels overlapping with larger veins near sulcal and ventricular cerebrospinal fluid exhibit volume change without decrease in deoxyhemoglobin concentration resulting in an NBR correlated with the task-positive region. 40 However, several studies have suggested that the NBR is a consequence of neuronal deactivation.6–8,41 It has been showed that an appropriate checkerboard stimulation, similar to the one used in this study, triggers an NBR linked to neuronal deactivation.6,7 The NBR has been found to carry specific information about the position of the object being viewed, 21 suggesting that a neuronal suppression might contribute to an increase in the attention level.2,42,43 Other stimulus parameters such as contrast and duration also define the NBR properties, both within and outside the visual cortex. 29 The question remains whether the neurovascular mechanisms triggering the NBR are simply the inverse of the PBR mechanisms, namely uncoupled decreases in CMRO2, CBF, and CBV. 44 Earlier studies observed a decrease of CMRO2 accompanied by an even larger decrease of CBF for the NBR of the ipsilateral motor cortex 19 and visual cortex. 7 However, when taking into account CBV changes and differences across cortical depths, the results seem to indicate a more complex mechanism. The PBR increases toward the cortical surface when measured with GE-BOLD-fMRI, 45 whereas CBF (measured by ASL) changes reached maximal amplitude in the middle cortical depths, 46 and CBV (measured by vascular space occupancy [VASO]) signal changes did not have a bias toward the surface47,48 and CMRO2 peaked around what would be layer III.47,49 However, Huber et al., 47 using a similar stimulation as was used in the current study, found that the location of the maximal GE-BOLD and CBV (VASO) changes differed between the PBR and NBR conditions. As expected, the PBR was of larger positive amplitude at the surface, but the NBR showed larger negative amplitude in deep layers. Additionally, CBV decreases were much larger in deeper layers during the NBR condition, while for the PBR condition, CBV showed similar increases between the surface and deeper layers. These CBV results in humans contrast with results obtained in macaque V1 where a CBV increase toward the surface in the NBR region, 50 maybe due to differences in the experimental setup and behavior. 47 Nevertheless, taken together, these results suggest differences in neurovascular coupling between the PBR and NBR.
They might also explain the striking amplitude difference between the PBR and NBR, which could be also linked to differences in the excitation–inhibition balance between directly stimulated regions and regions being modulated by the first ones. 6 Additionally, this amplitude difference could be due to a saturation effect coming from the nonlinear relationship between the LFP input and the action potential output, 6 as the BOLD signal has been shown to be mostly correlated to the LFP than to the MUA showing also a dissociation between LFP and MUA. 1
Concerning the BOLD effect evident from the linewidth changes of the NAA peak, only a small to negligible BOLD effect was detected in the negative BOLD spectra. Although the negBOLD VOI was placed in a region containing almost exclusively negative BOLD signal, the change might have been too small to be measured with sufficient precision. Indeed, the linewidth changes are correlated with the BOLD response. 30 We observed an average of −0.18 Hz changes of linewidth for posBOLD (2.3%). The lower negBOLD (−0.9%) changes relative to posBOLD (2.3%), suggests much smaller linewidth change. In addition, small motion or B0-field variations may also contribute to the broadening of the spectral linewidth.
The positive BOLD is accompanied with increases of [Glu] and [Lac] suggesting increases in oxidative and glycolytic metabolism, as consistently observed in previous fMRS studies31,33–35,51,52 (see Figure 4(b) for the assumed metabolic fluxes). The increased Lac has been ascribed as a consequence of the rise in the concentration of pyruvate,
34
itself resulting from increased flux through the glycolytic pathway.
53
Additionally, Lac release has been shown to increase vasodilation and might serve as a signaling molecule to increase CBF.54,55 The increase of [Glu] can be a consequence of an increase of the tricarboxylic acid cycle (TCA) cycle rate through the exchange with α-ketoglutarate pool,31,36 which has been confirmed by
13
C fMRS in rodents showing the coupling between the oxidative metabolism and the rate of the Glu/Gln cycle during neurotransmission.
56
(a) Hypothetic scenario for the energetic costs measured via the BOLD amplitude for the baseline (gray screen), posBOLD, and negBOLD conditions. NegBOLD (I) represents the case when remote excitatory input is reduced triggering an overall decrease in both glutamatergic and GABAergic neuronal activity. NegBOLD (II) represents the case when local inhibition from GABAergic neurons increases resulting in an overall decrease of neuronal activity. (b) Scheme representing the proposed metabolic fluxes and steady-state concentrations between glutamatergic and GABAergic neurons and astrocytes. The red arrows represent the changes during the posBOLD condition and the blue arrows represent the changes in the negBOLD group. The arrows in dark colors correspond to the significant changes measured in the current study and in light colors are other assumed changes.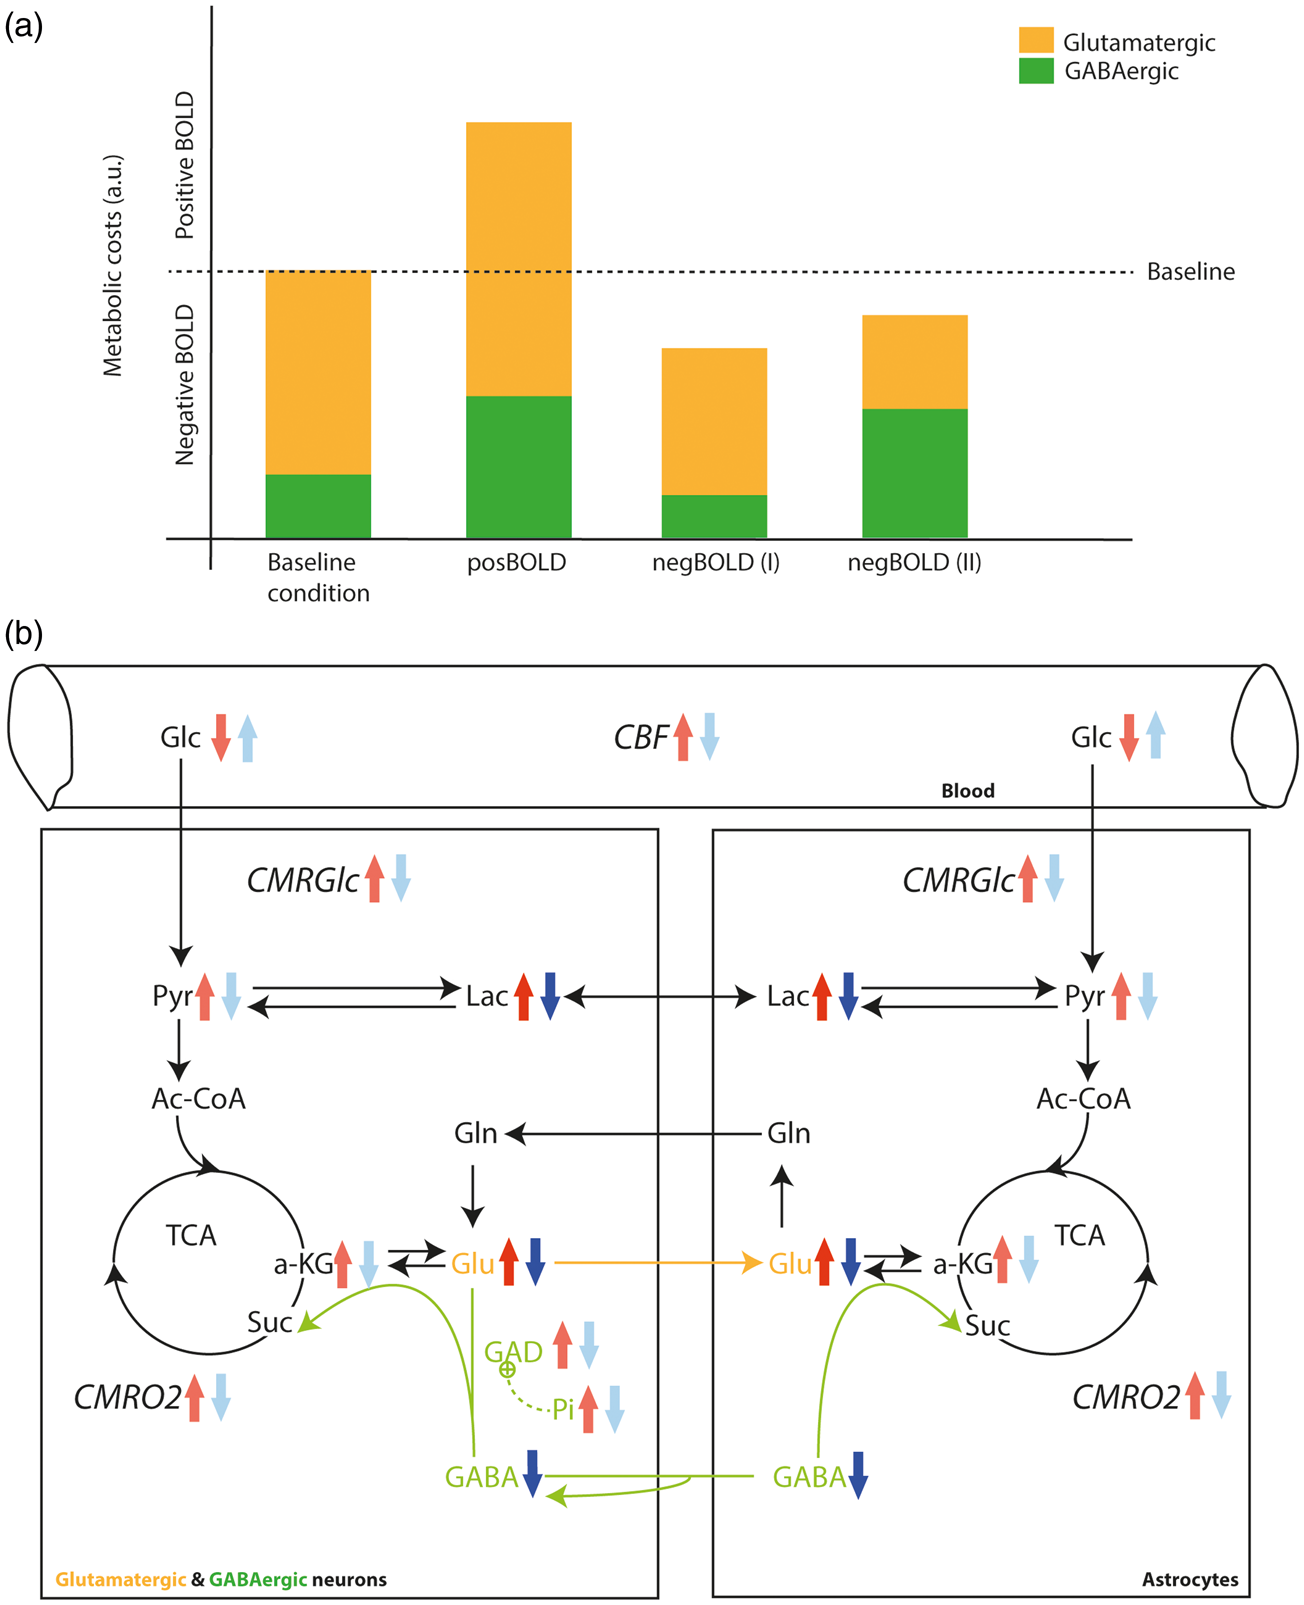
The type of visual stimulation used here is known to increase CMRGlc, 57 which was supported by the decrease of [Glc] observed with fMRS.31,35,51 However, Glc remains a challenging metabolite to quantify even at 7T. 58 Due to the smaller VOI used in the current study relative to previous studies, the sensitivity of the spectra did not allow a consistent quantification of glucose and was thus not considered for further analysis. Significant changes have been also reported for other metabolites during PBR such as glutathione, glycine and aspartate,31,51,52 which were not observed in our study. There might be several explanations for this, such as the size of the spectroscopy voxel.
During the NBR, decreases of [Glu], [Lac], and [GABA] were observed. The [Glu] reduction was, within experimental error, comparable to the increase observed during the PBR and was also observable on the pooled spectra difference. However, the changes were less evident on the negBOLD group time course compared to the PBR one. A similar observation can be made for [Lac], although in this case, the change during the NBR was more than twice smaller compared to the PBR. The amplitude of the [GABA] decrease was about twice higher in the NBR than the nonsignificant decrease observed in the PBR condition. Moreover, [GABA] also showed a decrease on the time course during the STIMs of the negBOLD group. The measured [Glu] changes are consistent with a recent and similar study, 59 which also reported a decrease of [Glc] and an increase of [GSH] during the NBR.
As with the metabolite increased observed during PBR, the decreases in [Glu] and [Lac] during the NBR can be interpreted as a reduction of overall oxidative energy metabolism, suggesting a global decrease of neuronal activity. Studies have observed a decreasing CMRO2 during the NBR.7,19 However, whether the nature of the decrease is due to an increased local inhibitory GABAergic activity (scenario I) or a decrease of remote excitatory inputs from the lateral geniculate nucleus (scenario II) is more difficult to conclude from these results (see Figure 4(a)).
The significant reduction of [GABA] during the NBR might be a collateral effect of the significant Glu pool decrease, as Gln, which show a nonsignificant decrease, is the main precursor of GABA through Glu.60–62 However, decreasing [GABA] was also observed in the motor cortex during a PBR. 63 In the current study, a trend of [GABA] decrease was also found in the posBOLD group, in agreement with Chen et al. Inferring the status of the GABAergic activity from our results is difficult because only a small part of the GABA pool is used for neurotransmission (phasic inhibition), while the remaining pool seems to be located in cell bodies and involved in energy production and tonic inhibition.64–66 These two pools were shown to be regulated by the glutamate decarboxylase enzymes, GAD65 and GAD67, respectively, which are responsible for the GABA synthesis from Glu.67–69 The GAD enzymes are themselves modulated depending on the brain state in a complex manner. For instance, increased neuronal activity activates GAD (e.g., through inorganic phosphates, see Figure 4(b)), which synthesizes more GABA,67–69 probably to compensate for the increased excitatory activity. We might then expect that a decrease in neuronal activity would deactivate GAD, impacting [GABA]. Nevertheless, the complex modulation of GAD makes it difficult to infer on the expected [GABA] solely based on [Glu].
On the other hand, an increase of GABAergic activity requires less energy than glutamatergic activity,18,70 since GABAergic interneurons represent only 15–30% of the total neuronal population 17 and 18% of the neuronal oxidative metabolism as measured by 13 C NMR spectroscopy in the rat cortex. 18
Nonetheless, an increase in GABAergic inhibition can be proposed based on the ratio of the BOLD signal changes and the [Lac] and [Glu] changes between the posBOLD and negBOLD groups: Indeed, the BOLD and [Lac] ratios between the posBOLD and negBOLD groups are similar (2.6 ± 1.9 and 2.4 ± 3.3, respectively), while the ratio of [Glu] change between posBOLD and negBOLD runs was −1.3 ± 2.1. In case of a neuronal deactivation solely due to a reduction of glutamatergic activity (no active inhibition), ratios similar to the one of [Glu] would be expected for both the BOLD signal and [Lac]. Similar ratios would then show that the increase in energy demand for the PBR is of similar amplitude as the decrease in energy demand of the NBR. Our results indicate rather that the decrease in energy demand is not as large as the increase due to the presence of glycolytic metabolisms for which Lac is a marker. This could be explained by the increased energy demand from sustained GABAergic inhibition during the NBR as glycolysis has been shown to be a major provider of adenosine triphosphate (ATP) for neurotransmission compared to mitochondrial ATP. 71 Additionally, glycolysis has been linked to GABAergic activity through the phosphorylation of GABA receptor. 72
Whether the [Glu], [Lac], and [GABA] decreases during the NBR make scenario I or II more plausible is difficult to conclude. As mentioned above, both scenarios can show reduced metabolic costs as translated by [Glu] and [Lac] reductions. For GABA, lower neuronal activity seems to impair GABA synthesis. However, active inhibition is still possible at lower [GABA] as direct reuptake of GABA by neurons might occur18,73 and the synthesis of new GABA might still be enough to sustain inhibition. Importantly, it is possible and very likely that both scenarios occur simultaneously where the reduction of remote excitatory inputs is accompanied by local GABAergic inhibition.
Although increased GABAergic activity during the NBR in the visual cortex is plausible, this cannot be generalized to other brain regions. For example, triggering a GABAergic activity on top of a glutamatergic activity causes an increase of CBF even larger than the glutamatergic activity alone in the cerebellum.74–76 Furthermore, other NBRs, such as the one observed in the primary motor cortex 19 might show different metabolite concentration changes. Overall, our study is consistent with a neuronal origin of the NBR in such conditions and supports the hypothesis that the NBR mechanisms are not simply the inverse of the PBR mechanisms.
Regarding the limitations of the current study: First, this data do not provide a spatial distribution of the metabolite and BOLD levels. At rest, the brain shows different metabolic states, especially in the anterior–posterior direction,77,78 which could affect the relative BOLD signal measured.79,80 Additionally, we cannot conclude on the spread of the metabolite concentration changes comparing to the spread of the BOLD response. Regarding the respective spreads of the metabolites and BOLD responses, previous studies using visual stimulation found a good agreement between CMRGlu and BOLD changes81,82 and a previous fMRS study from our group using a control 1H-MRS-VOI adjacent to the significant PBR did not observe any changes in both [Glu] and [Lac]. 35
The quantification is not equally sensitive for all metabolites. Although the errors are smaller at 7T than at lower fields due to its higher SNR and chemical shift dispersion, less concentrated metabolites such as GABA and Asp measured with lower SNR were shown to significantly deviate from values quantified with high SNR when expressed in relative terms (%). 58 Therefore, concentration changes expressed in percent for these metabolites during BOLD signal changes are likely to suffer from the same sensitivity to SNR. However, we made sure that the SNRs between the STIM and REST periods were matched, removing any bias due to SNR differences. In addition, the VOI could potentially contain veins with different metabolite concentrations than the tissue. However, except Glc, most of the brain metabolites are present in very low concentrations in the blood compared to other brain tissues.83–86 In the case of Lac, the concentrations between the brain and the blood compartments are considered to be near-equilibrium under normal conditions.87,88 Therefore, metabolite quantification should not be significantly biased by the presence of venous vessels, which constitute a small percentage of brain volume.89,90 Only the linewidth change due to the venous T2* effect, which is taken into account in the present study, can significantly impact the spectra. Finally, as discussed above, the neurovascular coupling related to the PBR and NBR seems to differ across cortical layers, which might be reflected in metabolite concentration changes. However, these layer-specific changes cannot be captured due to the size of the 1H-MRS VOI.
Conclusions
We conclude from the concurrent metabolic changes that the NBR is due to an alteration in metabolism likely related to a decrease of glutamatergic activity with a concurrent increase in inhibitory activity.
Footnotes
Acknowledgement
We thank Dr. João Jorge for providing the script used to segment the veins.
Authors’ contributions
YB, LX, WZ, and RG designed the study. YB acquired and processed the data with support from LX. YB, LX, WZ, and RG interpreted the data. YB, LX, and WZ wrote the manuscript. RG revised the manuscript.
Funding
The author(s) disclosed receipt of the following financial support for the research, authorship, and/or publication of this article: This work was supported by the Centre d'Imagerie BioMédicale (CIBM) of the UNIL, UNIGE, HUG, CHUV, and EPFL and the Leenaards and Jeantet Foundations and the Swiss National Science Foundation Grant 31003A_149983.
Declaration of conflicting interests
The author(s) declared no potential conflicts of interest with respect to the research, authorship, and/or publication of this article.