
Abstract
Dynamic metabolic changes were investigated by functional magnetic resonance spectroscopy (fMRS) during sustained stimulation of human primary visual cortex. Two established paradigms, consisting of either a full-field or a small-circle flickering checkerboard, were employed to generate wide-spread areas of positive or negative blood oxygenation level-dependent (BOLD) responses, respectively. Compared to baseline, the glutamate concentration increased by 5.3% (p = 0.007) during activation and decreased by −3.8% (p = 0.017) during deactivation. These changes were positively correlated with the amplitude of the BOLD response (R = 0.60, p = 0.002) and probably reflect changes of tricarboxylic acid cycle activity. During deactivation, the glucose concentration decreased by −7.9% (p = 0.025) presumably suggesting increased consumption or reduced glucose supply. Other findings included an increased concentration of glutathione (4.2%, p = 0.023) during deactivation and a negative correlation of glutathione and BOLD signal changes (R = −0.49, p = 0.012) as well as positive correlations of aspartate (R = 0.44, p = 0.035) and N-acetylaspartylglutamate (R = 0.42, p = 0.035) baseline concentrations with the BOLD response. It remains to be shown in future work if the observed effects on glutamate and glucose levels deviate from the assumption of a direct link between glucose utilization and regulation of blood flow or support previous suggestions that the hemodynamic response is mainly driven by feedforward release of vasoactive messengers.
Keywords
Introduction
Blood oxygenation level-dependent (BOLD) functional magnetic resonance imaging (fMRI) is the most widely used method for studying human brain activity. 1 In the presence of a suitable stimulation paradigm, a positive BOLD response (also referred to as ‘activation’) is observed, defined as an increase of the BOLD signal over a baseline level. Correspondingly, the opposite direction of signal change is referred to as a negative BOLD response (or ‘deactivation’), that is, a decrease of the BOLD signal from a baseline level due to a stimulus or task. Deactivations have been observed both in animals and humans, 2 in regions adjacent to activations during stimulation of motor,3,4 somatosensory5,6 or visual areas.7–10 Although initially hypothesized to just represent a mechanism of blood stealing in favor of regions of activation,11,12 later publications showed correlations of the negative BOLD response with neuronal activity, 13 however, with a different neurovascular coupling than the positive response.2,14
While BOLD-fMRI, due to its relatively high sensitivity, is the method of choice for the vast majority of functional experiments in humans, it does not provide quantitative information on neuronal activation. When alterations of the neurovascular coupling are suspected, for instance, in comparisons of regions with different baseline physiology 15 or in investigations of neuronal inhibition, 14 alternative non-invasive non-BOLD contrasts are required for a consistent interpretation of fMRI data or their modeling. 16 Experiments yielding well-defined physiological parameters like cerebral blood flow (CBF) and volume (CBV) or metabolic measures, such as the cerebral metabolic rate of oxygen (CMRO2) are, therefore, receiving increasing attention.
Magnetic resonance spectroscopy (MRS) is sensitive to metabolic aspects of neuronal activation and provides another complementary tool for investigating the human brain at work. Several functional MRS (fMRS) studies have been performed to characterize the relationship between neuronal activation and brain energetics or neurotransmitter cycling by tracking concentration changes of metabolites that can be detected in the proton (1H) spectrum. Early studies demonstrated changes in the lactate (Lac) concentration ([Lac]) in primary visual cortex (V1) at field strengths between 1.5 and 2 T.17–19 A more detailed metabolic picture has been obtained from experiments performed at 7 T. Mangia et al. 20 investigated concentration changes during prolonged periods of visual stimulation and reported increased [Lac] and glutamate ([Glu]) by 23 and 3%, respectively, and decreased aspartate ([Asp]) by 15%. Consistently, Lin et al. 21 found increased levels of [Lac], [Glu] and glutathione ([GSH]) in V1 between 2% and 11%, and decreased [Asp], glutamine ([Gln]) and glycine ([Gly]). Similar elevations of [Glu] and [Lac] were also observed during motor cortex stimulation, 22 whereas a 5% decrease in the concentration of γ-aminobutyric acid ([GABA]) along with a 7% increase in [Lac] were the only significant changes obtained by Mekle et al. 23 in response to varying visual stimulation.
In another line of work, Bednařík et al. 24 demonstrated a positive correlation of the BOLD-fMRI signal with [Glu] and [Lac] changes in human V1 at 7 T. However, a similar correlation could not be established in a repetition suppression study at 3 T. 25 More recently, a combined fMRI/fMRS sequence was employed to acquire BOLD and metabolic responses during the same repetition time (TR), corroborating the correlation of BOLD and Glu signal changes in V1. 26
To our knowledge, all previous fMRS studies have focused on neurochemical mechanisms accompanying activation. Because stimulus-induced BOLD increases and decreases reflect different hemodynamic mechanisms, it is conceivable that areas with positive and negative BOLD responses may show distinct metabolic signatures in fMRS experiments. In particular, we hypothesized to observe opposite directions of the [Glu] response in view of previous fMRI work linking the negative BOLD response to decreased neuronal activity and/or inhibition. The human visual cortex was targeted in our investigation because it can be readily stimulated to evoke positive or negative BOLD signals by well-established paradigms.
Methods
Subjects
Due to relatively long acquisition protocols, investigations of activation and deactivation were performed in separate sessions. In total, 18 healthy volunteers (eight women, age range 18–33 years) were included in the study; 14 of them (5 women, age range 22–33 years) participated in experiments generating a positive BOLD response, and 12 (6 women, age range 18–31 years) in experiments generating a negative BOLD response. Eight of the 18 subjects (3 women, age range 22–31 years) participated in both sessions, that is, they were included both in the activation and the deactivation cohort. All participants had given informed written consent prior to the experiments, which had been approved by the Ethics Committee of the University of Leipzig and were performed in accordance with the Declaration of Helsinki.
Visual stimulation
The stimuli had been extensively tested in previous fMRI studies of the neurovascular coupling in human brain.
2
They consisted of a full-field radial 25.5% grey/black flickering checkerboard (8 Hz) to evoke a positive BOLD response and a centered small-circle flickering checkerboard (8 Hz) for a negative BOLD response (Figure 1(a) and (c)). Results from electrophysiology experiments in macaques indicate that such types of stimuli induce predominantly excitatory activity in areas of activation whereas the net neuronal responses are inhibitory in areas of deactivation.
13
An advantage achieved by using the full-field checkerboard is the possibility to investigate the same cortical region during different paradigms. Both checkerboards included a centered fixation point that was randomly changing color (red – blue – purple – green – yellow) to track the volunteer’s attention via pressing a response button. During rest periods, a gray background with a centered fixation cross was presented.
Visual stimulation paradigms and their corresponding BOLD-fMRI activation maps acquired in a healthy human subject. Voxels with significant activation are indicated in red and voxels with significant deactivation are indicated in blue. A full-field flickering checkerboard (a) produces a positive BOLD response in V1 (b), whereas a centered small-circle flickering checkerboard (c) produces a negative BOLD response in V1 surrounded by additional areas with a positive BOLD response (d). Boxes (b, d) indicate the position and size (8 ml) of the voxel selected for proton spectroscopy.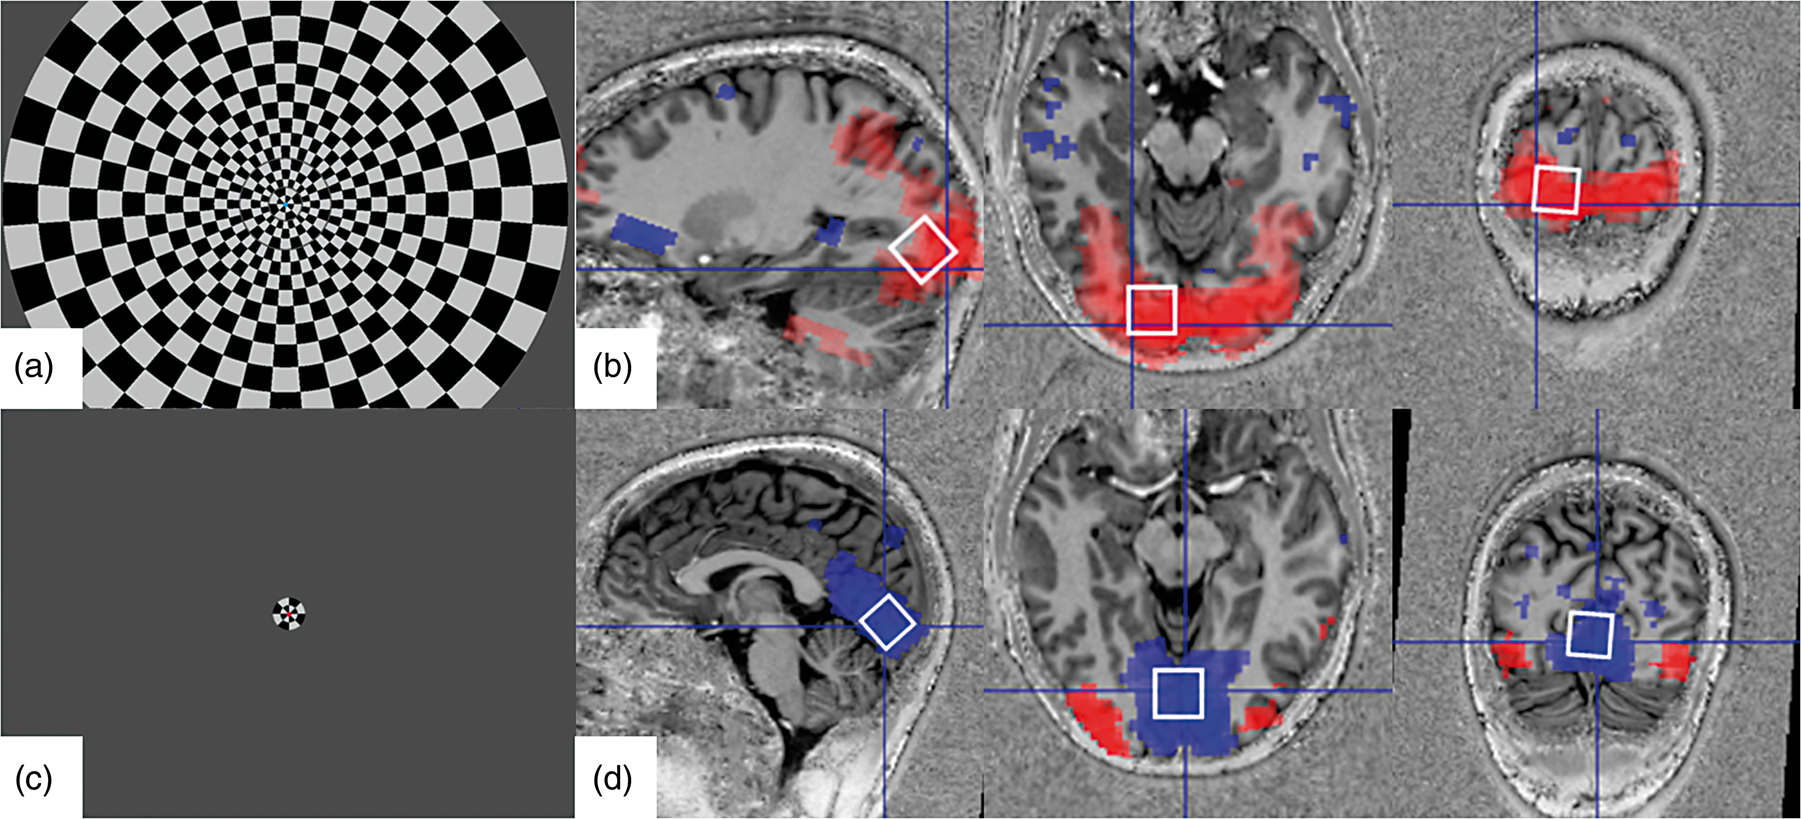
Magnetic resonance acquisitions
All investigations were performed on a MAGNETOM 7 T scanner (Siemens Healthcare, Erlangen, Germany) equipped with a single-channel transmit/32-channel receive radiofrequency (RF) head coil (Nova Medical, Wilmington, MA, USA). By executing a landmark-based pre-scan gradient-recalled echo (GRE) sequence (‘Auto-Align Head’), geometric information was acquired that was automatically applied to all subsequent protocols. An anatomical reference was obtained with a three-dimensional (3D) ‘Magnetization-Prepared 2 RApid Gradient Echoes’ (MP2RAGE) sequence and ‘GeneRalized Autocalibrating Partially Parallel Acquisitions’ (GRAPPA) along the first phase-encoding direction (acceleration factor 3). Acquisition parameters included TR = 5 s; flip angles, α = 4 and 5°; inversion times, TI = 0.8 and 2.7 s; echo time, TE = 3.33 ms; field of view (FOV) of 256 × 256 × 176 mm3; nominal resolution 1 × 1 × 0.85 mm3 (acquisition time, TA = 6:42 min). Finally, a block design with alternation of 30 s of rest and 30 s of stimulus presentation was performed during two-dimensional (2D) single-shot GRE echo-planar imaging (EPI; α = 70°; TE = 20 ms; TR = 2 s; GRAPPA acceleration factor 2; 150 repetitions; TA = 5:08 min) used as a functional localizer (30 slices aligned along the calcarine sulcus; thickness 4 mm; no gap; FOV 192 × 192 mm2; nominal resolution 3 × 3 × 4 mm3). BOLD activation maps were obtained with a standard SPM12 (http://www.fil.ion.ucl.ac.uk/spm) processing scheme.
Localization of a single 8 ml voxel for fMRS was performed by co-registration of the thresholded BOLD activation/deactivation map to the MP2RAGE volume (Figure 1(b) and (d)). A ‘semi-adiabatic Localization by Adiabatic SElective Refocusing’ (semi-LASER) sequence27,28 (TE = 40 ms; TR = 4 s) was used for 1H spectroscopy after adjusting first- and second-order voxel shims with ‘Fast Automatic Shimming Technique by Mapping Along Projections’ (FAST(est)MAP).29,30 Two blocks of alternating 5:20 min rest versus 5:20 min stimulation were used as paradigm for fMRS (320 repetitions). To perform water scaling for absolute metabolite quantification, further acquisitions were performed without water suppression (16 repetitions).
One volunteer from the deactivation cohort did not properly respond to the fixation-point color change during the fMRS acquisition and was discarded from the analysis.
MRS data processing and metabolite quantitation
Non-averaged, time-domain raw data (Siemens twix format) were exported after acquisition and post-processed with single precision using MATLAB (ver. 9.3 R2017b; MathWorks, Natick, MA, USA) routines unless otherwise stated. Each free induction decay (FID; i.e. the descending portion of the spin echo) consisted of a 3D array of complex-valued time points (nt = 4128) × receive channels (


Water-suppressed single-scan acquisitions were averaged over 16 consecutive repetitions yielding 20 spectra per subject, that is, 5 spectra acquired during each of the alternating conditions rest and sustained stimulus presentation, subsequently labeled as ‘REST1’, ‘STIM1’, ‘REST2’, and ‘STIM2’. Considering the number of included subjects, we obtained a total of 280 spectra acquired during activation runs and 220 spectra acquired during deactivation runs.
Metabolite quantification was performed with LCModel. 34 As some spectra exhibited artifacts around 5 ppm (presumably ‘outer volume ghosts’ due to insufficient spoiling), fitting was restricted to a chemical shift range between 0.2 and 4.0 ppm. The unsuppressed water signal served as an internal concentration reference assuming a brain water content of 78%. 35 An LCModel basis set was generated from acquired spectra of 13 metabolites including alanine (Ala), Asp, creatine (Cr), phosphocreatine (PCr), GABA, glucose (Glc), Gln, Glu, GSH, Lac, myo-inositol (mI), NAA and taurine (Tau), in addition to simulated spectra of phosphocholine (PCh), glycerophosphocholine (GPC), N-acetylaspartylglutamate (NAAG), scyllo-inositol (Scyllo) and Gly. Details of the procedures to generate the basis set are given in the LCModel User’s Manual (http://s-provencher.com/lcm-manual.shtml). Simulations were performed with the Simulation Toolbox of the FID-A software package (https://github.com/CIC-methods/FID-A).
As (de)activation-related metabolic changes were expected to be rather subtle according to previous fMRS studies, a step-wise procedure was adapted to identify fits of sufficient quality for inclusion in the final analysis36,37: (i) spectra with a full width at half maximum (FWHM; as reported by LCModel) exceeding 16 Hz were completely rejected (i.e. no concentration estimate for any metabolite was included in further analyses). (ii) A concentration estimate of an individual metabolite in a single spectrum was only included if its Cramér-Rao lower bound (CRLB; as reported by LCModel) was below 40%. (iii) If criteria 1 and 2 were not fulfilled for a particular metabolite in at least 50% of all analyzed spectra then this metabolite was excluded from further analysis for this type of experiment (i.e. activation or deactivation).
Investigations of stimulus-related metabolic changes included the following comparisons of concentration estimates: (i) all spectra measured during REST1 (n = 5 per subject and condition) versus all spectra measured during STIM1 (n = 5); (ii) all spectra measured during REST2 (n = 5) versus all spectra measured during STIM2 (n = 5); and (iii) all spectra measured during the combined periods REST1 + REST2 (n = 10) versus all spectra measured during the combined periods STIM1 + STIM2 (n = 10). To test our main hypothesis, stimulus-induced [Glu] alterations were assessed by paired-sample t-tests separately for the activation and deactivation experiments with a significance level set to p = 0.05. Additional explorative analyses were performed for the other metabolites (paired-sample t-tests; p = 0.05, uncorrected). While similar strategies have been employed in previous fMRS studies,20–22,25 we note that uncorrected p-values enhance the likelihood of false positive results arising from multiple comparisons (here, 10 metabolites).
In addition, the mean stimulus-related percent BOLD-signal change during the functional localizer was calculated with SPM12 in a volume that was adjusted in size to the spectroscopy voxel for each volunteer and (linearly) correlated with metabolic results from the fMRS experiments. These correlation analyses included (i) baseline metabolite levels recorded during REST1 as well as (ii) averaged metabolite concentration changes during STIM1+STIM2 in comparison to REST1+REST2.
Results
Figure 2 shows the typical LCModel fits from acquisitions in activated and deactivated regions. The mean FWHM was 10.6 ± 2.2 Hz (i.e. 0.036 ± 0.007 ppm). Compared to the linewidth, the difference in chemical shifts of the methylene groups of Cr and PCr (0.017 ppm) was regarded insufficient for a reliable quantification of both metabolites,
36
and only the sum of their concentration estimates (total creatine, tCr) was included in the further analysis. Along the same line of reasoning, only the sum of the [GPC] and [PCh] estimates (total choline concentration, [tCh]) was considered reliable. Further metabolites that were fitted with sufficient accuracy included Asp, Glc, Gln, Glu, GSH, mI (which also includes an unspecified contribution from Gly), NAA, and NAAG. A summary of the obtained concentration estimates for the different conditions is provided in Figure 3.
Representative proton spectra (LCModel results) acquired with semi-LASER (TE 40 ms, TR 4 s, 16 averages) in V1 during stimulation by a full-field flickering checkerboard to produce a positive BOLD response (a) and during stimulation by a small-circle flickering checkerboard (b) to produce a negative BOLD response. The upper panels show fitting results (thick red curve) of the original spectra (thin black curve) as well as residuals (plotted at the top) and contribution of the baseline (plotted at the bottom). The lower panels indicate contributions of individual model spectra for metabolites considered in the statistical analysis including the sum of Cr and PCr (total creatine, tCr), the sum of mI and Gly, the sum of GPC and PCh (total choline, tCh), NAAG, NAA, GSH, Glu, Gln, Glc, and Asp. Mean metabolite concentrations in ‘institutional units’ (i.u.) averaged across subjects obtained in regions of a positive BOLD response upon stimulation by a full-field flickering checkerboard (a) and in regions of a negative BOLD response upon stimulation by a small-circle flickering checkerboard (b). Black bars correspond to the REST1 and REST2 periods and colored bars correspond to STIM1 and STIM2 periods. Error bars indicate one standard deviation of the mean values. Significant changes (STIM1+STIM2 vs. REST1+REST2; p < 0.05, uncorrected) are indicated by asterisks. Based on the predefined quality-control criteria, percentages of rejected concentration estimates were 18.6% for Asp, 58.6% for Glc (not considered in the statistical analysis), 40.7% for Gln, 2.5% for Glu, 17.9% for GSH, 2.5% for NAA, 3.6% for NAAG, 2.5% for tCh, 2.5% for mI + Gly, and 2.5% for tCr for acquisitions during activation runs (total of 280 spectra) as well as 11.4% for Asp, 37.7% for Glc, 13.1% for Gln, 0% for Glu, 6.4% for GSH, 0% for NAA, 3.6% for NAAG, 0% for tCh, 0% for mI + Gly, and 0% for tCr for acquisitions during deactivation runs (total of 220 spectra). The LCModel basis components further included Ala, GABA, Lac, Tau, and Scyllo (not considered in the statistical analysis because of rejected concentration estimates between 56.4% and 100%).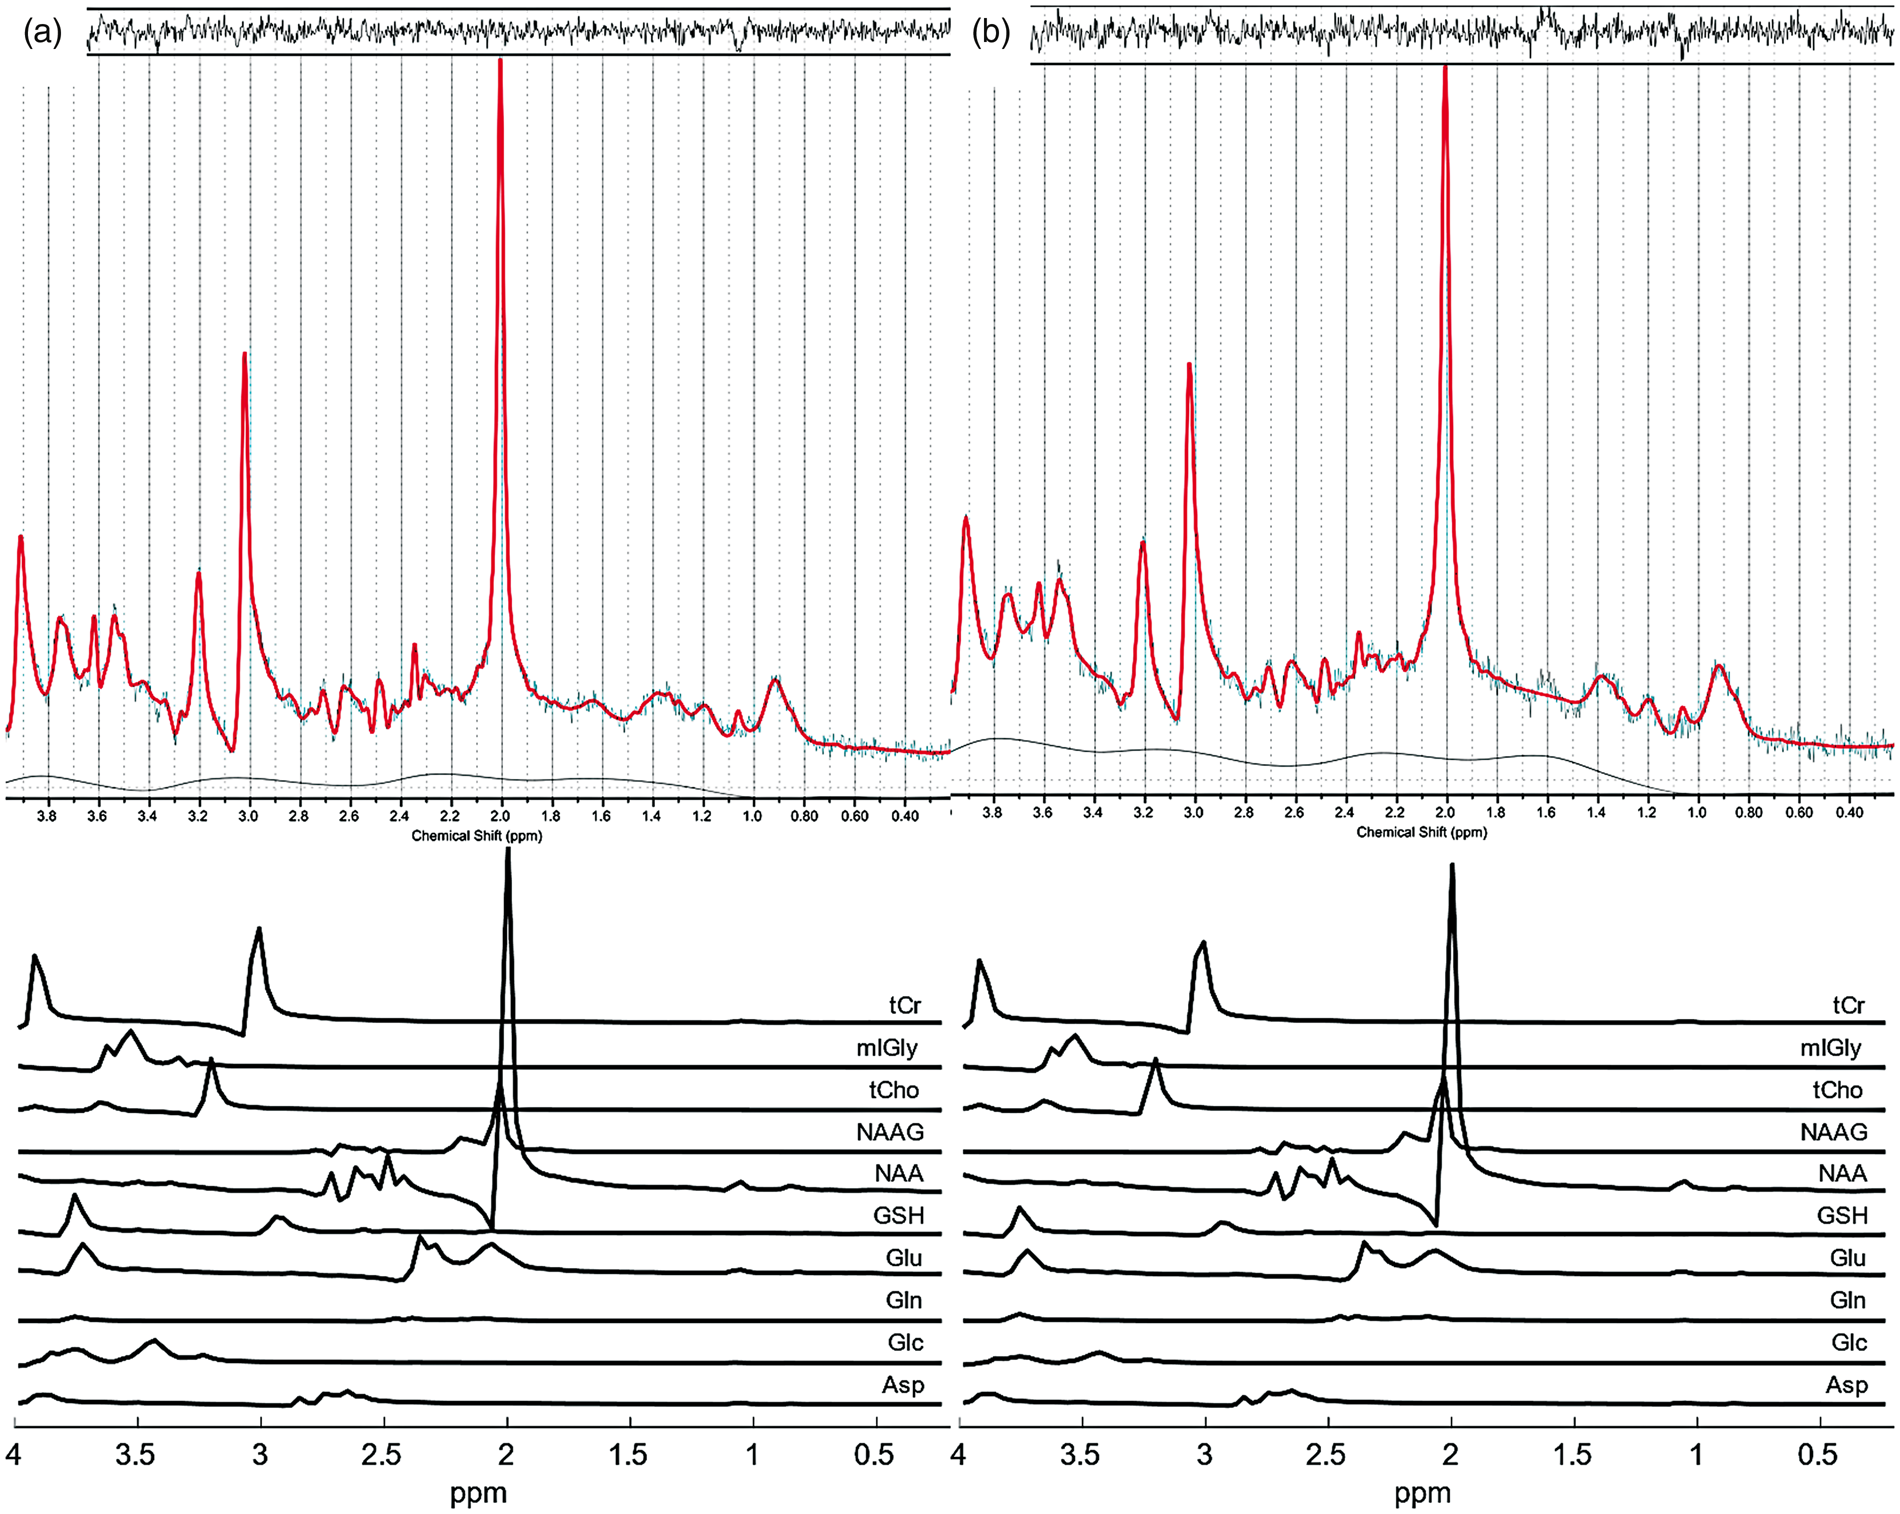
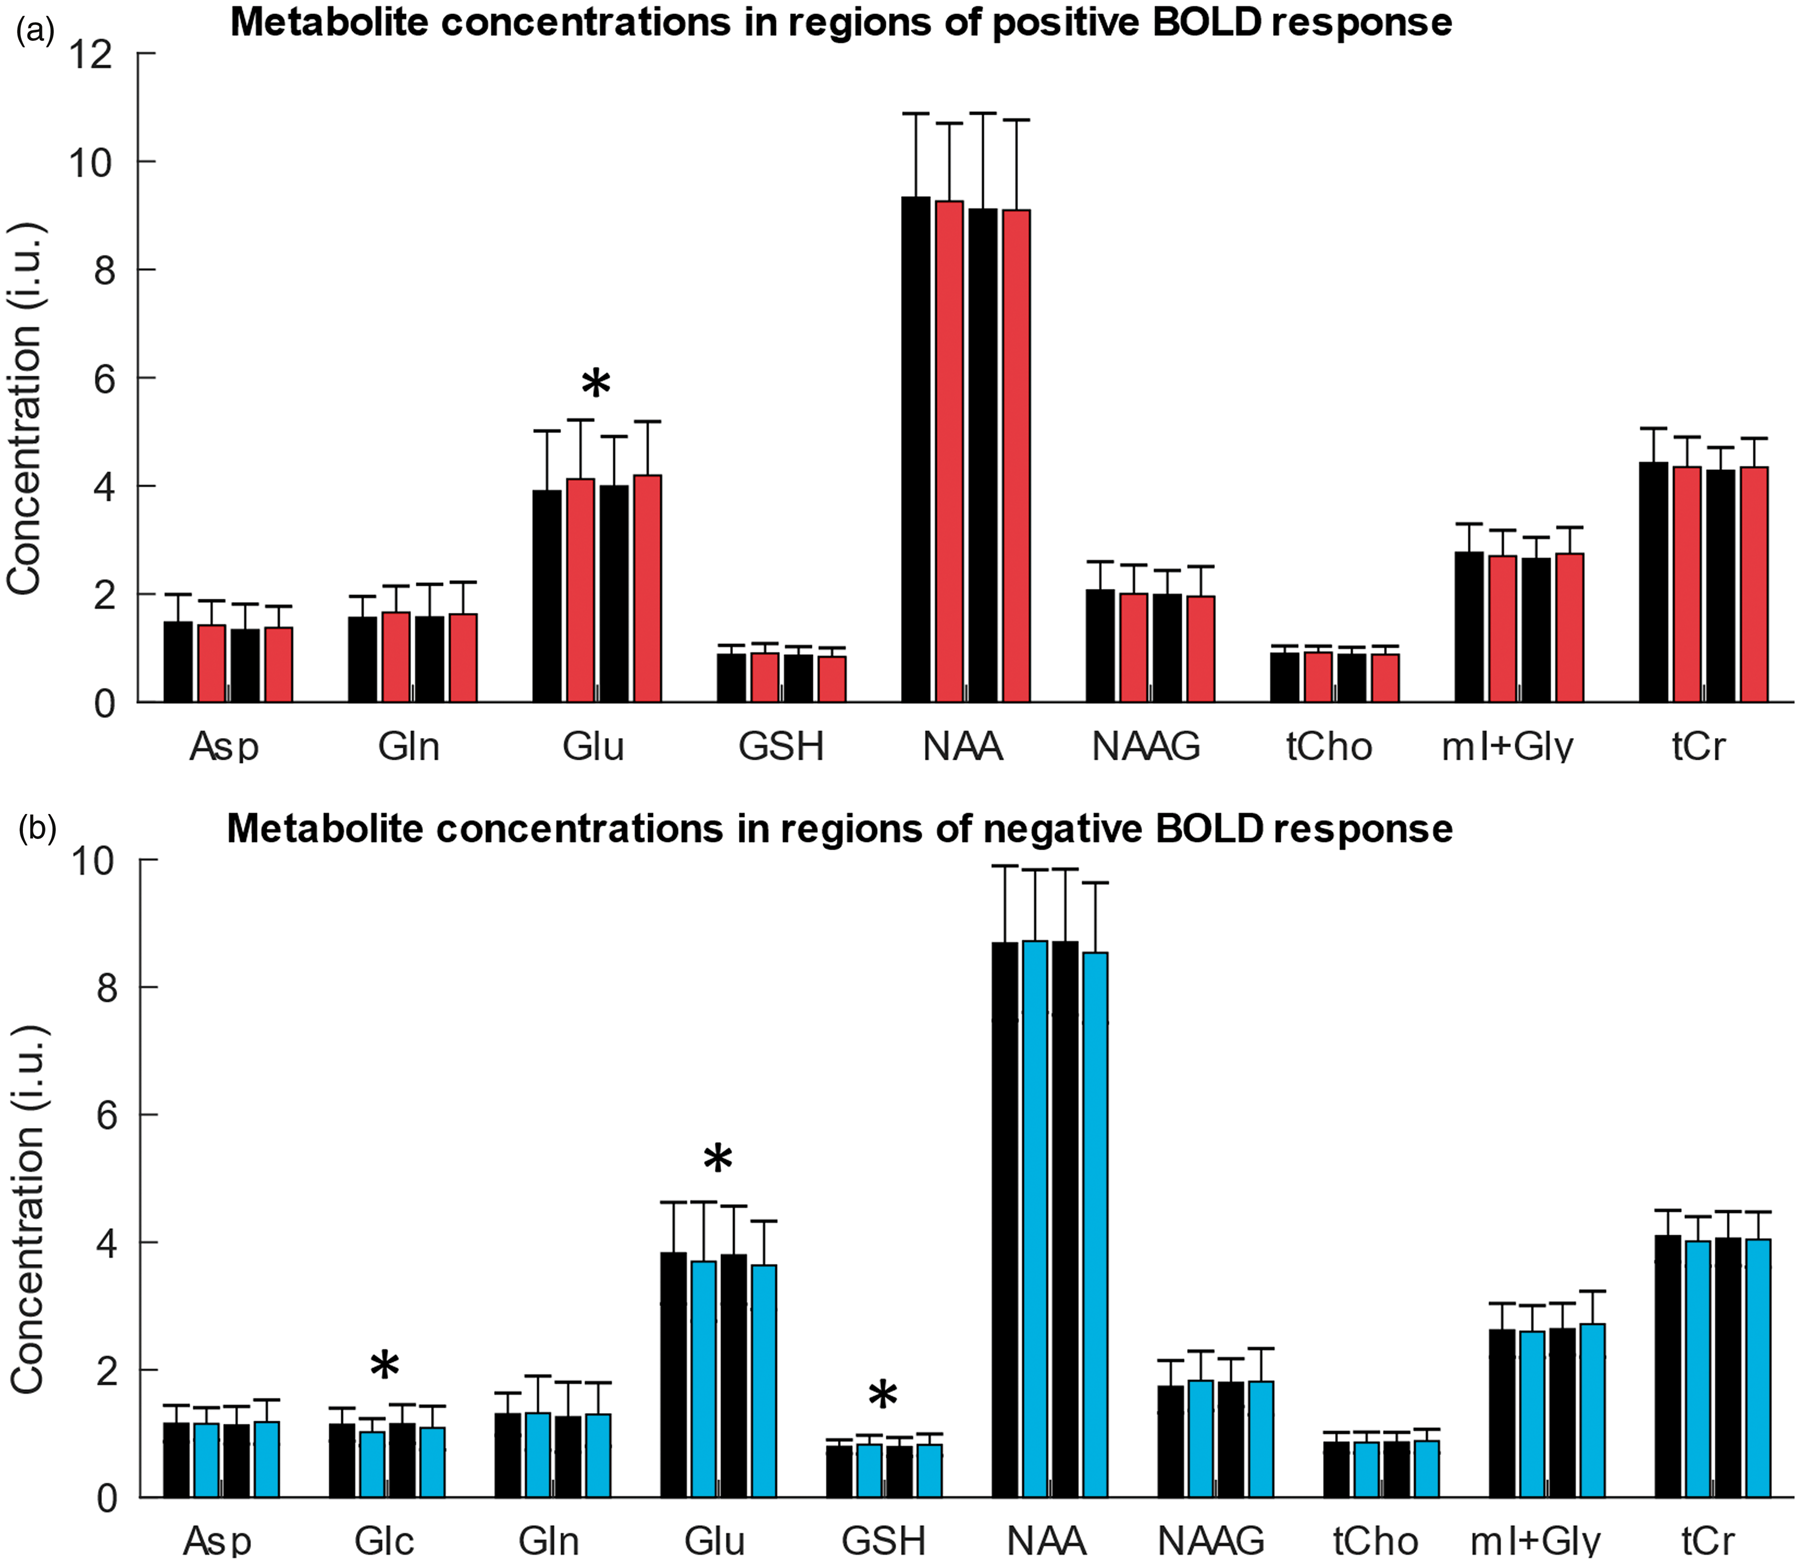
A statistical evaluation of our main hypothesis revealed a significant increase of the average [Glu] by 5.3% (p = 0.007) during full-field stimulation (activation) as compared to the average concentration at baseline (Figure 4(a)). The mean increase was larger for the first than for the second stimulation period (5.7% for STIM1 vs. REST1, p = 0.042 and 5.0% for STIM2 vs. REST2, p = 0.078); however, this difference was insignificant. The opposite direction of [Glu] changes at a reduced effect size was obtained with the deactivation experiment (Figure 4(b)) yielding a significant average decrease (–3.8%, p = 0.017) during stimulation with regard to baseline. Here, the magnitude of the change was smaller during the first (–3.5% for STIM1 vs. REST1, p = 0.16) as compared to the second stimulation period (–4.2% for STIM2 vs. REST2, p = 0.045).
Individual Glu concentration changes (institutional units, i.u.) in regions of a positive BOLD response to stimulation by a full-field flickering checkerboard in 14 healthy subjects (a) and in regions of a negative BOLD response to stimulation by a small-circle flickering checkerboard in 11 healthy subjects (b). Line connects the individual mean values of all spectra acquired in an individual subject during REST1+REST2 and the individual mean values of all spectra acquired in the same subject during STIM1+STIM2. Paired t-tests yielded significant changes of 5.3% (p = 0.007) during the positive and of–3.8% (p = 0.017) during the negative BOLD response.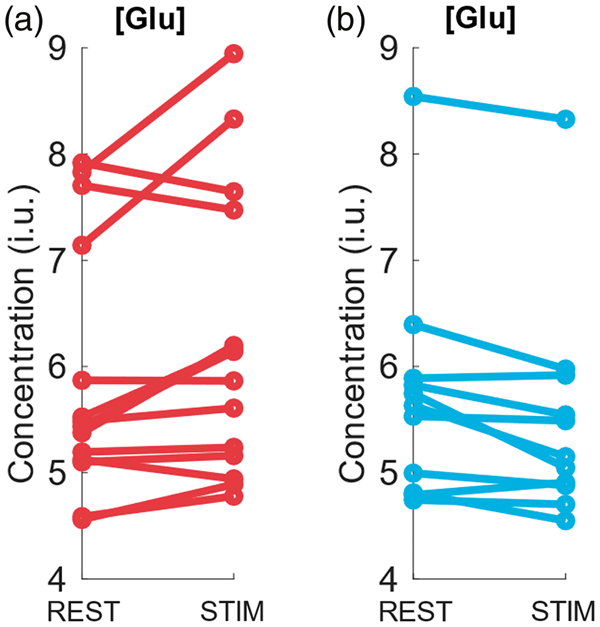
The exploratory analysis of the other metabolite concentrations yielded decreased [Glc] (–7.9%, p = 0.025) as well as increased [GSH] (+4.2%, p = 0.023) in the deactivation experiments. We note that the number of rejected estimates for [Glc] according to our quality-control criteria was too high (58.6%) for a meaningful evaluation of changes during the activation experiments. Changes of [GSH] associated with activation were insignificant (p = 0.95).
Use of quality filters based on CRLB percentage values to identify fitting results of insufficient reliability, which has been the standard in previous fMRS studies,20–22,24,38 has been recently discouraged because of its potential to introduce bias. 39 To rule out that such bias might have affected the statistical results, further analyses were performed, verifying that the CRLB values did not significantly change between the conditions.
Figure 5 summarizes the results from correlation analyses of BOLD signal changes and metabolic parameters. The increases and decreases of [Glu] correlated positively (R = 0.60, p = 0.002) with the percent BOLD signal changes from the combined data of the activation and deactivation experiments (Figure 5(a)), whereas a negative correlation (R = −0.49, p = 0.012) was obtained for [GSH] changes (Figure 5(b)). Additional significant positive correlations of percent BOLD signal changes were found for the baseline concentrations of Asp (R = 0.44, p = 0.035; Figure 5(c)) and NAAG (R = 0.42, p = 0.035; Figure 5(d)).
Results from linear correlation analyses (R: Pearson correlation coefficient; p: error probability) of the percent BOLD signal change, ΔBOLD and metabolic parameters (a) percent Glu concentration change, Δ[Glu], (b) percent GSH concentration change, Δ[GSH], (c) baseline Asp concentration, [Asp]0, (in institutional units, i.u.) and (d) baseline NAAG concentration, [NAAG]0, (in i.u.). Each circle corresponds to the result from a single subject. Red empty circles and blue-filled circles indicate stimulation experiments producing a positive and a negative BOLD response, respectively. Percent metabolite concentration changes are averaged values (in individual subjects) comparing STIM1+STIM2 and REST1+REST2. The baseline metabolite concentrations refer to averaged results (in individual subjects) measured during REST1 only.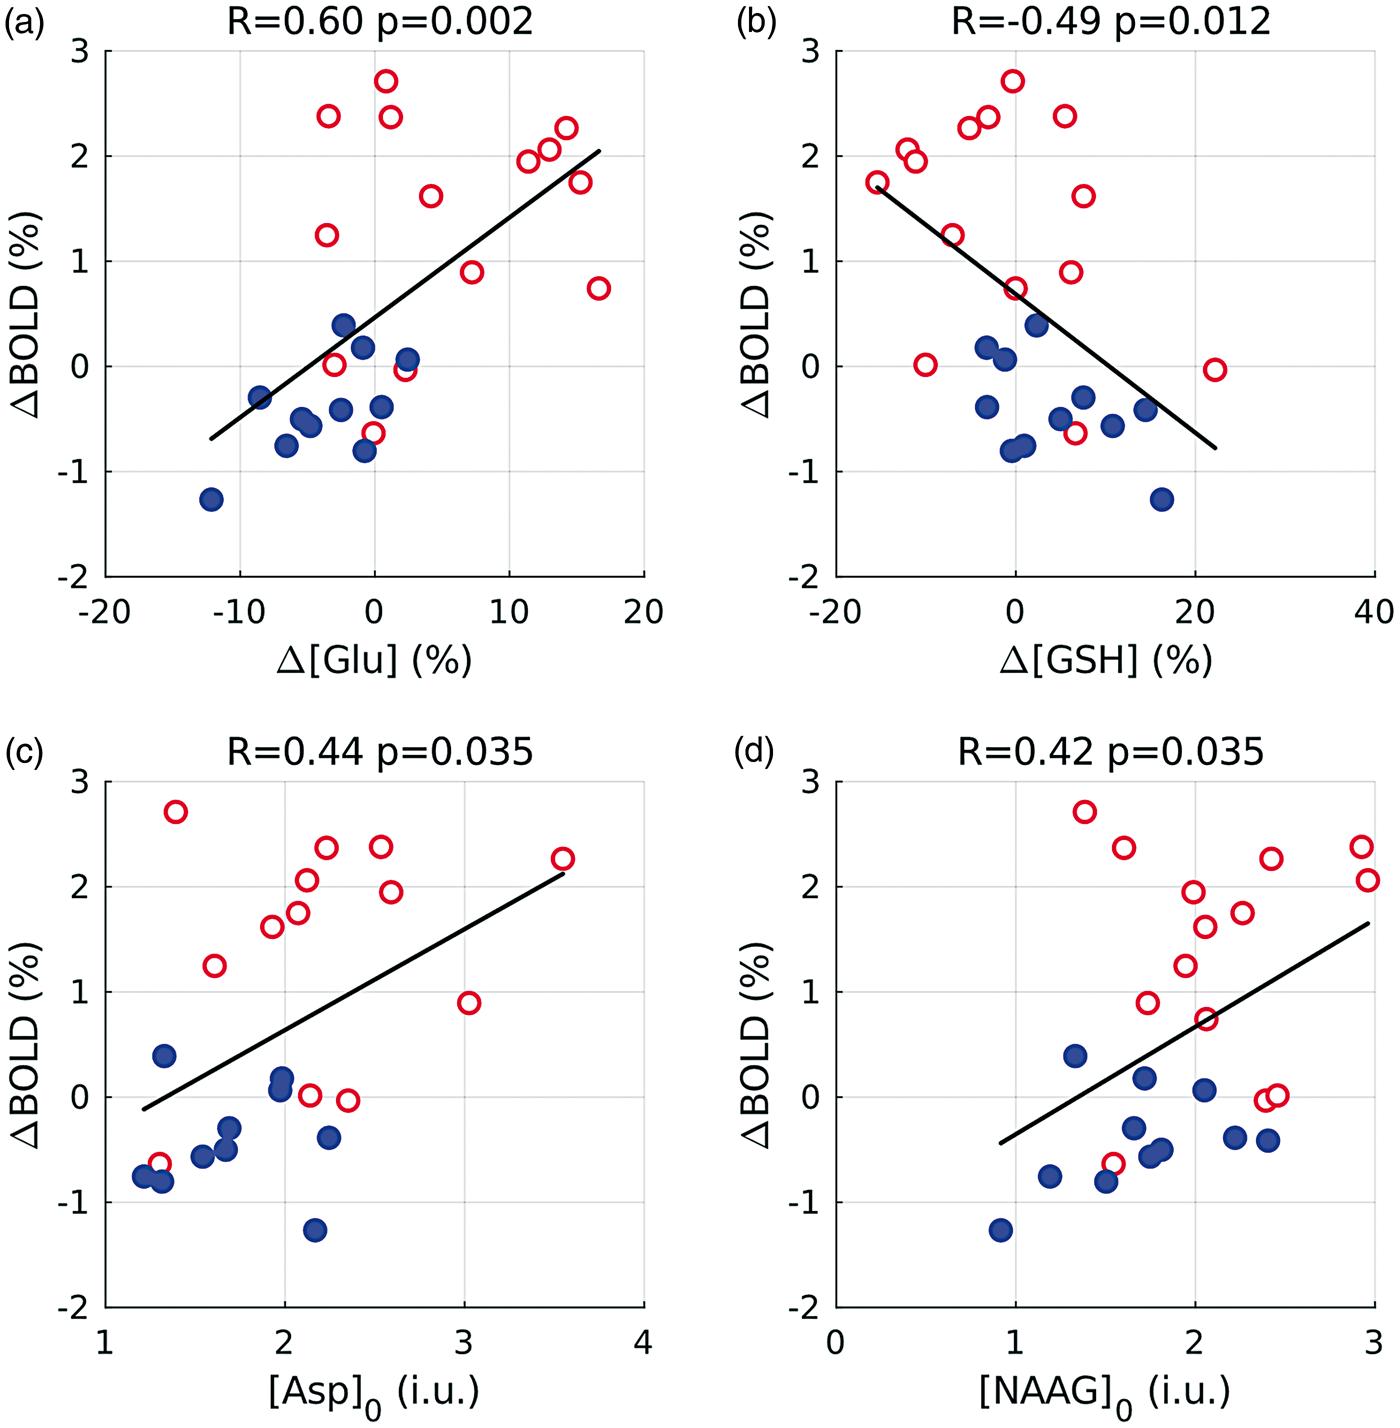
Discussion
Our observation of a significant mean [Glu] increase by 5.3% in V1 during activation by a full-field flickering checkerboard is within the range of 2 to 12% of previously reported fMRS results.20,21,25,26,38 It is also in line with rises by 6 to 8% during activation of rat barrel cortex obtained with 14C labeling 40 and 1H fMRS, 41 respectively. Besides limitations in the precision of measurements of small concentration changes, variability between studies may be due to differences in the employed stimuli and paradigm design, or differences in MRS acquisitions and post processing. Varying degrees of partial voluming are further likely contributors to variability both between studies as well as between subjects within the same study.
Recent research suggests that the negative BOLD response occurs in regions with a decrease of both CBF and CMRO2. 42 As elevated CBF is thought to result from feedforward signaling pathways initiated by increased synaptic [Glu], 43 we may expect correspondingly reduced [Glu] in regions where CBF decreases during stimulation from baseline. The extrapolation of this prediction for deactivation is, however, not trivial due to the complex interplay of metabolic and hemodynamic responses leading to the BOLD signal. 44 Investigations of [Glu] changes during deactivation and their correlation with BOLD changes were, hence, primary goals of the current work. While the activation experiments yielded an increase of [Glu], we observed a mean decrease by –3.8% in deactivated visual regions providing further evidence of the neuronal origin of the negative BOLD response.
Besides neurochemical consequences of activation, metabolic compartmentation and MRS ‘visibility’ are also important for the interpretation of fMRS responses.45,46 Isotope labeling experiments suggest two Glu pools – a smaller one of less than 10% with relatively rapid turnover assigned to astrocytes and a larger one of slower turnover assigned to neurons.47,48 On the subcellular level, intraterminal Glu is distributed in the cytosol at roughly 10 mM and – at 10-fold higher concentration – sequestered in synaptic vesicles.49,50 Baseline concentrations in the extracellular space (ECS) outside synapses are very low, in the order of 3 µM.51,52
While vesicular [Glu] is particularly high, it is also largely ‘invisible’ to MRS, presumably due to accelerated T2-relaxation in a tightly packed microenvironment. 53 This leads to the hypothesis that [Glu] changes observed with fMRS might reflect the transition from the pool of ‘invisible’ vesicular Glu to ‘visible’ synaptic, extracellular or astrocytic pools, thereby measuring primarily the process of neurotransmission. 25 However, this hypothesis cannot be brought in line with established data on Glu distribution and metabolic fluxes. For illustration, we consider 1 mm3 of cortex containing 80% cellular structures and 20% ECS. 54 We further assume that the cellular compartment is evenly distributed between neurons and astroglia 55 with cytosolic baseline [Glu] of 10 mM and 1 mM, respectively. 56 Complete exocytotic transmitter release from a vesicle containing 4000 molecules of Glu into the tiny volume of a synaptic cleft (roughly 2 × 10–12 mm3) would increase intrasynaptic [Glu] by a factor of 1000 to produce a peak concentration of 3 mM.50–52 With an average synaptic density around 109/mm3 in human neocortex, 57 clefts represent 0.2% of the cortical volume (or 1% of the ECS), and even simultaneous release in all synapses would change the overall [Glu] in the volume element by only 0.14%. However, Glu is not trapped in the cleft but diffuses rapidly (timescale of a few 100 µs) into the perisynaptic ECS. Mathematical modeling suggests an upper limit of 37 µM for [Glu] in the ECS for simultaneous transmitter release in all synapses, 51 which would increase the overall [Glu] by 0.15% in agreement with the estimate for the peak cleft concentration. Extracellular variations of [Glu], thus, contribute very little to the fMRS results. As low extracellular [Glu] is of critical importance to protect the brain from excitotoxicity, Glu is effectively removed from the ECS by cellular uptake mainly into nearby astrocytes. 50 Experiments with infusion of 13 C-labeled Glc demonstrated that vesicular Glu retains the label longer than the ‘metabolic’ astroglial and neuronal cytosolic Glu pools. 56 Hence, released transmitter should not substantially accumulate in the cytosolic compartments as it is effectively recycled to replenish the vesicular pool.
Although these considerations do not capture the complexity of neurotransmitter cycling and metabolism, the estimated orders of magnitude should be realistic. In consequence, MRS primarily detects cytosolic Glu, with a dominant contribution from neurons. Increases of [Glu] during activation do not directly reflect synaptic Glu release but represent adaptations of cerebral Glu metabolism and production.20–22,24,26 Elevated [Glu] during neuronal activation indicates an increased tricarboxylic acid (TCA) cycle rate to which Glu is linked via dynamic exchange with α-ketoglutarate. 58 Previous interpretations suggest that opposite changes in [Glu] and [Asp] are imposed by the aspartate aminotransferase equilibrium, which is a critical step in the malate-aspartate shuttle (MASh).20,21,24,58 Flux through the MASh maintains the cytosolic redox potential NADH/NAD+ that is required for oxidative Glc metabolism and neurotransmitter synthesis. The same directions of changes in [Glu] and [Asp] were also found in our study both in the activation and (with opposite signs) in the deactivation experiments; however, the [Asp] changes were insignificant as also noted by Schaller et al. 22 Increased flux through pyruvate decarboxylase as well as Glu/Gln cycling or GSH synthesis have also been suggested as potential causes of [Glu] elevations. 21
Investigations of the Glu/Gln cycle rate and the rate of Glc oxidation have established that approximately 80% of oxidative Glc consumption is related to signaling at baseline.59,60 As increased [Glu] during sustained activation is regarded as manifestation of an elevated steady state powered mainly by oxidative metabolism, reduced [Glu] during deactivation would suggest a TCA cycle rate below baseline. Changes in [Glu] correlated positively with the percentage positive BOLD response, consistent with previous results 24 and, presumably, reflecting enhanced energy production during activation by increased glycolytic and TCA cycle fluxes. In expansion of these observations, our results indicate that the same positive correlation also exists for the percentage negative BOLD response. Moreover, the entire range of (positive and negative) [Glu] and BOLD changes obtained with both stimuli could be fitted to a single regression line (Figure 5(a)). Unlike Bednařík et al., 24 we did not observe a nonzero intercept in our data within the experimental accuracy.
Whereas the [Glu] changes show a remarkable consistency with the behavior of the BOLD response during activation and deactivation – regarding polarity (Figure 4) and scaling (Figure 5(a)) – [Glc] changes seem to indicate distinct differences between the underlying activities. Previous visual activation studies yielded reduced [Glc]24,38 and increased [Lac],20,21,23,24,38,61 which was proposed to reflect enhanced glycolytic flux and, hence, an increased cerebral metabolic rate of Glc (CMRGlc). It is to note that quantification of [Glc] changes in 1H spectra is difficult because the rather weak resonances overlap with signals from other metabolites (Figure 2) producing increased fitting errors. While we could not reliably quantify [Glc] during activation, we found a significantly decreased [Glc] along with a negative (presumably inhibitory) BOLD response, that is, the same direction of change as previously observed for positive (excitatory) BOLD responses. Unfortunately, we could not assess alterations in [Lac] with sufficient reliability, so further evidence linking the observed [Glc] changes to anaerobic metabolism was not available from our spectra.
Unlike isotope labeling experiments, 1H MRS does not directly measure Glc consumption but rather the net concentration resulting from the interplay of Glc supply by the blood and tissue utilization. It is, hence, not easily possible to discriminate if [Glc] decrease during the negative BOLD response primarily reflects (i) decreased Glc supply or (ii) increased CMRGlc during deactivation or a combination of both effects. The first option is in line with the ‘metabolic hypothesis’ that links BOLD changes directly to local energy needs. The second option follows the ‘neurogenic’ assumption that the hemodynamic response is primarily driven by neurotransmitter-related signaling.1,44,62 Although increased Glc consumption during a negative BOLD response seems counterintuitive, Devor et al. 63 observed blood oxygenation and flow decreases along with vasoconstriction but increased 2-deoxyglucose uptake in rat somatosensory cortex using optical techniques and autoradiography. Recent evidence suggests a relation of the negative BOLD response to excitation of GABAergic inhibitory interneurons and release of vasoconstrictors. 44 By activating interneurons, Glu signaling may lead to overall inhibitory activity, and Glu release and uptake by astrocytes would stimulate glycolysis.
As combined changes of [Glu] and [Asp] have been linked to MASh flux, 20 the reversal of [Glu] and [Asp] changes associated with positive versus negative BOLD responses might indicate reduced MASh flux and redox potential during deactivation.64,65 Reduced MASh activity due to inhibitor treatment was shown to impair Glc oxidation. 66 Therefore, it seems plausible that variations in baseline [Asp] contribute to the inter-subject BOLD variability as indicated by the correlation in Figure 5(c). A similar scenario might apply to baseline [NAAG], which correlated positively with BOLD changes (Figure 5(d)). Among several functions, NAAG activates presynaptic and glial metabotropic Glu receptor 3 (mGluR3), which reduces Glu release 67 and might trigger vasodilation. 68
Lin et al. 21 reported an activation-induced increase in [GSH] in the visual cortex, which has not yet been corroborated by other fMRS studies. As possible explanations, they discussed the well-established role of GSH in detoxification of reactive oxygen species generated via enhanced electron transport chain activity or the clearance of increased Glu during activation. We obtained a significant increase in [GSH] by 4.2% along with decreased [Glu] during reduced neuronal activity, which seems paradox in view of the results of Lin et al. However, recent research suggests more actions for GSH besides detoxification or clearance of Glu including a potential role as neuromodulator.69,70 Inhibition of glutamatergic transmission via GSH has been discussed in the context of sleep regulation 71 and might provide an explanation of our finding considering the inhibitory nature of neuronal responses in regions with negative BOLD signal changes. The negative correlation between the BOLD signal and the [GSH] changes (Figure 5(c)) would be in line with this assumption.
Similar to the situation for Glc, all signals from NAAG and GSH overlap with stronger resonances from other metabolites, which makes their measurement challenging. Under such conditions, spectral editing techniques, for example MEGA-PRESS, 72 are attractive alternatives offering a more robust quantification. Further research, including such metabolite-selective methods, is needed to critically evaluate different hypotheses about potential [NAAG] or [GSH] changes during activation or inhibition.
Conclusion
The amplitude and direction of stimulus-induced variations in the concentration of Glu correlate with positive and negative BOLD responses in human V1. As suggested by previous studies of brain activation, these alterations probably reflect adaptations of TCA cycle activity. This interpretation may be extrapolated to also include areas of deactivation based on the current results. Surprisingly, a decrease of [Glc] was found during deactivation, that is, the same direction of change as previously reported for activation. Further work is needed to investigate if this might indicate upregulated anaerobic metabolism. Additional observations include correlations of baseline levels of Asp and NAAG with BOLD signals, possibly contributing to the variability of individual BOLD responses. Changes of [GSH] during deactivation might be indicative of a neuromodulatory effect.
Footnotes
Funding
The author(s) disclosed receipt of the following financial support for the research, authorship, and/or publication of this article: This work was funded by the European Union (EU) through the Marie Curie ITN “TRANSACT” [FP7-PEOPLE-2012-ITN, #316679]; and partly, by the Helmholtz Alliance “ICEMED—Imaging and Curing Environmental Metabolic Diseases” [HA-314].
Acknowledgements
We would like to thank Małgorzata Marjańska from the University of Minnesota CMRR for kindly providing the semi-LASER sequence, Ioannis-Angelos Giapitzakis and Anke Henning from the MPI for Biological Cybernetics for support with post-processing routines, Renzo Huber for sharing the visual stimulation paradigms, Maria Guidi for helpful suggestions, and Torsten Schlumm for technical support.
Declaration of conflicting interests
The author(s) declared no potential conflicts of interest with respect to the research, authorship, and/or publication of this article.
Authors’ contributions
Miguel Martínez-Maestro contributed to the concept and design of the project, performed the acquisition and analysis of the data, contributed to the interpretation of the data and drafted the article. Christian Labadie contributed to the concept and design of the project and the interpretation of the data and revised the article critically for important intellectual content. Harald E. Möller contributed to the concept and design of the project and the interpretation of the data and drafted and revised the article. All authors approved the version to be published.