
Abstract
Surrogates of neuronal activity, typically measured by regional cerebral blood flow (rCBF) or glucose metabolism, can be estimated from dynamic amyloid PET imaging. Using data for 149 participants (345 visits) from the Baltimore Longitudinal Study of Aging, we assessed whether the average of early amyloid frames (EA) and R1 computed from dynamic 11C-Pittsburgh compound B (PiB) PET can serve as surrogates of rCBF computed from 15O-H2O-PET. R1 had the highest longitudinal test–retest reliability. Interquartile range (IQR) of cross-sectional Pearson correlations with rCBF was 0.60–0.72 for EA and 0.63–0.72 for R1. Correlations between rates of change were lower (IQR 0.22–0.50 for EA, 0.25–0.55 for R1). Values in the Alzheimer’s metabolic signature meta-ROI were negatively associated with age and exhibited longitudinal declines for each PET measure. In age-adjusted analyses, meta-ROI rCBF and R1 were lower among amyloid+ individuals; EA and R1 were lower among males. Regional PiB-based measures, in particular R1, can be suitable surrogates of rCBF. Dynamic PiB-PET may obviate the need for a separate scan to measure neuronal activity, thereby reducing patient burden, radioactivity exposure, and cost.
Introduction
Both structural and functional brain changes are important for the study of Alzheimer’s disease (AD). Fibrillar amyloid accumulation, a hallmark structural brain neuropathology of AD, begins about two decades prior to clinical diagnosis.
1
Ten percent of cognitively normal individuals aged 50 have amyloidosis, with prevalence increasing to over 40% by age 90.
2
11C-Pittsburgh compound B (PiB) was the first radiotracer used in human studies of amyloid PET.
3
Several studies have demonstrated that 18F-fluorodeoxyglucose (FDG) PET measures of glucose metabolism, an indicator of brain function, are correlated with the mean of the early PiB time frames4–8 as well as the R1 parameter reflecting relative radiotracer delivery computed from dynamic PiB-PET.
9
These results suggest that dynamic PiB imaging can be used to assess both the structural proteinopathies and functional properties of the brain. Similar results have been obtained with other amyloid radiotracers, including 18F-florbetapir (FBP)
10
and 18F-florbetaben.7,11 Additionally, regional cerebral blood flow (rCBF) as measured by dynamic 15O-H2O-PET has been shown to correlate with PiB-K1, the unidirectional influx rate of radiotracer from plasma to tissue in units of
This dual-biomarker imaging of both fibrillar amyloid burden and neuronal activity via dynamic amyloid PET has important clinical implications: it may obviate the need for a separate PET scan to measure neuronal activity, thereby reducing patient burden and radioactivity exposure. The availability of information on neuronal activity in addition to amyloid burden can enable better differential diagnosis of dementias. 18 Furthermore, understanding functional neurodegeneration is important for prognosis. For example, studies show that co-occurrence of amyloidosis and neurodegeneration is associated with steeper cognitive declines than the presence of either alone.19–23 Therefore, characterization of neuronal activity, a proxy for neurodegeneration, alongside amyloidosis is key to a more complete understanding of cognitive decline. It is particularly important to assess longitudinal changes in neuronal activity to identify factors that can slow down or prevent cognitive decline and associated brain changes.
Previous reports that demonstrated the use of dynamic amyloid imaging for computing surrogates of neuronal activity have been limited to cross-sectional associations. It remains unclear whether surrogate measures computed from dynamic amyloid imaging are reliable longitudinally, and whether they exhibit longitudinal changes similar to those of rCBF. In this paper, we use rCBF as measured by static 15O-H2O-PET and dynamic PiB-PET to address these gaps in knowledge by examining within-individual longitudinal associations and population-level longitudinal trends in rCBF, mean of early PiB time frames, and PiB-R1. We hypothesized that both early PiB time frames and R1 would be highly correlated with rCBF cross-sectionally and longitudinally, and that they would have similar associations with age, sex, and amyloid group.
Material and methods
Participants
Participant characteristics at baseline.
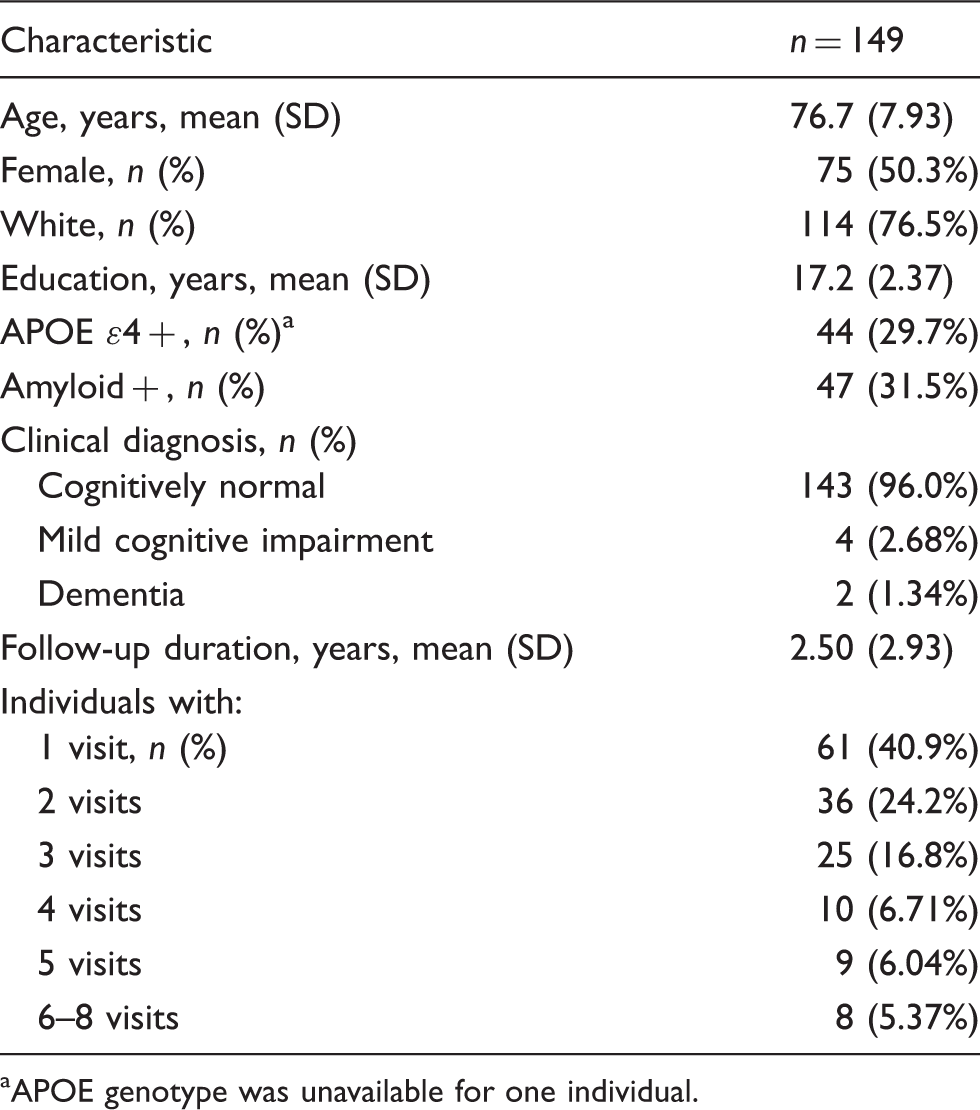
APOE genotype was unavailable for one individual.
Research protocols were conducted in accordance with the United States federal policy for the protection of human research subjects contained in Title 45 Part 46 of the Code of Federal Regulations (45 CFR 46), approved by local Institutional Review Boards (IRB), and all participants gave written informed consent at each visit. BLSA PET study is governed by the IRB of the Johns Hopkins Medical Institutions (protocol number NA_00051793), and the BLSA study is overseen by the National Institute of Environmental Health Sciences (NIEHS) IRB. At enrollment into the neuroimaging substudy, which began in 1994, participants were free of CNS disease (dementia, stroke, bipolar illness, epilepsy), severe cardiac disease (myocardial infarction, coronary artery disease requiring angioplasty or coronary artery bypass surgery), severe pulmonary disease, and metastatic cancer.
Image acquisition and processing
Structural imaging
MRI acquisition is detailed in Supplement. Anatomical labels and regional brain volumes were obtained for each MRI using the MUSE labeling approach 24 with atlases that have been harmonized to account for differences in scanners and acquisition parameters. 25 This harmonization enabled the use of volumetric data acquired on the three different scanners (355 visits) together in statistical analyses. We used 118 MUSE regions of interest (ROI) covering the cerebral cortex, lobar white matter (WM), and subcortical gray matter (GM) structures (Supplementary Table). In our analyses, we focused on an AD metabolic signature composite region, the meta-ROI (comprised of bilateral angular, posterior cingulate, and inferior temporal gyri), 26 given that dynamic PiB-PET may be useful in assessing AD-related neurodegeneration in addition to gaining insight into a hallmark neuropathology of AD. We also evaluated a composite of all cortical GM regions.
Transmission scan
A transmission scan in two-dimensional mode using a 68Ge rotating pin source was obtained prior to the emission scans and was used for attenuation correction during PET reconstruction.
15O-H2O-PET imaging
After completion of the transmission scan, a static 15O-H2O-PET scan was acquired in resting state on a GE Advance scanner in three-dimensional mode following an intravenous bolus injection of 370 MBq of 15O-H2O. Image data were obtained for 60 s once the total radioactivity counts in the brain reached threshold levels. The image was reconstructed using filtered backprojection (image matrix = 128 × 128, 35 slices, pixel size = 2 × 2 mm, slice thickness = 4.25 mm). Each 15O-H2O-PET scan was rigidly registered onto the corresponding MRI using normalized mutual information. 27 The MUSE label image was transformed from MRI to PET space using the resulting rigid registration matrix, and was resampled to the PET space voxel grid using nearest neighbor interpolation. The 15O-H2O-PET images were normalized by cerebellar GM to obtain rCBF images consistent with PiB-R1 (see below), which is based on a cerebellar GM reference region. The cerebellum has been used previously as a reference region for analysis of 15O-H2O-PET.14,28
PiB-PET imaging
Ten minutes after the 15O-H2O-PET scan, a dynamic PiB-PET scan was obtained over 70 min (33 frames) on a GE Advance scanner in three-dimensional mode. Acquisition began immediately following an intravenous bolus injection of approximately 555 MBq of PiB, and time frames were binned according to the following protocol: 4 × 0.25, 8 × 0.5, 9 × 1, 2 × 3, and 10 × 5 min. The dynamic scan was reconstructed using filtered backprojection with a ramp filter, yielding a spatial resolution of approximately 4.5 mm FWHM at the center of the field of view (image matrix = 128 × 128, 35 slices, pixel size = 2 × 2 mm, slice thickness = 4.25 mm). Each frame was aligned to the mean of the first 2 min to correct for motion. Average of the first 20 min of PiB-PET scans was rigidly registered onto the corresponding MRI, and the MUSE label image was transformed from MRI to PET space. Radiotracer kinetics were modeled using a simplified reference tissue model with a cerebellar GM reference region, and distribution volume ratio (DVR) and relative delivery parameter (R1) images were estimated using linear regression with spatial constraint.
29
R1 is given by
Regional rCBF, PiB-EA, and PiB-R1 mean values were computed in native PET space using transformed MUSE labels.
Data from the BLSA are available upon request from the BLSA website (https://www.blsa.nih.gov). All requests are reviewed by the BLSA Data Sharing Proposal Review Committee and are also subject to approval from the NIH IRB.
Statistical analyses
Intraclass correlation coefficients
To assess the reliability and stability of each PET measure, we computed the intraclass correlation coefficient (ICC) for each ROI. This entailed fitting a linear mixed effects model with a fixed and random intercept as well as a fixed slope to account for change over time. ICC was computed as the ratio of the variance of the random intercept to the total variance (i.e. sum of the random intercept and noise variances).
Within-ROI correlations
To determine whether EA or R1 is a better surrogate of rCBF, we computed all pairwise Pearson correlations at baseline for each ROI. We repeated these correlations for rates of change, computed for 52 individuals with at least three PET measurements. For each ROI, rate of change in rCBF, denoted
Cross-sectional and longitudinal associations
We assessed cross-sectional and longitudinal associations of each meta-ROI PET measure with age, sex, and amyloid group using linear mixed effects models. We also explored models including APOE ɛ4 positivity as an additional independent variable. We first converted each PET measurement to a z-score by subtracting the mean and dividing by the standard deviation at baseline. For each PET measure, we fitted a linear mixed effects model with longitudinal PET measure as the dependent variable, and intercept, baseline age (centered at 75), sex, amyloid status, time from baseline, and interactions of baseline age, sex, and, amyloid status with time as fixed effects. We included a random intercept per individual. Statistical significance was defined as p < 0.05.
Power calculations
For each meta-ROI PET measure, we fitted a random slopes linear mixed effects model with age as the independent variable. Mean annualized change was computed as the fixed effect estimate for the age term, and standard deviation (SD) was computed as the standard deviation of the random slope. We computed the number of participants required per group to detect a groupwise difference equal to 50% of the estimated mean annualized rate of change given the estimated variance–covariance matrix based on a two-sided test with α = 0.05 and 80% statistical power, assuming that each individual is observed for four visits separated by two-year intervals.
Software
For statistical analyses, we used R version 3.4.3. 30 Linear mixed effects models were fitted using the nlme package. 31 Plots were generated using ggplot. 32 Power calculations were performed using the lmmpower function in the longpower package. 33
Results
Figure 1 shows rCBF, EA, and R1 images for a participant with higher and a participant with lower levels of rCBF.
Sample PET images for an individual with higher (top row) and lower (bottom row) levels of rCBF, superimposed on corresponding MRIs.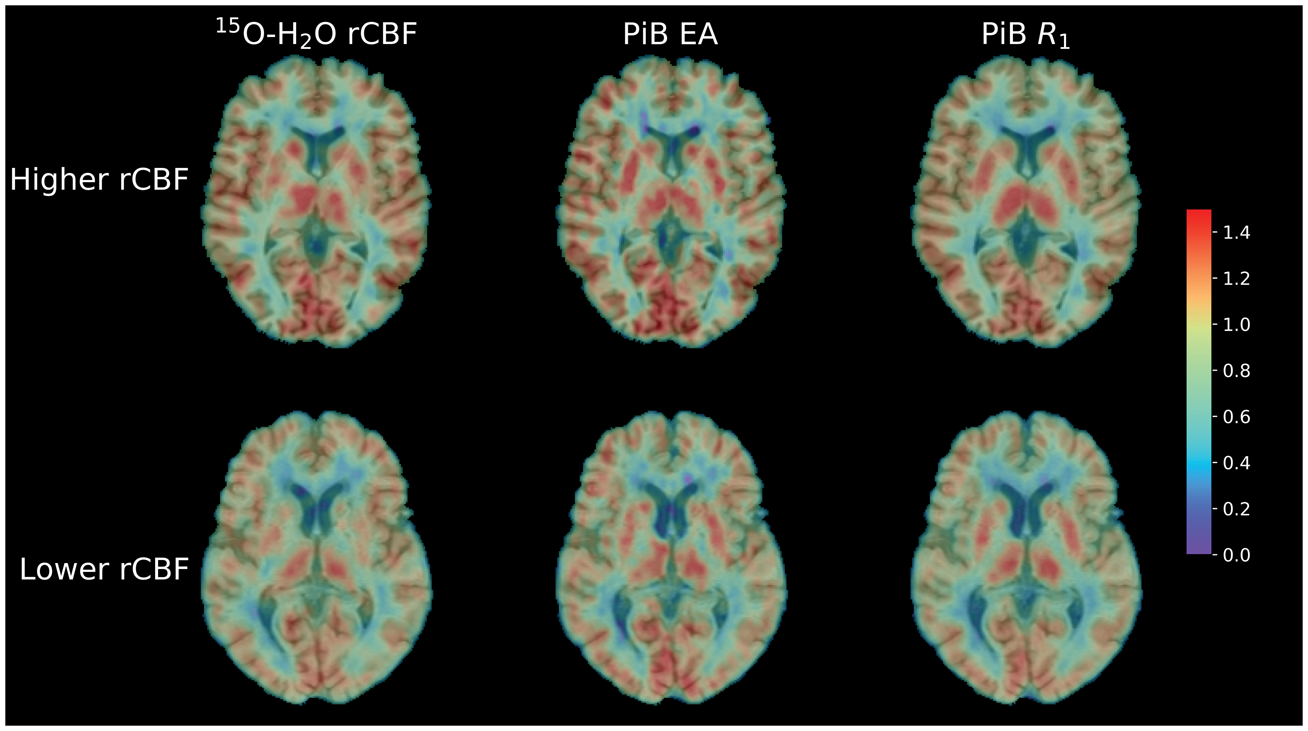
Intraclass correlation coefficients
PiB-R1 ICCs were the highest in every ROI except for the right occipital pole, where EA had a higher ICC (Supplementary Figure 1). Median (interquartile range [IQR]) ICC across ROIs was 0.58 (0.50–0.64), 0.67 (0.57–0.73), and 0.81 (0.73–0.84) for rCBF, EA, and R1, respectively. Meta-ROI ICCs fell in the highest quartile: 0.74, 0.81, and 0.86 for rCBF, EA, and R1, respectively (Supplementary Table 1). Longitudinal trends in the meta-ROI for each PET measure are illustrated in Figure 2.
Longitudinal meta-ROI PET measure trends.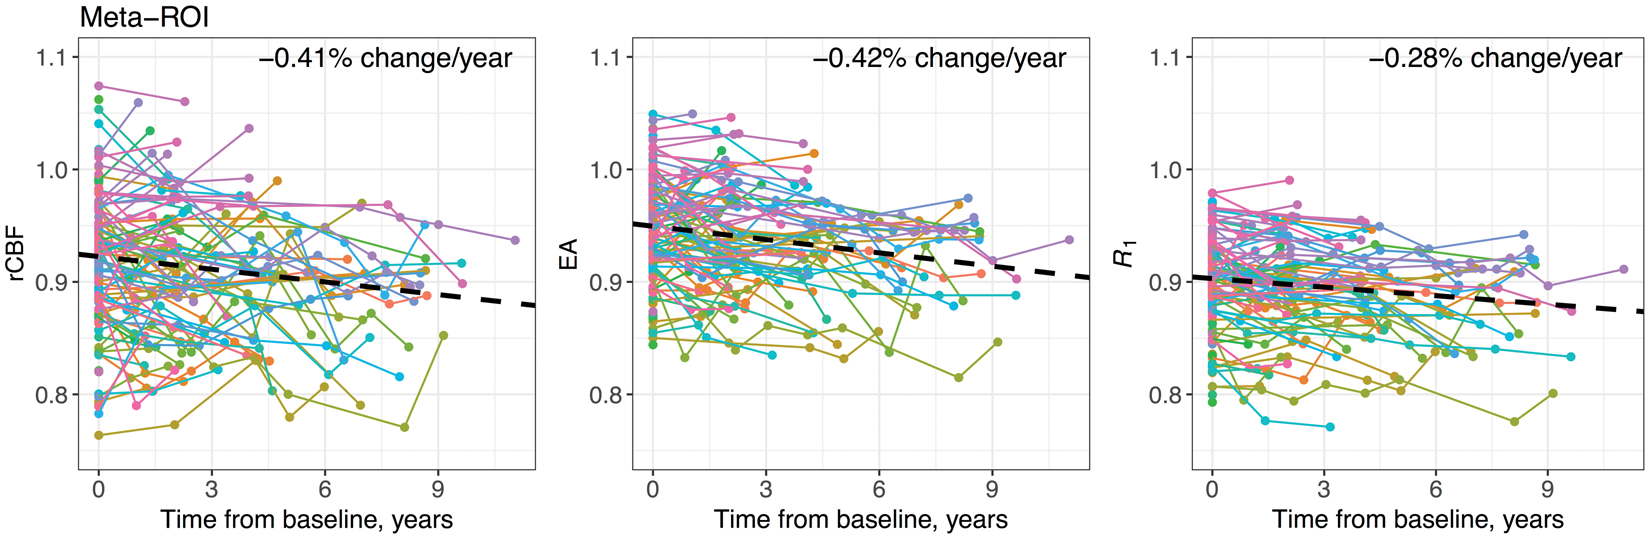
Within-ROI correlations
Cross-sectionally, rCBF had higher correlations with R1 compared to EA in 75 of the 118 ROIs (Supplementary Figure 2(a)). Median (IQR) Pearson correlations across ROIs was 0.65 (0.60–0.72), 0.67 (0.63–0.72), and 0.88 (0.85–0.92) for rCBF-EA, rCBF-R1, and EA-R1, respectively. Meta-ROI correlations fell in the highest quartile: 0.79, 0.76, and 0.93 for rCBF-EA, rCBF-R1, and EA-R1, respectively (Figure 3(a), Supplementary Table 2).
(a) Cross-sectional and (b) longitudinal correlations among meta-ROI PET measures.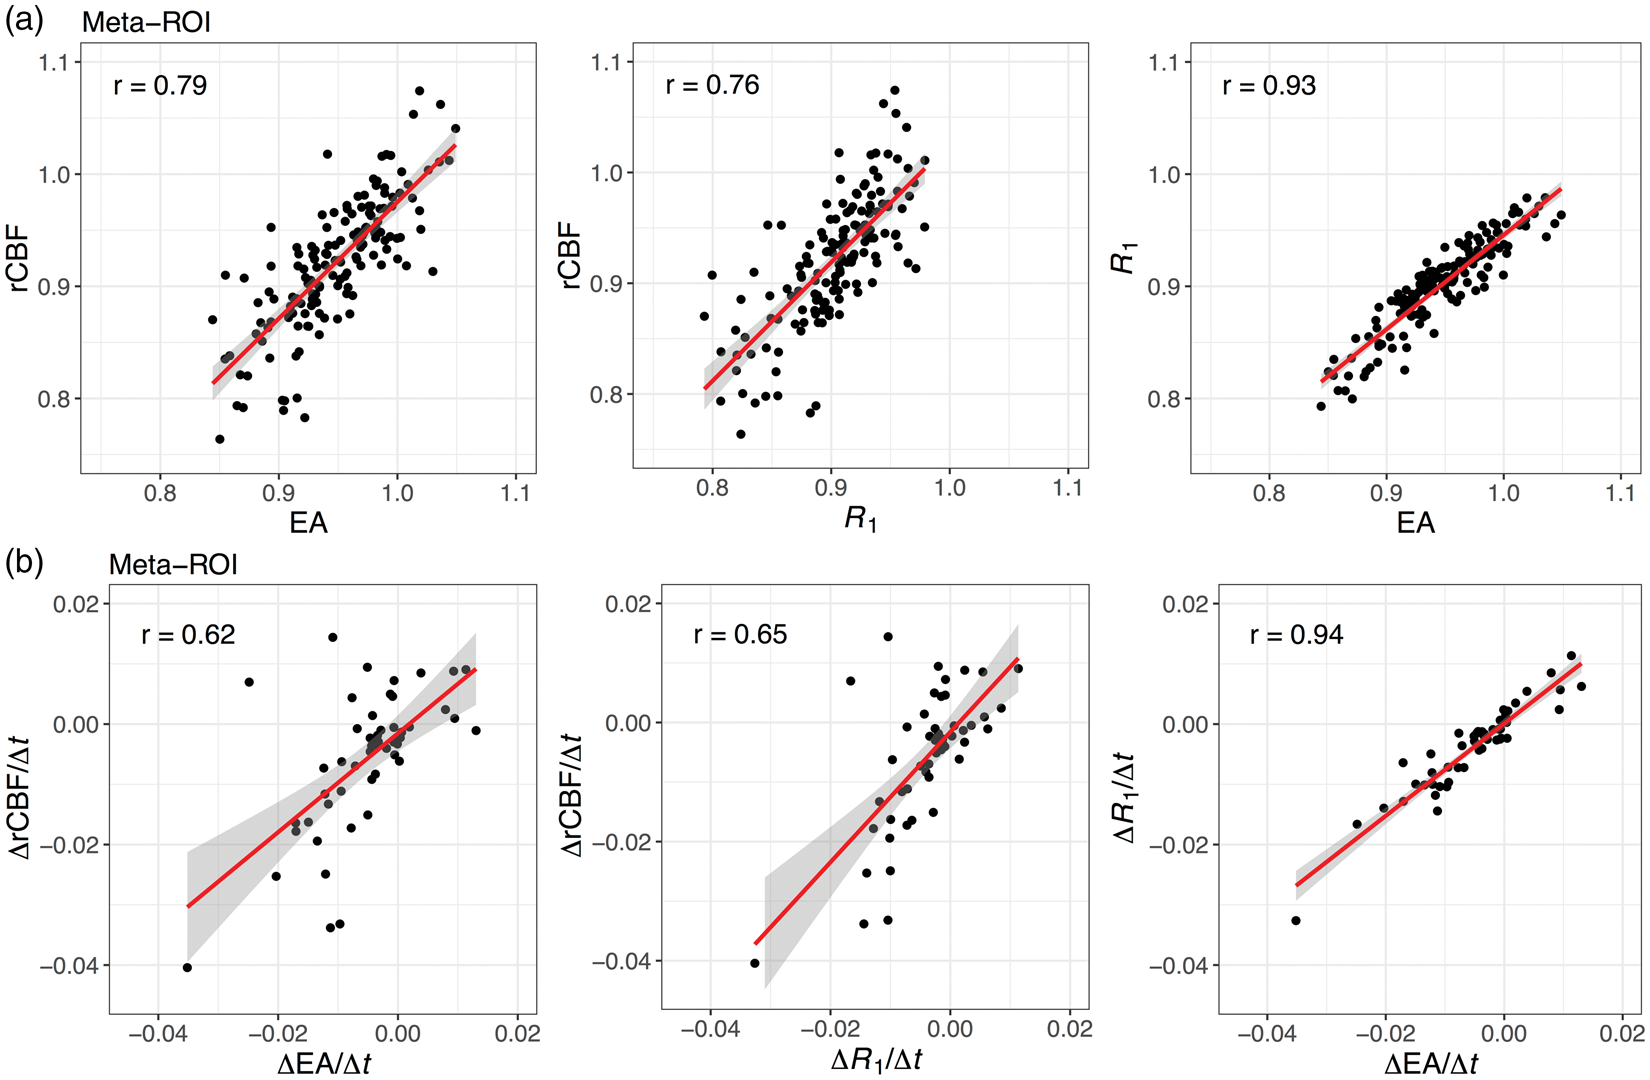
Rate of longitudinal change in rCBF was more strongly correlated with rate of change in R1 than EA in 71 of the 118 ROIs (Supplementary Figure 2(b)). Median (IQR) Pearson correlations across ROIs was 0.39 (0.22–0.50), 0.42 (0.25–0.55), and 0.82 (0.73–0.89) for rCBF-EA, rCBF-R1, and EA-R1, respectively. Meta-ROI correlations fell in the highest quartile: 0.61, 0.65, and 0.94 for rCBF-EA, rCBF-R1, and EA-R1, respectively (Figure 3(b), Supplementary Table 2).
Cross-sectional and longitudinal associations
Cross sectional and longitudinal associations of meta-ROI PET measures with age, sex, and amyloid group.
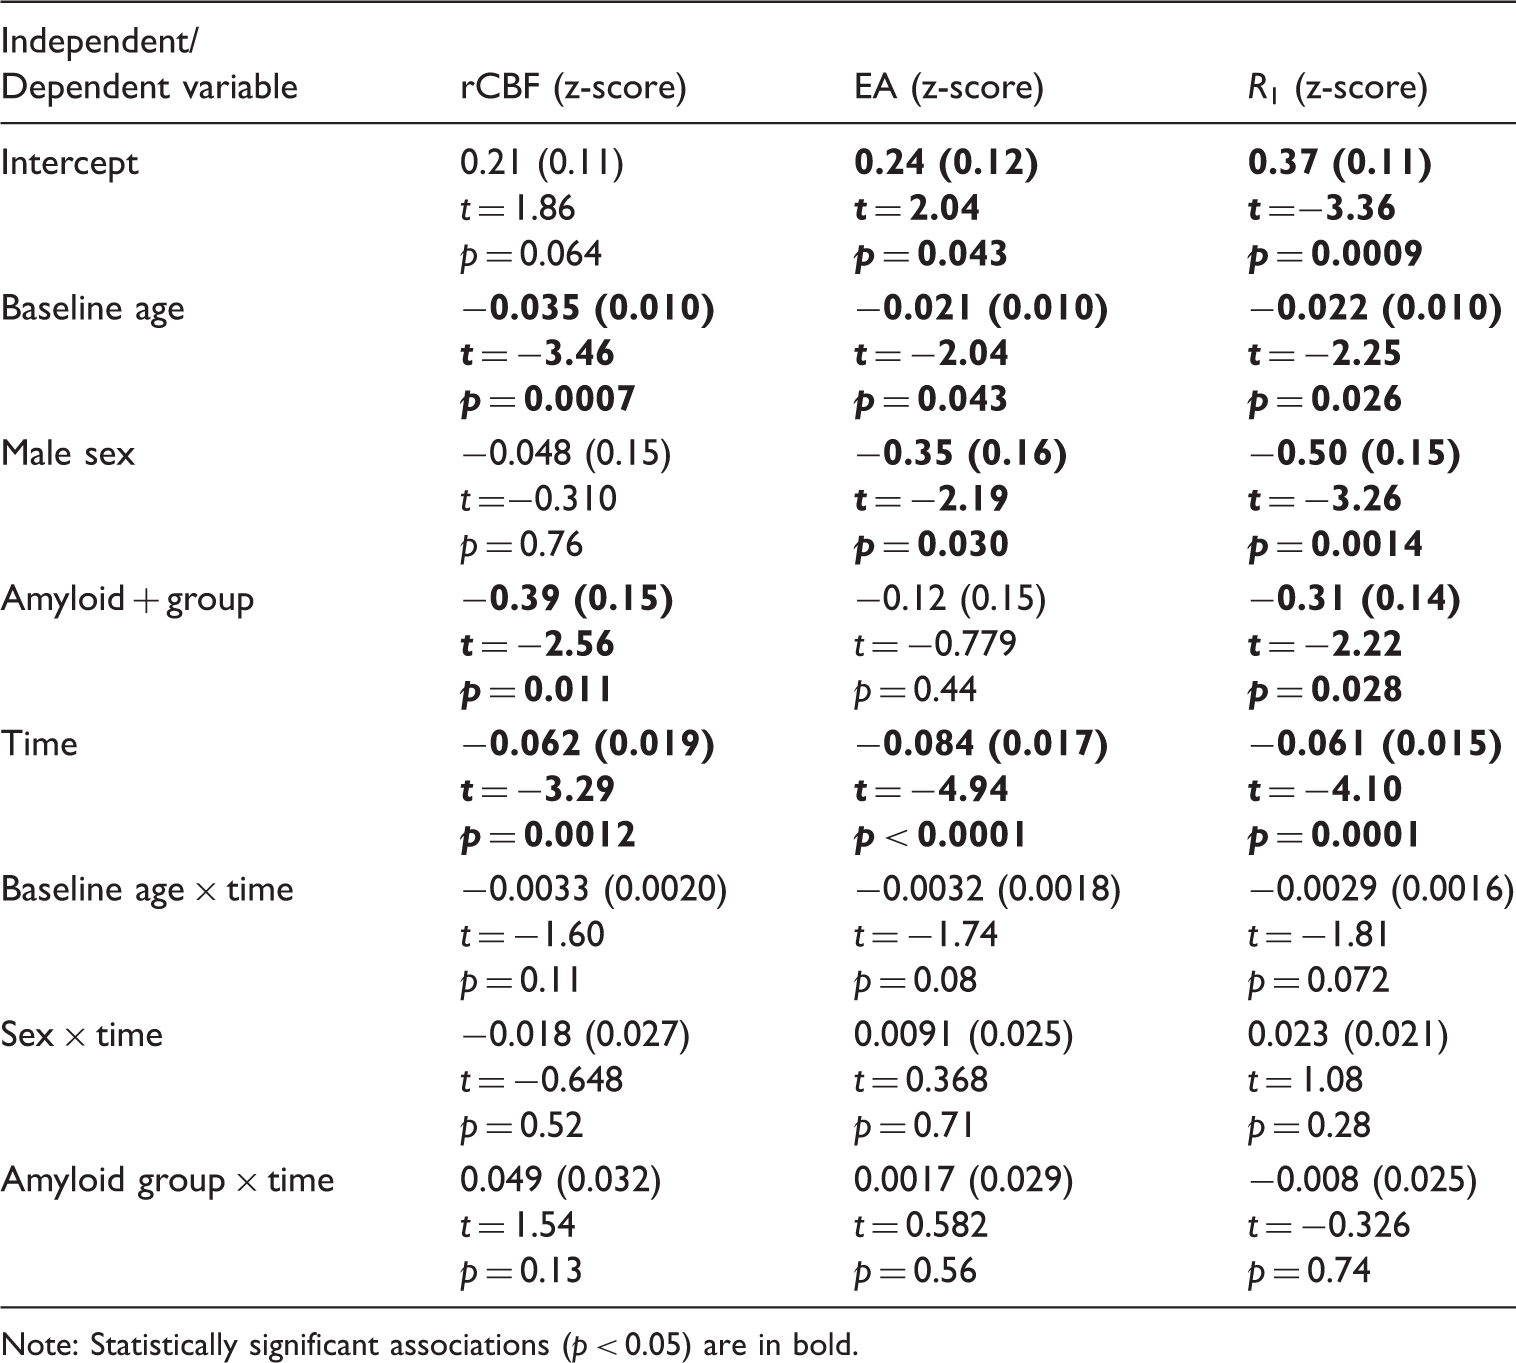
Note: Statistically significant associations (p < 0.05) are in bold.
There were some differences across the different PET measures in relation to cross-sectional associations with sex and amyloid group. While the directions of the associations agreed, there were differences in the magnitude of the estimated regression coefficients and their statistical significance. rCBF and R1 were lower in the amyloid + group (β = −0.39, p = 0.011 for rCBF; β = −0.31, p = 0.028 for R1), whereas this association was not statistically significant for EA (β = −0.12, p = 0.44). EA and R1 levels were lower among males (β = −0.35, p = 0.030 for EA; β = −0.50, p = 0.0014 for R1), while this was not statistically significant for rCBF (β = −0.048, p = 0.76). We did not find statistically significant associations of baseline age, sex, or amyloid group with rate of longitudinal change in any of the PET measures. For a qualitative assessment of the differences between amyloid+ and amyloid−, we computed mean images per amyloid group (not adjusted for covariates) and subtracted them (amyloid− − amyloid+). The difference images (Figure 4) further demonstrated the similarity between rCBF and R1 images, whereas the EA images exhibited subtler group differences.
Amyloid group difference images (amyloid− – amyloid+) for rCBF, EA, and R1 (not adjusted for covariates).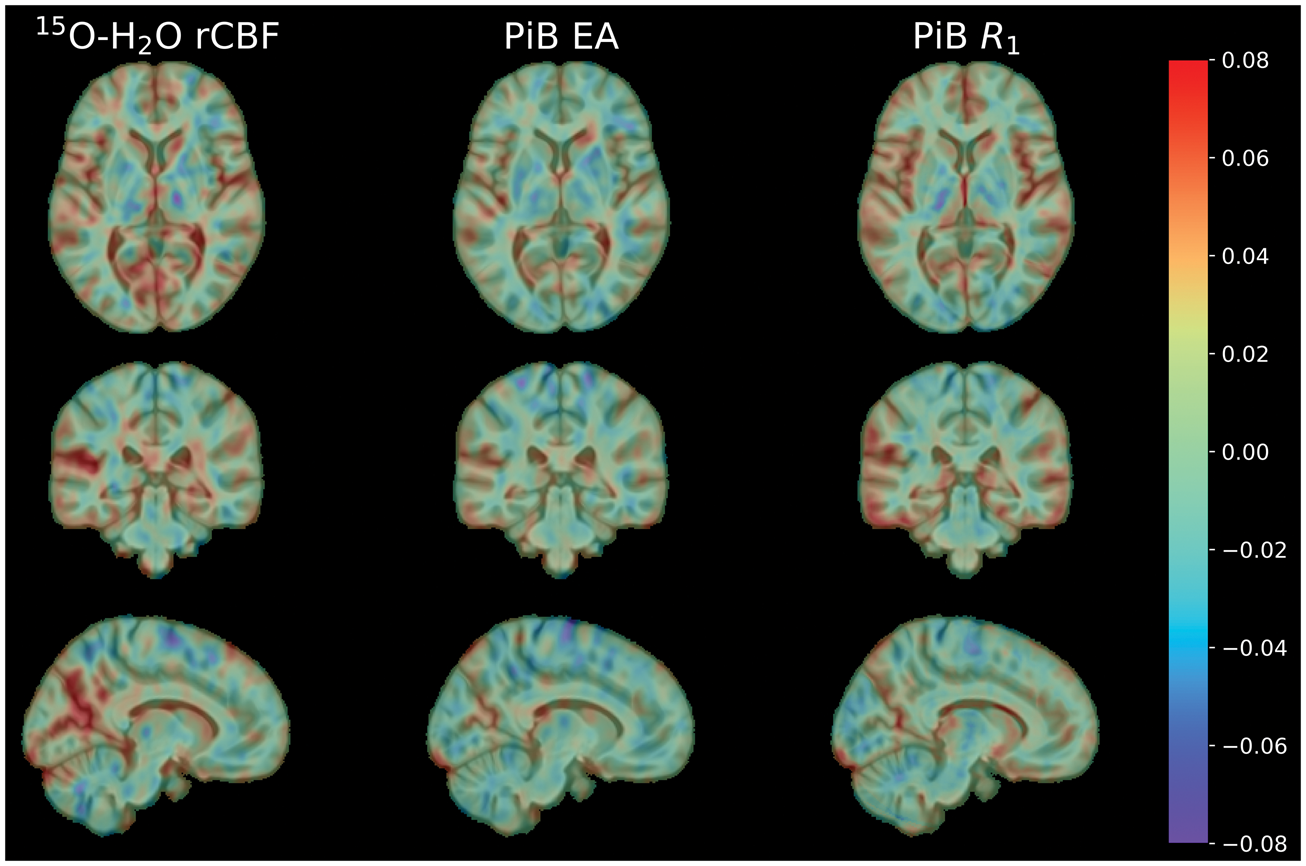
The lack of statistical significance for the amyloid status and EA association raised the possibility that EA may be contaminated by amyloid-binding PiB signal, nullifying our ability to detect lower neuronal activity among amyloid+ individuals. We assessed whether EA reflects amyloid burden by computing cross-sectional Pearson correlation between continuous PiB-DVR and EA at baseline among the 47 PiB+ individuals in our sample. This correlation (0.18, p = 0.22), while not statistically significant, was higher than the correlations of PiB-DVR with PiB-R1 (−0.0065, p = 0.96) and rCBF (0.065, p = 0.66).
Power calculations
The mean (SD) annualized change in meta-ROI rCBF, EA, and R1 was −0.0031 (0.00070), −0.0025 (0.00035), and −0.0020 (0.0012), respectively. We found that to detect a groupwise difference equal to 50% of the estimated mean annualized change, 318, 243, and 232 participants would be needed per group for rCBF, EA, and R1, respectively.
Discussion
We evaluated whether two measures derived from dynamic PiB-PET scans, namely the average of the early frames (EA) and the relative delivery parameter R1, can serve as surrogates of rCBF measured by static 15O-H2O-PET. Compared to rCBF and EA, R1 had the highest longitudinal test–retest reliability and required the smallest sample to detect groupwise differences in longitudinal rates of change in the meta-ROI, an AD metabolic signature composite region. IQR of cross-sectional Pearson correlations of PiB-based measures with rCBF was around 0.6–0.7, whereas longitudinal correlation IQR was around 0.2–0.5. The meta-ROI exhibited cross-sectional and longitudinal correlations in the highest quartiles. All meta-ROI PET measures had statistically significant associations cross-sectionally with age and showed statistically significant longitudinal declines. In age-adjusted analyses, meta-ROI rCBF and R1 were lower among individuals with elevated amyloid levels (adjusting for sex), whereas EA and R1 were lower among males (adjusting for amyloid status). The lack of statistical significance for lower EA among amyloid+ individuals can be explained by the weak correlation we observed between EA and amyloid burden, potentially compromising EA as a surrogate of rCBF. Given the higher ICC of R1 and its lower correlation with amyloid burden compared to EA, R1 is a more favorable surrogate measure for rCBF. Our findings confirm previous cross-sectional reports of early PiB time frames 28 and PiB-R114,15 as surrogates of cerebral blood flow as measured by 15O-H2O-PET. Our study adds to the existing body of knowledge by evaluating the longitudinal agreement between rCBF and these surrogate measures from dynamic PiB scans, demonstrating that PiB-based measures, in particular R1, can be longitudinally reasonably reliable surrogates of rCBF in certain individual ROIs and the meta-ROI.
The recently published National Institute on Aging and Alzheimer’s Association (NIA-AA) research framework 34 recommends a biomarker-based classification system for studying the preclinical, MCI, and dementia stages of AD based on “β-amyloid deposition, pathologic tau, and neurodegeneration [AT(N)].” Our study shows that dynamic PiB-PET can be used to gain insight into two of these three categories, with DVR yielding a measure of amyloid burden and R1 yielding a measure of functional neurodegeneration.
Certain kinetic properties, such as a high first-pass influx rate, of PiB and other amyloid radiotracers allow for the use of their early frames and radiotracer delivery parameters as correlates of rCBF. 12 These kinetic properties stem from these radiotracers’ moderate lipophilicity, which yields optimal passive transfer across the blood-brain barrier. 35 Our findings may be generalizable to other radiotracers with similar properties.
There is a tight coupling between rCBF and glucose metabolism, with rCBF increasing in response to increased glucose demand by functionally activated normal cerebral tissue, 36 which constitutes the biological basis for the observed correlations between 15 O-H2O and FDG-PET imaging.37,38 Consistent with the association between CBF and glucose metabolism, our results agree with previous cross-sectional reports demonstrating that early amyloid time frames and PiB-R1 can serve as surrogates of glucose metabolism.4–6,8,9,28
Studies have shown that the early amyloid time frames are strongly correlated with the relative flow parameter R1, 8 and to a lesser extent, with the absolute flow parameter K15,14 computed from amyloid PET. Direct comparisons of early amyloid frames and kinetic parameters reflecting radiotracer delivery with regard to their reflection of glucose metabolism or CBF have been limited. Ottoy et al. demonstrated good cross-sectional agreement among relative flow measures computed from 1-min 15O-H2O, 18F-FDG, and 18F-FBP-PET, with the 0–6-min early amyloid frames yielding stronger correlations with 15O-H2O compared to FBP-R1 in most regions. 28 We found minimal differences between the EA and R1 estimates with regard to their correlations with rCBF. However, the intraclass correlation coefficients accounting for overall longitudinal decline that we reported for PiB-R1 were higher than the ICCs of rCBF computed from 15O-H2O-PET and of PiB-EA. This suggests that PiB-R1 is a more reliable measure, which is an important consideration, especially for longitudinal studies. The low-to-moderate ICCs of rCBF measures may in part explain the low correlations we observed for longitudinal rates of change between rCBF- and PiB-based measures.
We found similar associations with age and time for each of the three PET measures in the AD metabolic signature meta-ROI. This finding confirmed that each PET measure can capture age-related cross-sectional associations as well as longitudinal declines. Gietl et al. found negative associations between age and early PiB frames in the hippocampus, as well as negative age associations in frontal, temporal, and parietal GM regions among amyloid+ cognitively normal and mild cognitively impaired individuals. 39
Given that the correlations between rCBF and PiB-based measures were not perfect, we would expect to find some differences in statistical inference using different PET measurements. This was indeed the case for the analyses we conducted using the meta-ROI measures in relation to their associations with amyloid status and sex. We found that rCBF and R1 were lower among amyloid+ individuals, but this effect was not statistically significant for EA. Given the weak positive correlation between PiB-EA and PiB-DVR among amyloid+ individuals, it is possible that amyloid-binding signal is present to an extent in the EA measurements, which could explain the lack of a statistically significant amyloid status association for EA. Similar to our study, the study by Gietl et al. did not find associations between early PiB frames and amyloid positivity. 39 Another study including individuals with dementia due to AD, as well as cognitively normal and mild cognitively impaired individuals, reported lower early PiB frame measures only in posterior cingulate and parietal cortices among amyloid+ individuals, whereas FDG-PET demonstrated wide-spread differences in cortical and subcortical GM. 5 The sex effect we observed for the PiB-based measures, but not for rCBF, is harder to explain. This suggests possible differences between cerebral delivery or clearance of PiB and 15O-H2O.
Our study has several limitations. Our previous investigations of partial volume correction on 15O-H2O-PET scans yielded rCBF values with low signal-to-noise ratios due to increased noise, and therefore, we did not use partial volume corrected data. However, given that both our 15O-H2O and PiB-PET scans were acquired on the same scanner, the same scanner point spread function applies, and thus, differences due to partial volume effects should be minimal. We could not evaluate differences in PET measures by clinical diagnosis given our small sample size. We did not investigate different methods for PiB kinetic parameter estimation, which could influence agreement of R1 values with rCBF. We do not obtain arterial input functions given the longitudinal nature of our PET study, and as a result, had to rely on reference region approaches for estimating PET parameters and could not compute absolute delivery parameters K1. A strength of our study was the ability to compare rates of change in rCBF to change in PiB-based surrogate measures, due to the extensive longitudinal PET data available in the BLSA.
Our conclusion that the PiB-R1 kinetic parameter can constitute a surrogate measure of rCBF will be useful for other studies involving dynamic PiB-PET imaging. The longitudinal agreement we observed among these measures indicates that changes in neuronal activity over time can be assessed with longitudinal PiB-PET, without the acquisition of an additional PET scan. Our study demonstrates the value of a dynamic 0–70-min rather than a delayed PiB-PET acquisition. A better understanding of longitudinal changes in neuronal activity will help assess disease risk factors, identify protective mechanisms, and enable better predictors of cognitive progression.
In conclusion, the relative delivery parameter R1 computed from dynamic PiB-PET can serve as a reasonable surrogate of relative regional cerebral blood flow computed from 15O-H2O-PET. We found a moderate level of cross-sectional agreement between PiB-R1 and rCBF, and a low-to-moderate level of agreement in longitudinal rates of change. Both PET measures exhibited similar age and amyloid status associations cross-sectionally and showed marked longitudinal declines. The higher longitudinal stability of PiB-R1 compared to rCBF is an important property for longitudinal studies. Our results demonstrate that dynamic PiB-PET scans can provide a measure of neuronal activity in addition to amyloid burden. This dual-imaging property may obviate the need to acquire a 15O-H2O or 18F-FDG-PET scan, thereby reducing patient burden, radioactivity exposure, and cost.
Supplemental Material
Supplemental material for Longitudinal evaluation of surrogates of regional cerebral blood flow computed from dynamic amyloid PET imaging
Supplemental Material for Longitudinal evaluation of surrogates of regional cerebral blood flow computed from dynamic amyloid PET imaging by Murat Bilgel, Lori Beason-Held, Yang An, Yun Zhou, Dean F Wong and Susan M Resnick in Journal of Cerebral Blood Flow & Metabolism
Footnotes
Acknowledgments
We thank the BLSA participants, BLSA staff, and the JHU PET facility faculty and staff for their assistance and dedication to these studies.
Authors’ contributions
MB conceived the study concept and design, analysis and interpretation of data, and drafting of manuscript; LB-H and YZ were involved in the revision of manuscript for intellectual content; YA took part in analysis and interpretation of data, and revision of manuscript for intellectual content; DFW was involved in the study design and data acquisition supervision, revision of manuscript for intellectual content; SMR took part in the study concept and design, oversight of data acquisition, interpretation of data, revision of manuscript for intellectual content.
Funding
The author(s) disclosed receipt of the following financial support for the research, authorship, and/or publication of this article: The Federal Ministry of Education and Research (BMBF), Center for Stroke-research Berlin (CSB) and by grants from the Deutsche Forschungsgemeinschaft (DFG: VA 244/10-1) FOR 2325 NVI.
Declaration of conflicting interests
The author(s) declared the following potential conflicts of interest with respect to the research, authorship, and/or publication of this article: This study was supported by the Intramural Research Program of the NIA, NIH. Dr. Wong receives contract funding via JHU from AVID/Lilly, Roche Neuroscience, Lundbeck and Five Eleven Pharma, and NIH.
References
Supplementary Material
Please find the following supplemental material available below.
For Open Access articles published under a Creative Commons License, all supplemental material carries the same license as the article it is associated with.
For non-Open Access articles published, all supplemental material carries a non-exclusive license, and permission requests for re-use of supplemental material or any part of supplemental material shall be sent directly to the copyright owner as specified in the copyright notice associated with the article.